Antagonism of PP2A is an independent and conserved function of HIV-1 Vif and causes cell cycle arrest
- Department of Medicine, University of Cambridge, United Kingdom
- Cambridge Institute of Therapeutic Immunology and Infectious Disease (CITIID), University of Cambridge, United Kingdom
- Department of Clinical Neuroscience, University of Cambridge, United Kingdom
- Cambridge Institute for Medical Research (CIMR), University of Cambridge, United Kingdom
Figures
Figure 1 with 4 supplements
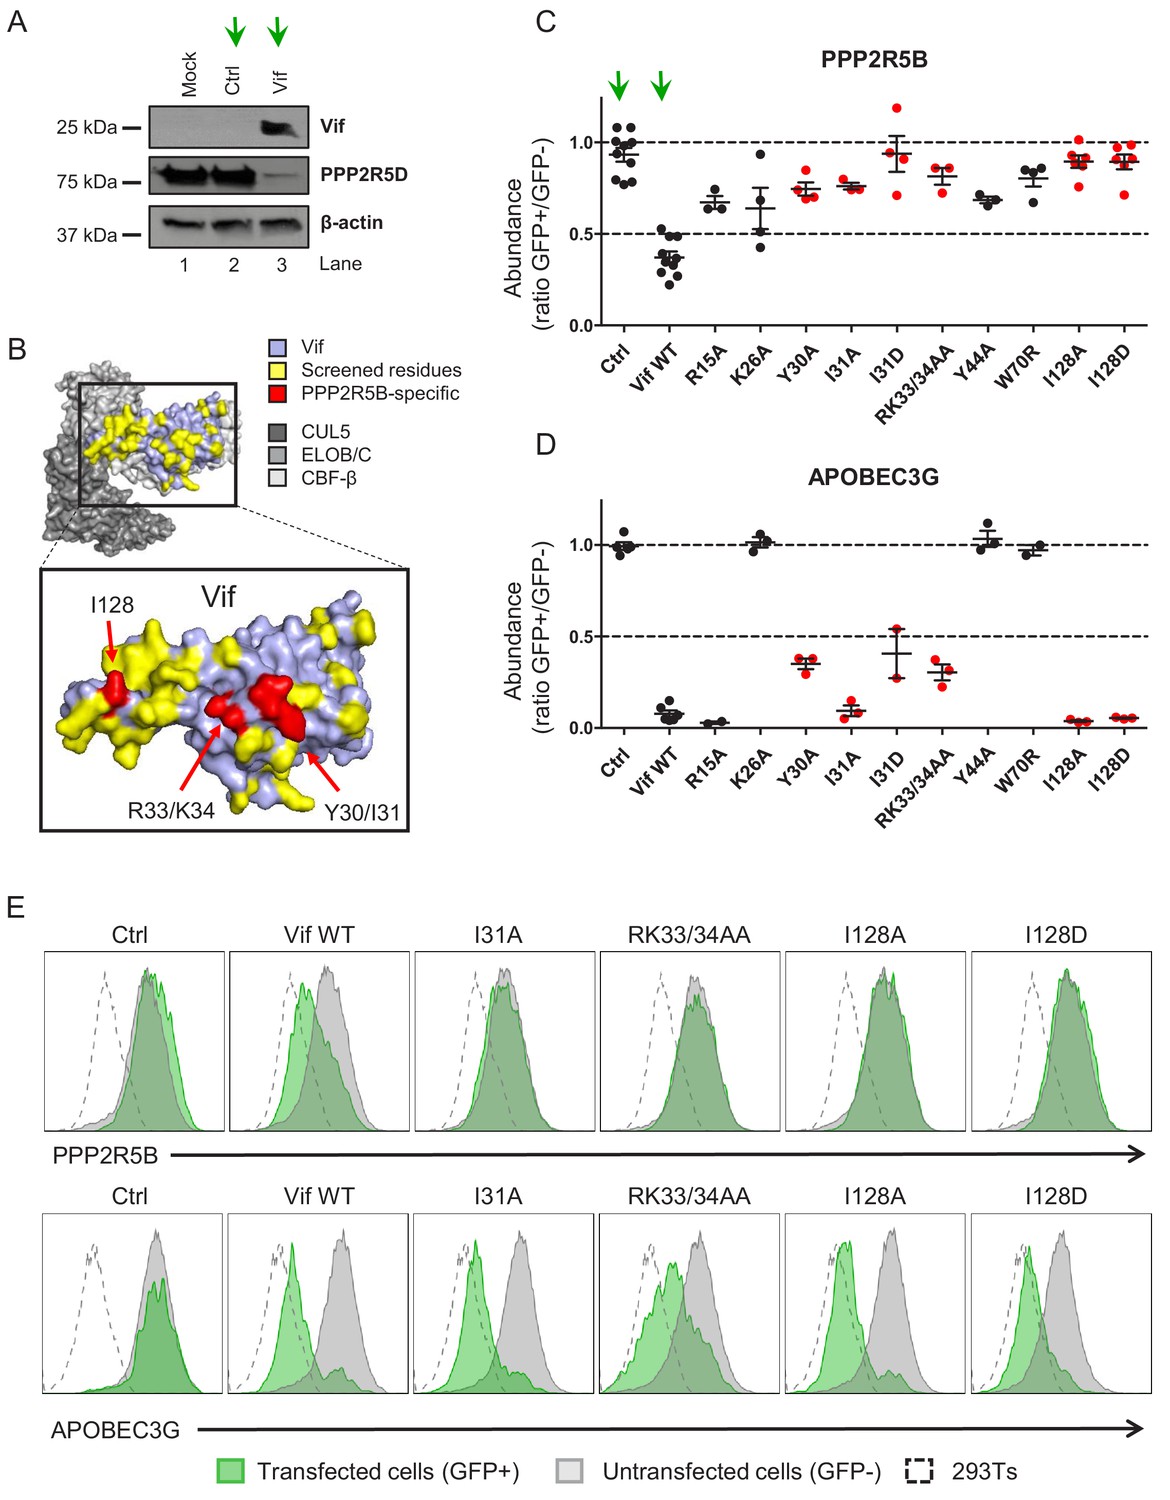
Flow cytometric screen of HIV-1 Vif point mutants.
(A) Depletion of endogenous PPP2R5D by HIV-1 Vif. CEM-T4s were transduced with lentiviruses encoding either EGFP-SBP-ΔLNGFR (Ctrl) or EGFP-P2A-Vif (Vif) at an MOI of 3, then lysed in 2% SDS and analysed by immunoblot with anti-Vif, anti-PPP2R5D and anti-β-actin (loading control) antibodies after 48 hr. Green arrows, Ctrl vs Vif. (B) Solvent-accessible surfaces of Vif (pale blue) in complex with CUL5 (dark grey), ELOB/C (grey) and CBF-β (light grey). Residues highlighted in yellow were targeted in our library of point mutants (total 34). Residues highlighted in red specifically affected the depletion of PPP2R5B, but not APOBEC3G. (C–D) Depletion of PPP2R5B (C) or APOBEC3G (D) by selected Vif point mutants. 293Ts stably expressing HA-tagged PPP2R5B or APOBEC3G were transfected with constructs encoding EGFP-P2A-Vif, then fixed/permeabilised, stained with AF647-conjugated anti-HA antibody and analysed by flow cytometry after 36 hr (see Figure 1—figure supplement 1B–C). For each Vif point mutant, abundance of PPP2R5B or APOBEC3G is shown as a ratio of A4647 fluorescence in GFP+ (transfected, Vif+) to GFP- (untransfected, Vif-) cells, after deducting background fluorescence of control 293Ts (no HA-tagged protein expression). Individual data points represent biological replicates (minimum 3). Mean values with standard error of the mean (SEM) are indicated. Vif point mutants specifically affecting the depletion of PPP2R5B are highlighted in red. Ctrl, control constructs encoding EGFP or EGFP-SBP-ΔLNGFR. Data for other Vif point mutants are shown in Figure 1—figure supplement 2A–B. Green arrows, Ctrl vs Vif WT. (E) Representative data from (C–D). Green, GFP+, transfected cells (Vif+); grey, GFP-, untransfected cells (Vif-); dotted line, background staining of control 293Ts (no HA-tagged protein expression).
Figure 1—figure supplement 1
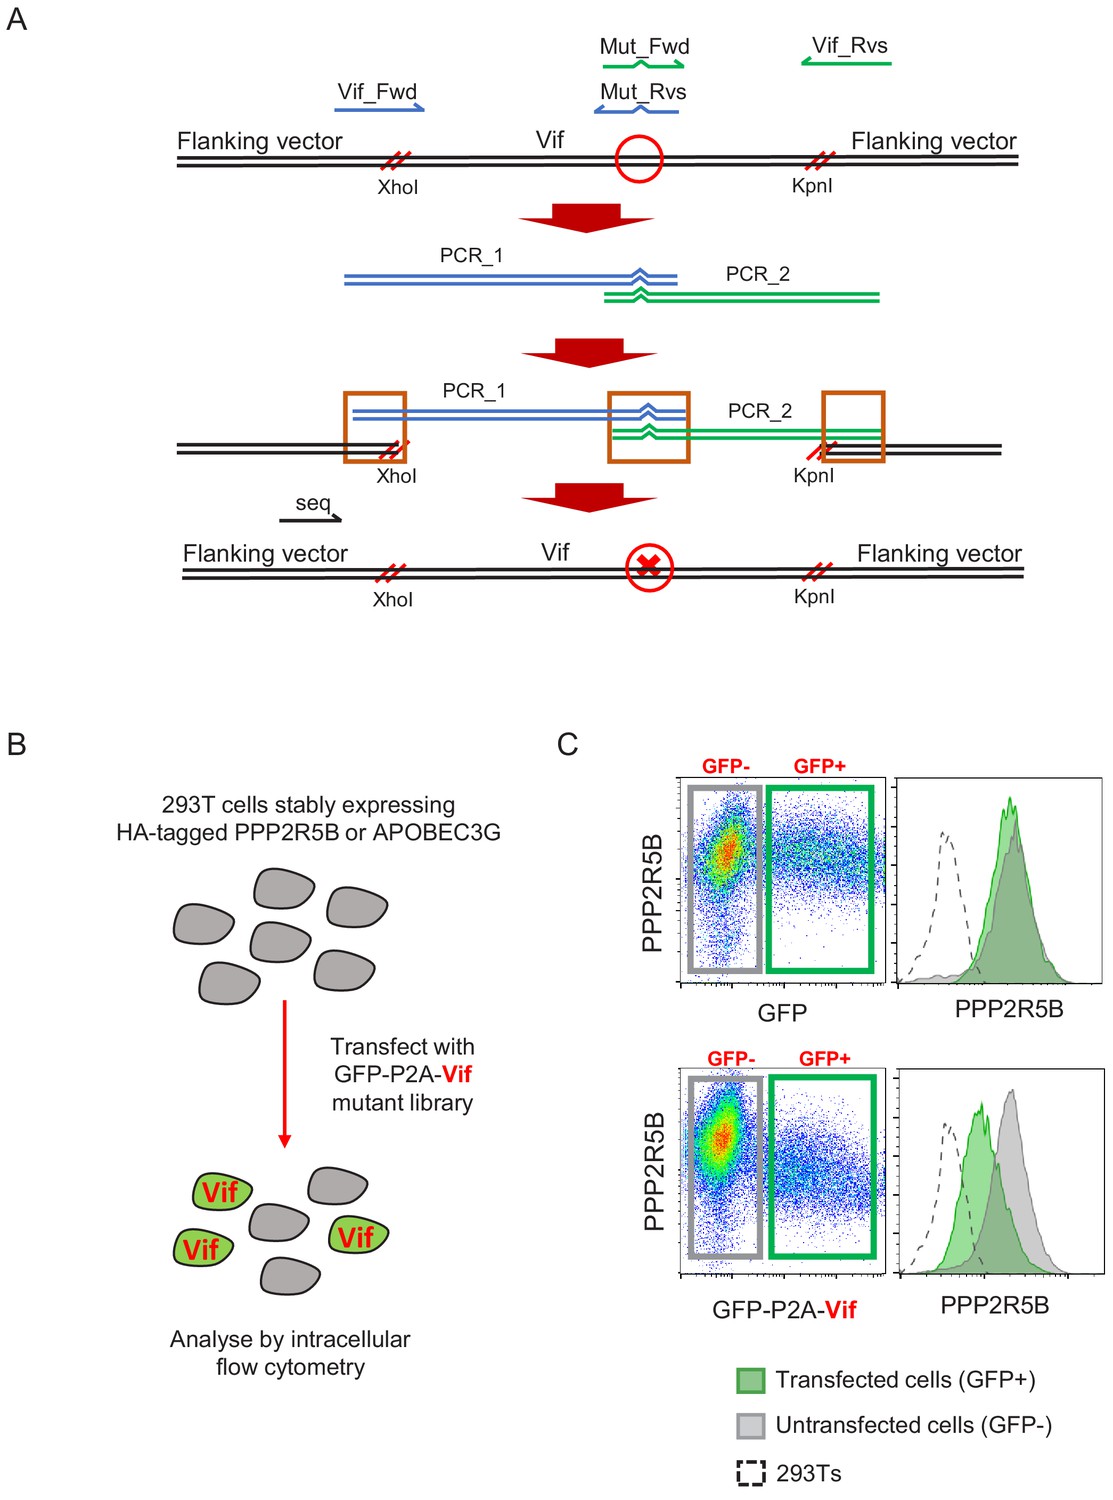
Further details for site-directed mutagenesis and flow cytometric screen.
(A) Overview of PCR and Gibson assembly-based approach to site-directed mutagenesis. PCR products are digested with DpnI (1 hr, 37°C) to degrade template. Vector is digested with XhoI and KpnI, gel purified, then assembled with PCR products using the NEBuilder HiFi DNA Assembly Master Mix (1 hr, 50°C) and transformed into competent cells. Mut_Fwd and Mut_Rvs, mutation-specific primers; Vif_Fwd and Vif_Rvs, common primers; seq, sequencing primer; red circle, site of intended mutation; red cross, intended mutation; red parallel lines, cut sites; orange boxes, overlapping sequences. (B) Overview of flow cytometeric screen. 293Ts stably expressing HA-tagged PPP2R5B or APOBEC3G were transfected with constructs encoding EGFP-P2A-Vif, then fixed/permeabilised, stained with AF647-conjugated anti-HA antibody and analysed by flow cytometry after 36 hr. (C) Illustrative data and gating strategy for flow cytometric screen. A4647 fluorescence indicates abundance of PPP2R5B. For each Vif point mutant, A4647 fluorescence is compared between Green, GFP+, transfected cells (Vif+); grey, GFP-, untransfected cells. (Vif-); dotted line, background staining of control 293Ts (no HA-tagged protein expression). Upper panels, control construct encoding EGFP; lower panels, construct encoding EGFP-P2A-Vif (WT).
Figure 1—figure supplement 2
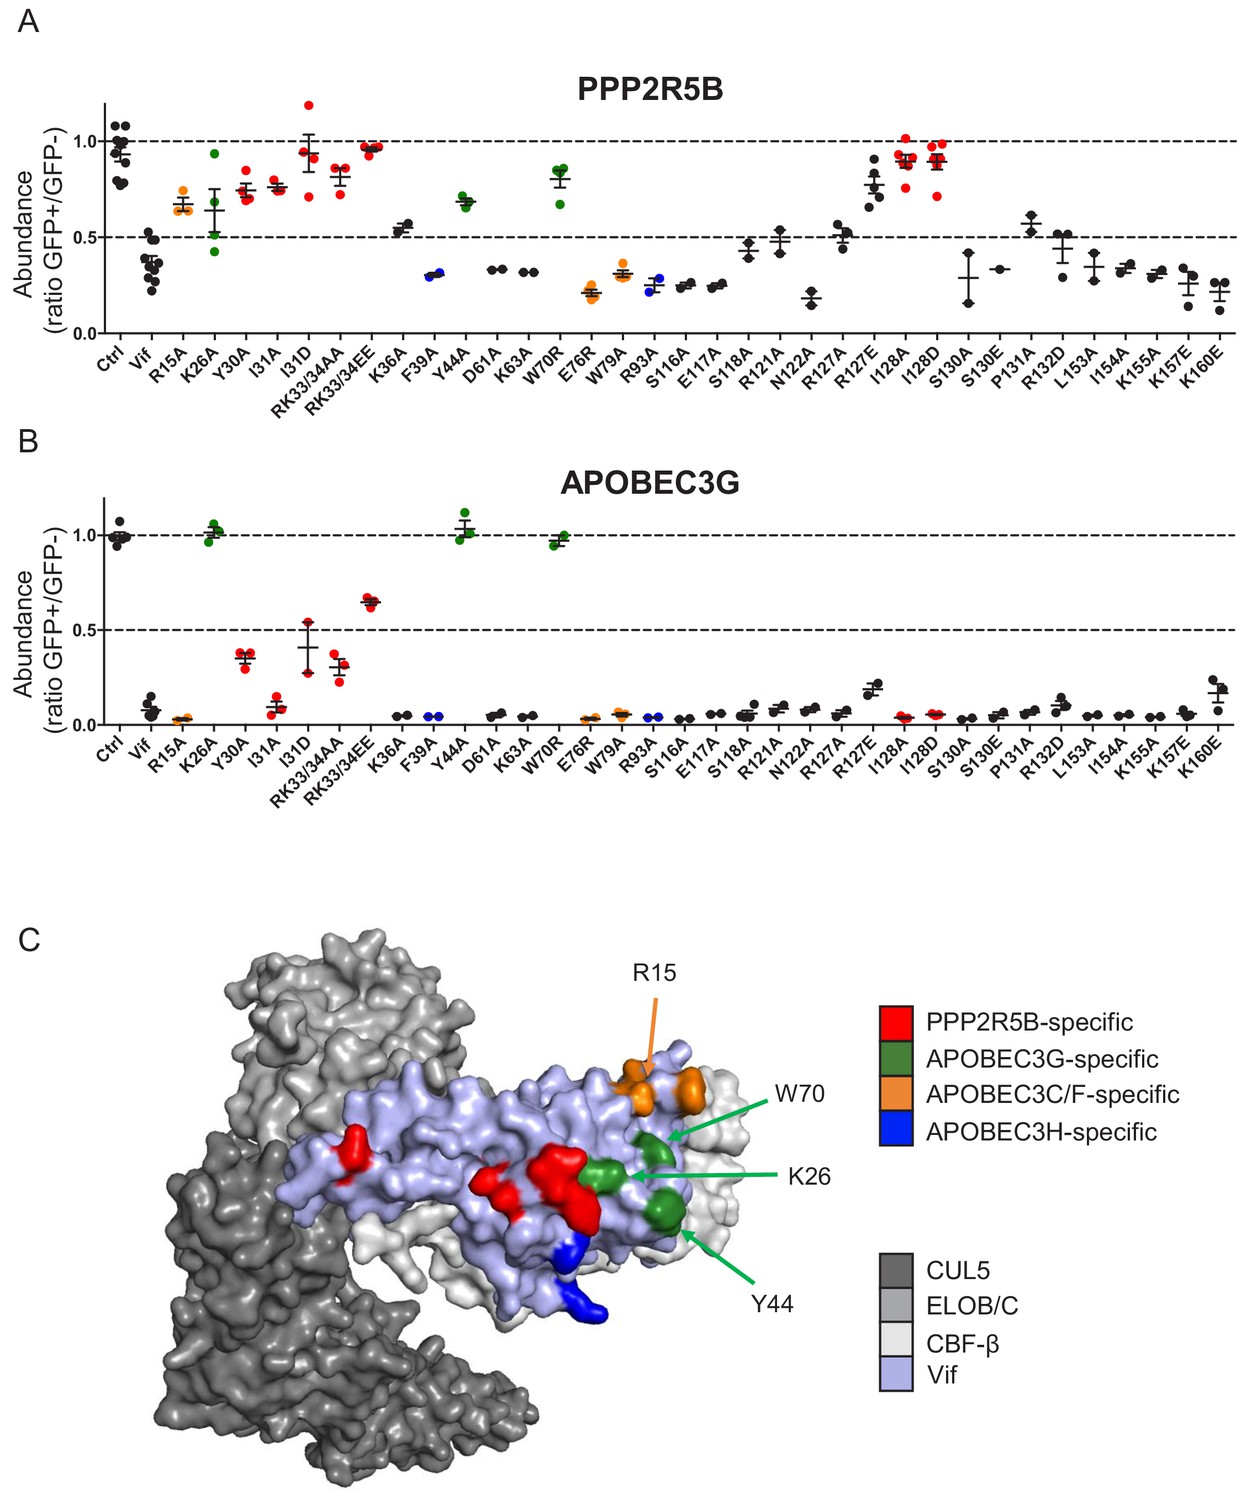
Complete results of flow cytometric screen.
(A–B) Depletion of PPP2R5B (A) or APOBEC3G (B) by all Vif point mutants targeted in our library. 293Ts stably expressing HA-tagged PPP2R5B or APOBEC3G were transfected with constructs encoding EGFP-P2A-Vif, then fixed/permeabilised, stained with AF647-conjugated anti-HA antibody and analysed by flow cytometry after 36 hr (see Figure 1—figure supplement 1B–C). For each Vif point mutant, abundance of PPP2R5B or APOBEC3G is shown as a ratio of A4647 fluorescence in GFP+ (transfected, Vif+) to GFP- (untransfected, Vif-) cells. Individual data points represent biological replicates (minimum 2). Mean values with SEM are indicated. Vif point mutants specifically affecting the depletion of PPP2R5B are highlighted in red (also shown in Figure 1B–D). Other residues included in our screen and known to interact with APOBEC3G (green), APOBEC3C/F (orange) and APOBEC3H (blue) are also indicated (Gaddis et al., 2003; Letko et al., 2015; Nakashima et al., 2016; Ooms et al., 2017). Ctrl, control construct encoding EGFP or EGFP-SBP-ΔLNGFR. (C) Solvent-accessible surfaces of Vif (pale blue) in complex with CUL5 (dark grey), ELOB/C (grey) and CBF-β (light grey). Residues specifically affecting the depletion of PPP2R5B are highlighted in red, together with residues included in our screen and known to interact with APOBEC3G (green), APOBEC3C/F (orange) and APOBEC3H (blue), as per (A–B).
Figure 1—figure supplement 3

Stability of selected Vif point mutants in 293Ts.
293Ts were transfected with constructs encoding EGFP-P2A-Vif, then lysed in 2% SDS and analysed by immunoblot with anti-Vif, anti-GFP (transfection control) and anti-β-actin (loading control) antibodies after 48 hr.
Ctrl, control construct encoding EGFP. Note that EGFP expressed from constructs encoding EGFP-P2A-Vif migrates more slowly because it retains the majority of the P2A peptide as a C-terminal tag.
Figure 1—figure supplement 4
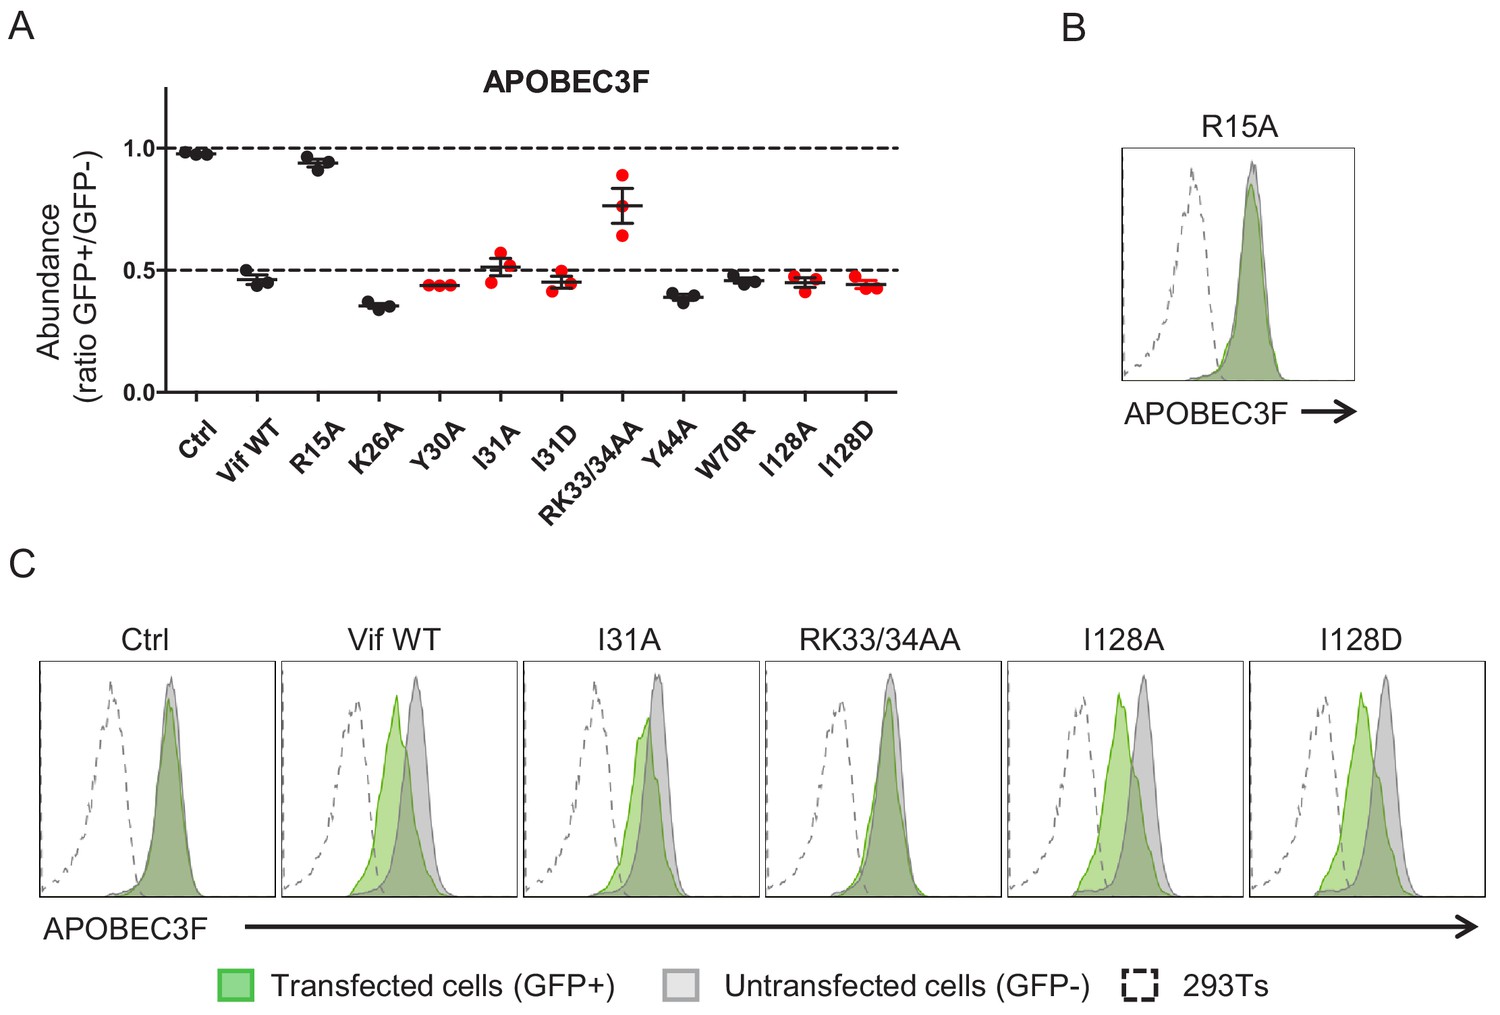
Depletion of APOBEC3F by selected Vif point mutants.
(A) 293Ts stably expressing HA-tagged APOBEC3F were transfected with constructs encoding EGFP-P2A-Vif, then fixed/permeabilised, stained with AF647-conjugated anti-HA antibody and analysed by flow cytometry after 36 hr. For each Vif point mutant, abundance of APOBEC3F is shown as a ratio of A4647 fluorescence in GFP+ (transfected, Vif+) to GFP- (untransfected, Vif-) cells. Individual data points represent three biological replicates. Ctrl, control construct encoding EGFP. All details and Vif point mutants as per Figure 1C–D. (B–C) Representative data from (A). All details and Vif point mutants as per Figure 1E, with a Vif variant encoding R15A (known to be defective for depletion of APOBEC3F) included as an additional control (B).
Figure 2 with 2 supplements
Depletion of endogenous APOBEC3 and PPP2R5 family proteins by HIV-1 Vif point mutants.
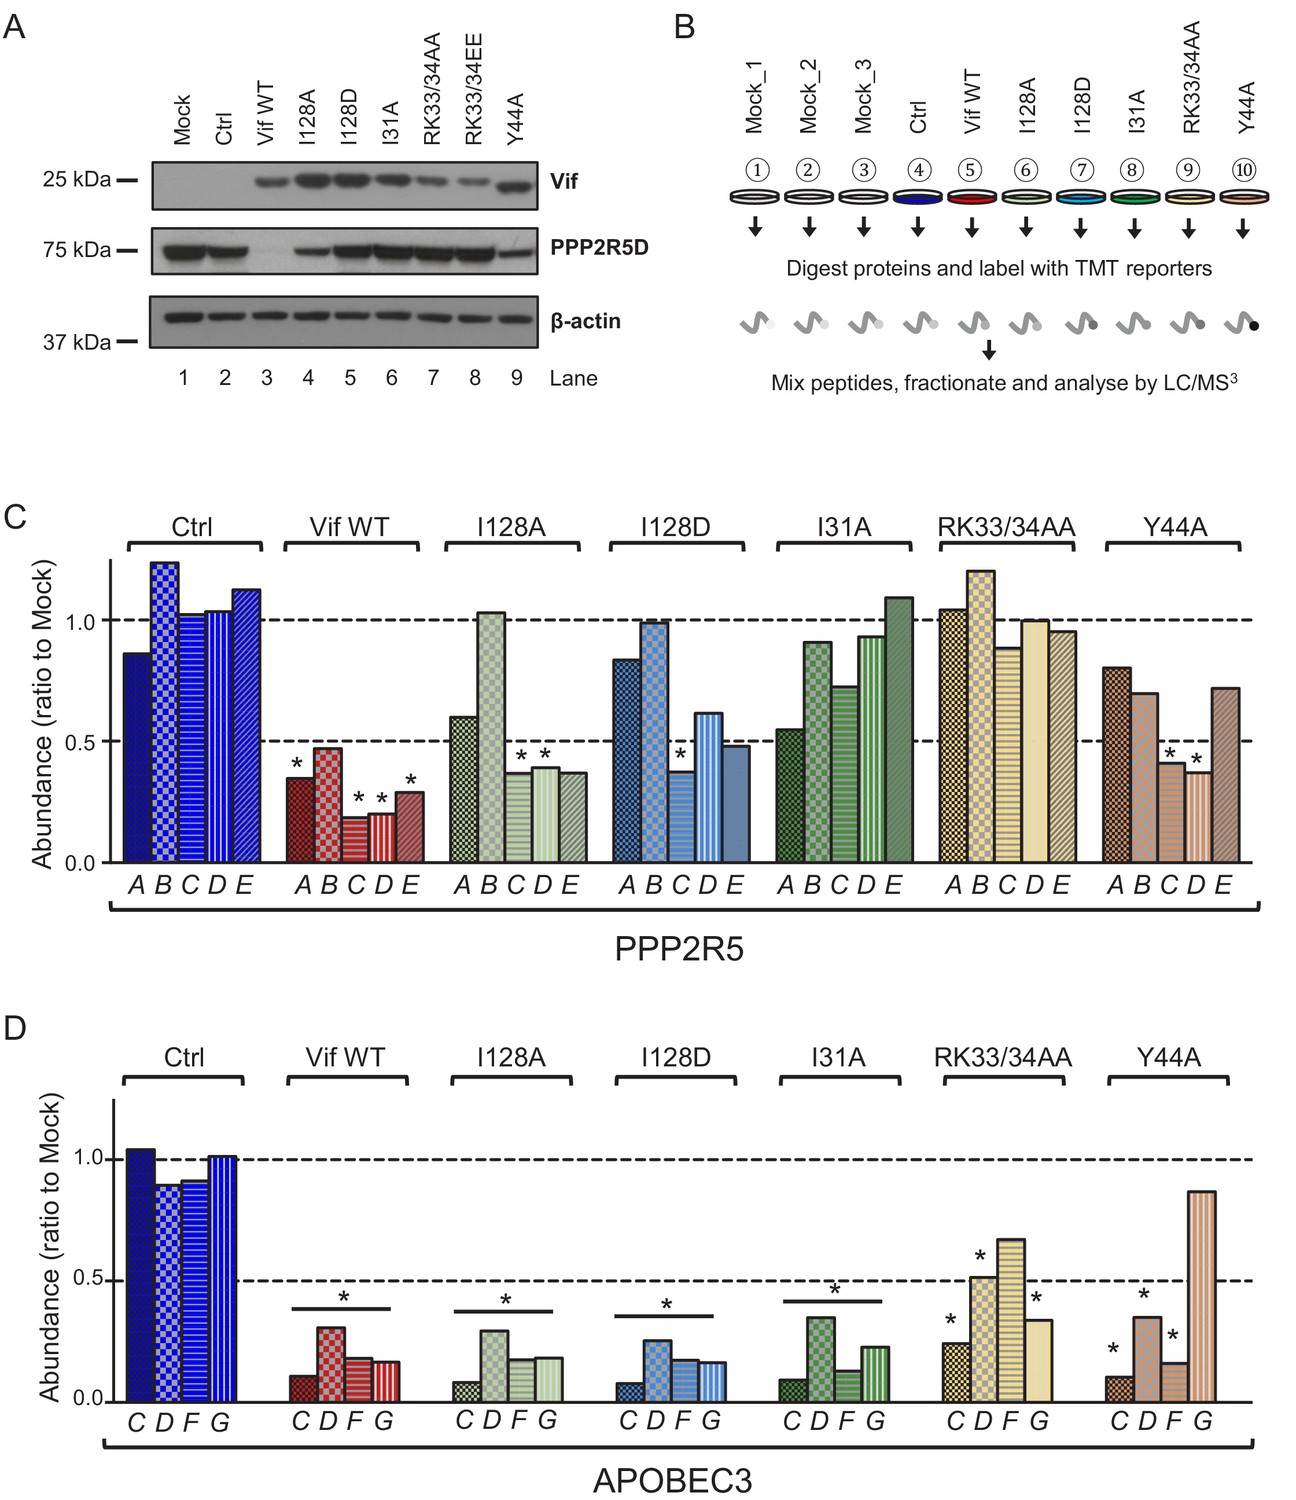
(A) Depletion of endogenous PPP2R5D by selected Vif point mutants. CEM-T4s were transduced with lentiviruses encoding EGFP-P2A-Vif at an MOI of 3, then lysed in 2% SDS and analysed by immunoblot with anti-Vif, anti-PPP2R5D and anti-β-actin (loading control) antibodies after 48 hr. Ctrl, control construct encoding EGFP-SBP-ΔLNGFR. (B) Overview of proteomic experiment 1 (selected Vif point mutants). CEM-T4s were transduced with lentiviruses encoding EGFP-P2A-Vif at an MOI of 3, then analysed by TMT-based quantitative proteomics after 48 hr. Mock_1/2/3, biological replicates. Ctrl, control construct encoding EGFP-SBP-ΔLNGFR. (C–D) Depletion of endogenous PPP2R5 family (C) or APOBEC3 family (D) proteins by selected Vif point mutants in cells from (B). For each Vif point mutant, abundance of respective PPP2R5 or APOBEC family members is shown as a ratio to the mean abundance of the same family member in the three mock-transduced samples. Significant outliers from the distribution of abundances in mock-transduced samples are highlighted (see Materials and methods and Figure 2—figure supplement 2 for further details). *p<0.05.
-
Figure 2—source data 1
Complete data from proteomic experiment 1 (selected Vif point mutants).
Complete dataset (unfiltered) from TMT-based quantitative proteomic experiment illustrated in Figure 2B. For each protein, normalised, unscaled protein abundances, the number of unique peptides used for protein quantitation, and the protein FDR confidence are shown.
- https://cdn.elifesciences.org/articles/53036/elife-53036-fig2-data1-v2.xlsx
Figure 2—figure supplement 1
Stability of selected Vif point mutants in CEM-T4s.
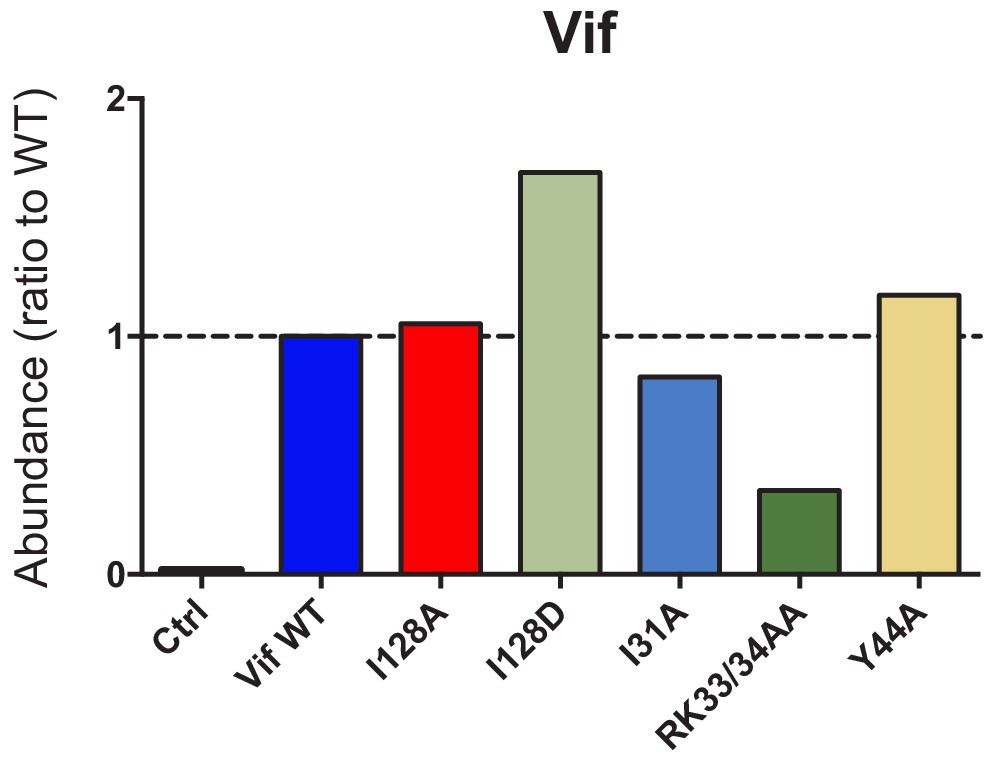
Expression of selected Vif point mutants in cells from proteomic experiment 1 (Figure 2B). For each Vif point mutant, abundance is shown as a ratio to Vif WT.
Figure 2—figure supplement 2
Calculation of t-scores and p-values.
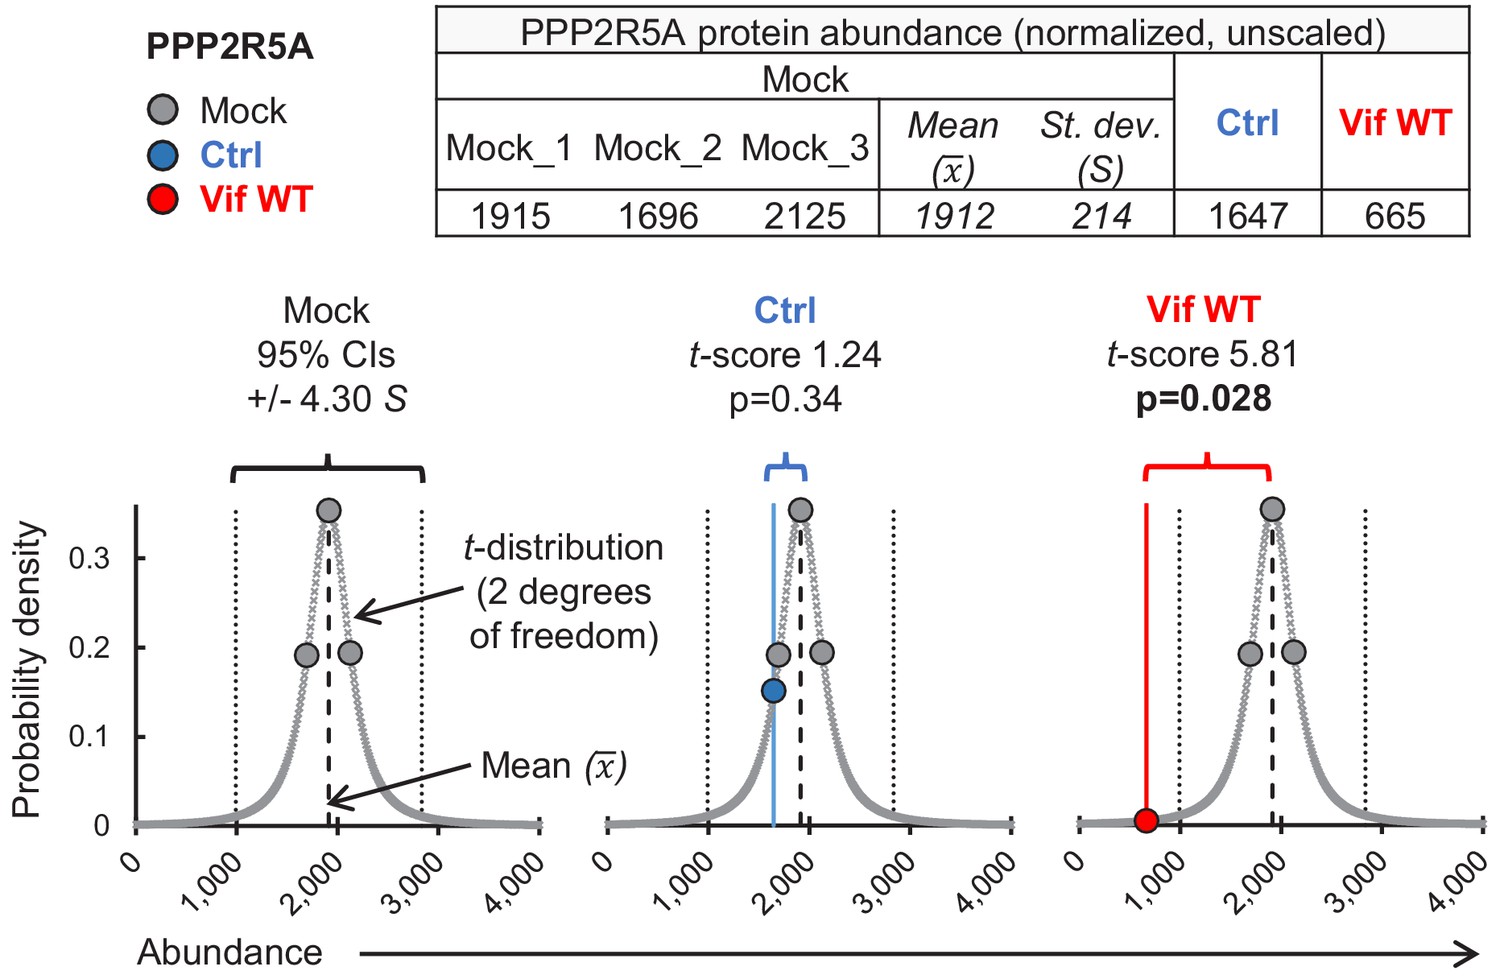
Illustrative t-score/p-value calculations for PPP2R5A in cells transduced with EGFP-SBP-ΔLNGFR (control lentivector) or WT Vif. Graphs show protein abundance (x axis) vs probability density (y axis). A t-distribution (2 degrees of freedom) based on PPP2R5A abundances in mock-transduced cells (3 biological replicates) is shown (grey bell curve). Abundances from mock-transduced cells (grey data points, all panels), cells transduced with EGFP-SBP-ΔLNGFR (Ctrl, blue data point, middle panel) or Vif WT (red data point, right panel) are projected on to the distribution for illustrative purposes. Standard scores (t-scores) indicate distance (number of standards deviations, (S) from the sample mean (). Corresponding two-tailed p-values are shown. Note that for a t-distribution with 2 degrees of freedom, the 95% confidence interval lies within +/- 4.30 standard deviations of the mean, compared with +/- 1.96 standard deviations of the mean for the normal distribution (z-distribution).
Figure 3 with 2 supplements

Regulation of cell cycle by HIV-1 Vif point mutants.
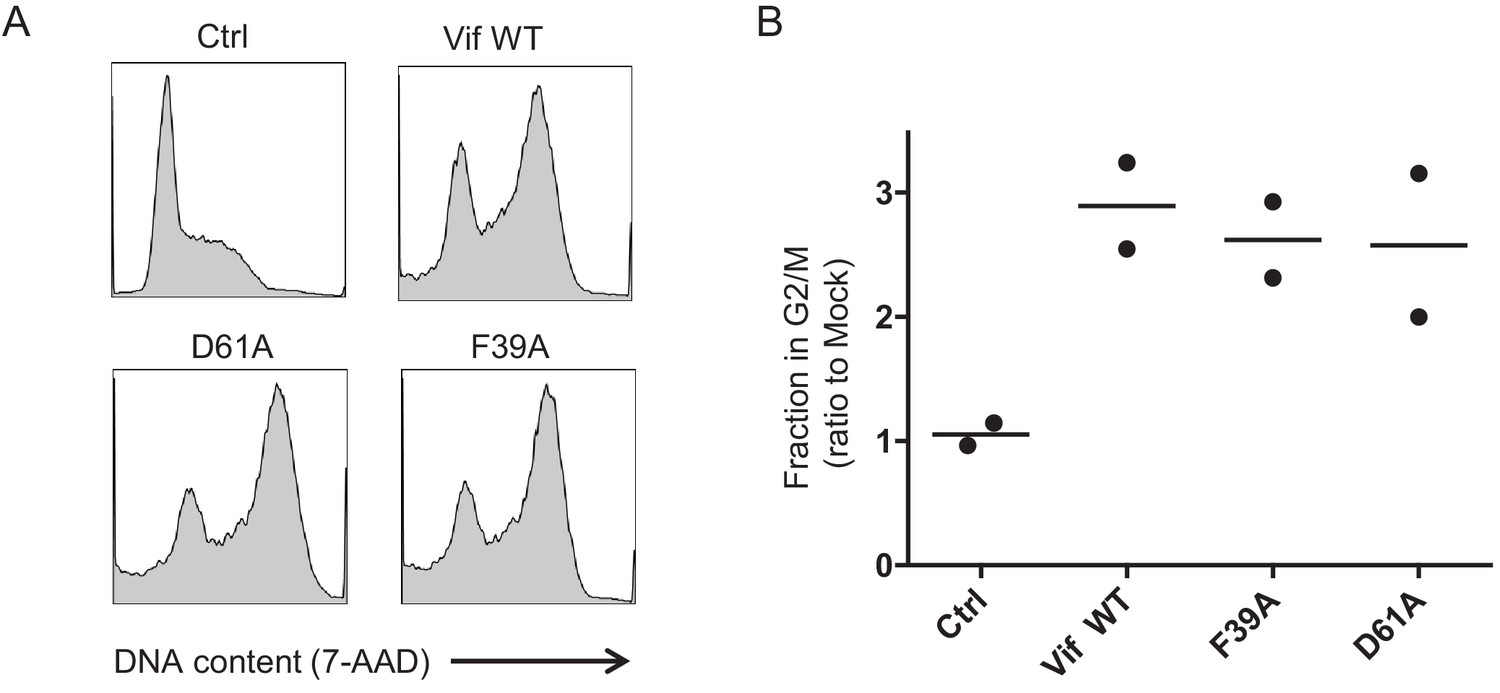
(A) Phosphorylation of aurora kinases in the presence of selected Vif point mutants. CEM-T4s were transduced with lentiviruses encoding EGFP-P2A-Vif at an MOI of 3, then lysed in 2% SDS and analysed by immunoblot with anti-Vif, anti-phospho-AURK, anti-total AURKB and anti-p97 (loading control) antibodies after 48 hr. Ctrl, control construct encoding EGFP-SBP-ΔLNGFR. (B) Regulation of cyclin B1 by selected Vif point mutants in cells from proteomic experiment 1 (Figure 2B). For each Vif point mutant, abundance of cyclin B1 is shown as a ratio to the mean abundance in the three mock-transduced samples. Significant outliers from the distribution of abundances in mock-transduced samples are highlighted (see Materials and methods for details). *p<0.05; **p<0.05. (C–D) Regulation of cell cycle by selected Vif point mutants. CEM-T4s were transduced with lentiviruses encoding EGFP-P2A-Vif at an MOI of 3, then fixed in 90% methanol, stained with 7-AAD and analysed by flow cytometry after 48 hr. Representative data (C) from three biological replicates (D) are shown. For each Vif point mutant, the fraction of cells in G2/M is shown as a ratio to the fraction of cells in G2/M in mock-transduced cells. Individual data points reflect biological replicates. Mean values with SEM are indicated. Significant differences compared with mock-transduced cells are highlighted (t-tests). *p<0.05. Ctrl, control construct encoding EGFP-SBP-ΔLNGFR.
Figure 3—figure supplement 1
Additional controls for cell cycle analysis (Vif point mutants).
(A–B) Regulation of cell cycle by selected Vif point mutants. CEM-T4s were transduced with lentiviruses encoding EGFP-P2A-Vif at an MOI of 3, then fixed in 90% methanol, stained with 7-AAD and analysed by flow cytometry after 48 hr. Representative data (A) from two biological replicates (B) are shown. Mean values are indicated. Ctrl, control construct encoding EGFP-SBP-ΔLNGFR. All other details as per Figure 3C–D.
Figure 3—figure supplement 2
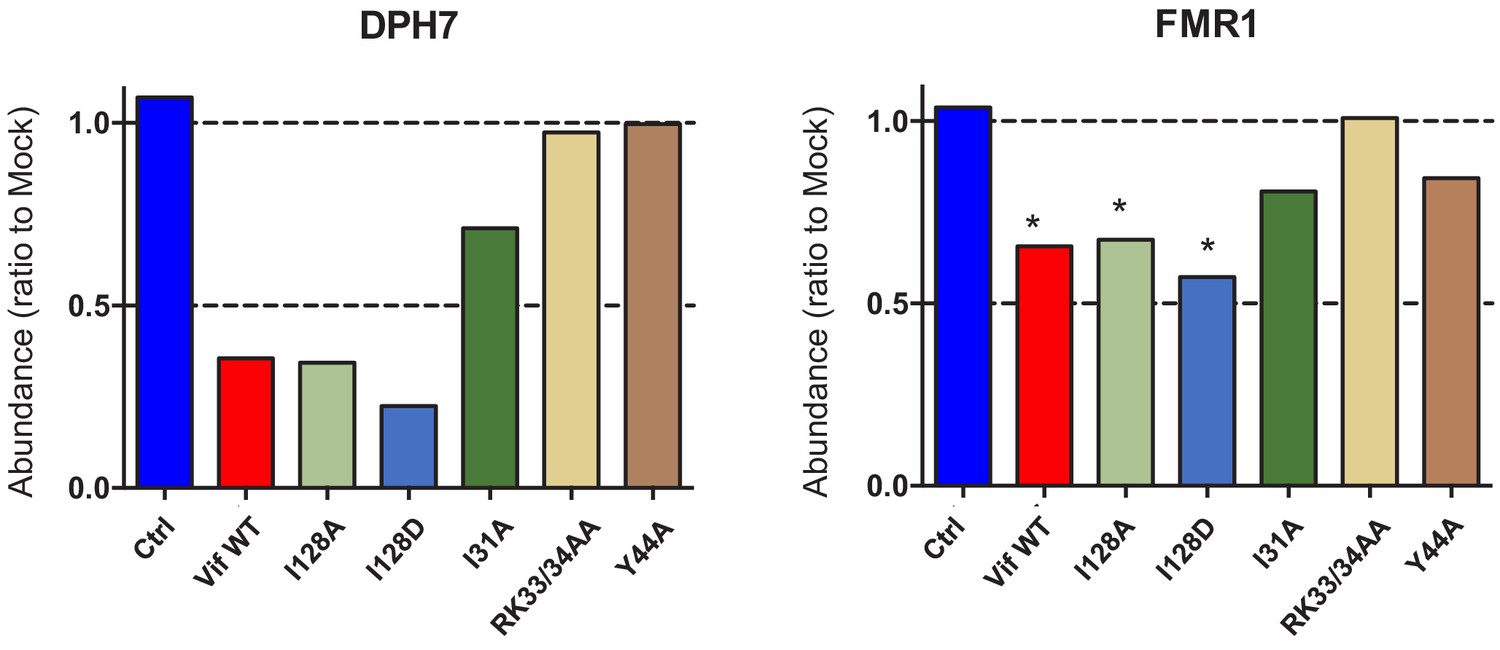
Depletion of endogenous DPH7 and FMR1 by selected Vif point mutants.
(A) Depletion of DPH7 (left panel) and FMR1 (right panel) by selected Vif point mutants in cells from proteomic experiment 1 (Figure 2B). For each Vif point mutant, abundances of DPH7 and FMR1 are shown as a ratio to the mean abundances in the three mock-transduced samples. Significant outliers from the distribution of abundances in mock-transduced samples are highlighted (see Materials and methods for details). *p<0.05.
Figure 4 with 3 supplements

Regulation of cell cycle by depletion of PPP2R5 family subunits.
(A–B) Regulation of cell cycle by individual vs pooled PPP2R5A-E siRNA. HeLas were transfected with the indicated siRNA, then fixed in 90% methanol, stained with 7-AAD and analysed by flow cytometry after 48 hr. Representative data (A) from three biological replicates (B) for each of 2 panels of siRNA are shown. For each condition, the fraction of cells in G2/M is shown as a ratio to the fraction of cells in G2/M in mock-transfected cells. Individual data points reflect biological replicates. Mean values with SEM are indicated. Significant differences compared with mock-transduced cells are highlighted (t-tests). *p<0.05. ***p<0.0005. Ctrl siRNA, MISSION siRNA Universal Negative Control #1. Blue histograms/data points, siRNA panel 1. Red histograms/data points, siRNA panel 2. (C–D) Regulation of cell cycle by combinations of pooled PPP2R5A-E siRNA. HeLas were transfected with the indicated siRNA, then fixed in 90% methanol, stained with 7-AAD and analysed by flow cytometry after 48 hr. Representative data (C) from three biological replicates (D) for each of 2 panels of siRNA are shown. All details as per (A–B).
Figure 4—figure supplement 1
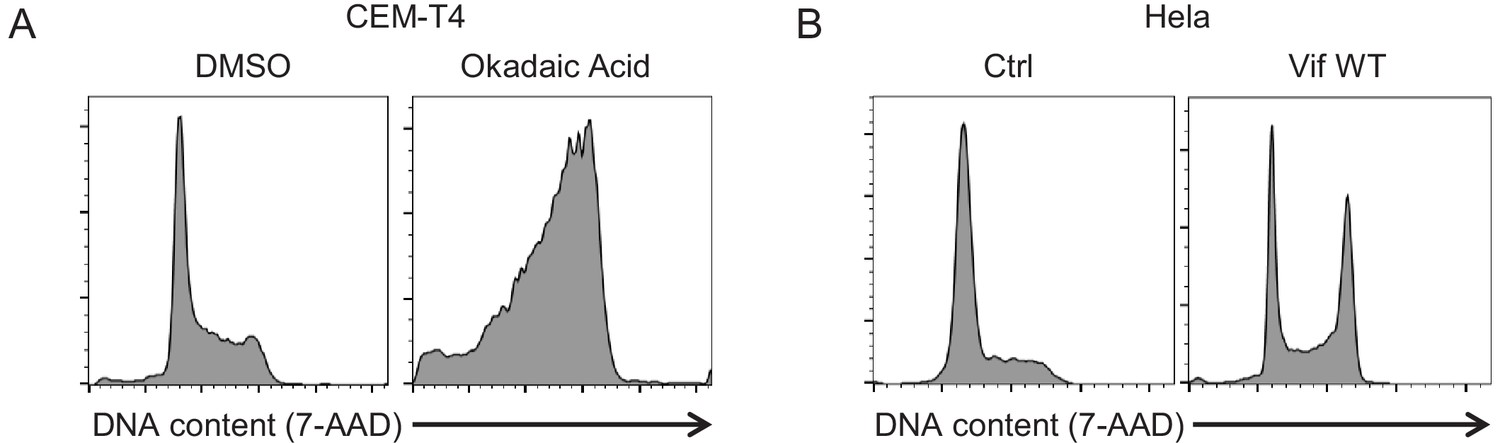
Additional controls for cell cycle analysis (okadaic acid and Vif).
(A) Regulation of cell cycle by PP2A inhibition. CEM-T4s were treated with either 100 nM okadaic acid or DMSO (vehicle) for 16 hr, then fixed in 90% methanol, stained with 7-AAD and analysed by flow cytometry. (B) Regulation of cell cycle in HeLas by Vif. Cells were transduced with GFP-P2A-Vif at an MOI of 3, then fixed in 90% methanol, stained with 7-AAD and analysed by flow cytometry after 48 hr. Ctrl, control construct encoding EGFP.
Figure 4—figure supplement 2
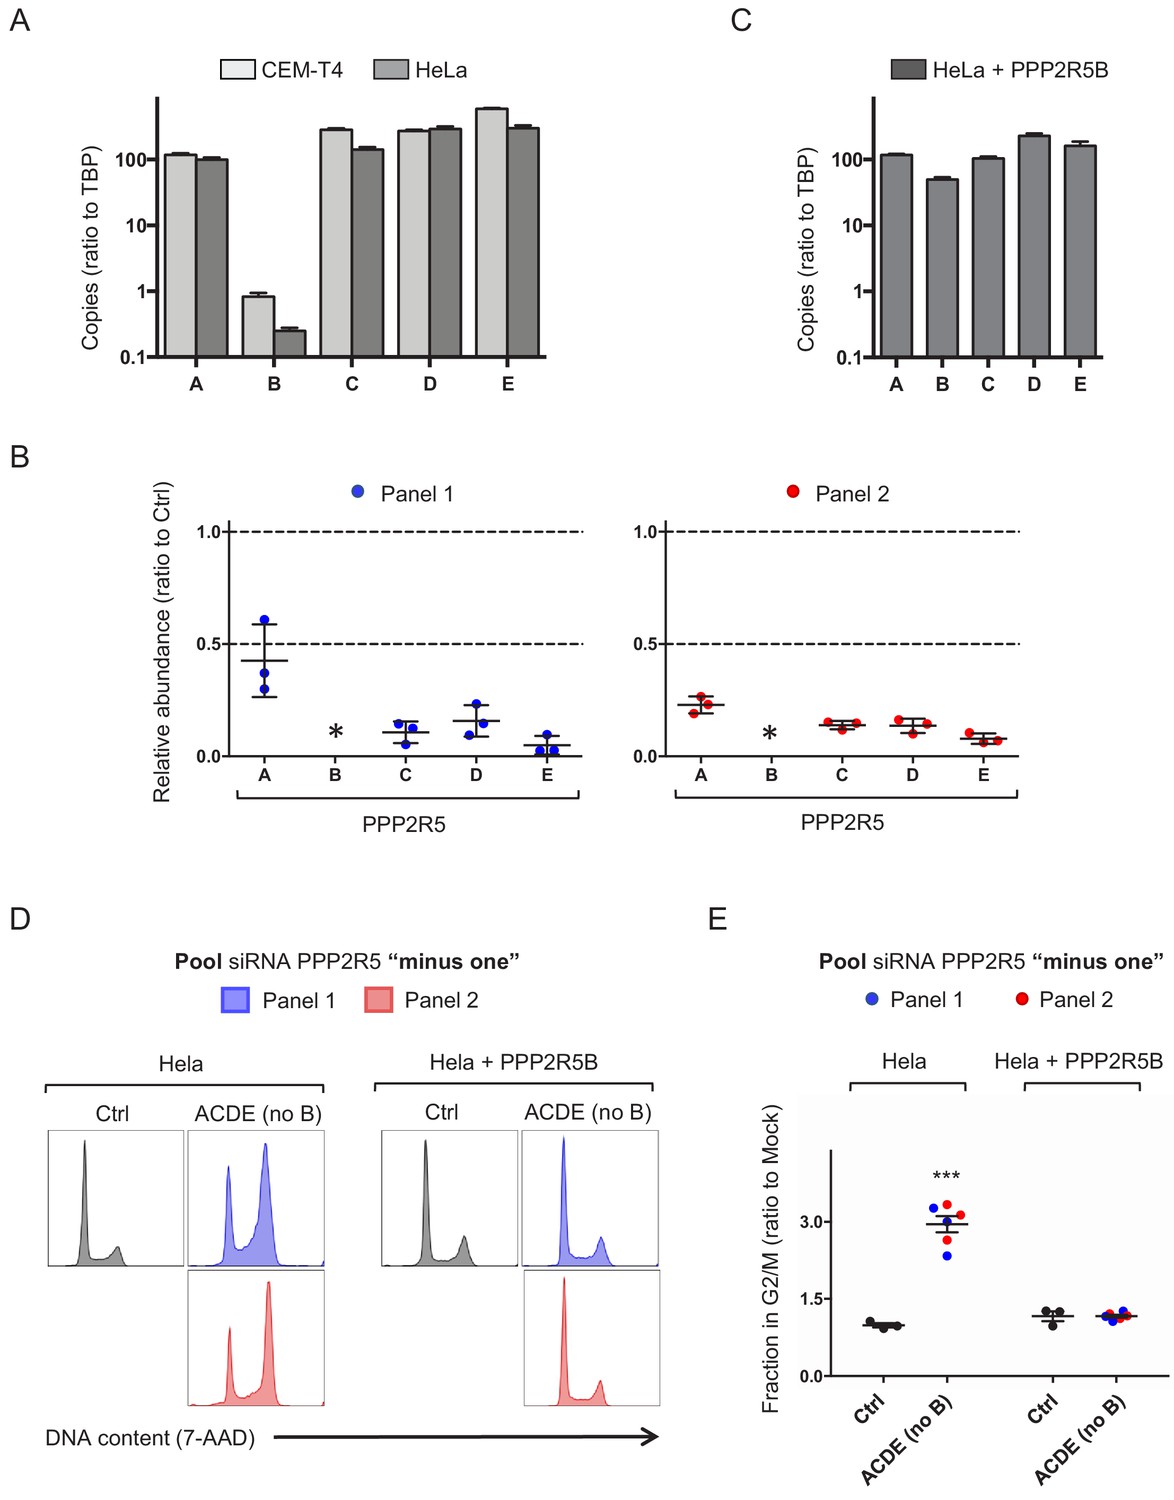
Additional controls for cell cycle analysis (PPP2R5A-E siRNA).
(A) Abundances of PPP2R5A-E transcripts in HeLas and CEM-T4s. Total RNA was analysed by quantitative reverse transcription PCR (qRT-PCR), and mRNA copy numbers expressed relative to Tata Binding Protein (TBP). Mean values with SEM are shown from three biological replicates. (B) Efficiency of PPP2R5A-E knockdown. HeLas were transfected with pooled PPP2R5A-E siRNAs (as per Figure 4), then total RNA analysed by qRT-PCR after 24 hr. For each PPP2R5 family subunit, relative mRNA abundance is shown as a ratio to the abundance in control siRNA-transfected cells (Ctrl). Individual data points represent three biological replicates for each of 2 panels of siRNA. Mean values with SEM are indicated. * Relative abundance of PPP2R5B could not be quantitated because mRNA copy numbers in cells transfected with siRNA were below the linear range of the assay (cycle threshold >35). (C) Abundances of PPP2R5A-E transcripts in HeLas stably expressing exogenous PPP2R5B. Details as per (A). (D–E) Rescue of cell cycle progression by PPP2R5B. HeLas or HeLas stably expressing exogenous PPP2R5B were transfected with Ctrl siRNA or pooled siRNA targeting PPP2R5A, C, D and E (no B), then fixed in 90% methanol, stained with 7-AAD and analysed by flow cytometry after 48 hr. Representative data (D) from three biological replicates (E) for each of 2 panels of siRNA are shown. All details as per Figure 4A–D.
Figure 4—figure supplement 3
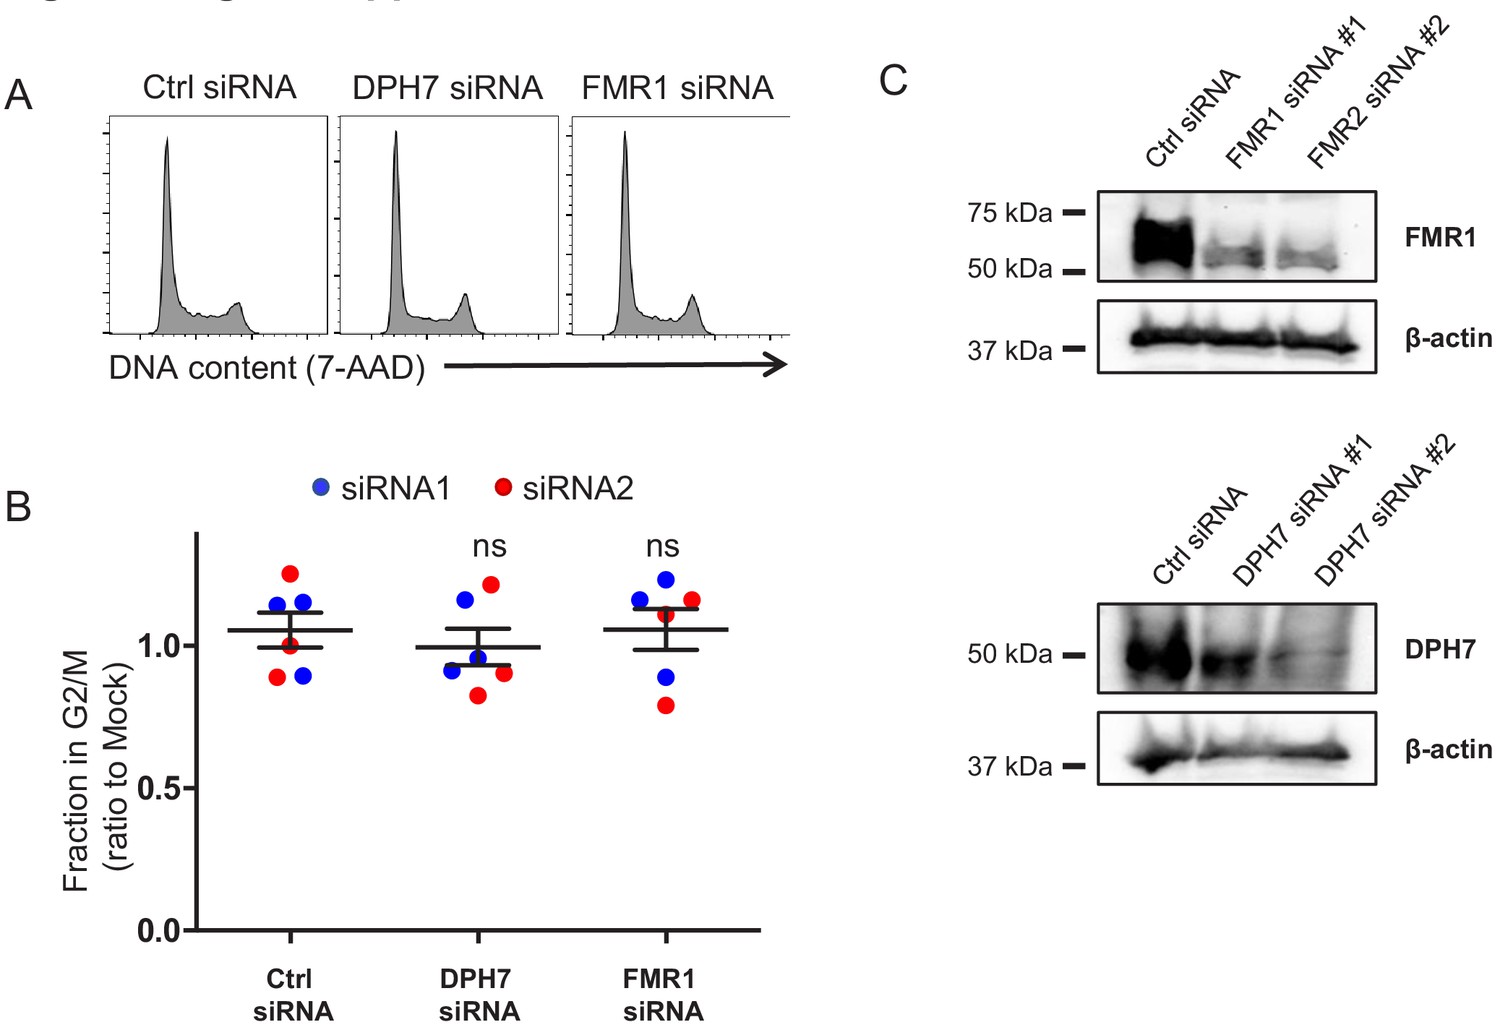
Additional controls for cell cycle analysis (DPH7 and FMR1 siRNA).
(A–B) Regulation of cell cycle by DPH7 and FMR1 siRNA. HeLas were transfected with the indicated siRNA, then fixed in 90% methanol, stained with 7-AAD and analysed by flow cytometry after 48 hr. Representative data (A) from three biological replicates (B) for each of 2 siRNAs are shown. For each condition, the fraction of cells in G2/M is shown as a ratio to the fraction of cells in G2/M in mock-transfected cells. Individual data points reflect biological replicates. Mean values with 95% confidence intervals (CIs) are indicated. Ctrl siRNA, MISSION siRNA Universal Negative Control #1. (C) Efficiency of DPH7 and FMR1 knockdown. Cells from (A–B) were lysed in 2% SDS 24 hr after siRNA transfection and analysed by immunoblot with anti-FMR, anti-DPH7 and anti-β-actin (loading control) antibodies.
Figure 5 with 2 supplements

Analysis of naturally occurring HIV-1 Vif variants.
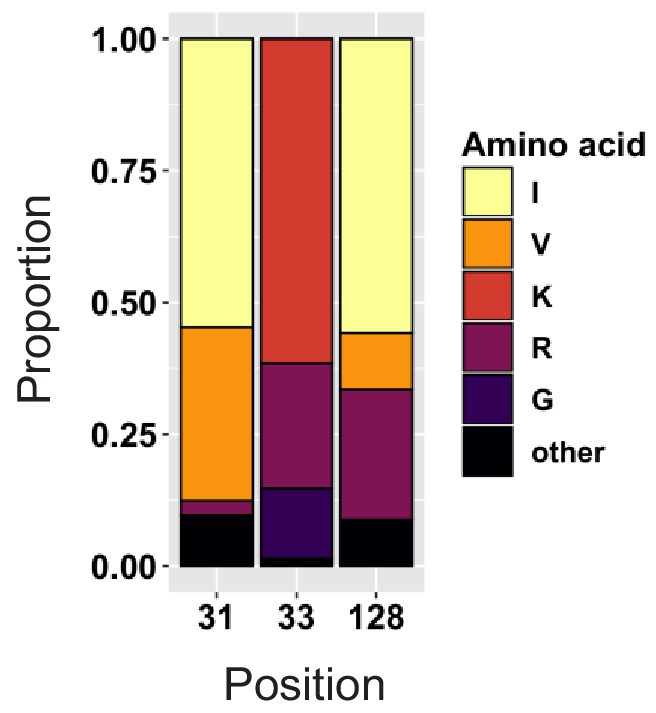
(A) Amino acid polymorphism amongst 2171 naturally occurring HIV-1 M group Vif variants (clade B). Sequence logos (left panel) and bar chart (right panel) highlight frequencies of amino acids corresponding to residues 31, 33 and 128 of NL4-3 Vif. In the sequence logos, polar amino acids (AAs) are depicted in green; neutral AAs, in purple; basic AAs, in blue; acidic AAs, in red; and hydrophobic AAs, in black. An equivalent bar chart for all naturally occurring non-recombinant HIV-1 M group Vif variants (all clades) is shown in Figure 5—figure supplement 1. (B) Depletion of PPP2R5B by selected Vif point mutants. 293Ts stably expressing HA-tagged PPP2R5B were transfected with constructs encoding EGFP-P2A-Vif, then fixed/permeabilised, stained with AF647-conjugated anti-HA antibody and analysed by flow cytometry after 36 hr. Ctrl, control construct encoding EGFP-SBP-ΔLNGFR. All details as per Figure 1C. (C) Sequence alignments of selected Vif variants. Amino acids corresponding to residues 31, 33 and 128 of NL4-3 Vif are highlighted in red (red boxes). Other residues targeted in our library of point mutants and known to interact with APOBEC3G (green), APOBEC3C/F (orange) and APOBEC3H (blue) are also shown (as per Figure 1—figure supplement 2C). Additional annotations (α-helices, β-sheets, Zn finger and BC-box) are based on the published Vif-CUL5 crystal structure (Guo et al., 2014). (D) Depletion of PPP2R5B by selected Vif variants. 293Ts stably expressing HA-tagged PPP2R5B were transfected with constructs encoding EGFP-P2A-Vif, then fixed/permeabilised, stained with AF647-conjugated anti-HA antibody and analysed by flow cytometry after 36 hr. Ctrl, control construct encoding EGFP-SBP-ΔLNGFR. All details as per (B) and Figure 1C.
Figure 5—figure supplement 1
Amino acid polymorphism amongst 3412 naturally occurring non-recombinant HIV-1 M group Vif variants (all clades).
Bar chart highlights frequencies of amino acids corresponding to residues 31, 33 and 128 of NL4-3 Vif.
Figure 5—figure supplement 2

Depletion of APOBEC3G by selected Vif variants.
Depletion of APOBEC3G by selected Vif variants. 293Ts stably expressing HA-tagged APOBEC3G were transfected with constructs encoding EGFP-P2A-Vif, then fixed/permeabilised, stained with AF647-conjugated anti-HA antibody and analysed by flow cytometry after 36 hr. Ctrl, control construct encoding EGFP-SBP-ΔLNGFR. All details as per Figure 1D.
Figure 6 with 3 supplements

Depletion of endogenous APOBEC3 and PPP2R5 family proteins by naturally occurring HIV-1 Vif variants.
(A) Overview of proteomic experiment 2 (naturally occurring Vif variants and corresponding point mutants). CEM-T4s were transduced with lentiviruses encoding EGFP-P2A-Vif at an MOI of 3, then analysed by TMT-based quantitative proteomics after 48 hr. Mock_1/2/3, biological replicates. Ctrl, control construct encoding EGFP. NL4-3 AYR, NL4-3 Vif with both I31A and RI127/128YR mutations. (B–C) Depletion of endogenous PPP2R5 family (B) or APOBEC3 family (C) proteins by naturally occurring Vif variants and corresponding point mutants in cells from (A). For each Vif variant or point mutant, abundance of respective PPP2R5 or APOBEC family members is shown as a ratio to the mean abundance of the same family member in the three mock-transduced samples. Significant outliers from the distribution of abundances in mock-transduced samples are highlighted (see Materials and methods and Figure 2—figure supplement 2 for further details). *p<0.05; **p<0.005. † Not detected in this experiment (PPP2R5B, APOBEC3F). (D) Regulation of cell cycle by naturally occurring Vif variants and corresponding point mutants. CEM-T4s were transduced with lentiviruses encoding EGFP-P2A-Vif at an MOI of 3, then fixed in 90% methanol, stained with 7-AAD and analysed by flow cytometry after 48 hr. Individual data points reflect three biological replicates (representative data, Figure 6—figure supplement 2). **p<0.005. ***p<0.0005. Ctrl, control construct encoding EGFP. NL4-3 AYR, NL4-3 Vif with both I31A and RI127/128YR mutations. All other details as per Figure 3C–D.
-
Figure 6—source data 1
Complete data from proteomic experiment 2 (naturally occurring Vif variants and corresponding point mutants).
Complete dataset (unfiltered) from TMT-based quantitative proteomic experiment illustrated in Figure 6A. For each protein, normalised, unscaled protein abundances, the number of unique peptides used for protein quantitation, and the protein FDR confidence are shown.
- https://cdn.elifesciences.org/articles/53036/elife-53036-fig6-data1-v2.xlsx
Figure 6—figure supplement 1
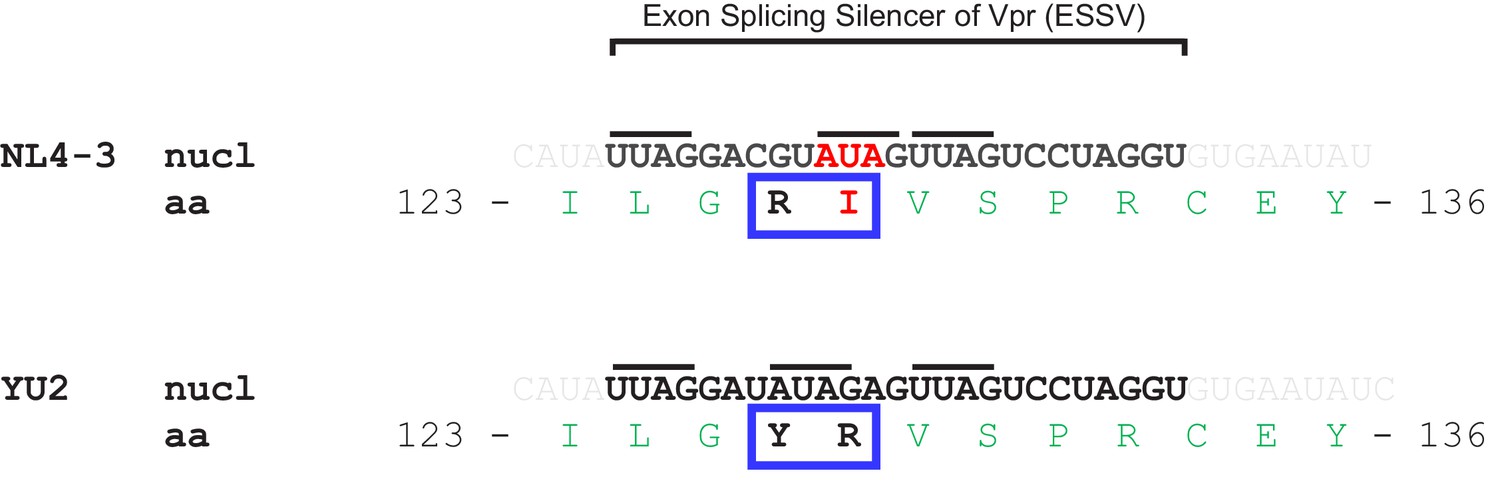
Sequence of Exonic Splicing Silencer of Vpr (ESSV) in NL4-3 and YU2 Vif variants.
The ESSV (highlighted in bold) is a short nucleotide element within the HIV-1 Vif open reading frame (exon 3) required to repress splicing at HIV-1 3’ splice site A2 and allow accumulation of unspliced mRNA, production of Gag and HIV viral replication (Madsen and Stoltzfus, 2005). Inhibitory activity is dependent on three (Py/A)UAG motifs (indicated with black lines). Introduction of an isolated I128R mutation into NL4-3 Vif would disrupt the second (Py/A)UAG motif. Conversely, simultaneous introduction of an R127Y mutation (as in YU2 Vif) maintains three (Py/A)UAG motifs. Note that the nucleotide (nucl) and amino acid (aa) sequences flanking these positions is otherwise conserved between NL4-3 and YU2 viruses.
Figure 6—figure supplement 2
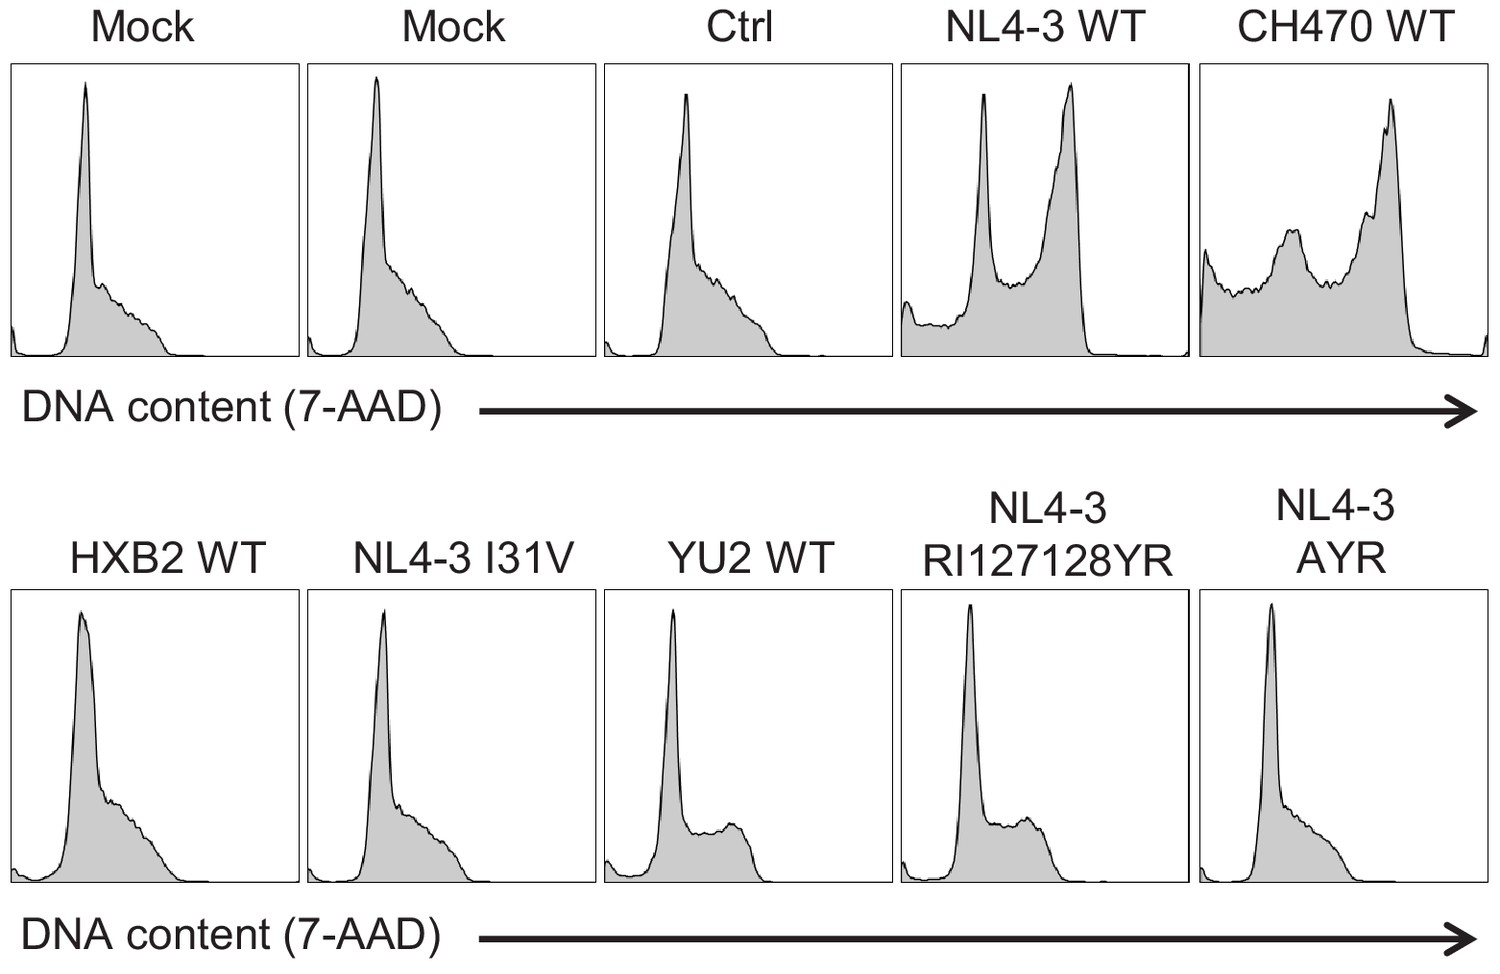
Regulation of cell cycle by naturally occurring Vif variants and corresponding point mutants (representative data).
CEM-T4s were transduced with lentiviruses encoding EGFP-P2A-Vif at an MOI of 3, then fixed in 90% methanol, stained with 7-AAD and analysed by flow cytometry after 48 hr. Representative data from Figure 6D.
Figure 6—figure supplement 3
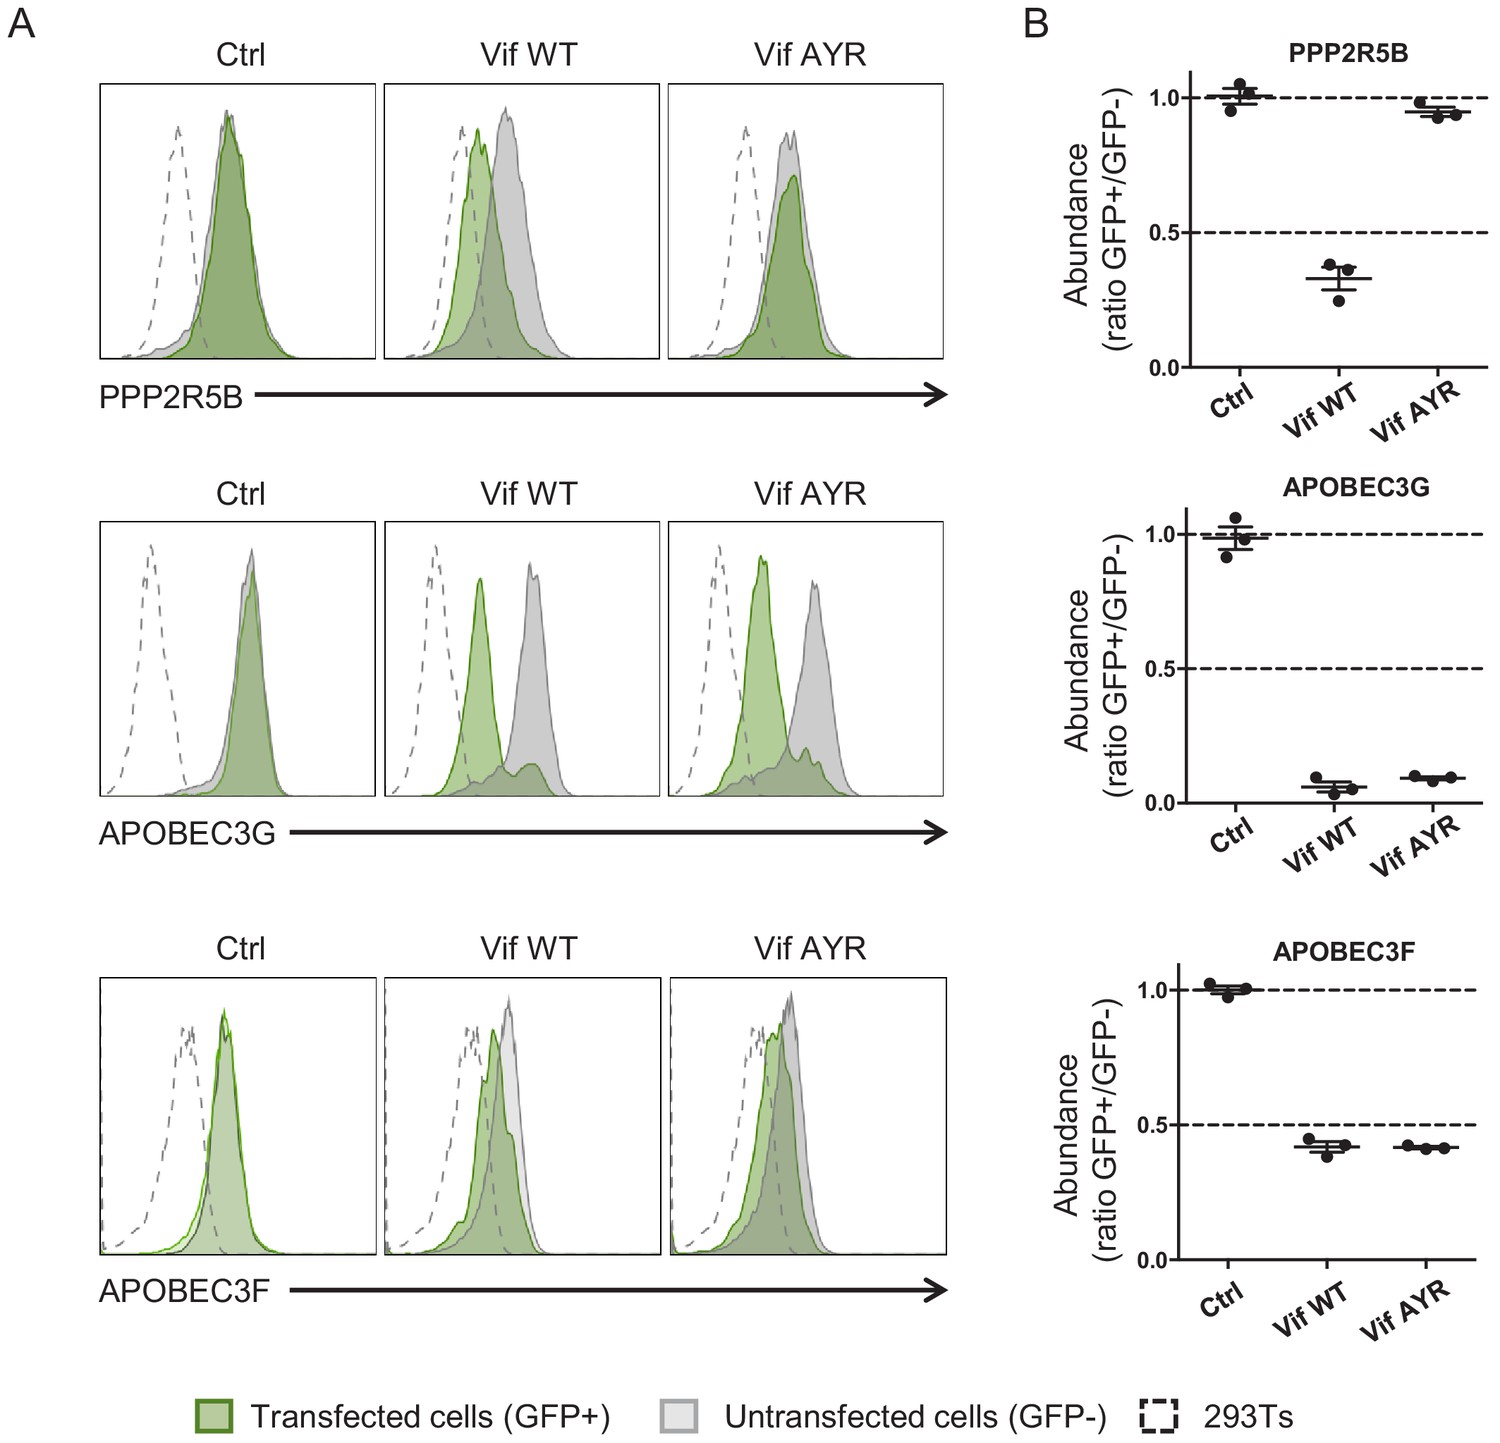
Depletion of PPP2R5B, APOBEC3G and APOBEC3F by Vif AYR.
(A–B) 293Ts stably expressing HA-tagged PPP2R5B, APOBEC3G or APOBEC3F were transfected with constructs encoding EGFP-P2A-Vif, then fixed/permeabilised, stained with AF647-conjugated anti-HA antibody and analysed by flow cytometry after 36 hr. Representative data (A) from three biological replicates (B) are shown. Ctrl, control construct encoding EGFP. All details as per Figure 1C–D.
Figure 7 with 4 supplements
Selective regulation of PPP2R5 family subunits during HIV-1 infection.
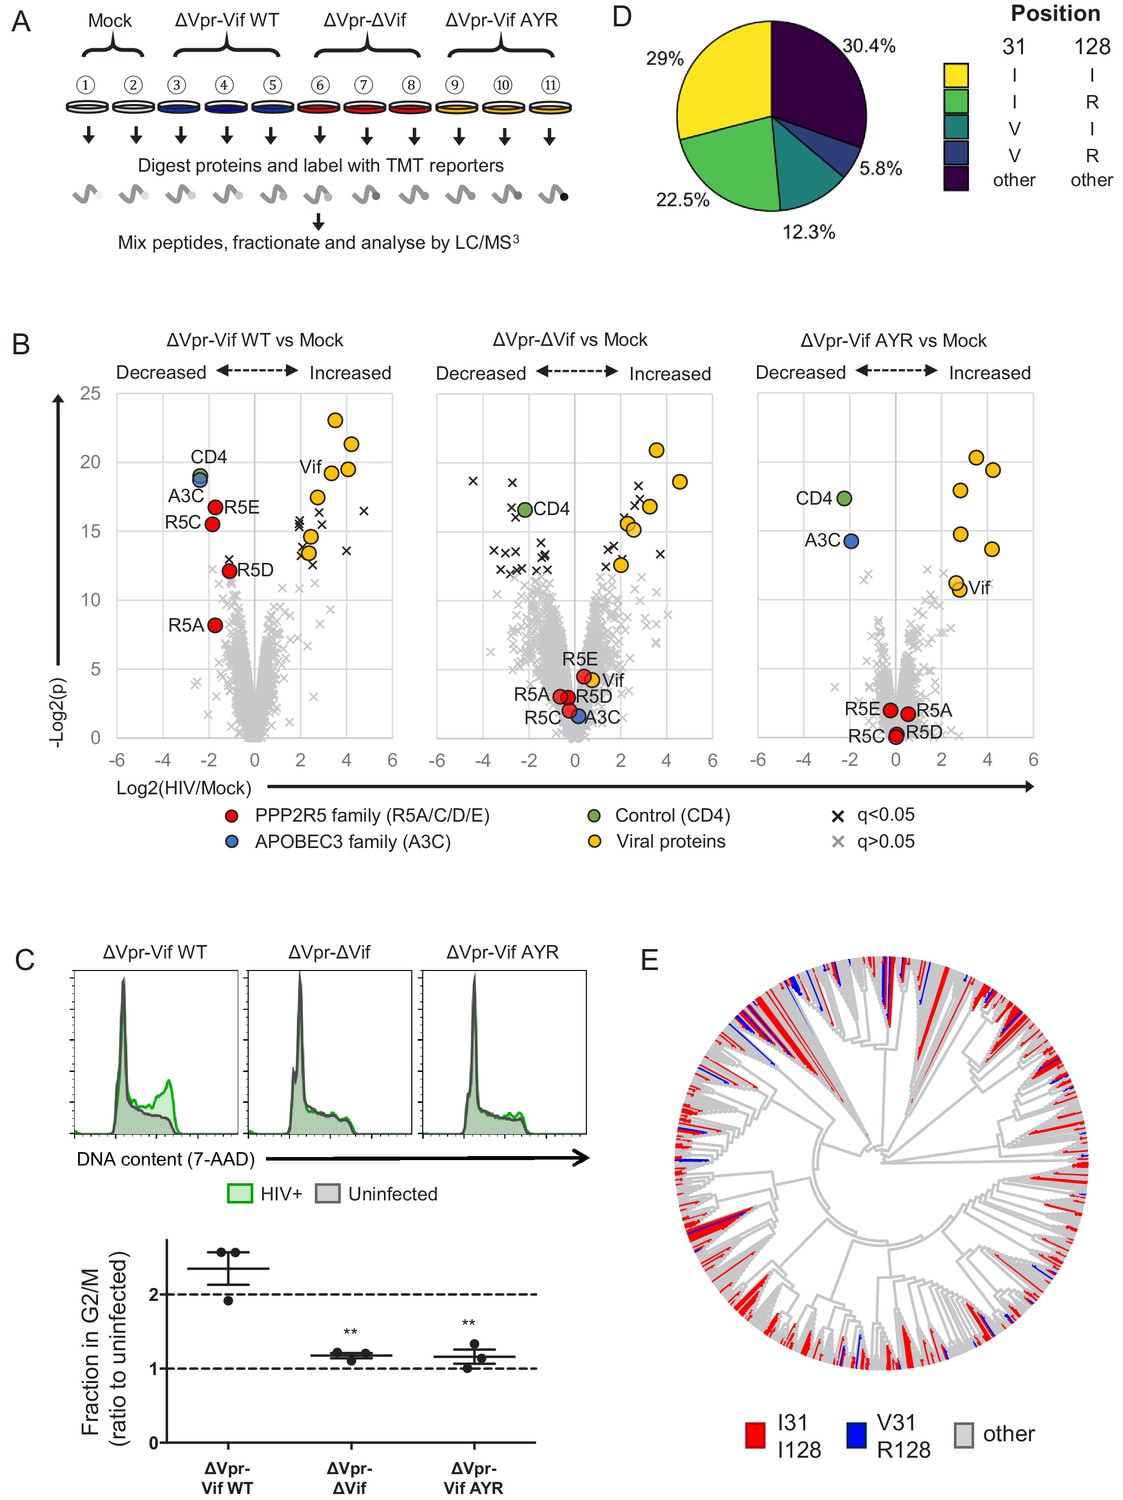
(A) Overview of proteomic experiment 3 (viral infections). CEM-T4s were infected with HIV-AFMACS viruses at an MOI of 0.5, then purified using AFMACS (Figure 7—figure supplement 1A–B) and analysed by TMT-based quantitative proteomics after 48 hr. Biological replicates are shown. Vif AYR, NL4-3 Vif with both I31A and RI127/128YR mutations. (B) Protein abundances in HIV-infected vs mock-infected cells from (A). Volcano plots show statistical significance (y-axis) vs fold change (x-axis) for 6294 viral and cellular proteins (no missing values). Pair-wise comparisons of mock-infected cells with cells infected with ΔVpr-Vif WT (left panel), ΔVpr-ΔVif (middle panel) or ΔVpr-Vif AYR (right panel) viruses are shown. Proteins with Benjamini-Hochberg FDR-adjusted p values (q values)<0.05 (black crosses) or >0.05 (grey crosses) are indicated (FDR threshold of 5%). Proteins highlighted in each plot are summarised in the key. 4 out of 5 PPP2R5 family subunits (A/C/D/E) were quantitated, but only 1 out of 7 APOBEC3 family members (C). (C) Regulation of cell cycle in HIV-infected CEM-T4s. Cells were infected with HIV-AFMACS viruses at an MOI of 0.5, then stained with FITC-conjugated anti-LNGFR antibody, fixed in 90% methanol, stained with 7-AAD and analysed by flow cytometry after 48 hr. Representative data (upper panels) from three biological replicates (lower panel) are shown. Green, LNGFR+ cells (HIV+); grey, LNGFR- cells (uninfected). For each virus, the fraction of HIV+ (LNGFR+) cells in G2/M is shown as a ratio to the fraction of uninfected (LNGFR-) cells in G2/M. Individual data points reflect biological replicates. Mean values with SEM are indicated. Significant differences are highlighted for each pair-wise comparison (t-tests). **p<0.005. (D) Pair-wise combinations of key amino acid polymorphisms amongst 2171 naturally occurring HIV-1 M group Vif variants (clade B). Frequencies of amino acids corresponding to residues 31 and 128 of NL4-3 Vif are shown. An equivalent pie chart for all naturally occurring non-recombinant HIV-1 M group Vif variants (all clades) is shown in Figure 7—figure supplement 3B. (E) Phylogenetic tree of 795 HIV-1 M group viruses (clade B) with protein sequences available for all of Vif, Gag, Env and Nef (based on relatedness of Vif). Viruses encoding Vif variants with I31/I128 (most active, red) and V31/R128 (least active, blue) are highlighted. Equivalent phylogenetic trees based on relatedness of Gag, Env or Nef are shown in Figure 7—figure supplement 4A.
-
Figure 7—source data 1
Complete data from proteomic experiment 3 (viral infections).
Complete dataset (unfiltered) from TMT-based quantitative proteomic experiment illustrated in Figure 7A. For each protein, normalised, unscaled protein abundances, the number of unique peptides used for protein quantitation, and the protein FDR confidence are shown.
- https://cdn.elifesciences.org/articles/53036/elife-53036-fig7-data1-v2.xlsx
Figure 7—figure supplement 1
AFMACS-based purification of infected cells for proteomic experiment 3 (viral infections).
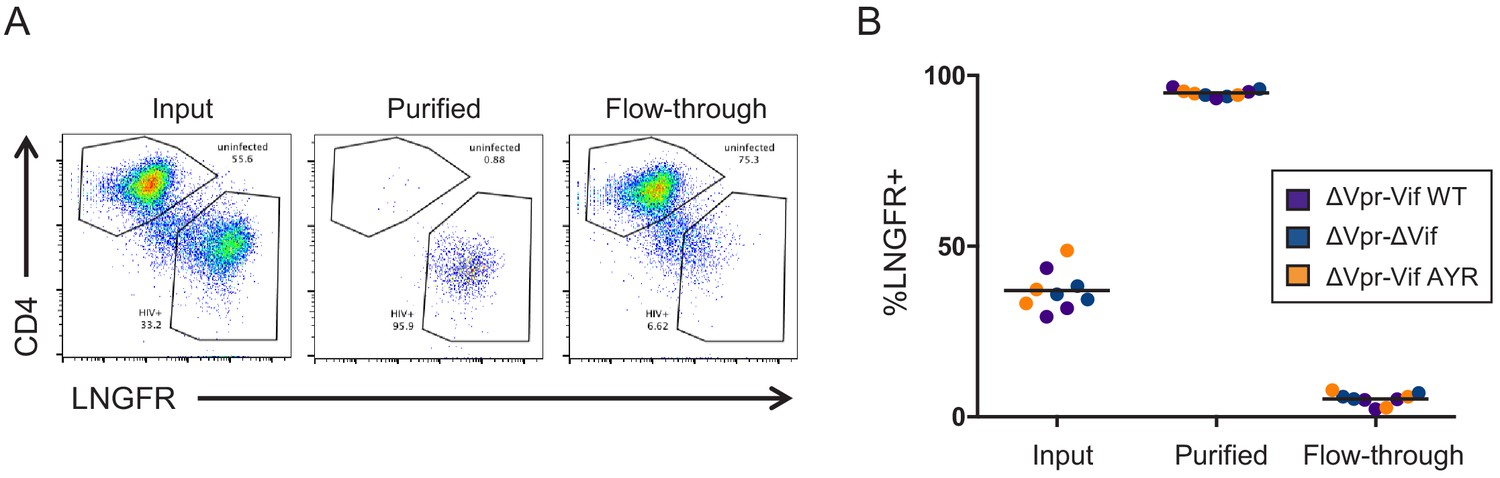
(A–B) HIV-infected cells from Figure 7A were stained with anti-LNGFR and anti-CD4 antibodies and analysed by flow cytometry before (input) and after (purified vs flow-through) selection using AFMACS. Purified cells were used for proteomic analysis. Infected cells express the SBP-ΔLNGFR cell surface affinity tag (LNGFR+) and downregulate CD4 through the action of Nef and Vpu (Guy et al., 1987; Naamati et al., 2019; Willey et al., 1992). Representative data (A) from three biological replicates (B) are shown. Vif AYR, NL4-3 Vif with both I31A and RI127/128 year mutations.
Figure 7—figure supplement 2
Regulation of cell cycle in HIV-infected primary human CD4+ T cells.
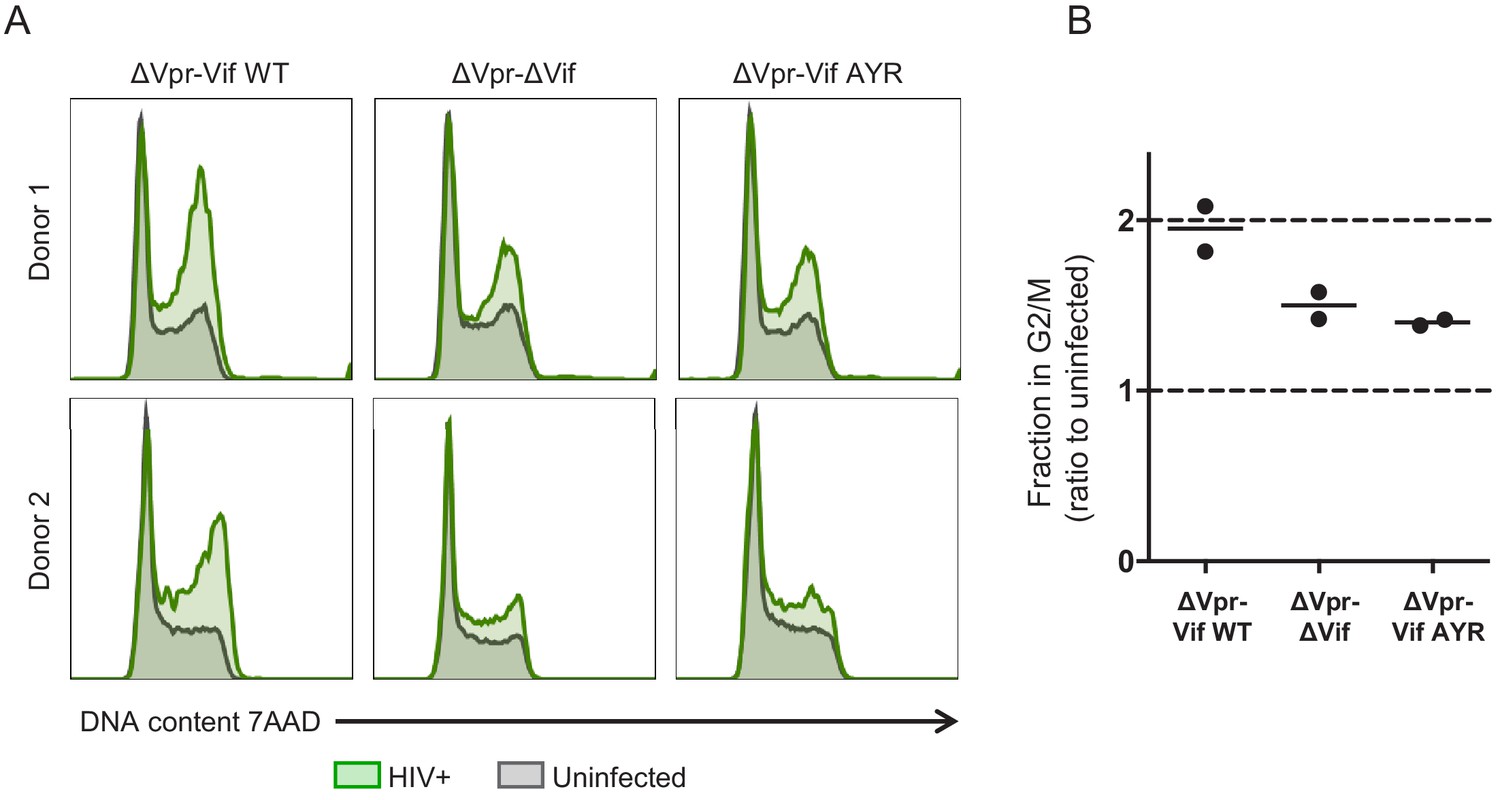
(A–B) Primary human CD4+ T cells were activated with CD3/CD28 Dynabeads and infected with HIV-AFMACS viruses 2 days post-activation at an MOI of 0.5. After a further 48 hr, cells were stained with FITC-conjugated anti-LNGFR and BV421-conjugated anti-CD4 antibodies, then fixed in 90% methanol, stained with 7-AAD and analysed by flow cytometry. Upper and lower panels show independent experiments using cells from two different donors (A). Green, LNGFR+ CD4- cells (HIV+); grey, LNGFR- CD4+ cells (uninfected). For each virus, the fraction of HIV+ (LNGFR+ CD4-) cells in G2/M is shown as a ratio to the fraction of uninfected (LNGFR- CD4+) cells in G2/M. Mean values are indicated.
Figure 7—figure supplement 3
Additional bioinformatics analysis.
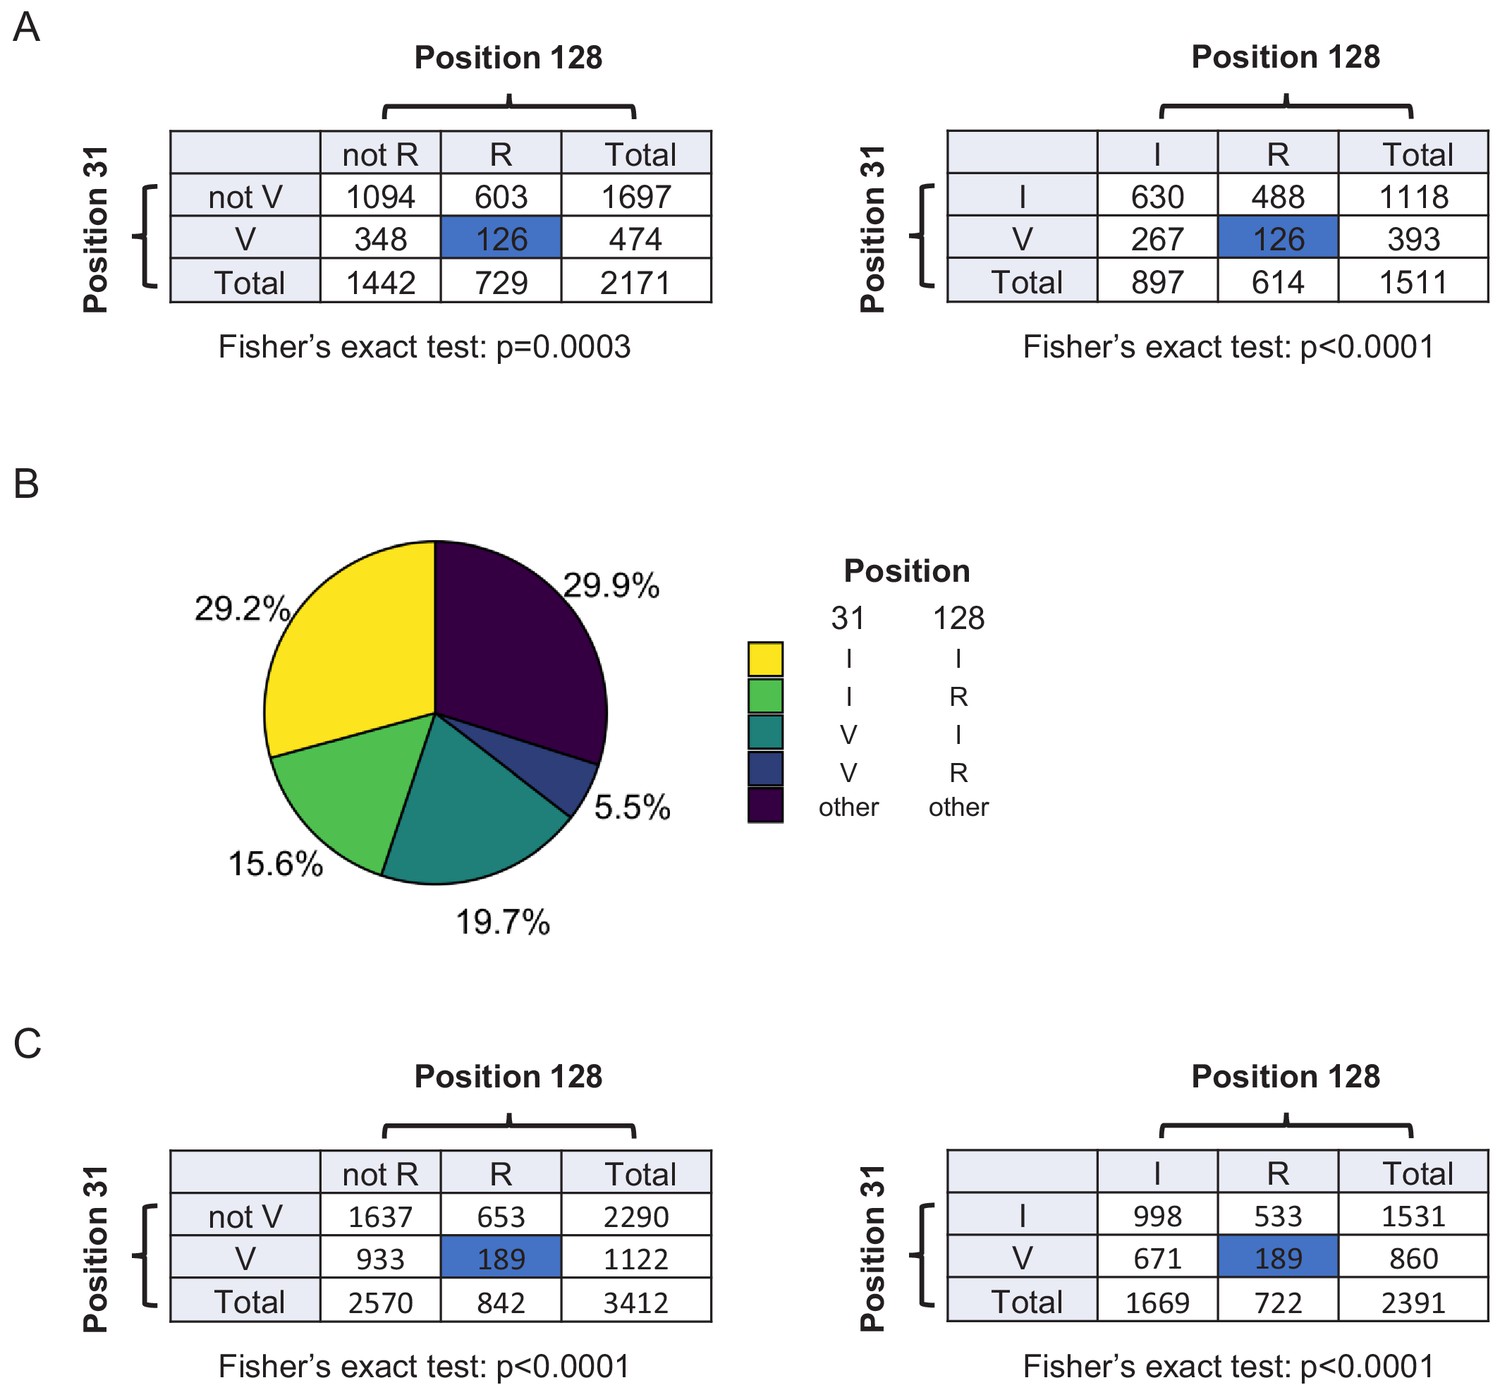
(A) Contingency tables showing combinations of key amino acid polymorphisms amongst naturally occurring HIV-1 M group Vif variants (clade B) summarised in Figure 7D. (B) Pair-wise combinations of key amino acid polymorphisms amongst 3412 naturally occurring non-recombinant HIV-1 M group Vif variants (all clades). Frequencies of amino acids corresponding to residues 31 and 128 of NL4-3 Vif are shown. Same sequences as Figure 5—figure supplement 1. (C) Contingency tables showing combinations of key amino acid polymorphisms amongst naturally occurring non-recombinant HIV-1 M group Vif variants (all clades) summarised in (B).
Figure 7—figure supplement 4
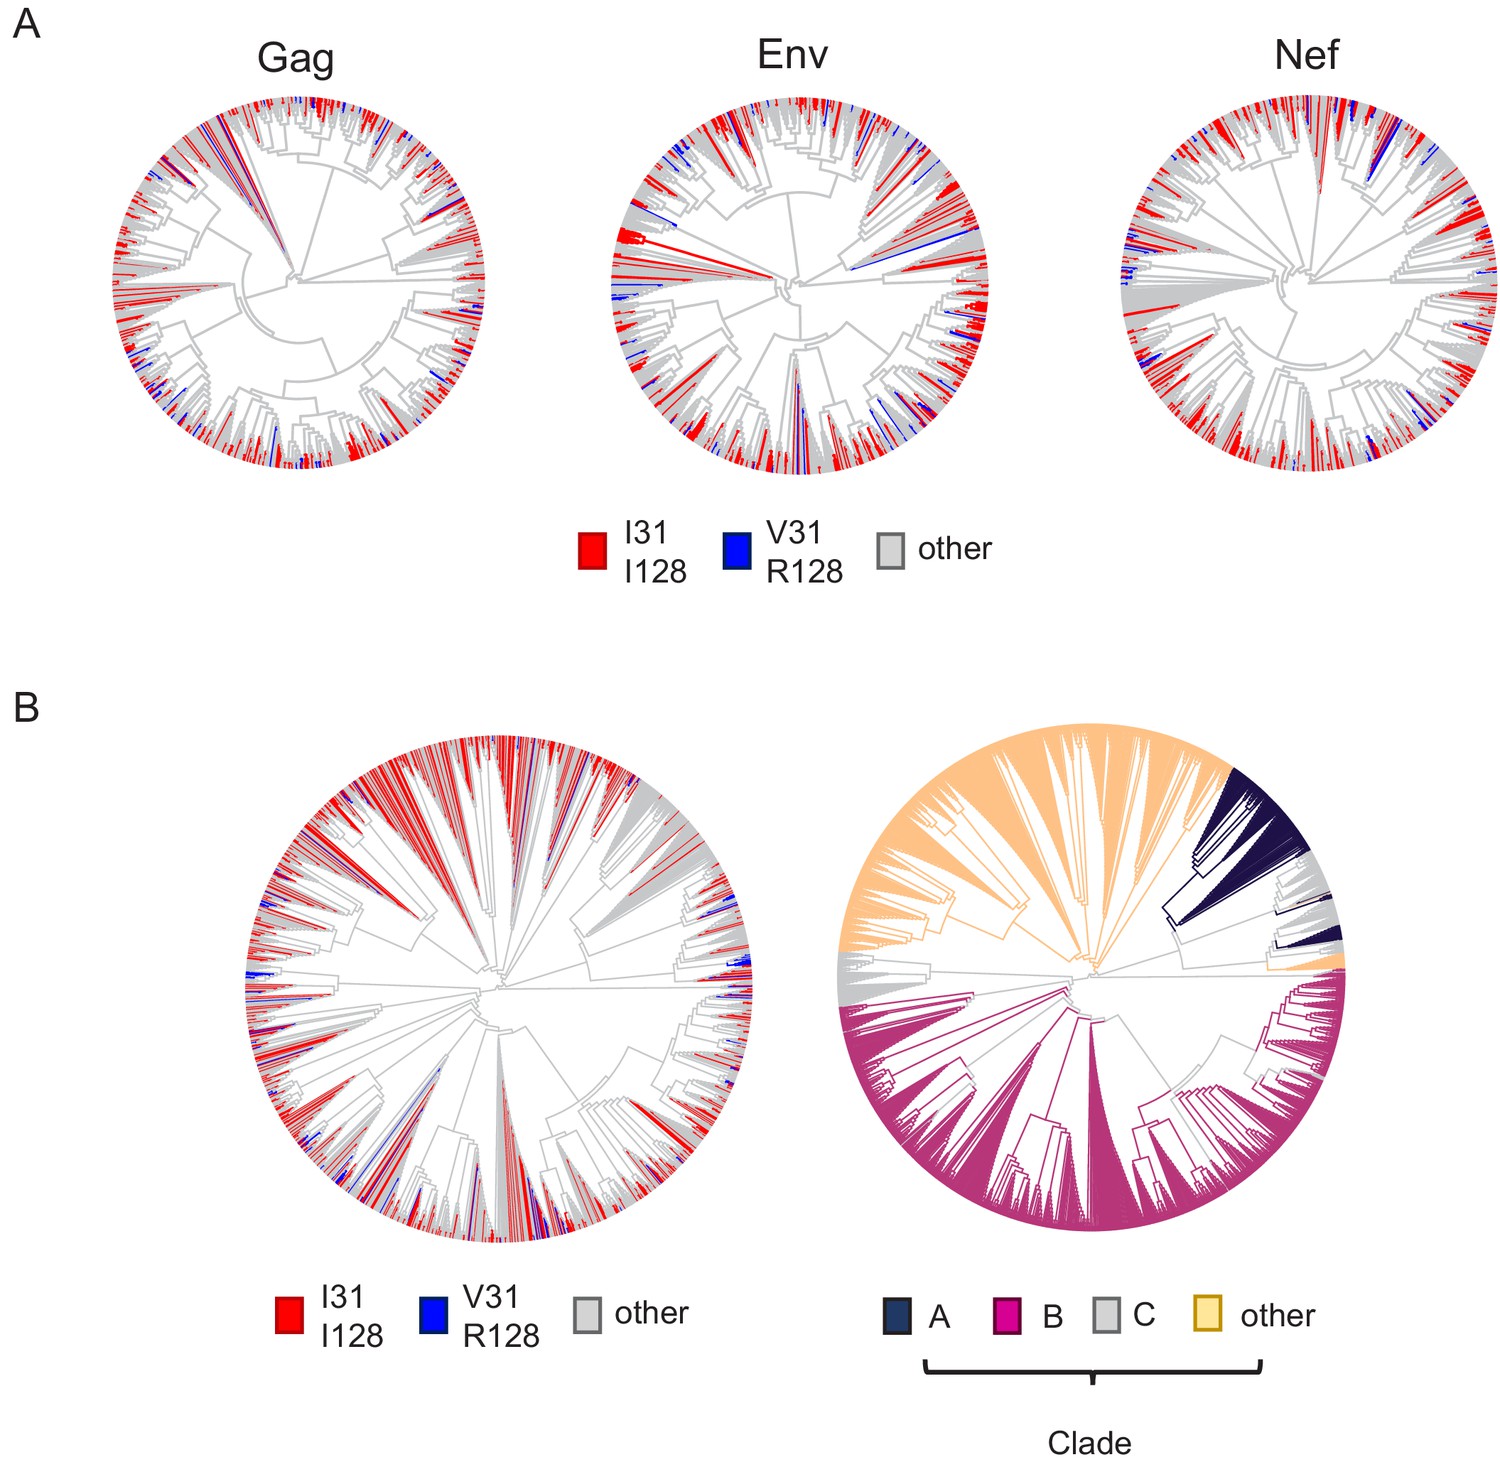
Additional phylogenetic trees.
(A) Phylogenetic trees of 795 HIV-1 M group viruses (clade B) with protein sequences available for all of Vif, Gag, Env and Nef (based on relatedness of Gag, Env or Nef). Viruses encoding Vif variants with I31/I128 (most active, red) and V31/R128 (least active, blue) are highlighted. (B) Phylogenetic trees of 1649 naturally occurring non-recombinant HIV-1 M group viruses (all clades) with protein sequences available for all of Vif, Gag, Env and Nef (based on relatedness of Vif). In the left panel, viruses encoding Vif variants with I31/I128 (most active, red) and V31/R128 (least active, blue) are highlighted. In the right panel (same phylogenetic tree), viruses are coloured according to clade (as indicated).
Tables
Key resources table
| Reagent type (species) or resource | Designation | Source or reference | Identifiers | Additional information |
|---|---|---|---|---|
| Cell line (human) | CEM-T4 T cells (CEM-T4s) | NIH AIDS Reagent Program | Cat. #: 117 | Also known as CEM CD4+ cells |
| Cell line (human) | THP-1 cells (THP-1s) | NIH AIDS Reagent Program | Cat. #: 9942 | Used for cDNA library generation |
| Cell line (human) | HeLa cells (HeLas) | Lehner laboratory stocks | RRID:CVCL_0030 | |
| Cell line (human) | HEK 293T cells (293Ts) | Lehner laboratory stocks | RRID:CVCL_0063 | |
| Antibody | Mouse monoclonal BV421-conjugated anti-CD4 | BioLegend | Cat. #: 317434 | Flow cytometry (1:50) |
| Antibody | Mouse monoclonal PE-conjugated anti-CD4 | BD Biosciences | Cat. #: 561843 | Flow cytometry (1:50) |
| Antibody | Mouse monoclonal AF647-conjugated anti-LNGFR | BioLegend | Cat. #: 345114 | Flow cytometry (1:50) |
| Antibody | Mouse monoclonal FITC-conjugated anti-LNGFR | BioLegend | Cat. #: 345103 | Flow cytometry (1:50) |
| Antibody | Mouse monoclonal BV421-conjugated anti CD4 | BioLegend | Cat. #: 317434 | Flow cytometry (1:50) |
| Antibody | Mouse monoclonal DyLight 650-conjugated anti-HA tag | Abcam | Cat. #: ab117515 | Flow cytometry (1:400) |
| Antibody | Rabbit monoclonal anti-PPP2R5D | Abcam | Cat. #: ab188323 | Immunoblot (1:5000) |
| Antibody | Mouse monoclonal anti-HIV-1 Vif | NIH AIDS Reagent Program | Cat. #: 6459 | Immunoblot (1:2500) |
| Antibody | Rabbit polyclonal anti-FMR1 (FMRP) | Cell Signalling Technology | Cat. #: 4317 | Immunoblot (1:1000) |
| Antibody | Rabbit polyclonal anti-DPH7 | Atlas Antibodies | Cat. #: HPA022911 | Immunoblot (1:1000) |
| Antibody | Mouse monoclonal anti-β-actin | Sigma | Cat. #: A5316 | Immunoblot (1:20000) |
| Antibody | Mouse monoclonal anti-p97 (VCP) | Abcam | Cat. # ab11433 | Immunoblot (1:10000) |
| Antibody | Rabbit polyclonal anti-total AURKB | Cell Signalling Technology | Cat. #: 3094 | Immunoblot (1:500) |
| Antibody | Rabbit monoclonal anti-phospho-AURK | Cell Signalling Technology | Cat. #: 2914 | Immunoblot (1:500) |
| Antibody | Rabbit polyclonal anti-GFP | Thermo Scientific | Cat. #: A-11122 | Immunoblot (1:2500) |
| Recombinant DNA reagent | pHRSIN-SE-P2A-SBP-ΔLNGFR-W | Matheson et al., 2014 | N/A | Used as a control and to express codon optimised Vif variants |
| Recombinant DNA reagent | pHRSIN-SE-W-pSV40-puro | van den Boomen et al., 2014 | N/A | Used as a control |
| Recombinant DNA reagent | pHRSIN-S-W-pGK-puro | Greenwood et al., 2016 | N/A | Used to express HA-tagged PPP2R5B, APOBEC3F and APOBEC3G |
| Recombinant DNA reagent | HIV-AFMACS | Naamati et al., 2019 | GenBank: MK435310.1 | pNL4-3-ΔEnv-Nef-P2A-SBP-ΔLNGFR proviral construct |
| Recombinant DNA reagent | V245 pCEP-4HA B56alpha | Addgene | Cat. #: 14532 | Standard for quantification of PPP2R5A mRNA |
| Recombinant DNA reagent | V245 pCEP-4HA B56beta | Addgene | Cat. #: 14533 | Standard for quantification of PPP2R5B mRNA |
| Recombinant DNA reagent | V245 pCEP-4HA B56gamma1 | Addgene | Cat. #: 14534 | Standard for quantification of PPP2R5C mRNA |
| Recombinant DNA reagent | V245 pCEP-4HA B56delta | Addgene | Cat. #: 14536 | Standard for quantification of PPP2R5D mRNA |
| Recombinant DNA reagent | V245 pCEP-4HA B56epsilon | Addgene | Cat. #: 14537 | Standard for quantification of PPP2R5E mRNA |
| Recombinant DNA reagent | TBP cDNA clone: IRATp970C11110D | Source Bioscience | GenBank: BC110341.1 | Standard for quantification of TBP mRNA |
| Commercial assay or kit | NEBuilder HiFi DNA Assembly Cloning Kit | NEB | Cat. #: E5520S | |
| Commercial assay or kit | Fugene 6 Transfection Reagent | Promega | Cat. #E2691 | |
| Commercial assay or kit | Lipofectamine RNAiMAX Transfection Reagent | Invitrogen | Cat. #: 18080044 | |
| Chemical compound, drug | Lenti-X Concentrator | Clontech | Cat. #: 631232 | |
| Commercial assay or kit | Dynabeads Biotin Binder | Invitrogen | Cat. #: 11047 | |
| Commercial assay or kit | Dynabeads Untouched Human CD4 T Cells kit | Invitrogen | Cat. #: 11346D | |
| Commercial assay or kit | Dynabeads Human T-Activator CD3/CD28 | Invitrogen | Cat. #: 11132D | |
| Commercial assay or kit | S-Trap micro MS Sample Preparation Kit | Protifi | Cat. #: C02-micro | |
| Commercial assay or kit | TMT10plex Isobaric Label Reagent Set | Thermo Scientific | Cat. #: 90110 | |
| Commercial assay or kit | Superscript III First-Strand Synthesis System | Invitrogen | Cat. #: 18080051 | |
| Software, algorithm | PyMOL Molecular Graphics System, Version 2.0 | Schrödinger | RRID:SCR_006054 | https://www. schrodinger.com/pymol |
| Software, algorithm | Proteome Discoverer 2.1 | Thermo Scientific | RRID:SCR_014477 | |
| Software, algorithm | R v.3.5.3 | R Development Core Team, 2019 | RRID:SCR_001905 | https://www.R-project.org/ |
| Software, algorithm | limma | Ritchie et al., 2015 | RRID:SCR_010943 | https://bioconductor.org/packages/limma/ |
| Software, algorithm | WebLogo | Crooks et al., 2004 | RRID:SCR_010236 | http://weblogo.berkeley.edu |
| Software, algorithm | seqinr | Charif and Lobry, 2007 | N/A | https://cran.r-project.org/web/packages/seqinr/ |
| Software, algorithm | ggplot2 | Wickham, 2009 | RRID:SCR_014601 | https://ggplot2.tidyverse.org |
| Software, algorithm | ggtree | Yu et al., 2018 | N/A | https://bioconductor.org/packages/release/bioc/html/ggtree.html |
| Software, algorithm | Clustal Omega | Sievers and Higgins, 2014 | RRID:SCR_001591 | https://www.ebi.ac.uk/Tools/msa/clustalo/ |
| Software, algorithm | Prism 7.0 | GraphPad | RRID:SCR_002798 |
Additional files
-
Supplementary file 1
DNA and RNA sequences.
Sequences of PCR primers for Vif mutant library construction, codon-optimised Vif variants synthesised as gBlocks, Vif coding sequences in HIV-AFMACS viruses, the C-terminal 4xHA-tagged APOBEC3F coding sequence in pHRSIN-S-W-pGK puro, oligonucleotides for RNAi and primers for qRT-PCR.
- https://cdn.elifesciences.org/articles/53036/elife-53036-supp1-v2.docx
-
Transparent reporting form
- https://cdn.elifesciences.org/articles/53036/elife-53036-transrepform-v2.pdf
Download links
A two-part list of links to download the article, or parts of the article, in various formats.
Downloads (link to download the article as PDF)
Open citations (links to open the citations from this article in various online reference manager services)
Cite this article (links to download the citations from this article in formats compatible with various reference manager tools)
Antagonism of PP2A is an independent and conserved function of HIV-1 Vif and causes cell cycle arrest
eLife 9:e53036.
https://doi.org/10.7554/eLife.53036


