Transformation of a temporal speech cue to a spatial neural code in human auditory cortex
- Department of Neurological Surgery, University of California, San Francisco, United States
- Donders Institute for Brain, Cognition and Behaviour, Centre for Cognitive Neuroimaging, Radboud University, Netherlands
- Max Planck Institute for Psycholinguistics, Netherlands
- Weill Institute for Neurosciences, University of California, San Francisco, United States
Figures
Figure 1 with 4 supplements
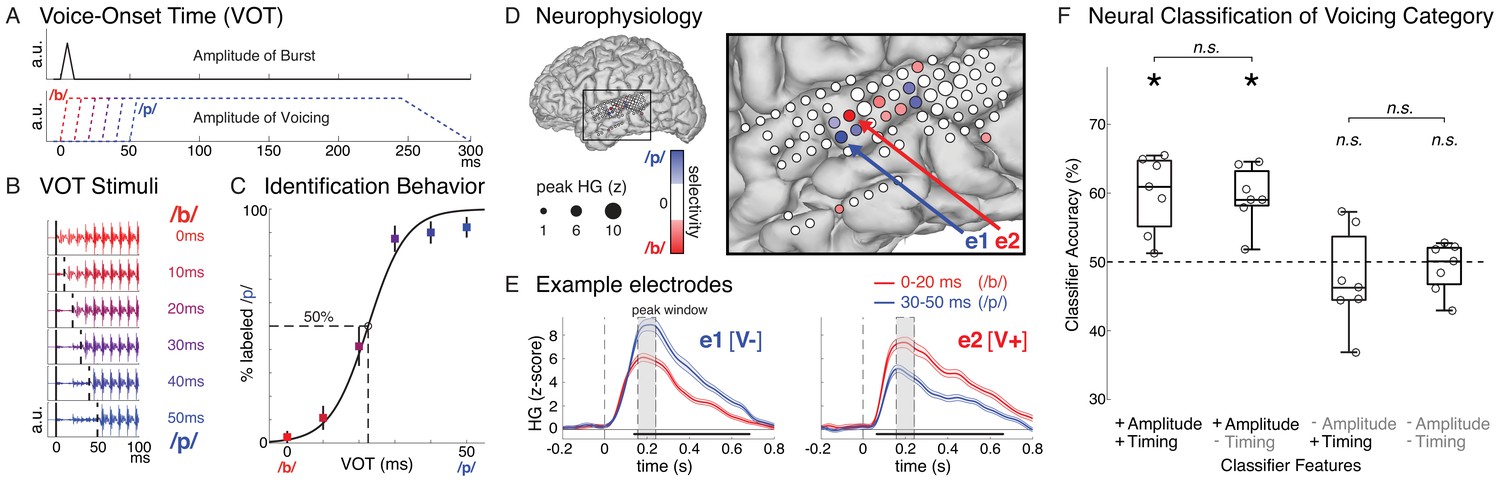
Speech sound categories that are distinguished by a temporal cue are spatially encoded in the peak amplitude of neural activity in distinct neural populations.
(A) Stimuli varied only in voice-onset time (VOT), the duration between the onset of the burst (top) and the onset of voicing (bottom) (a.u. = arbitrary units). (B) Acoustic waveforms of the first 100 ms of the six synthesized stimuli. (C) Behavior for one example participant (mean ± bootstrap SE). Best-fit psychometric curve (mixed effects logistic regression) yields voicing category boundary between 20–30 ms (50% crossover point). (D) Neural responses in the same representative participant show selectivity for either voiceless or voiced VOTs at different electrodes. Electrode size indicates peak high-gamma (HG; z-scored) amplitude at all speech-responsive temporal lobe sites. Electrode color reflects strength and direction of selectivity (Spearman’s ρ between peak HG amplitude and VOT) at VOT-sensitive sites (p<0.05). (E) Average HG responses (± SE) to voiced (0–20 ms VOTs; red) and voiceless (30–50 ms VOTs; blue) stimuli in two example electrodes from (D), aligned to stimulus onset (e1: voiceless-selective, V-; e2: voiced-selective, V+). Horizontal black bars indicate timepoints with category discriminability (p<0.005). Grey boxes mark average peak window (± SD) across all VOT-sensitive electrodes (n = 49). (F) Population-based classification of voicing category (/p/ vs. /b/) during peak window (150–250 ms after stimulus onset). Chance is 50%. Boxes show interquartile range across all participants; whiskers extend to best- and worst-performing participants; horizontal bars show median performance. Asterisks indicate significantly better-than-chance classification across participants (p<0.05; n.s. = not significant). Circles represent individual participants.
Figure 1—figure supplement 1
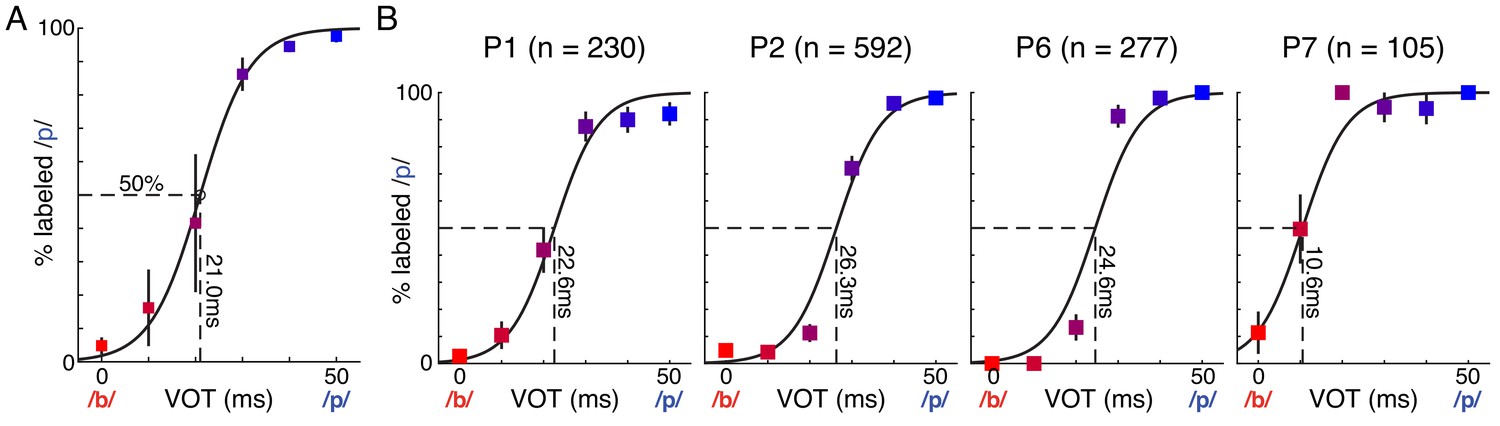
Identification behavior across all participants with behavioral data.
(A) Mean (± SE across participants; n = 4 of 7 participants) percent /pa/ responses for each voice-onset time (VOT) stimulus. Best-fit psychometric curve (mixed effects logistic regression) yields voicing category boundary at 21.0 ms (50% crossover point; see Materials and methods for details). (B) Behavior (mean ± bootstrap SE) for each individual participant (P1, P2, P6, P7). Total trials (n) listed for each participant (see Supplementary file 1). Best-fit psychometric curves and category boundaries were computed using the mixed effects logistic regression across all participants, adjusted by the random intercept fit by the model for each participant. Voicing category boundaries were subject-dependent, with 3 of 4 participants’ occurring between 20–30 ms. P1 is representative participant in Figure 1C.
Figure 1—figure supplement 2
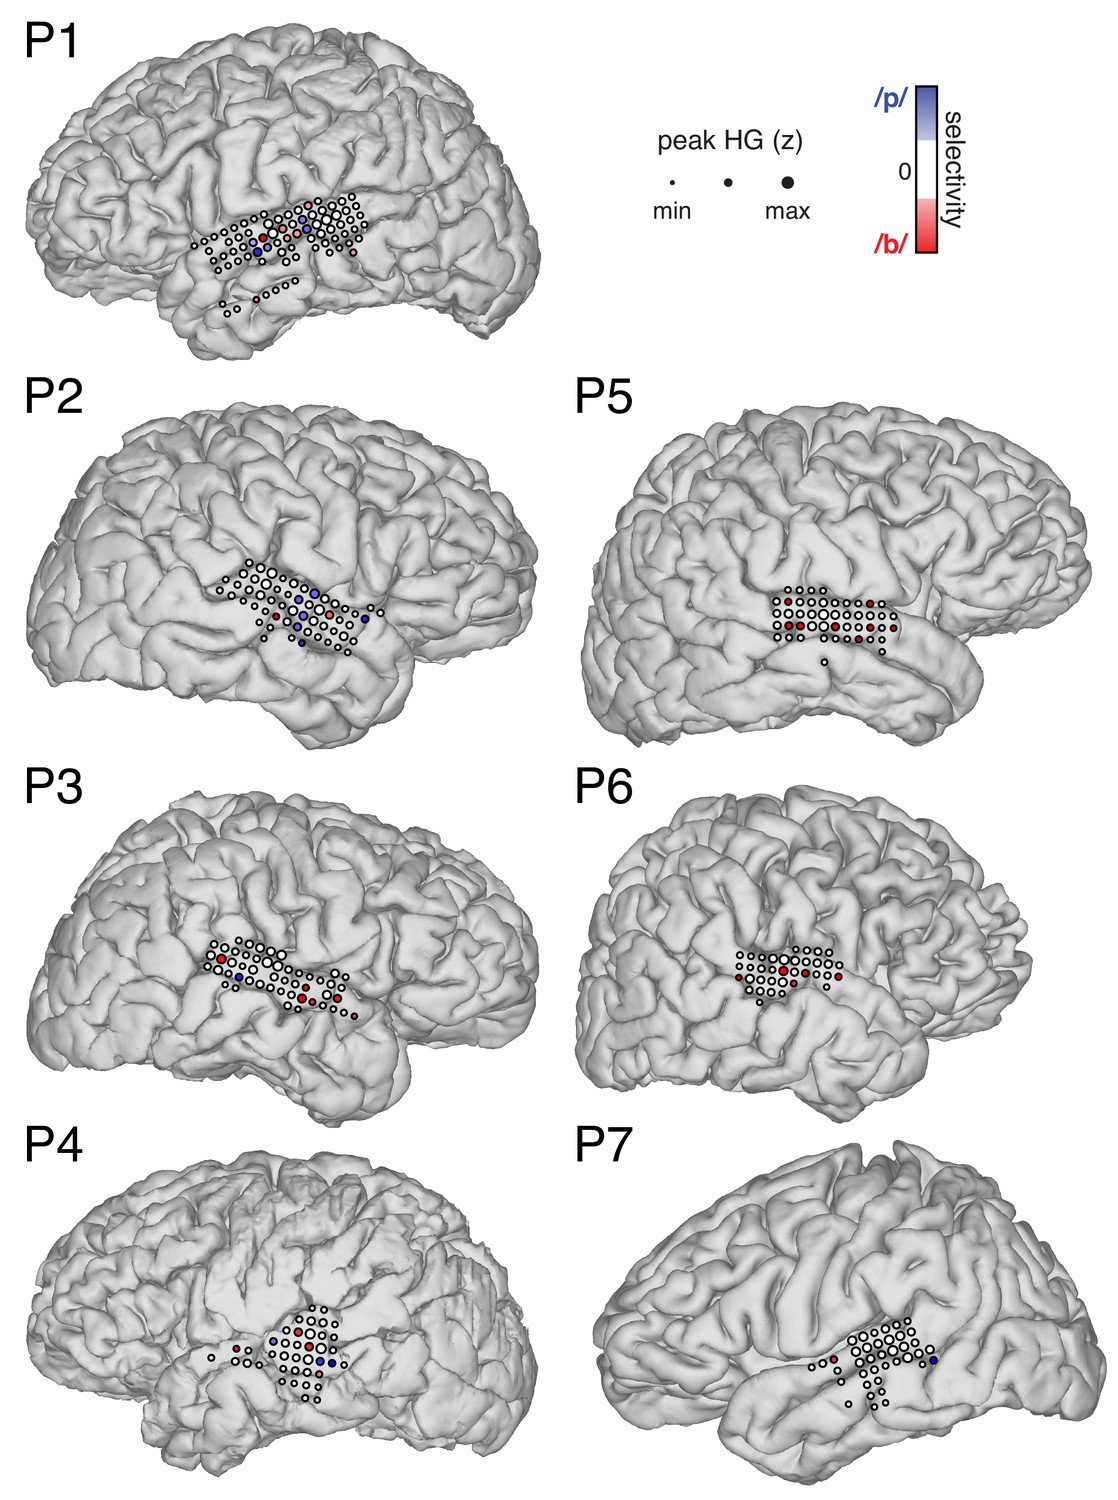
Locations of all speech-responsive and VOT-sensitive electrodes in each participant (P1–P7).
P1 is representative participant in Figure 1D. Electrode color reflects strength and direction of selectivity (Spearman’s ρ between peak HG amplitude and VOT) at subset of VOT-sensitive sites (p<0.05) for either voiceless VOTs (/p/; blue) or voiced VOTs (/b/; red). Electrode size indicates peak high-gamma (HG; z-scored) amplitude at all speech-responsive temporal lobe sites. Maximum and minimum electrode size and selectivity was calculated per participant for visualization.
Figure 1—figure supplement 3
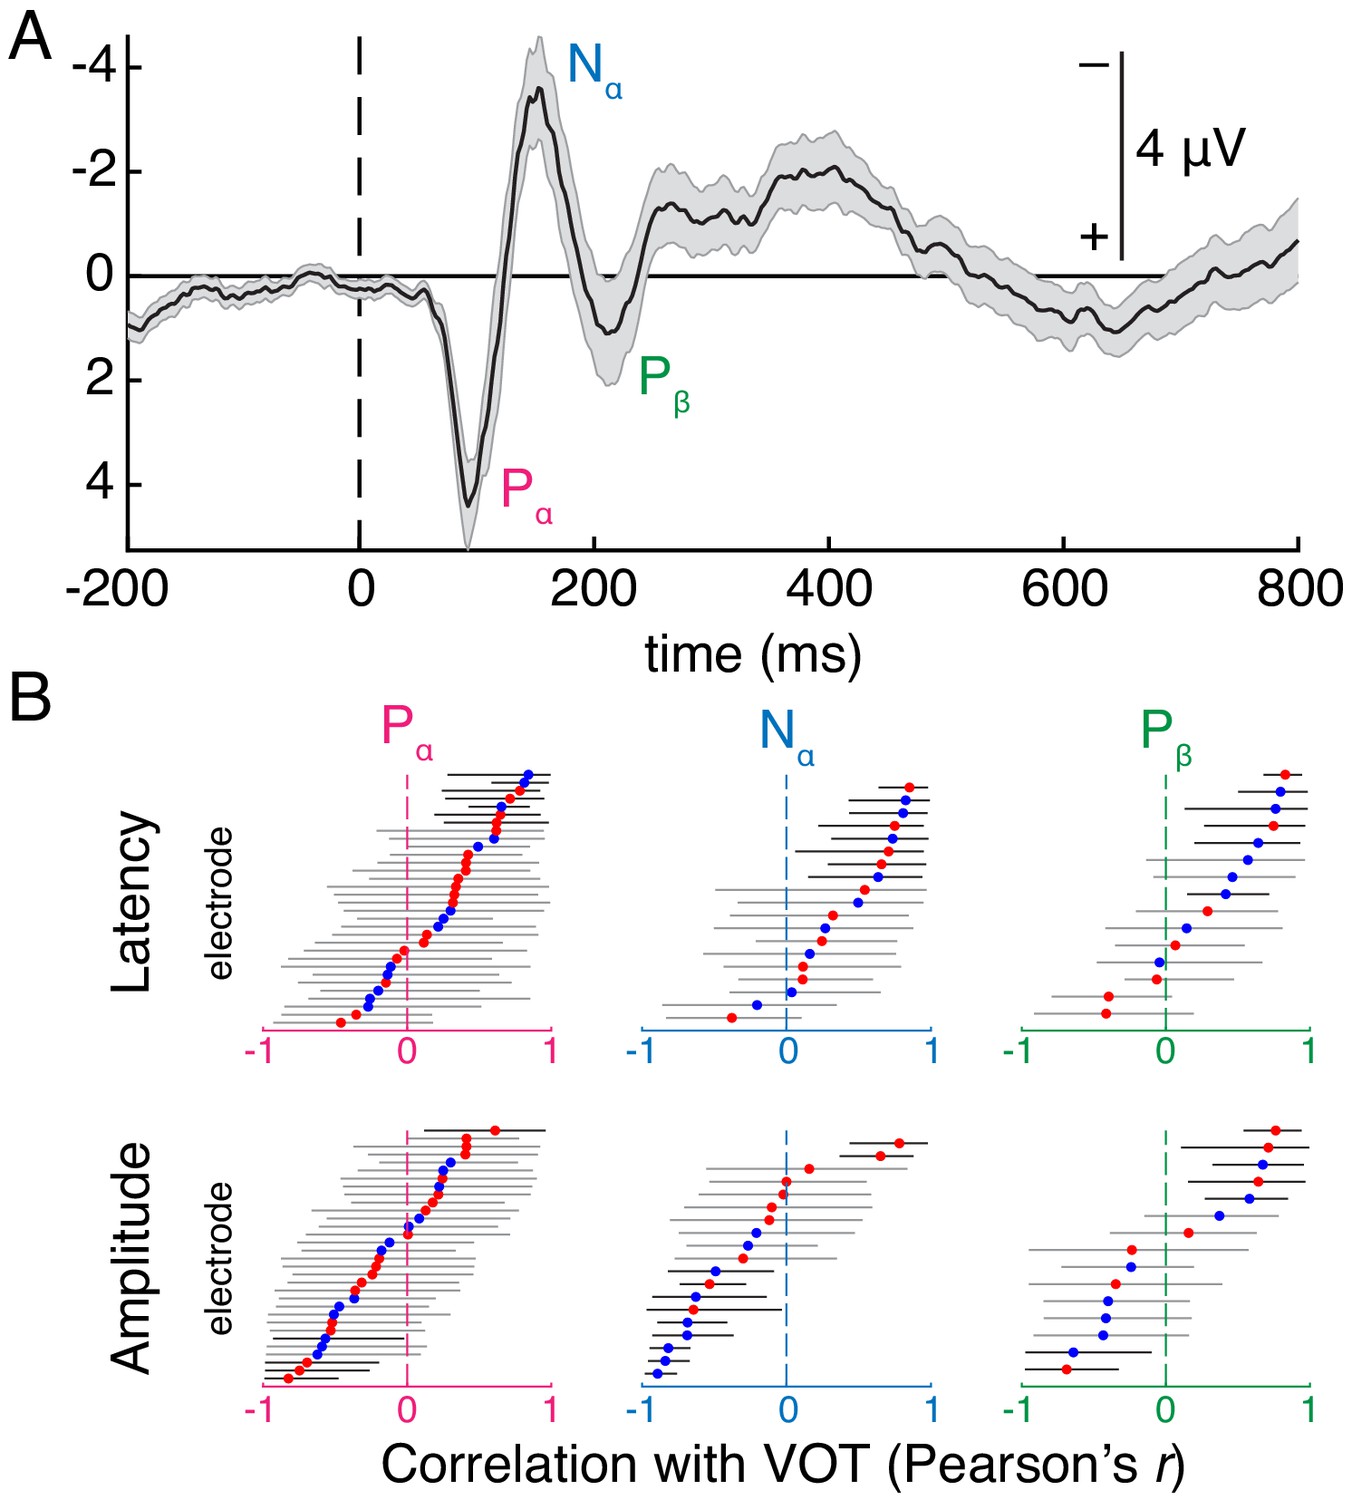
Analysis of evoked local field potentials reveals that some electrodes that encode VOT in their peak high-gamma amplitude also exhibit amplitude and/or temporal response features that are VOT-dependent.
(A) Grand average auditory evoked potential (AEP) to all VOT stimuli. Evoked local field potentials (negative up-going) were averaged over all VOT-sensitive STG electrodes for one representative participant (P1) (mean ± SE, computed across electrodes). Three peaks of the AEP were identified for analysis: 75–100 ms (Pα), 100–150 ms (Nα), and 150–250 ms (Pβ) after stimulus onset. (B) Correlation coefficients (Pearson’s r) quantifying association between VOT and latency (top) or amplitude (bottom) of each peak (Pα: left; Nα: middle; Pβ: right) for each VOT-sensitive electrode for which that peak could be reliably identified (see Figure 1—figure supplement 4 and Materials and methods for details of this analysis). Horizontal bars represent bootstrapped estimate of correlation coefficient (mean and 95% CI) for each electrode (blue: voiceless-selective; red: voiced-selective; electrodes sorted by mean correlation value). Black bars around an electrode’s mean indicate that encoding of VOT by the designated parameter (latency or amplitude of a given peak) was significant (95% CI excluded r = 0; grey bars: not significant). Later peaks were reliably identified for fewer electrodes (Pα: n = 32 of 49 electrodes; Nα: n = 19; Pβ: n = 15).
Figure 1—figure supplement 4

Complex and variable associations between VOT and amplitude/temporal features of auditory evoked local field potentials (AEPs) exist in responses of electrodes that robustly encode voicing in their peak high-gamma amplitude.
(A to D) Average high-gamma responses (± SE) to voiced (0–20 ms VOTs; red) and voiceless (30–50 ms VOTs; blue) stimuli in four representative VOT-sensitive STG electrodes, including two voiceless-selective (A: e1, C: e3) and two voiced-selective (B: e2, D: e4) electrodes, aligned to stimulus onset. Vertical bars indicate relative scaling of high-gamma (z-scored) in each panel. The two leftmost electrodes (e1, e2) correspond to e1 and e2 in main text (e.g., Figure 1E). (E to H) Average local field potentials (± SE) evoked by voiced/voiceless stimuli in the same four electrodes, aligned to stimulus onset. Vertical bars (negative-upgoing) indicate relative scaling of voltage in each panel. The three peaks of the AEP that were identified for analysis are labeled for each electrode (Pα, Nα, Pβ; see Figure 1—figure supplement 3). For a given electrode, peaks were omitted from this analysis if they could not be reliably identified across bootstrapped samples of trials from all six VOT conditions (e.g., Pβ for e4). See Materials and methods for details. (I to L) Average local field potentials evoked by each VOT stimulus (line color) in the same four electrodes, aligned to stimulus onset. (M to P) Mean latency (± bootstrap SE) of each AEP peak for each VOT stimulus for the same four electrodes. Mean bootstrapped correlation (Pearson’s r) between VOT and peak latency shown for each peak/electrode. (Q to T) Mean amplitude (± bootstrap SE) of each AEP peak for each VOT stimulus for the same four electrodes. Mean bootstrapped correlation (Pearson’s r) between VOT and peak amplitude shown for each peak/electrode. Note that negative correlations are visually represented as rising from left to right. Correlation coefficients comprised the source data for summary representations in Figure 1—figure supplement 3.
Figure 2 with 1 supplement

Human auditory cortex encodes both phonetic (between-category) and sub-phonetic (within-category) information in peak response amplitude, which can be modeled by a simple neural network that implements temporal gap and coincidence detection.
(A) Spatial distribution of VOT-sensitive electrodes across all participants (on standardized brain). (B) Average (± SE) normalized HG response to each VOT across all voiceless-selective (V-) electrodes, aligned to stimulus onset. Line style denotes category membership of a given VOT (solid: preferred category; dashed: non-preferred category). Grey box marks average peak window (± SD) across all VOT-sensitive electrodes. (C) Average (± SE) normalized response to each VOT across all voiced-selective (V+) electrodes. (D) Average (± SE) peak response to each VOT stimulus for V- electrodes (left) and V+ electrodes (right) (see Materials and methods). (E) A simple neural network model (top) comprised of five leaky integrator nodes was implemented to examine computational mechanisms that could account for the spatial encoding of a temporal cue (VOT). Arrows and circle represent excitatory and inhibitory connections between nodes. See Materials and methods for details on model parameters. Postsynaptic potentials (PSPs) illustrate the internal dynamics of the gap detector (Gap, middle) and coincidence detector (Coinc, bottom) in response to simulated VOT stimuli (line color). Outputs (panels F/G) are triggered by suprathreshold instantaneous PSPs (ΣPSP≥θ, dark lines) but not by subthreshold PSPs (ΣPSP<θ; semitransparent lines). (F) Model outputs (a.u. = arbitrary units) evoked by simulated VOT stimuli for Gap (one cycle = 10 ms). Note that outputs for 0 ms and 10 ms VOTs are overlapping. No error bars shown because model simulations are deterministic. Grey box marks average peak window (across panels F/G); width matches peak window of real neural data (panels B/C). (G) Model outputs for Coinc (H) Peak response to each simulated VOT stimulus for Gap (left) and Coinc (right).
Figure 2—figure supplement 1
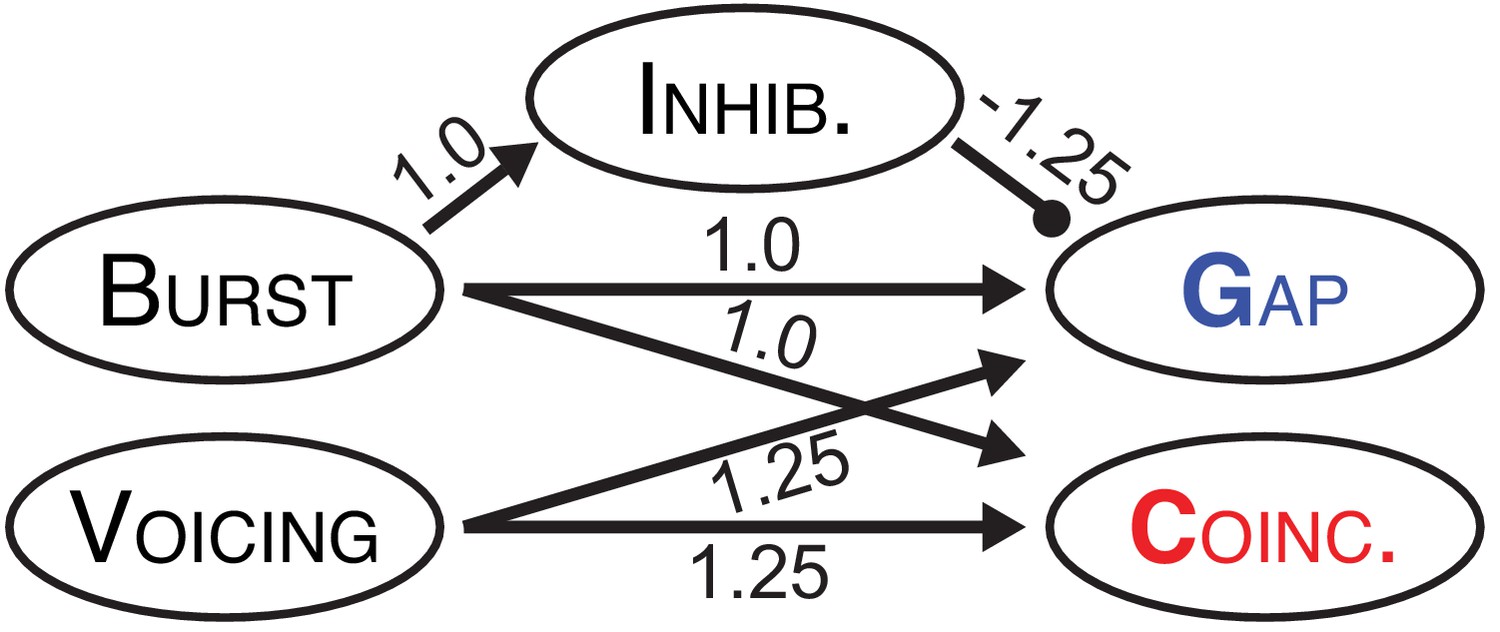
Connection weights between model nodes.
Figure 3
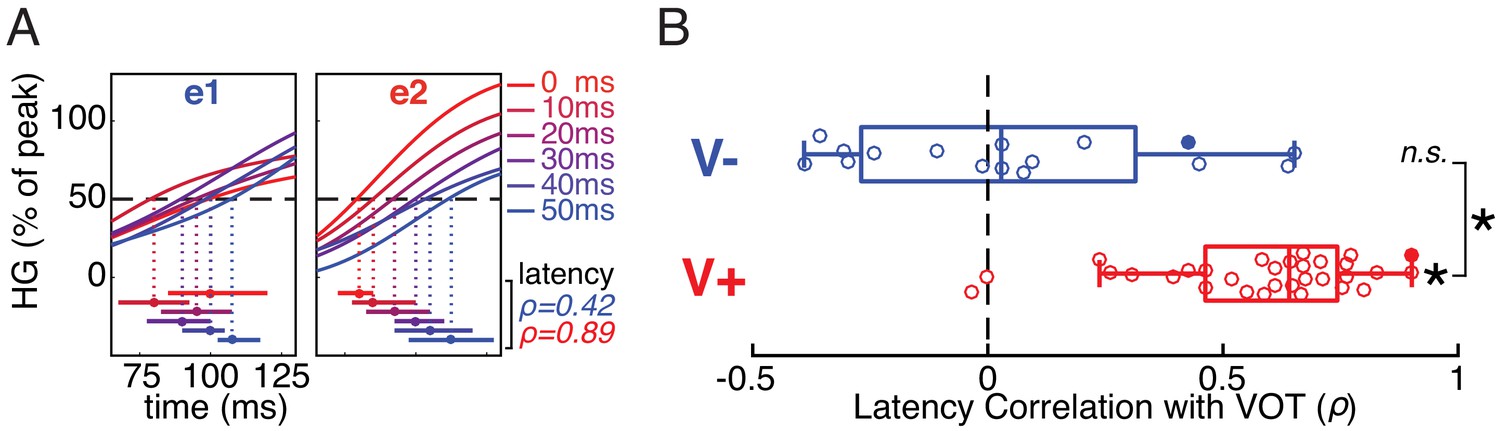
Early temporal dynamics of stimulus-evoked neural responses differ between voiceless-selective (V-) and voiced-selective (V+) electrodes.
(A) Normalized trial-averaged HG responses to each VOT stimulus (line color) in two example electrodes (e1 and e2; same electrodes shown in Figure 1D/E). The time window (x-axis) is relative to onset of the burst and precedes the peak response. Horizontal bars show estimates (bootstrapped mean ± SE) of response onset latency for each VOT (first timepoint exceeding 50% of electrode’s average peak HG). Mean bootstrapped rank-based correlation (Spearman’s ρ) between VOT and response onset latency shown for e1 (blue) and e2 (red). (B) Across all V- electrodes, the bootstrapped correlation coefficients did not differ significantly from 0, suggesting that onset latency was time-locked to the burst. In contrast, across all V+ electrodes, the bootstrapped correlation coefficients were reliably positive (longer latencies for longer VOTs), and greater than for V- electrodes. Circles represent individual electrodes (filled: example electrodes in A). Boxes show interquartile range; whiskers extend to maximum/minimum of each group (excluding two outlier V+ electrodes); vertical bars are medians. Asterisks indicate significance (p<10−4; n.s. = not significant).
Author response image 1
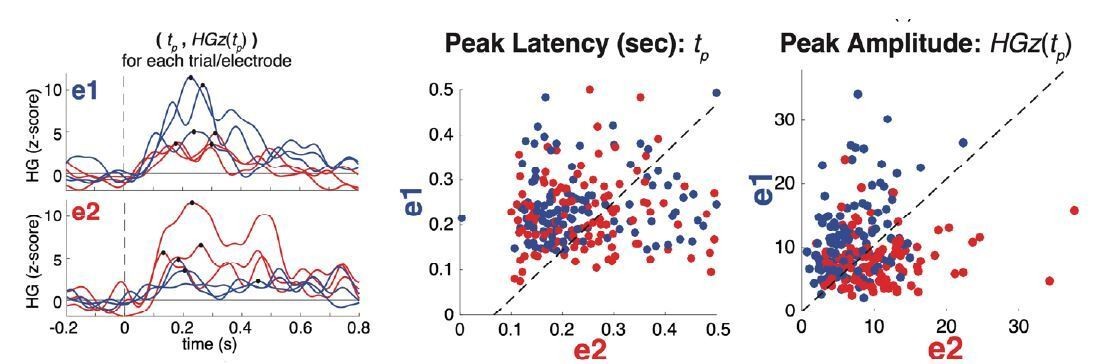
Single electrodes demonstrate better separation of voicing category based on peak amplitude vs. peak latency.
left: High-gamma traces for six single trials (one per VOT condition, as indicated by line color; 0ms VOT = red; 50ms VOT = blue; example trials shown for visual simplicity) in each of two example VOT-sensitive electrodes (e1: voiceless-selective; e2: voiced-selective; same electrodes as shown in Figure 1 of the main text). Black dots indicate the peak high-gamma amplitude and latency for each trial. There is clear variation among single trials in the peak’s timing and amplitude. middle: The latency of the peak, tp, (in seconds) for each trial (n = 234 total trials; color of circles corresponds to trial’s voicing category: /b/ = red; /p/ = blue) projected into a 2-dimensional space, with the vertical and horizontal dimensions representing the two example electrodes (e1 vs. e2). Trials were selected such that peaks occurred between 0 and 0.5 seconds after stimulus onset. This panel illustrates the lack of a reliable difference between voicing categories based on the peak latency. right: The amplitude of the peak, HGz(tp), for each trial projected into the same 2-dimensional space illustrates the highly reliable difference between voicing categories based on peak amplitude.
Author response image 2
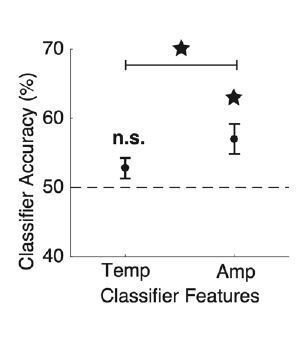
Peak amplitude outperforms peak latency in classifying single-trial voicing category.
For each participant, two classifier analyses were conducted to predict each trial’s voicing category using leave-one-out cross-validation. All speech-responsive electrodes for a given patient were included in both classifiers, but classifiers included only either temporal [Temp; peak latency = tp] or amplitude [Amp; peak amplitude = HGz(tp)] features. Across participants, only amplitude features performed better than chance (chance = 50%), and amplitude features performed significantly better than temporal features (ps < 0.01; Wilcoxon signed-rank tests). Error bars represent standard error across participants.
Additional files
-
Supplementary file 1
Table of experimental summary statistics for each participant.
Each participant had ECoG grid coverage of one hemisphere (Hem), either left (LH) or right (RH). Participants completed as many trials as they felt comfortable with. Number of trials per participant for ECoG analyses indicate trials remaining after artifact rejection. Some participants chose to listen passively to some or all blocks, so three participants have no trials for behavioral analyses. See Materials and methods for description of inclusion criteria for individual trials in ECoG and behavioral analyses. A subset of speech-responsive (SR) electrodes on the lateral surface of the temporal lobe had a peak amplitude that was sensitive to VOT, selectively responding to either voiceless (V-) or voiced (V+) stimuli. See Materials and methods for details on electrode selection.
- https://cdn.elifesciences.org/articles/53051/elife-53051-supp1-v2.docx
-
Supplementary file 2
Table of activation parameters for each model node.
= minimum activation level. = maximum activation level. = resting activation level. = decay rate. = propagation threshold.
- https://cdn.elifesciences.org/articles/53051/elife-53051-supp2-v2.docx
-
Supplementary file 3
Table illustrating timing of 6 simulated model inputs.
The table is sparse, meaning that inputs to both Burst and Voicing detector units are 0 whenever a cell is blank. Inputs are clamped onto either Burst or Voicing detector units (always with strength = 1) for a given simulated VOT stimulus during the cycles that are labeled with a B or a V.
- https://cdn.elifesciences.org/articles/53051/elife-53051-supp3-v2.docx
-
Transparent reporting form
- https://cdn.elifesciences.org/articles/53051/elife-53051-transrepform-v2.pdf
Download links
A two-part list of links to download the article, or parts of the article, in various formats.
Downloads (link to download the article as PDF)
Open citations (links to open the citations from this article in various online reference manager services)
Cite this article (links to download the citations from this article in formats compatible with various reference manager tools)
Transformation of a temporal speech cue to a spatial neural code in human auditory cortex
eLife 9:e53051.
https://doi.org/10.7554/eLife.53051


