Optimization of energy state transition trajectory supports the development of executive function during youth
- Departments of Psychiatry, University of Pennsylvania, United States
- Departments of Bioengineering, University of Pennsylvania, United States
- Department of Psychological and Brain Sciences, Indiana University, United States
- Department of Computer Science, University of Electronic Science and Technology, China
- Departments of Biostatistics, Epidemiology and Informatics, University of Pennsylvania, United States
- Departments of Electrical and Systems Engineering, University of Pennsylvania, United States
- Department of Mechanical Engineering, University of California, United States
- Departments of Physics and Astronomy and Neurology, University of Pennsylvania, United States
- Departments of Neurology, University of Pennsylvania, United States
- Santa Fe Institute, United States
Figures
Figure 1 with 3 supplements
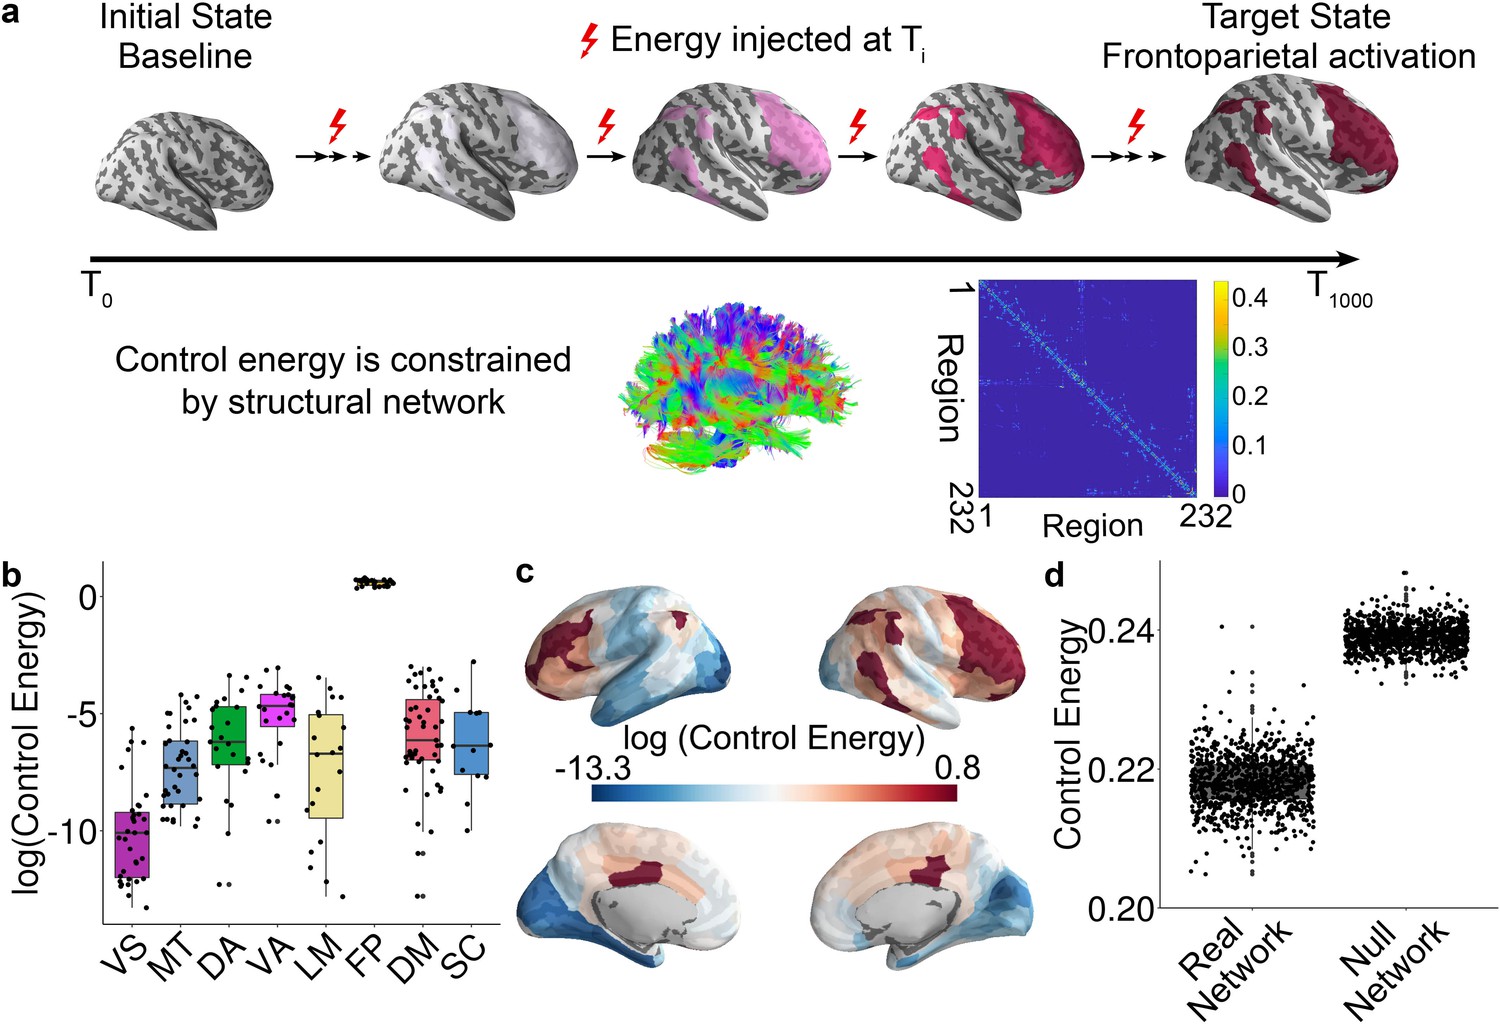
Schematic of the network control approach and the estimation of control energy.
(a) From a baseline state, we calculated the control energy required to reach a fronto-parietal activation target state. This transition was calculated for each subject based on their structural brain network, which was estimated using diffusion imaging and probabilistic tractography. (b) The average energetic costs to reach the fronto-parietal activation target state varied by cognitive system, with the largest energetic costs being present in the fronto-parietal control network and the ventral attention network. (c) The regional control energy required to reach the fronto-parietal activation target. (d) The control energy cost of a transition to the fronto-parietal activation target state was significantly lower in real brain networks than in null model networks where the strength and degree distribution were preserved.
Figure 1—figure supplement 1

Sample construction.
The cross-sectional sample of the Philadelphia Neurodevelopmental Cohort (PNC) has 1601 participants in total. 340 subjects were excluded owing to clinical factors, such as medical disorders. Then, 312 subjects were excluded because of low quality of T1 or diffusion data, incomplete diffusion data, lacking of field map. Finally, three subjects were excluded due to incomplete image coverage during brain parcellation. The final sample consisted of the remaining 946 subjects.
Figure 1—figure supplement 2
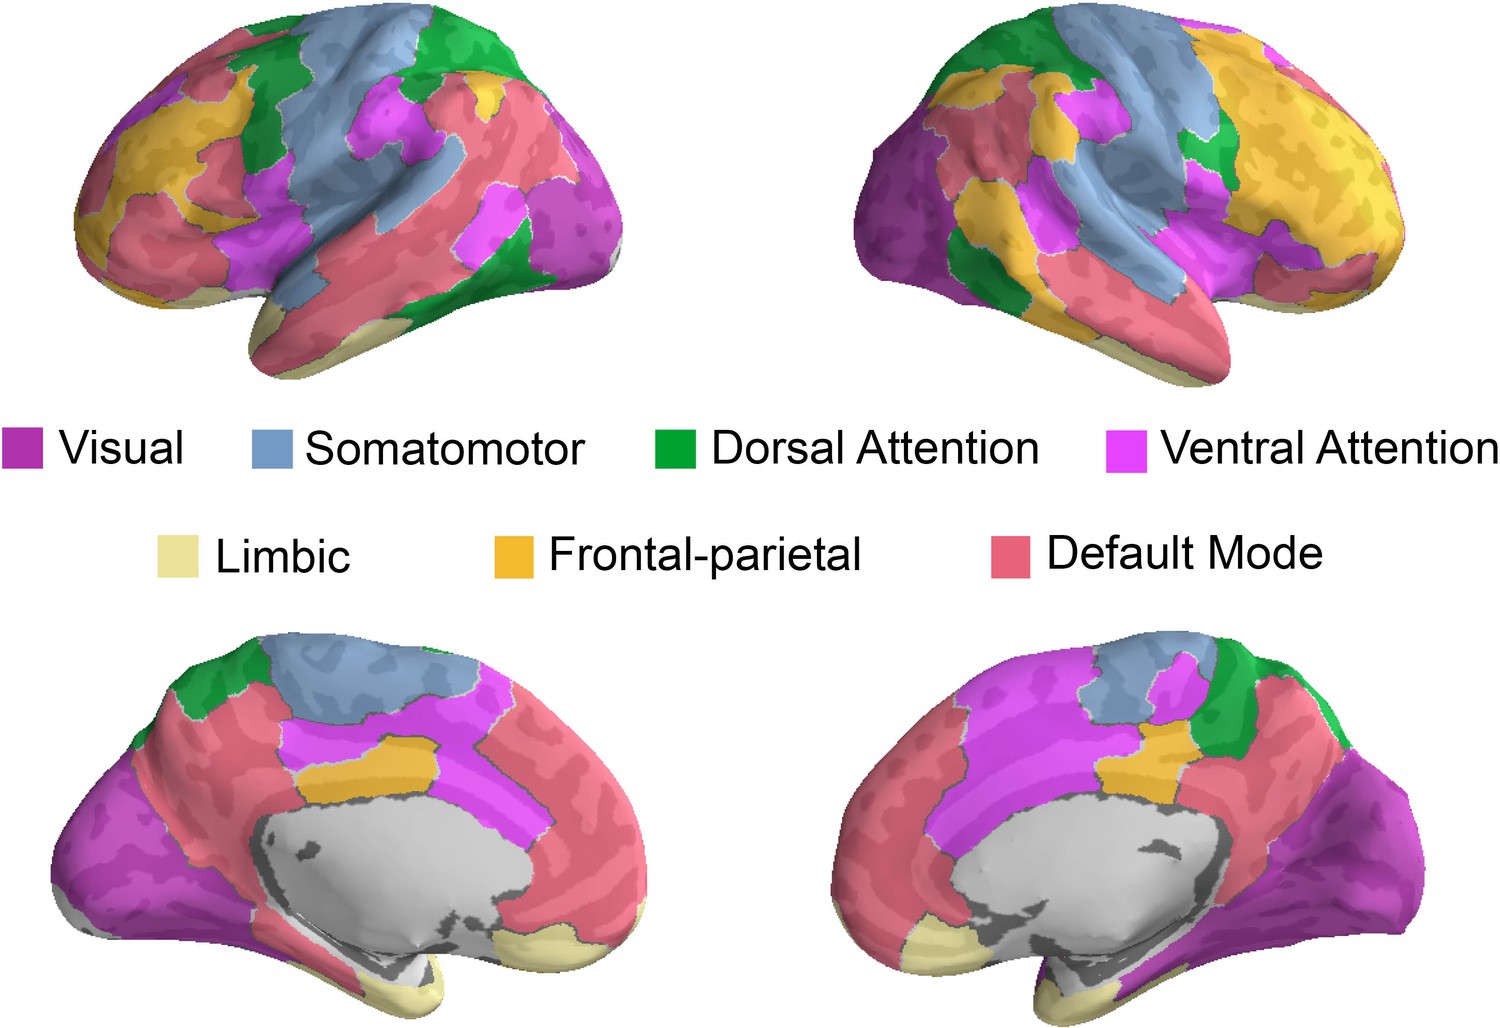
Functional brain networks defined by Yeo et al. (2011).
Each parcel was mapped to one of these networks.
Figure 1—figure supplement 3
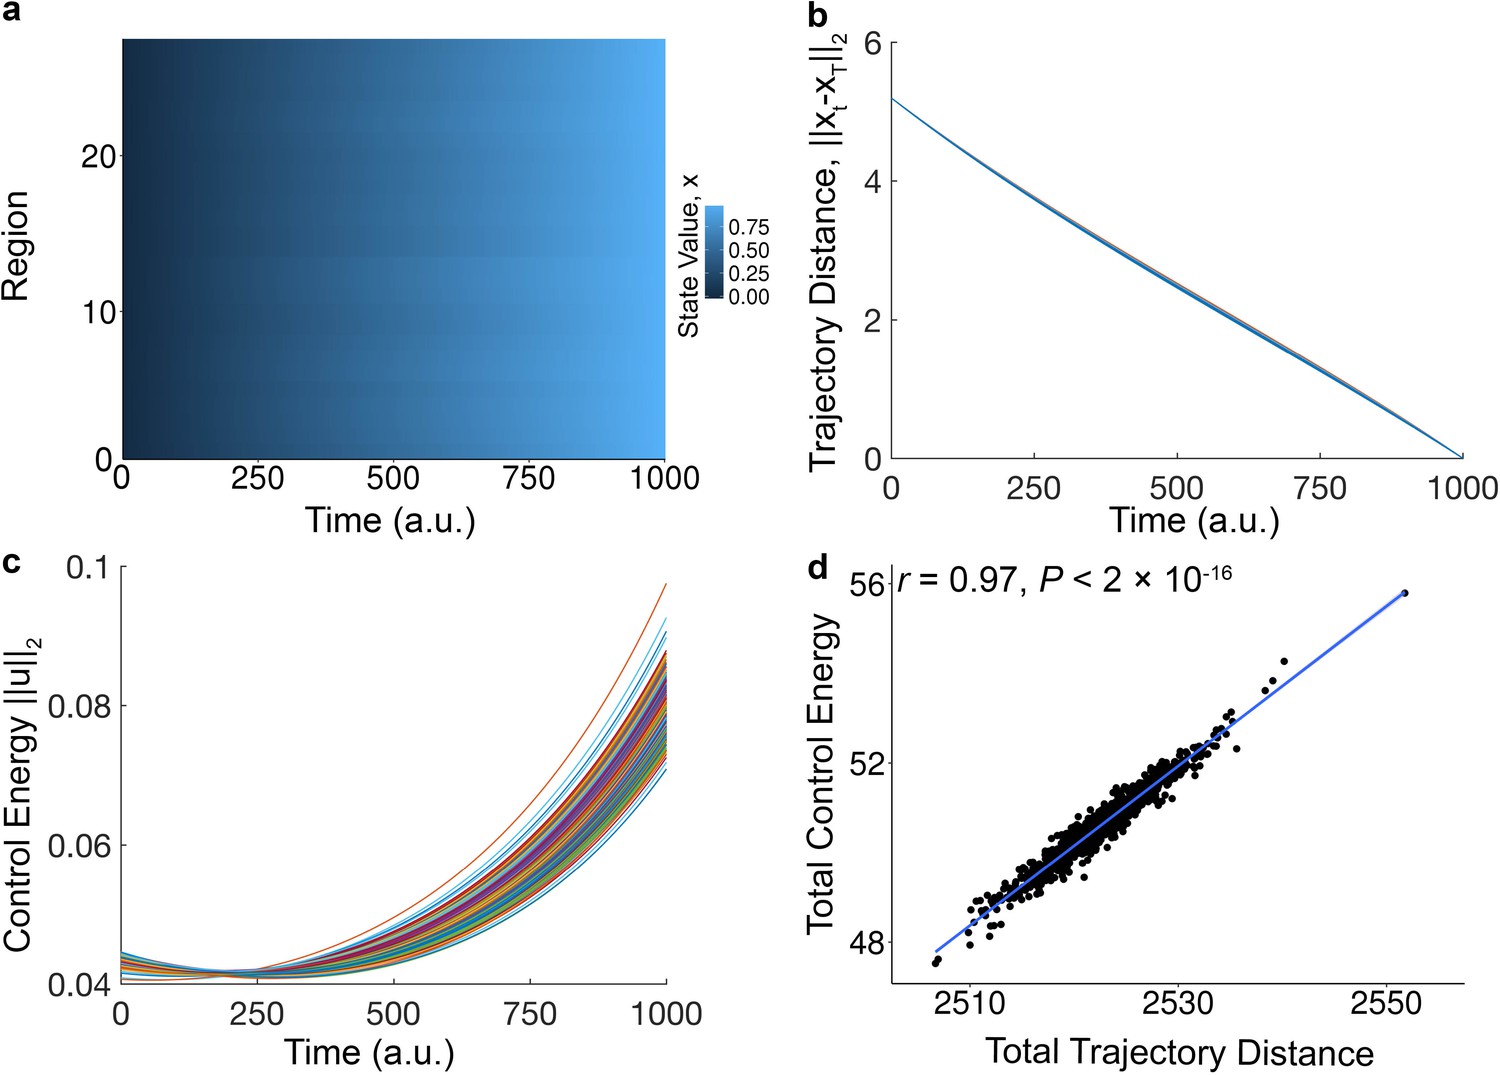
Relationship between trajectory distance and control energy.
(a) The activation profiles of all 27 brain regions of the fronto-parietal system during an optimal trajectory from the baseline state to the final state. We define the final state to be a vector in which elements corresponding to the 27 regions of the fronto-parietal system are set to 1, and all other elements are set to 0. The activity magnitudes vary by region and by time. The trajectory here is the average of trajectory over all subjects. (b) For each subject, the Euclidean distance from the current state x(t) to the target state x(T) decreases with time. The final distance to the target state was 0, indicating that all subjects reached the target state. Each line represents a different subject. (c) For each subject, the total control energy cost of all brain regions at a particular time point increases with time. Each line represents a different subject. (d) We observe a tight correlation between the total trajectory distance and the total control energy across subjects (r = 0.97, p<2 × 10⁻¹⁶).
Figure 2 with 4 supplements
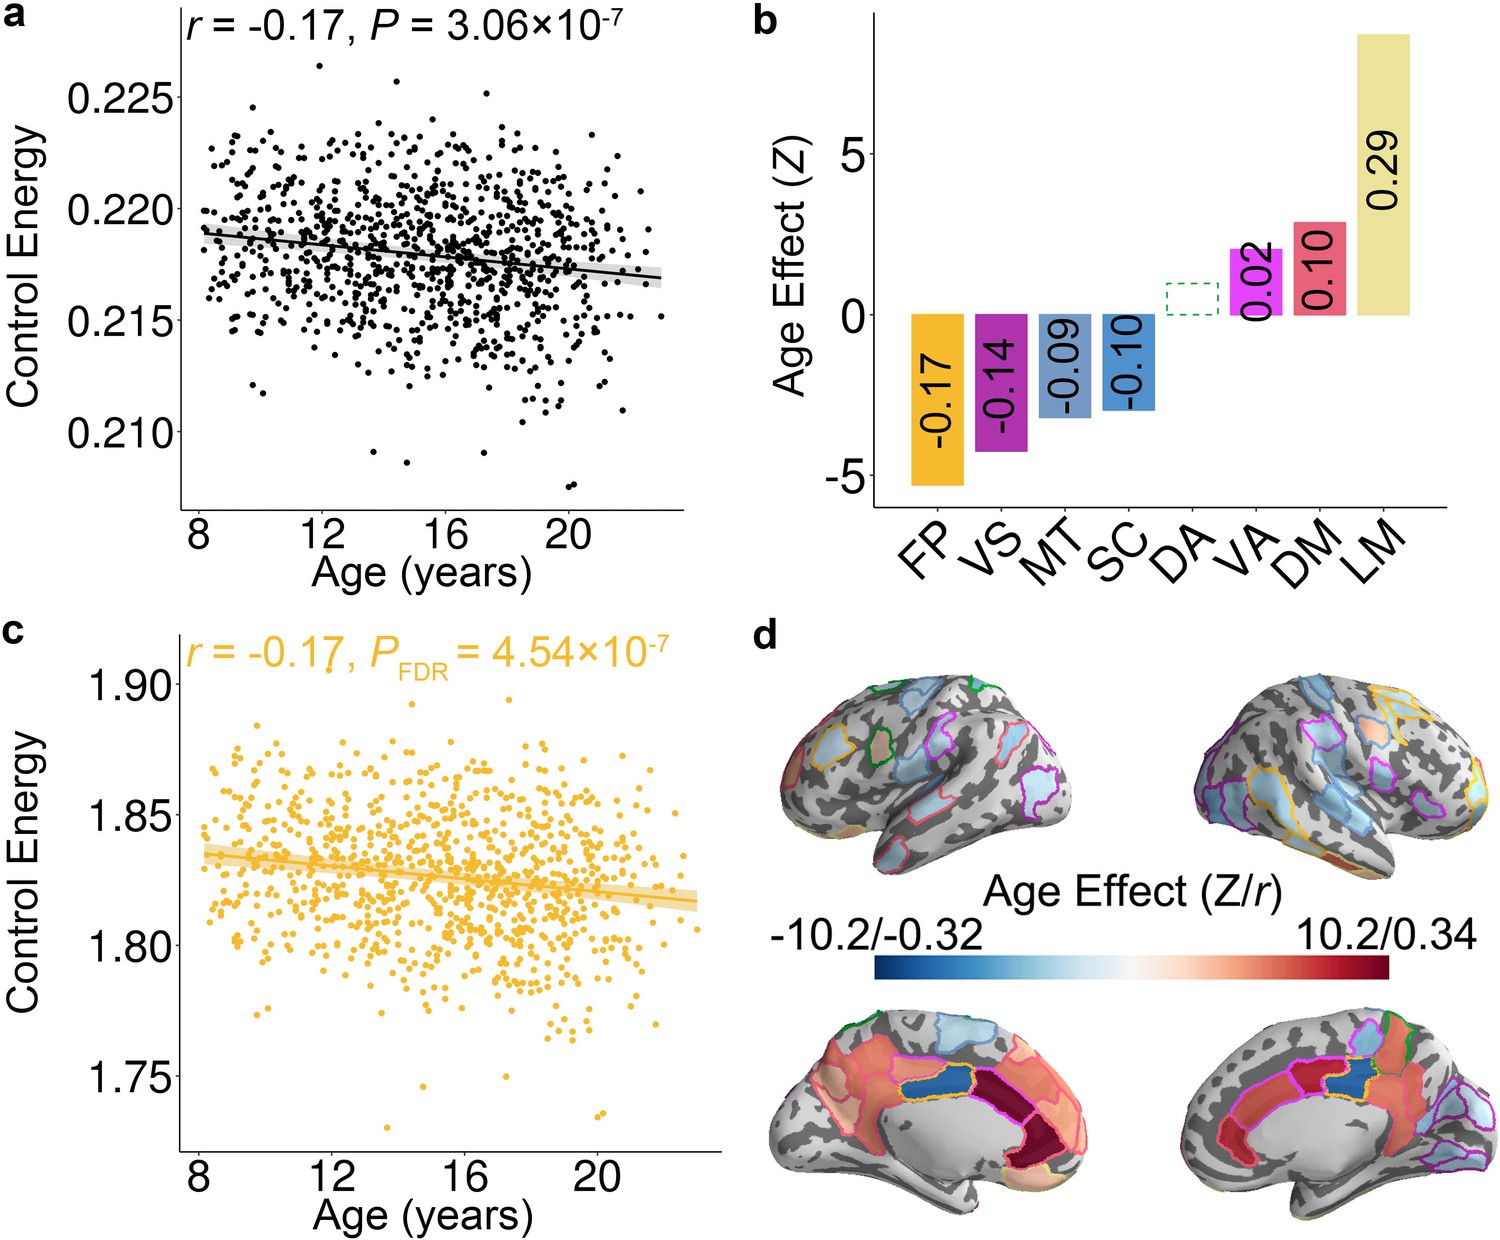
Control energy evolves with age in youth.
(a) The mean whole-brain control energy required to reach the fronto-parietal activation target declines with age. (b) Control energy declines significantly with age in the fronto-parietal, visual, motor and subcortical systems. In contrast, control energy increased in the ventral attention, default mode and limbic systems. For each system with a significant association, the effect size is reported (in each bar) as the partial correlation between system-level control energy and age while controlling for the covariates. There is one outlier in the scatter plot of ventral attention system (Figure 2—figure supplement 1c) and the age-related changes of control energy was not significant (p=0.11) in this system after removing the outlier. (c) The control energy of the fronto-parietal system declines significantly with age. (d) The age effect of control energy for each brain region. The color of the contour of each brain region represents the cognitive system for each region (see Figure 1—figure supplement 2). In the scatterplots shown in panels (a and c), data points represent each subject (n = 946), the bold line indicates the best fit from a general additive model, and the shaded envelope denotes the 95% confidence interval. It should be noted that Z value was derived from the general additive model, which captures both linear and nonlinear relationships; the partial correlation reflects only linear relationships. VS: visual; MT: motor; DA: dorsal attention; VA: ventral attention; LM: limbic; FP: fronto-parietal; DM: default mode; SC: subcortical.
Figure 2—figure supplement 1

Scatter plots of significant age effects of control energy at the system scale.
The control energy of (a) visual, (b) motor, and (f) subcortical systems decline significantly with age, while that of (c) ventral attention, (d) limbic and (e) default mode systems increase significantly with age. There is one outlier in the scatter plot of ventral attention system and the age-related changes of control energy was not significant (p=0.11) in this system after removing the outlier. Data points represent each subject (n = 946), the bold line indicates the best fit from a general additive model, and the shaded envelope denotes the 95% confidence interval. There is one outlier in the scatter plot of ventral attention system (panel c) and the age-related changes of control energy was not significant (p=0.11) in this system after removing the outlier.
Figure 2—figure supplement 2

Specificity and sensitivity analyses provide convergent results.
The effect size (i.e., partial correlation r) of the age effect of control energy at the whole-brain level and in the fronto-parietal system (a) with 100 different initial states, in which the activation value of regions in fronto-parietal follow the Gaussian distribution with a mean value of 0 and standard deviation of 0.1, and (b) with 100 different target states, in which the activation value of regions in fronto-parietal system follow the Gaussian distribution with a mean value of 1 and standard deviation of 0.1. (c) The distribution of the age effect of average control energy of whole-brain and fronto-parietal systems when using null model networks, which preserve the degree and strength distribution. The null networks were created by brain connectivity toolbox (Rubinov and Sporns, 2010). The red arrow indicates the actual age effect estimated using the data from the real brain network. (d), The whole-brain control energy cost to activate the fronto-parietal system when constraining the whole brain was highly significantly correlated with the energy cost when only the fronto-parietal system was constrained (r = 0.94, p<2 × 10⁻¹⁶). (e), Left: the energy required to reach a motor activation state was significantly higher for null networks than real networks. Right: the whole brain average control energy did not change over the age range studied.
Figure 2—figure supplement 3
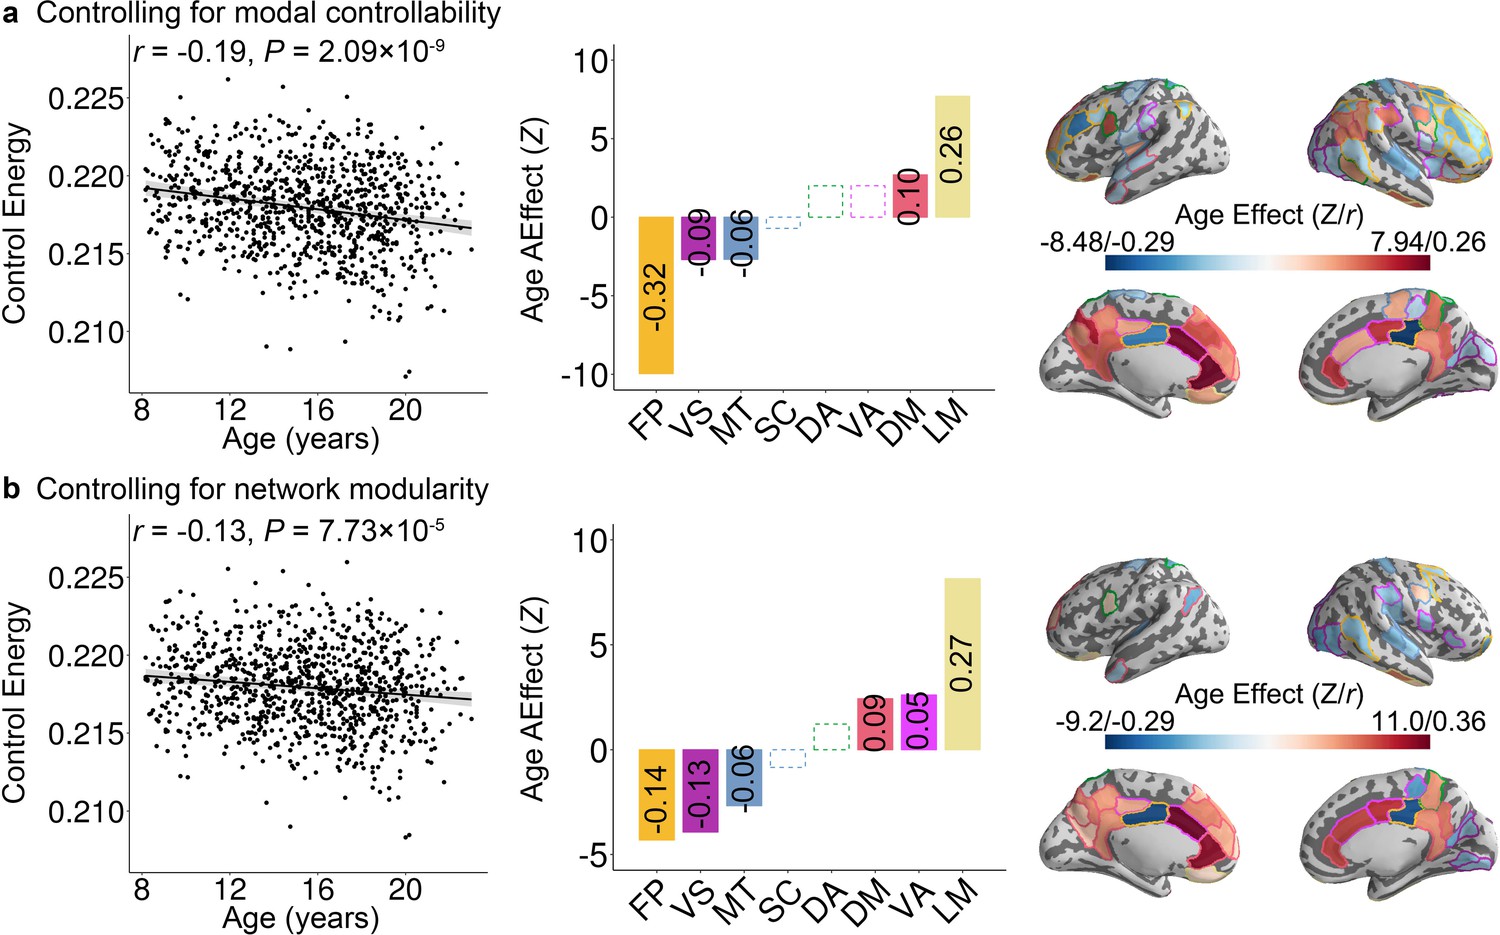
Age effects at the whole brain, cognitive system, and nodal levels remain after controlling for the (a) modal controllability and (b) network modularity.
For each system with a significant association, the effect size is reported (in each bar) as the partial correlation between system-level control energy and age while controlling for the covariates. It should be noted that Z values reflect both linear and nonlinear relationships with age, while effect size is reported using a partial correlation, which reflects only linear relationships. VS: visual; MT: motor; DA: dorsal attention; VA: ventral attention; LM: limbic; FP: fronto-parietal; DM: default mode; SC: subcortical.
Figure 2—figure supplement 4
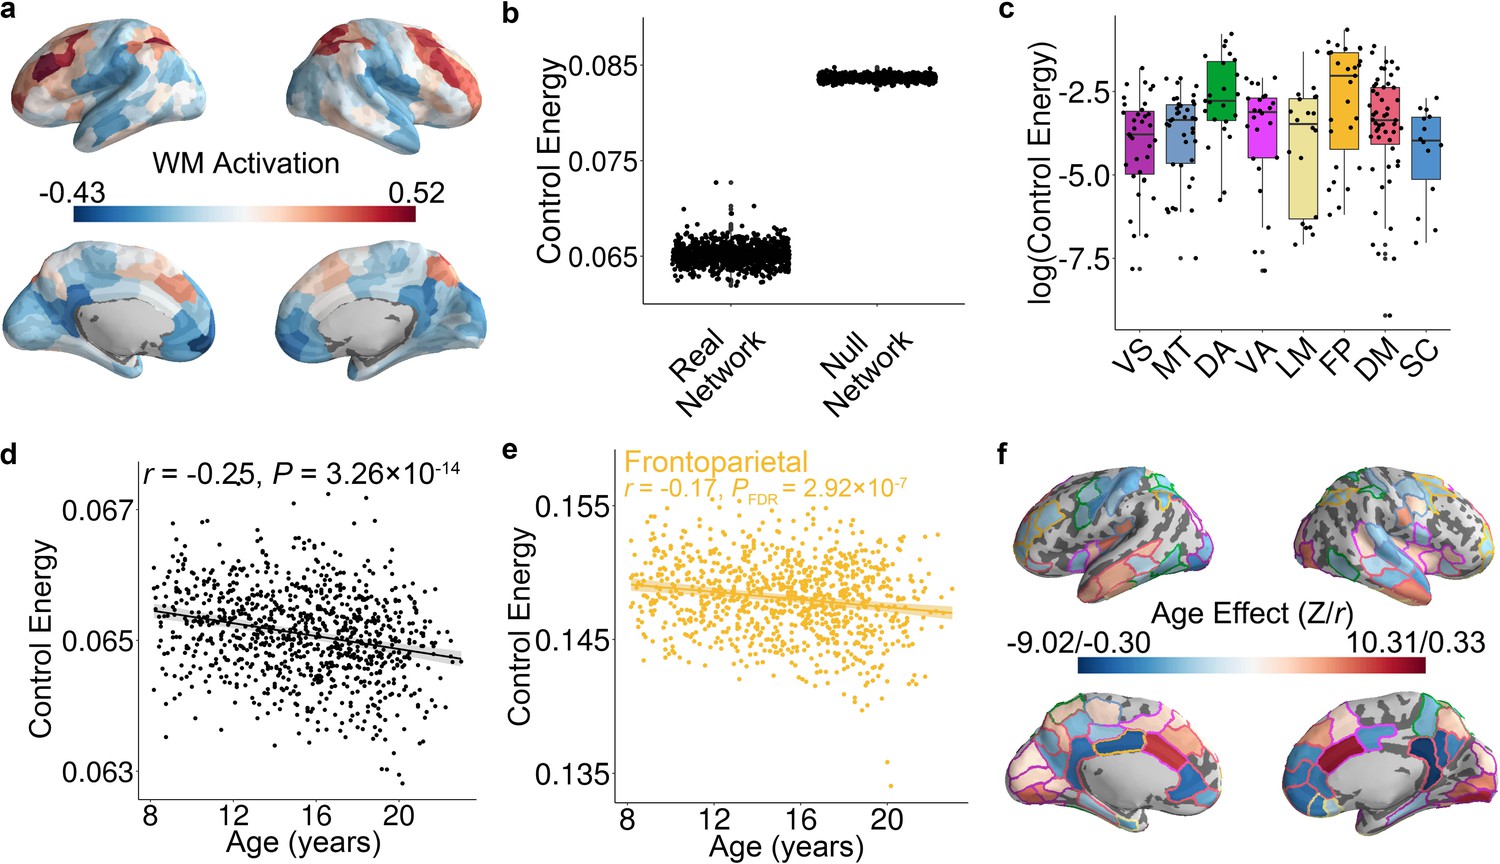
Convergent results from a target state defined by a working memory task that recruits the fronto-parietal system.
(a) Alternative target state, defined by the 2-back >0-back contrast on the fractal n-back working memory task (see Satterthwaite et al., 2013). (b) As in the main results, the control energy cost to reach this alternative target state was significantly lower using data from real networks than null networks. (c) Using this alternative target state, the control energy cost was highest in the fronto-parietal system. (d) As in the main results, the mean whole-brain control energy declines with age. (e) Similarly, the control energy of the fronto-parietal system declines significantly with age. (f) Nodal analyses of associations between age and control energy provide convergent results.
Figure 3 with 2 supplements
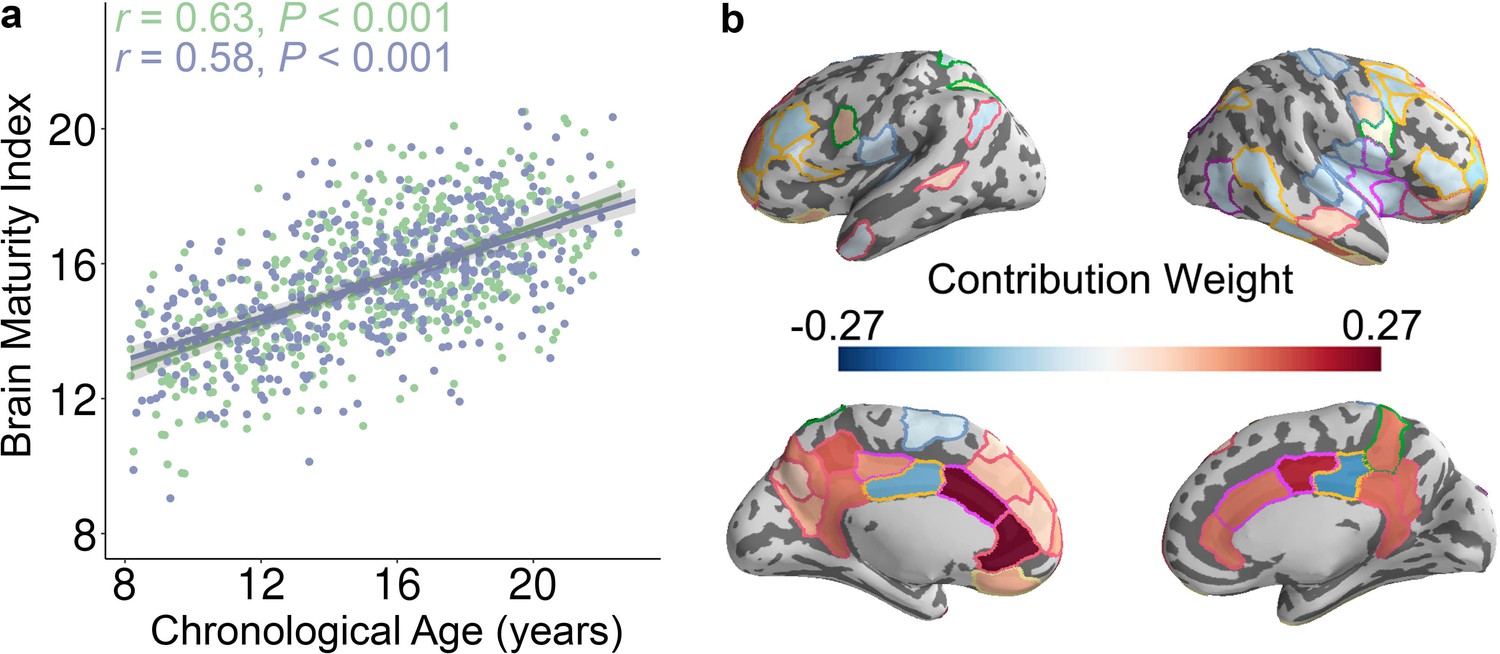
The whole-brain control energy pattern contains sufficient information to predict brain maturity in unseen individuals.
(a) The predicted brain maturity index was significantly related to the chronological age in a multivariate ridge regression model that used 2-fold cross validation (2F-CV) with nested parameter tuning. The complete sample of of subjects was divided into two subsets according to age rank. The blue color represents the best-fit line between the actual score of the first subset of subjects and their scores predicted by the model trained using the second subset of subjects. The green color represents the best-fit line between the actual score of the second subset of subjects and their scores predicted by the model trained using the first subset of subjects. (b) Regions with the highest contribution to the multivariate model aligned with mass-univariate analyses and included frontal, parietal, and temporal regions. We displayed the 79 regions with the highest contribution, to facilitate comparisons with mass-univariate analyses (where there were 79 regions with significant age effects).
Figure 3—figure supplement 1

Schematic overview of one outer loop of the nested 2-fold cross-validation (2F-CV) prediction framework.
All subjects were divided into 2 halves according to age rank, with the first half used as a training set and the second half used as a testing set. Each feature was linearly scaled between zero and one across the training dataset, and the scaling parameters were also applied to scale the testing dataset. An inner 2F-CV was applied within training set to select the optimal parameter. Based on the optimal , we trained a model using all subjects in the training set, and then used that model to predict the age of all subjects in the testing set.
Figure 3—figure supplement 2
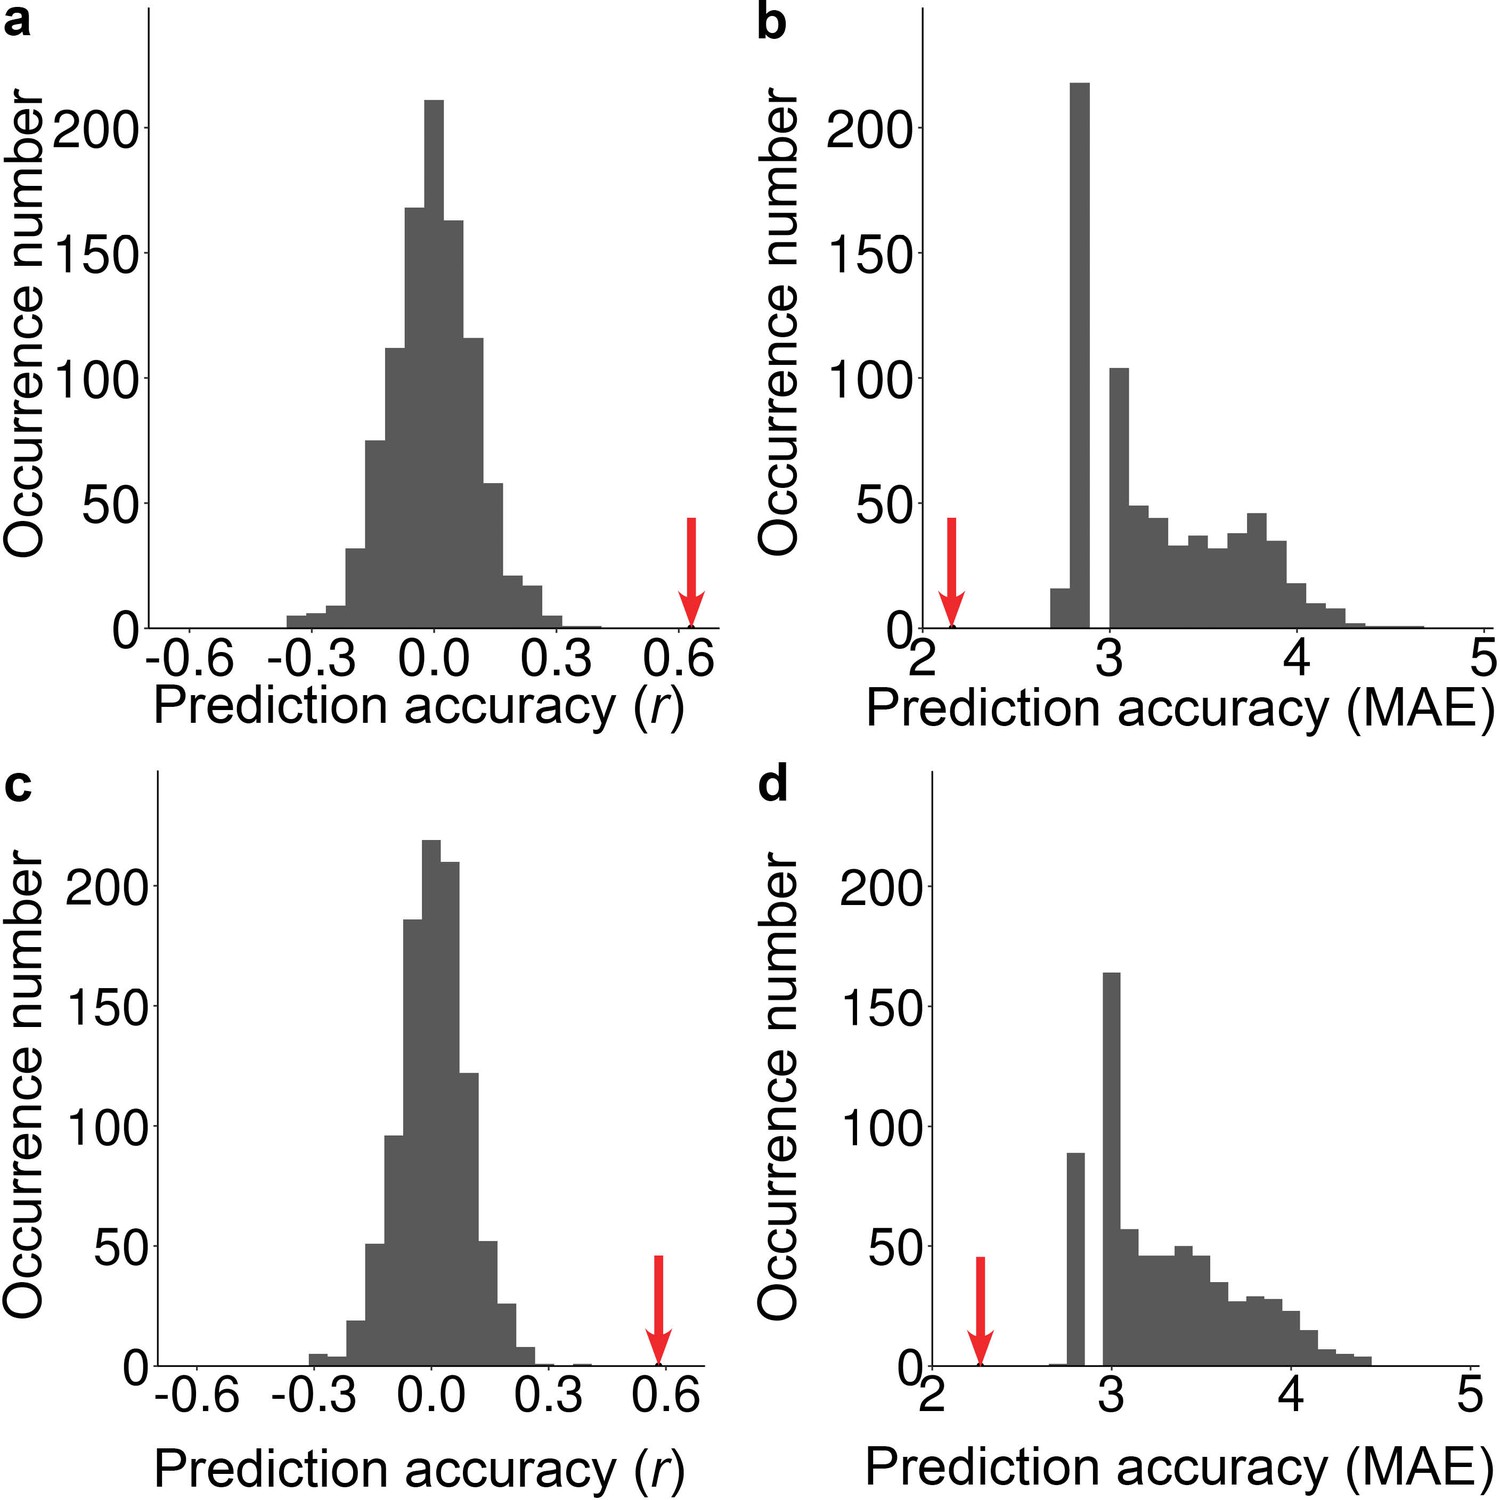
The histograms of the permutation distribution of the (a) correlation r and (b) MAE with the first subset used as a training set and the second subset used as a testing set, and (c) correlation r and (d) MAE with the first subset used as the testing set and the second subset used as training set.
The red arrow represents the actual prediction accuracy (i.e., r or MAE). The actual correlation r was significantly higher than expected by chance (p<0.001) and the actual MAE was significantly lower than expected by chance (p<0.001).
Figure 4
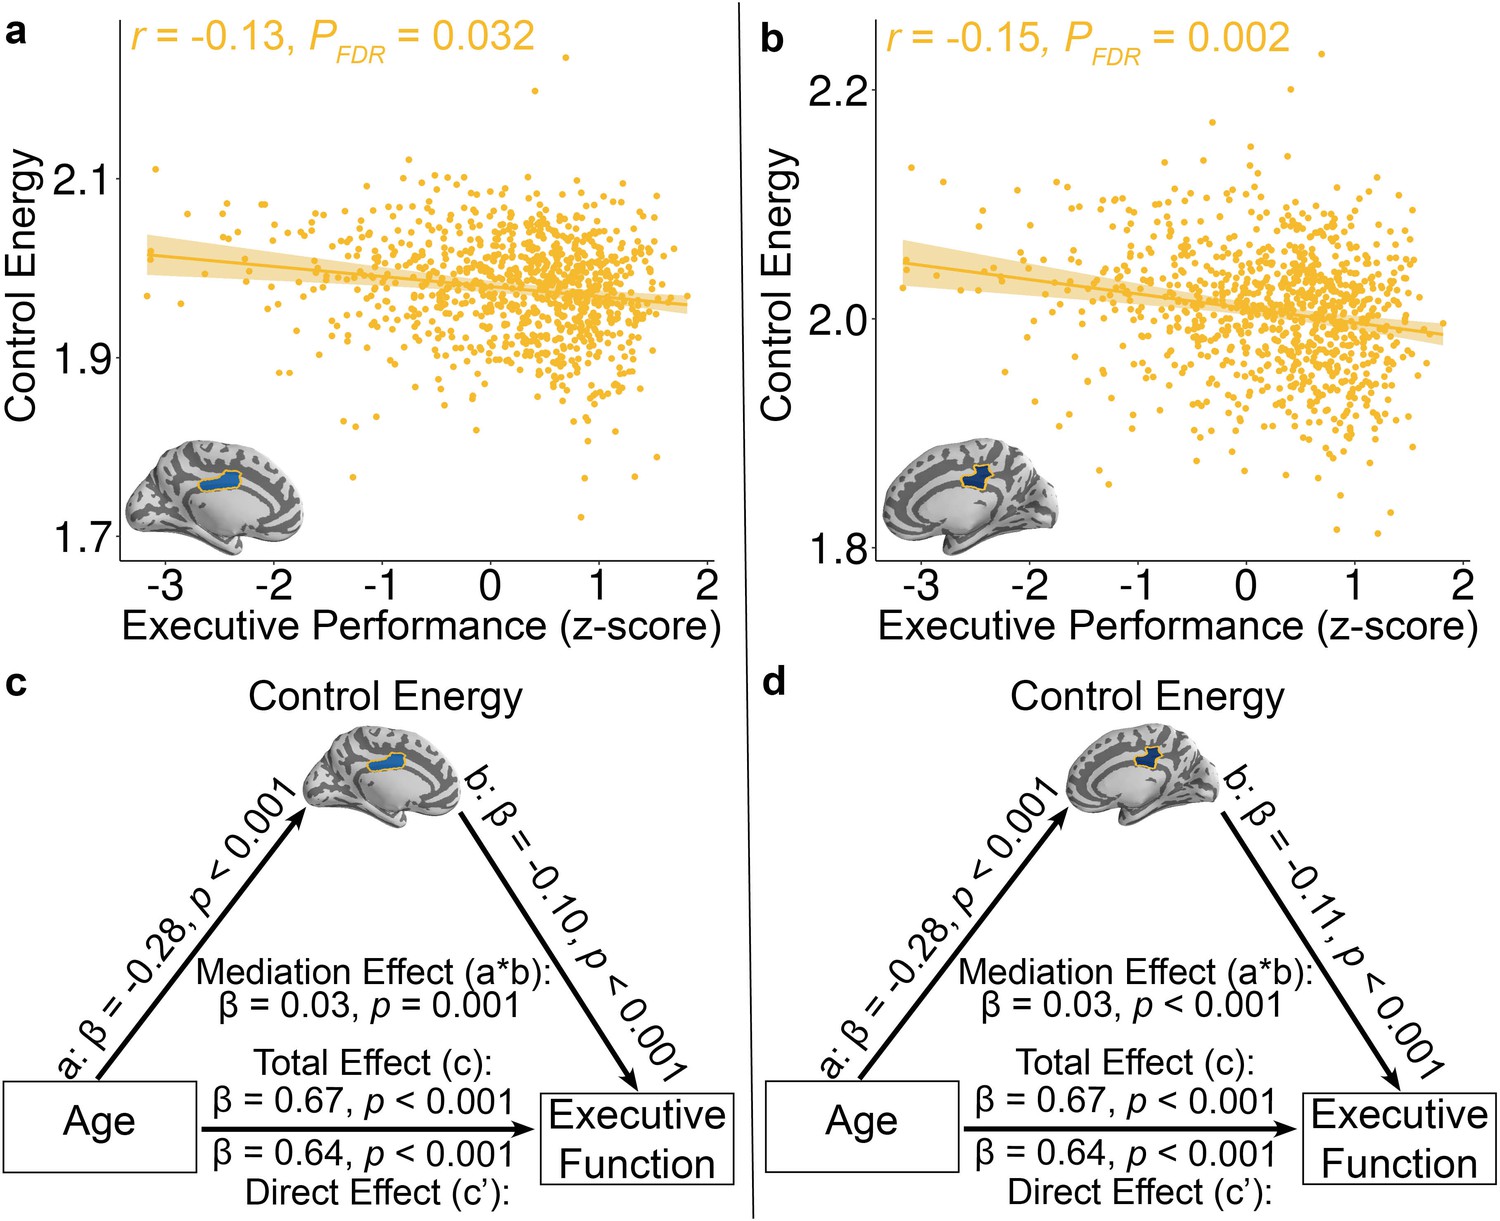
Reduced control energy in both the a, left and b, right mid-cingulate cortex was associated with higher executive performance.
Of all brain regions examined, only the left and right mid-cingulate cortex survived FDR correction. Data points represent each subject (n = 944), the bold line indicates the best linear fit, and the shaded envelope denotes the 95% confidence interval.The yellow color indicates that the two regions belong to the fronto-parietal system (Figure 1—figure supplement 2). The control energy of both (c) left and (d) right mid-cingulate cortex partially mediates the improvement of executive function with age. Significance of mediation effect was assessed using bootstrapped confidence intervals.
Additional files
Download links
A two-part list of links to download the article, or parts of the article, in various formats.
Downloads (link to download the article as PDF)
Open citations (links to open the citations from this article in various online reference manager services)
Cite this article (links to download the citations from this article in formats compatible with various reference manager tools)
Optimization of energy state transition trajectory supports the development of executive function during youth
eLife 9:e53060.
https://doi.org/10.7554/eLife.53060


