Mononuclear diploid cardiomyocytes support neonatal mouse heart regeneration in response to paracrine IGF2 signaling
- Department of Stem Cell Biology and Regenerative Medicine, University of Southern California Keck School of Medicine, United States
- Department of Regenerative Medicine and Cell Biology, Medical University of South Carolina, United States
- Department of Medicine Division of Cardiology, Medical University of South Carolina, United States
- Saban Research Institute, Children’s Hospital Los Angeles, United States
- Department of Cardiovascular Surgery, the First Affiliated Hospital of Guangzhou Medical University, China
- Department of Surgery, University of Southern California Keck School of Medicine, United States
- Department of Cell Biology, Neurobiology and Anatomy, and Cardiovascular Center, Medical College of Wisconsin, United States
Figures
Figure 1 with 1 supplement
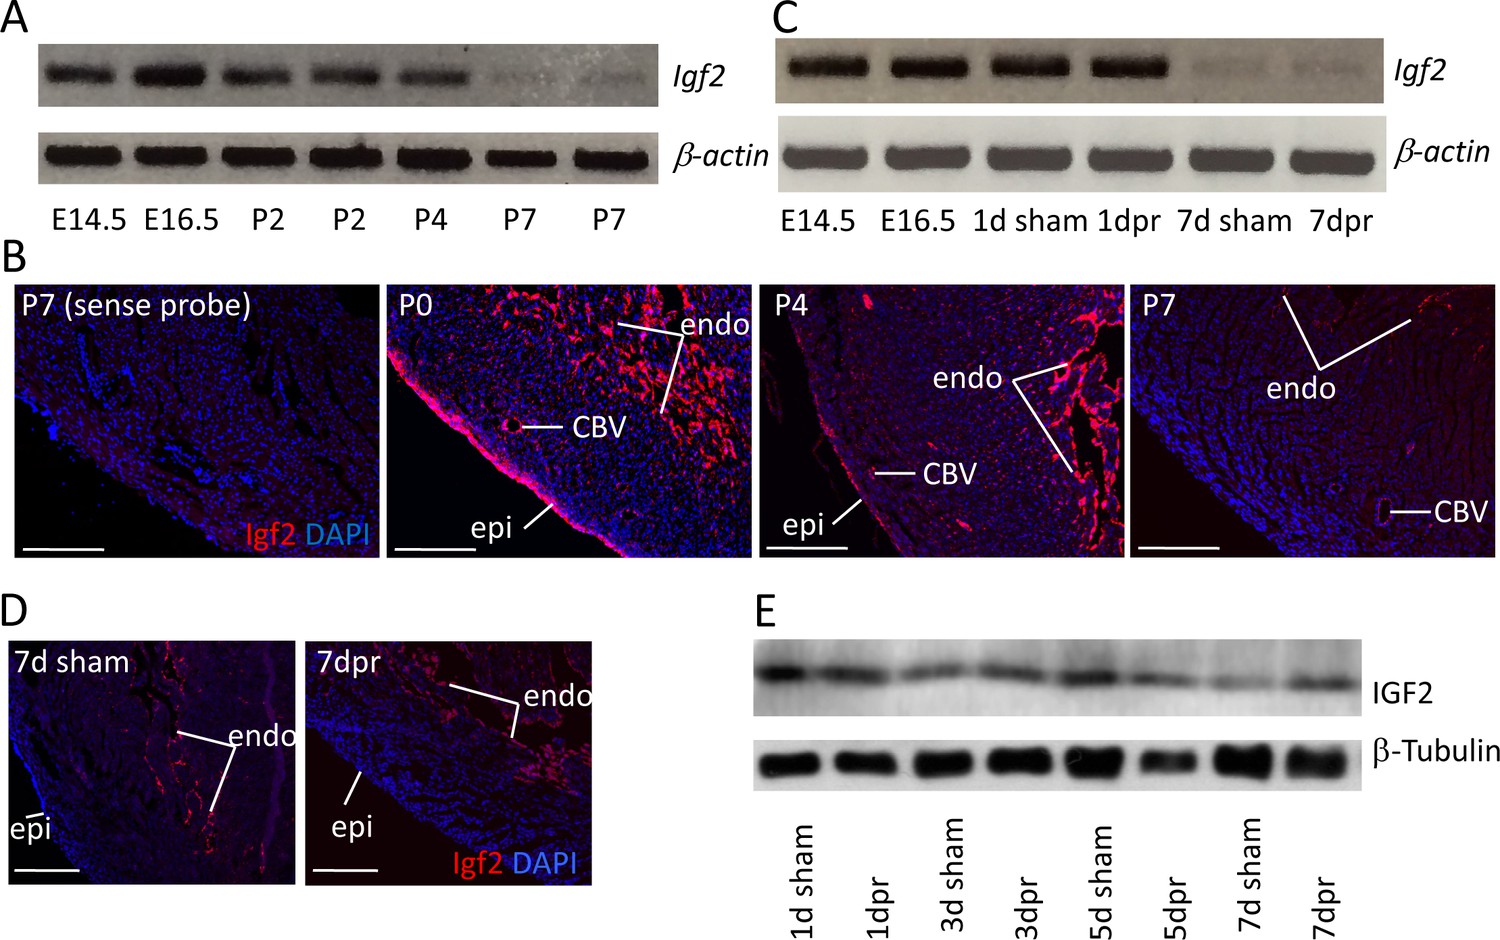
Igf2 expression.
(A) RT-PCR analysis of Igf2 mRNA level in whole ventricle tissue at embryonic (E) and postnatal (P) stages, using beta-actin as a reference for sample quality and quantity. (B) Igf2 expression in uninjured neonatal heart ventricle visualized by in situ hybridization (red signal). Expression is detected in epicardium (epi), endocardium (endo), and endothelium of coronary blood vessels (CBV). The first panel (sense probe) indicates the level of tissue background. (C) RT-PCR analysis showing that P1 apex resection injury does not change Igf2 expression at the RNA level at 1 day post resection (dpr) or at 7dpr, relative to sham operated mice. (D) In situ hybridization analysis showing that P1 apex resection injury does not change the spatial pattern of Igf2 expression at 7dpr. (E) Western blot of whole ventricle protein from sham-operated and resected hearts; quantitation of three independent blots (Figure 1—figure supplement 1B) shows no difference in IGF2 expression. Scale bars in panels B and D: 100µ.
Figure 1—figure supplement 1

Neonatal IGF2 expression.
(A) Igf2 expression detected by in situ hybridization in the uninjured postnatal heart, focusing on the decline of epicardial expression from P4 to P7. The same sections are shown with (upper) and without (lower) the cardiomyocyte staining channel for clarity. Scale bars: 500µ. (B) Quantification from three independent Western blots of IGF2 protein at 1, 3, 5, and 7 days after sham (s) or resection (r) surgery. To allow comparison between blots, the signals from 1 day sham operated hearts were defined as 1.0. (B’) Statistical analysis of the data of panel B.
Figure 2
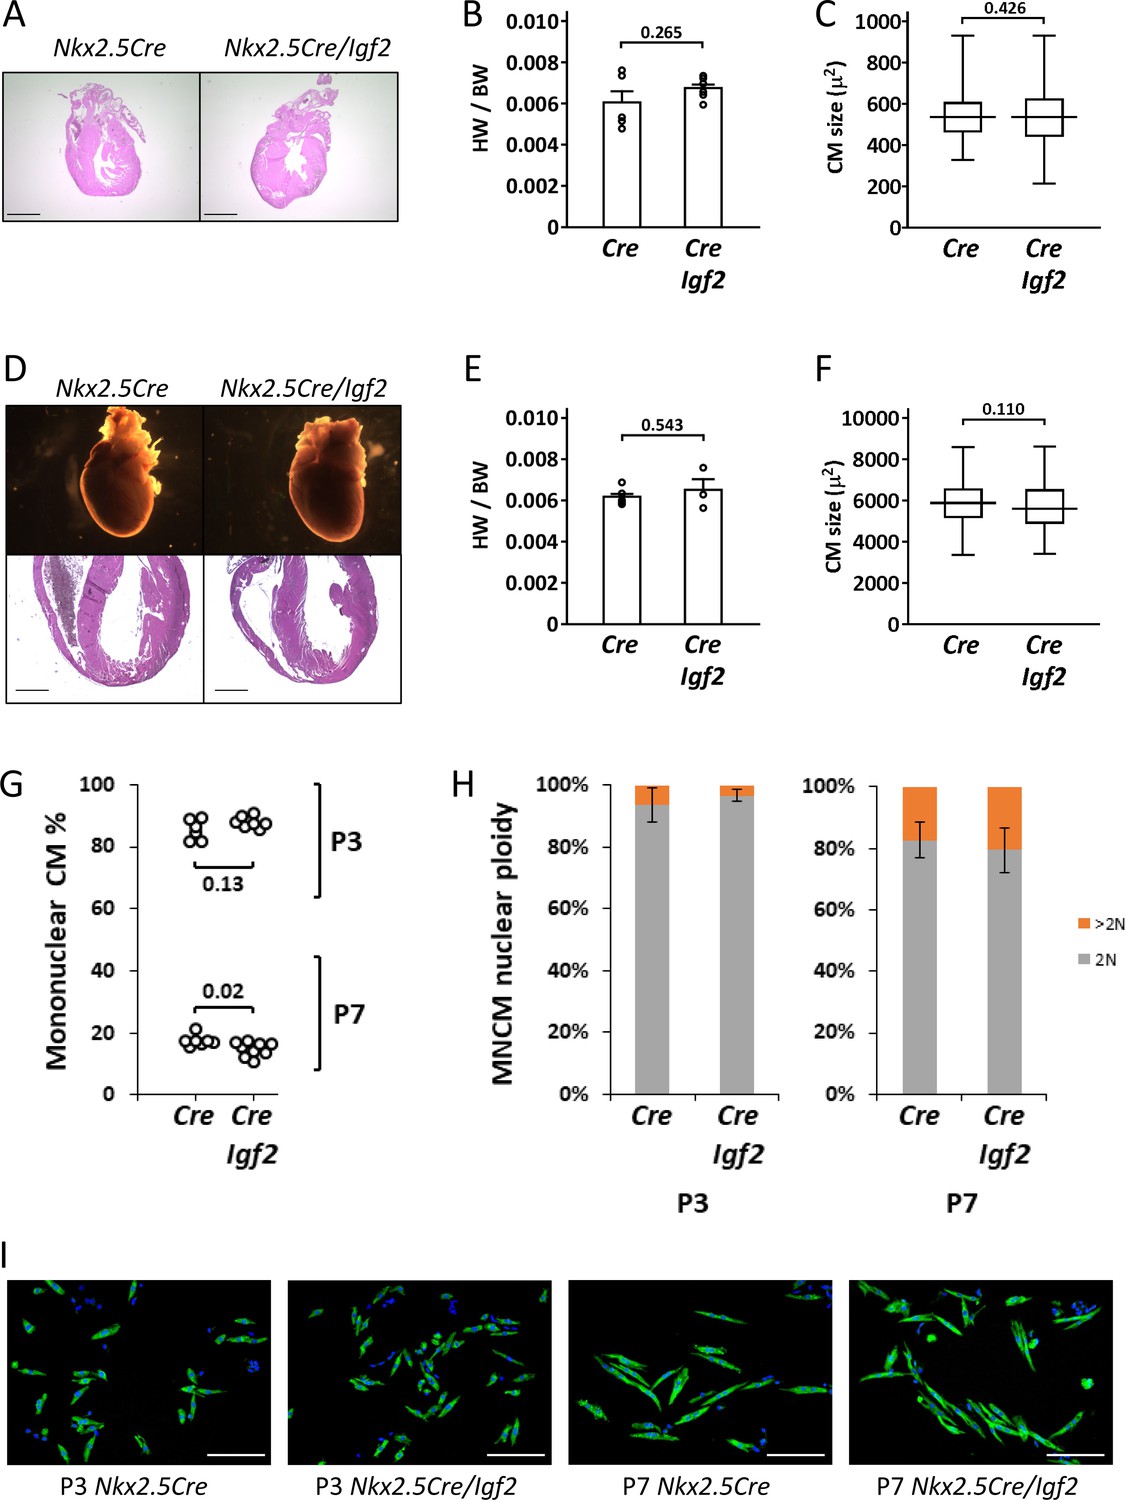
Normal parameters of cardiomyocyte biology in postnatal Nkx2.5-Cre/Igf2 mutants.
(A-C), at P1; D-F, at P21. (A,D) Histology showing normal heart morphology. Scale bars: 1 mm. (B,E) Calculation of heart weight to body weight ratio. Differences are not statistically significant. (C,F) Ventricular cardiomyocyte area shown as a box and whiskers plot (median, middle quartiles, and full range of the data indicated; no outliers excluded), based on n = 110 (Nkx2.5-Cre P1), n = 110 (Nkx2.5-Cre/Igf2 P1); n = 115 (Nkx2.5-Cre P21), n = 116 (Nkx2.5-Cre/Igf2 P21) cells. Differences are not statistically significant. (G,H) Calculation of ventricular mononuclear cardiomyocyte frequency (G) and the nuclear ploidy of the mononuclear cardiomyocyte subpopulation (H) in cellular preparations from neonates at P3 and P7 as indicated. All pups were on an identical B6AF1 genetic background. The measured difference in mononuclear cardiomyocyte percentage at P7 is statistically significant although of uncertain biological relevance (see text). Differences in nuclear ploidy are not statistically significant (at P3, p=0.19; at P7, p=0.38). (I) Images of cell preparations from the same analysis shown in panels G-H, stained for the cardiomyocyte marker TNNC (green) and DAPI to visualize nuclei; scale bar for all panels = 100µ.
Figure 3 with 1 supplement
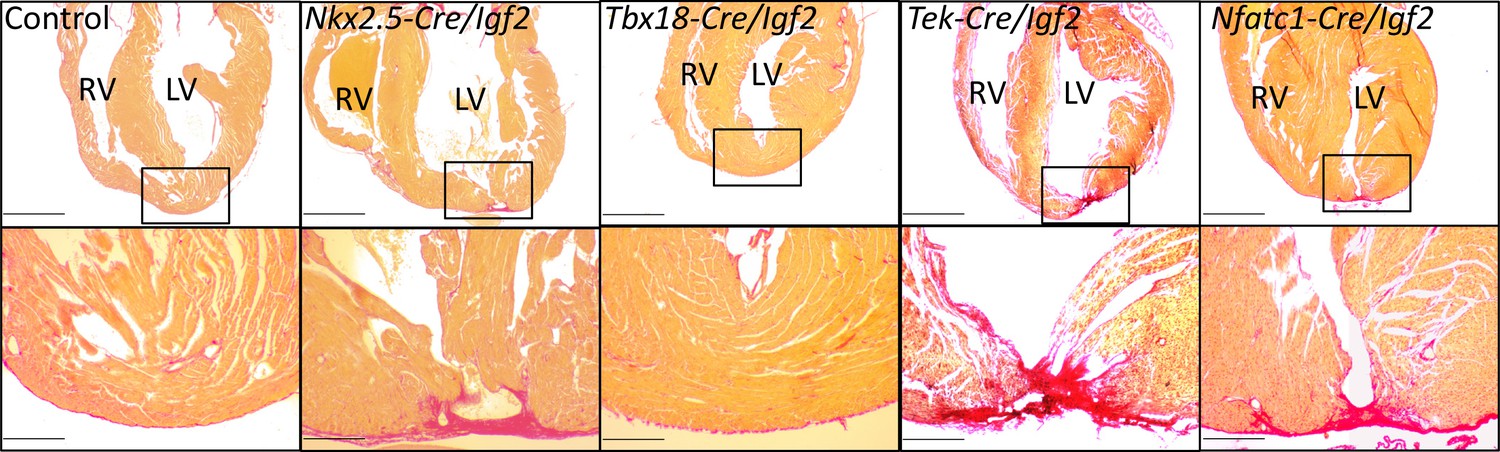
Representative examples of successful or failed regeneration at P21 after P1 apex resection in mice of different genotypes.
For each heart, serial sections were taken and stained with Sirius red to visualize collagen, and the section with the most extensive degree of staining at the injury site was used to define the degree of regeneration. Additional examples are shown in Figure 3—figure supplement 1, and all outcomes are compiled in Table 1. The boxed region in each upper panel is shown at higher magnification below. Scale bars: upper, 1 mm; lower, 200µ.
Figure 3—figure supplement 1
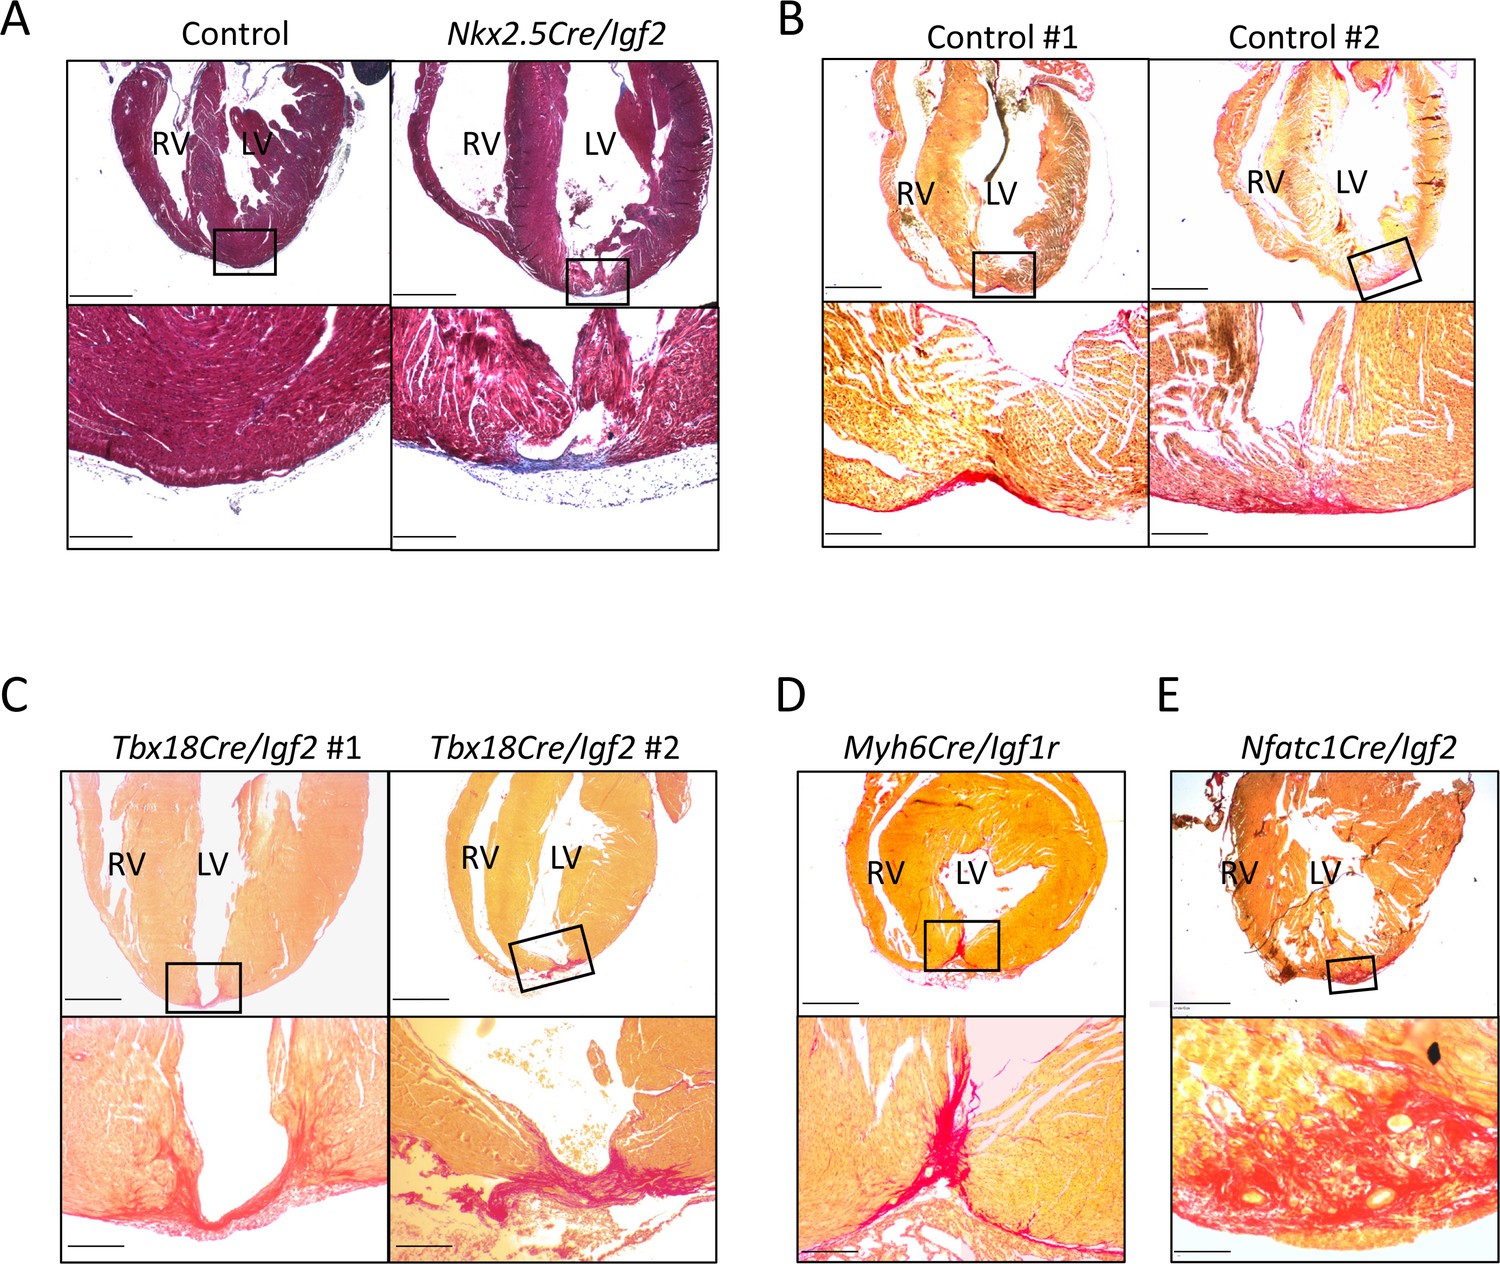
Additional examples of P21 hearts after P1 apex resection, to accompany Figure 3 and Table 1.
(A) A genetic control and an Nkx2.5-Cre/Igf2 mutant, stained with trichrome rather than Sirius red. Transmural scar (blue staining) is equally evident by this visualization. (B) Two genetic controls that were scored as having interspersed scar. (C) Both of the two Tbx18-Cre/Igf2 mutants that had transmural scar; this was an atypical outcome. (D) The one Myh6-Cre/Igf1r mutant showing transmural scar; this was an atypical outcome. (E) An Nfatc1-Cre/Igf2 mutant showing interspersed scar. This heart comes from a littermate of one of the mCAT transgenic rescued Nfatc1-Cre/Igf2 mutants shown in Figure 6B. Scale bars: upper panels, 1 mm; lower panels A-D, 200µ; lower panel E, 100µ.
Figure 4 with 3 supplements
INSR is required for neonatal heart regeneration.
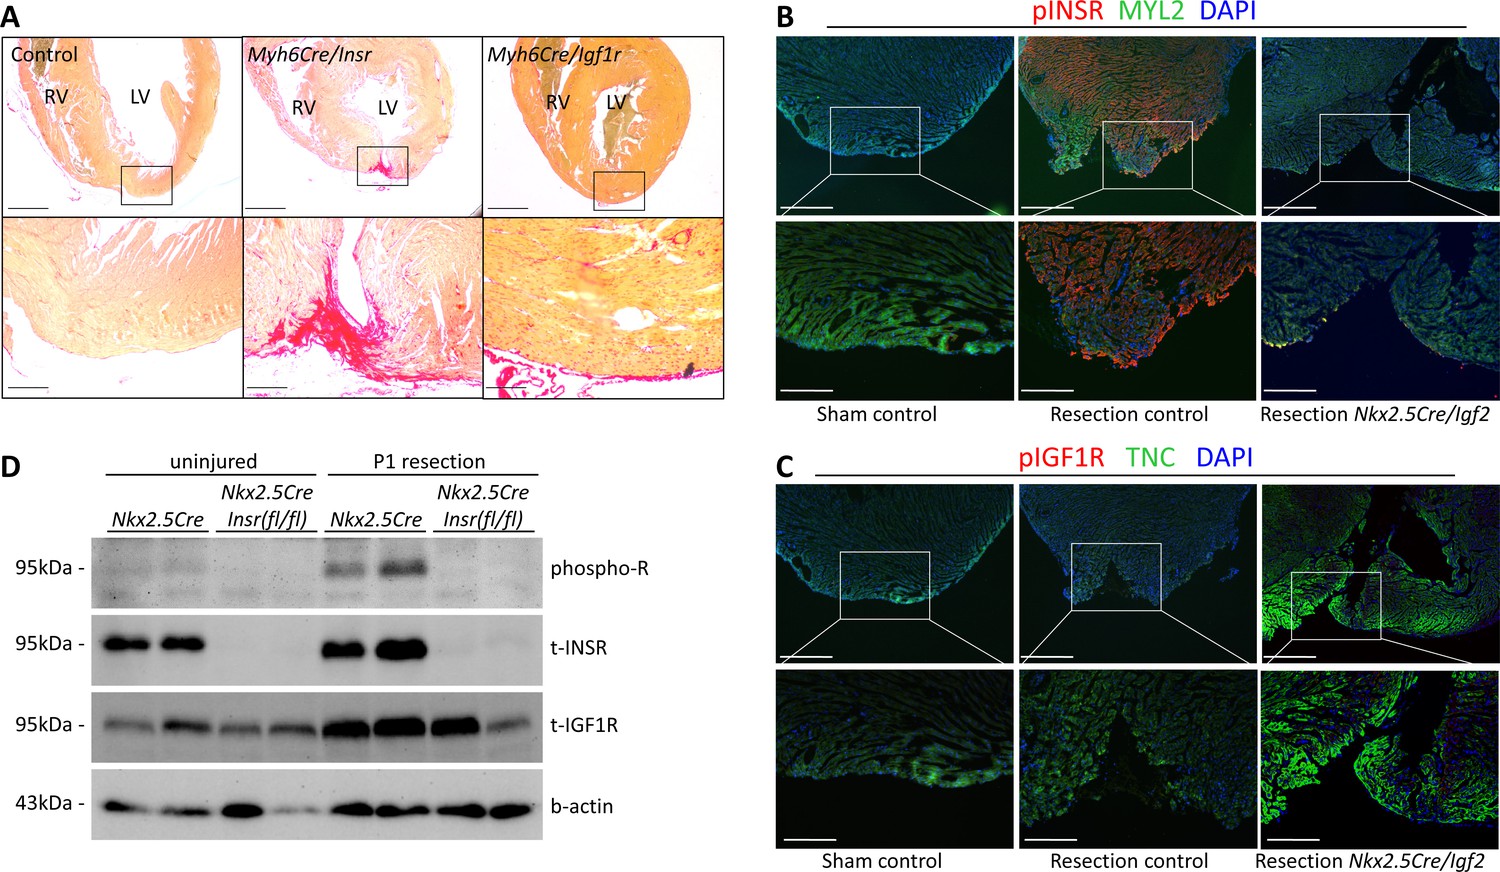
(A) Sirius red staining of P21 hearts after P1 resection, as in Figure 3. (B) Immunofluorescence detection of phosphorylated INSR at 7dpr is eliminated when Igf2 is conditionally mutated; there is no signal in the absence of injury (sham). (C) No detectable phosphorylation of IGF1R regardless of injury or Igf2 status in the 7dpr neonatal heart. Cardiomyocytes in B and C were labeled with antibodies for MYL2 (ventricular myosin light chain) or TNC (troponin C), respectively. See similar results at 3dpr for both INSR and IGF1R in Figure 4—figure supplements 1 and 2. A positive control for pIGF1R antibody quality is shown in Figure 4—figure supplement 3. (D) Western blot using ventricular lysates from P1 uninjured and resected hearts at 3dpr, comparing control to Insr conditional mutants. The phospho-specific antibody recognizes both pINSR and pIGF1R and so is labeled here simply as phospho-R. Antibodies uniquely recognizing total INSR and total IGF1R (both are approx. 95 kDa), and b-actin as a loading comparison, are also shown. The initial phospho-R blot was stripped and reprobed with the t-INSR antibody; a separate blot run at the same time using the same amount of sample was used for t-IGF1R and actin.
Figure 4—figure supplement 1

INSR activation after neonatal heart injury.
(A) Immunostaining for phosphorylated receptor 3dpr, similar result as at 7dpr shown in Figure 4B–C. (B) A high magnification view showing adjacent cardiomyocytes at 3dpr that are either positive (gray arrow) or negative (white arrow) for phospho-INSR staining. (C) pINSR staining is present throughout the myocardium at 7dpr after P1 injury. The heart and section shown here is the same as shown in the middle column of Figure 4B. Scale bars: upper row of A and first panel of C, 500µ; lower row of A and right panels of C, 100µ.
Figure 4—figure supplement 2
Confocal imaging of phospho-INSR staining at 3dpr.
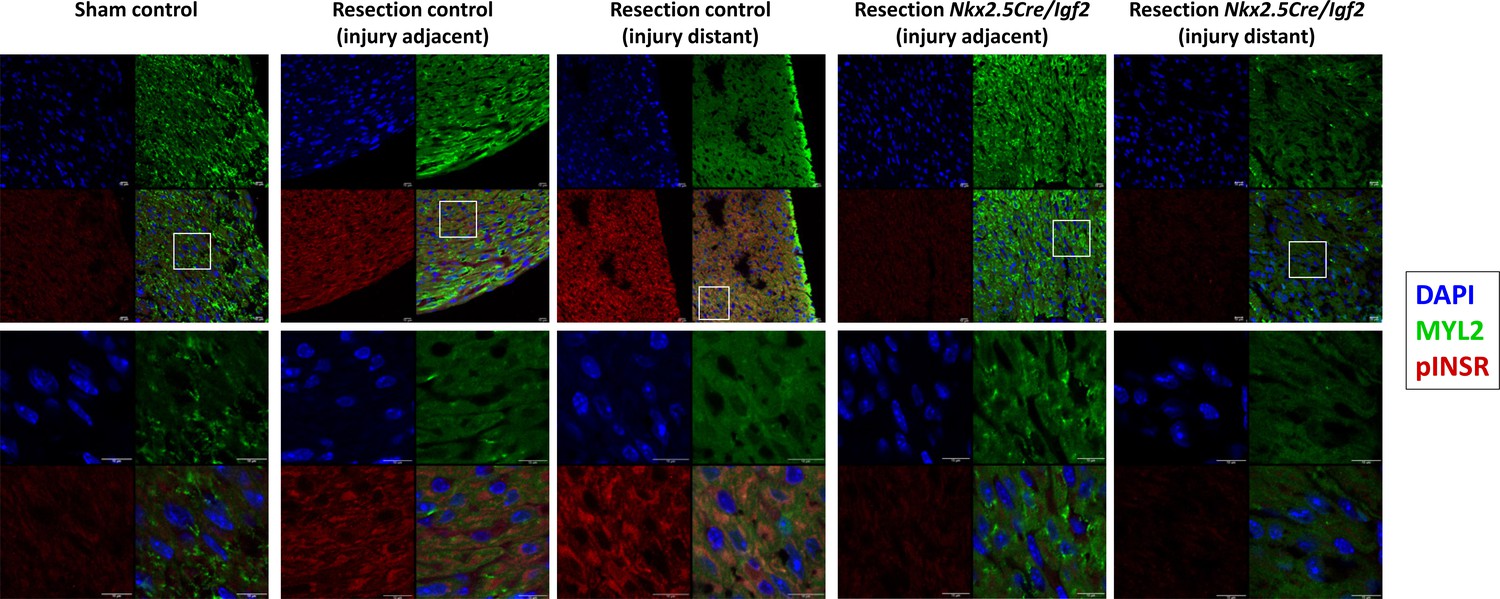
Low magnification images showing each individual channel (DAPI, Myl2, pINSR) and the merged image are grouped above, the boxed region in each is shown at higher magnification below. Scale bars in all panels are 10µ. The injured myocardium in the injury adjacent images are slightly beyond the frame of these images. As in Figure 4, note positive pINSR staining in resected control but not in uninjured (sham) control or in resected Nkx2.5-Cre/Igf2 mutant hearts.
Figure 4—figure supplement 3
IGF1R and INSR expression and activation.
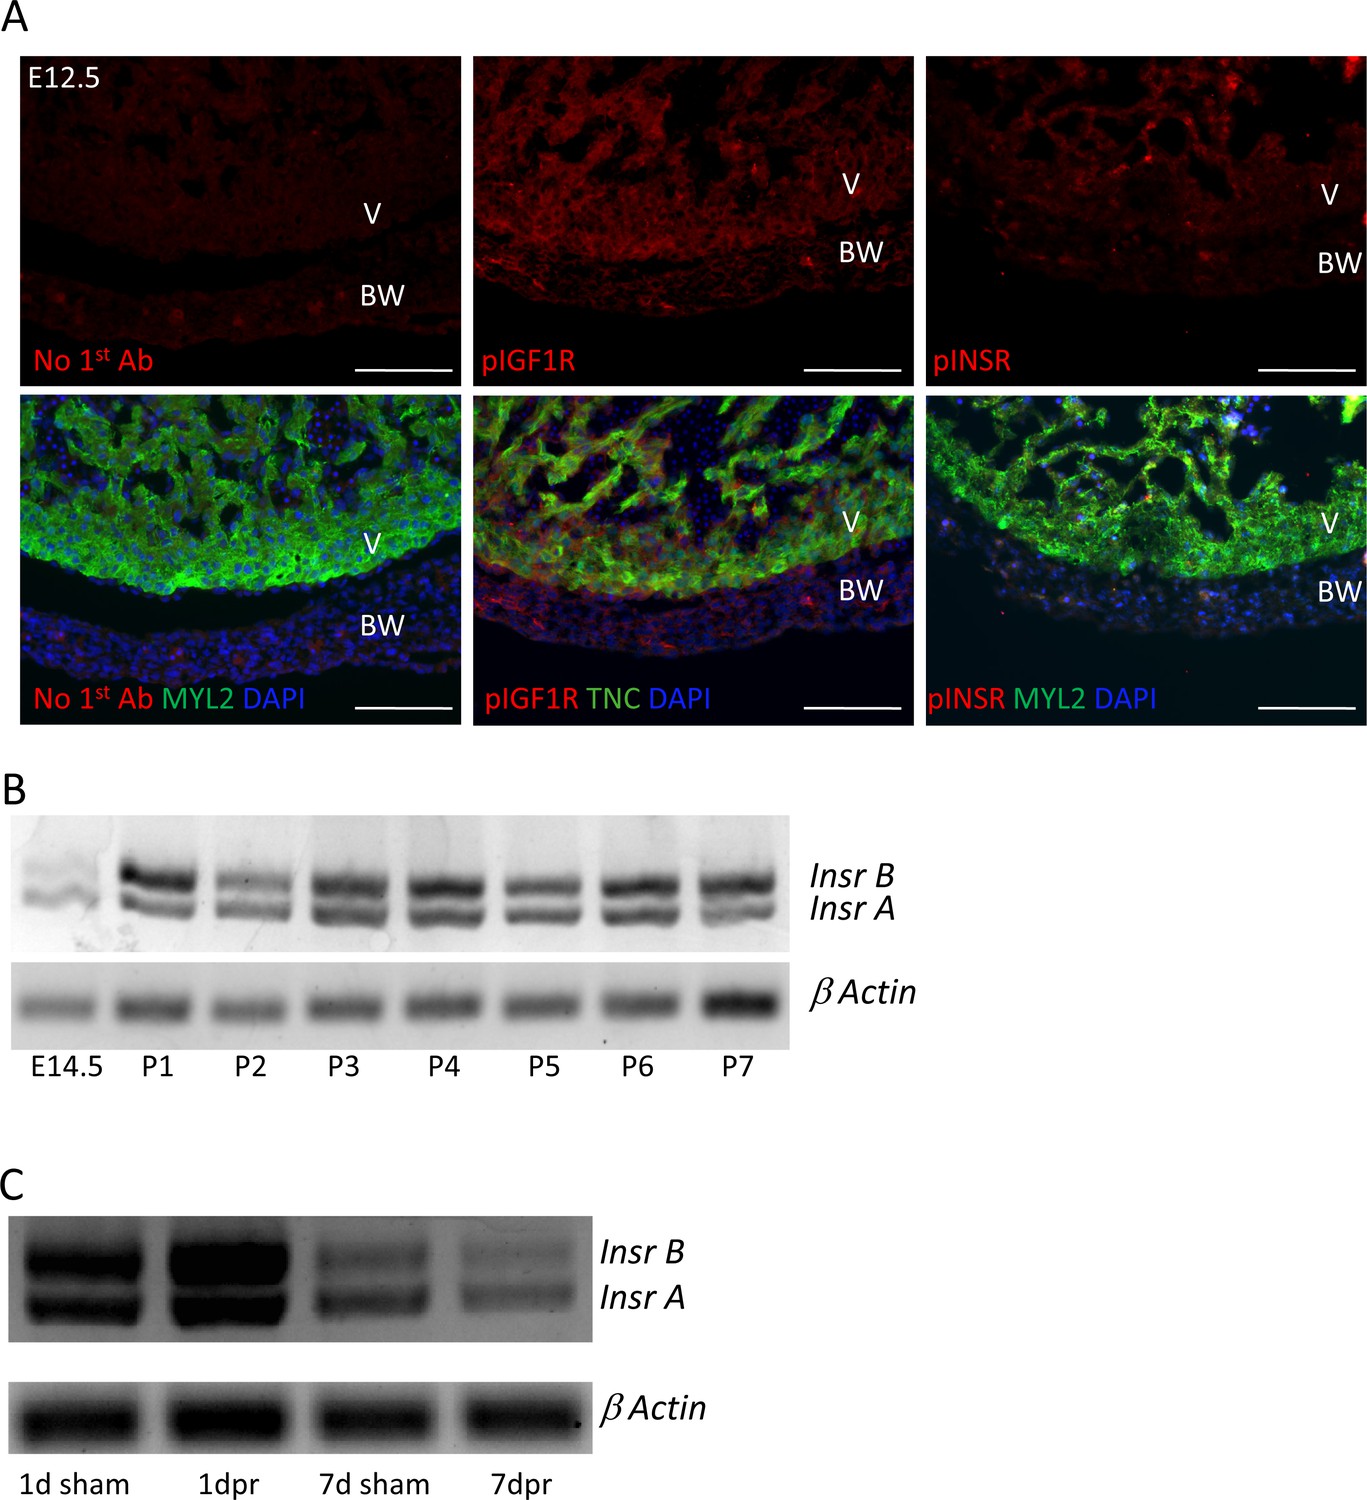
(A) Staining of embryonic day E12.5 hearts with the same anti-phospho-specific receptor antibodies as used in Figure 4 and Figure 4—figure supplements 1 and 2, showing positive reactivity for pIGF1R and only faint signal with pINSR. This result repeats what we have shown previously (Wang et al., 2019); the sections shown here were newly stained in this study and done alongside those shown in Figure 4. (B,C) Expression of the two Insr splice variants, detected by RT-PCR using primers from the two common exons that flank the included or excluded exon, over developmental and postnatal time in uninjured hearts (B) and unchanged by P1 injury (C).
Figure 5
Measurement of cell cycle entry activity by phospho-histone H3 (pH3) staining.
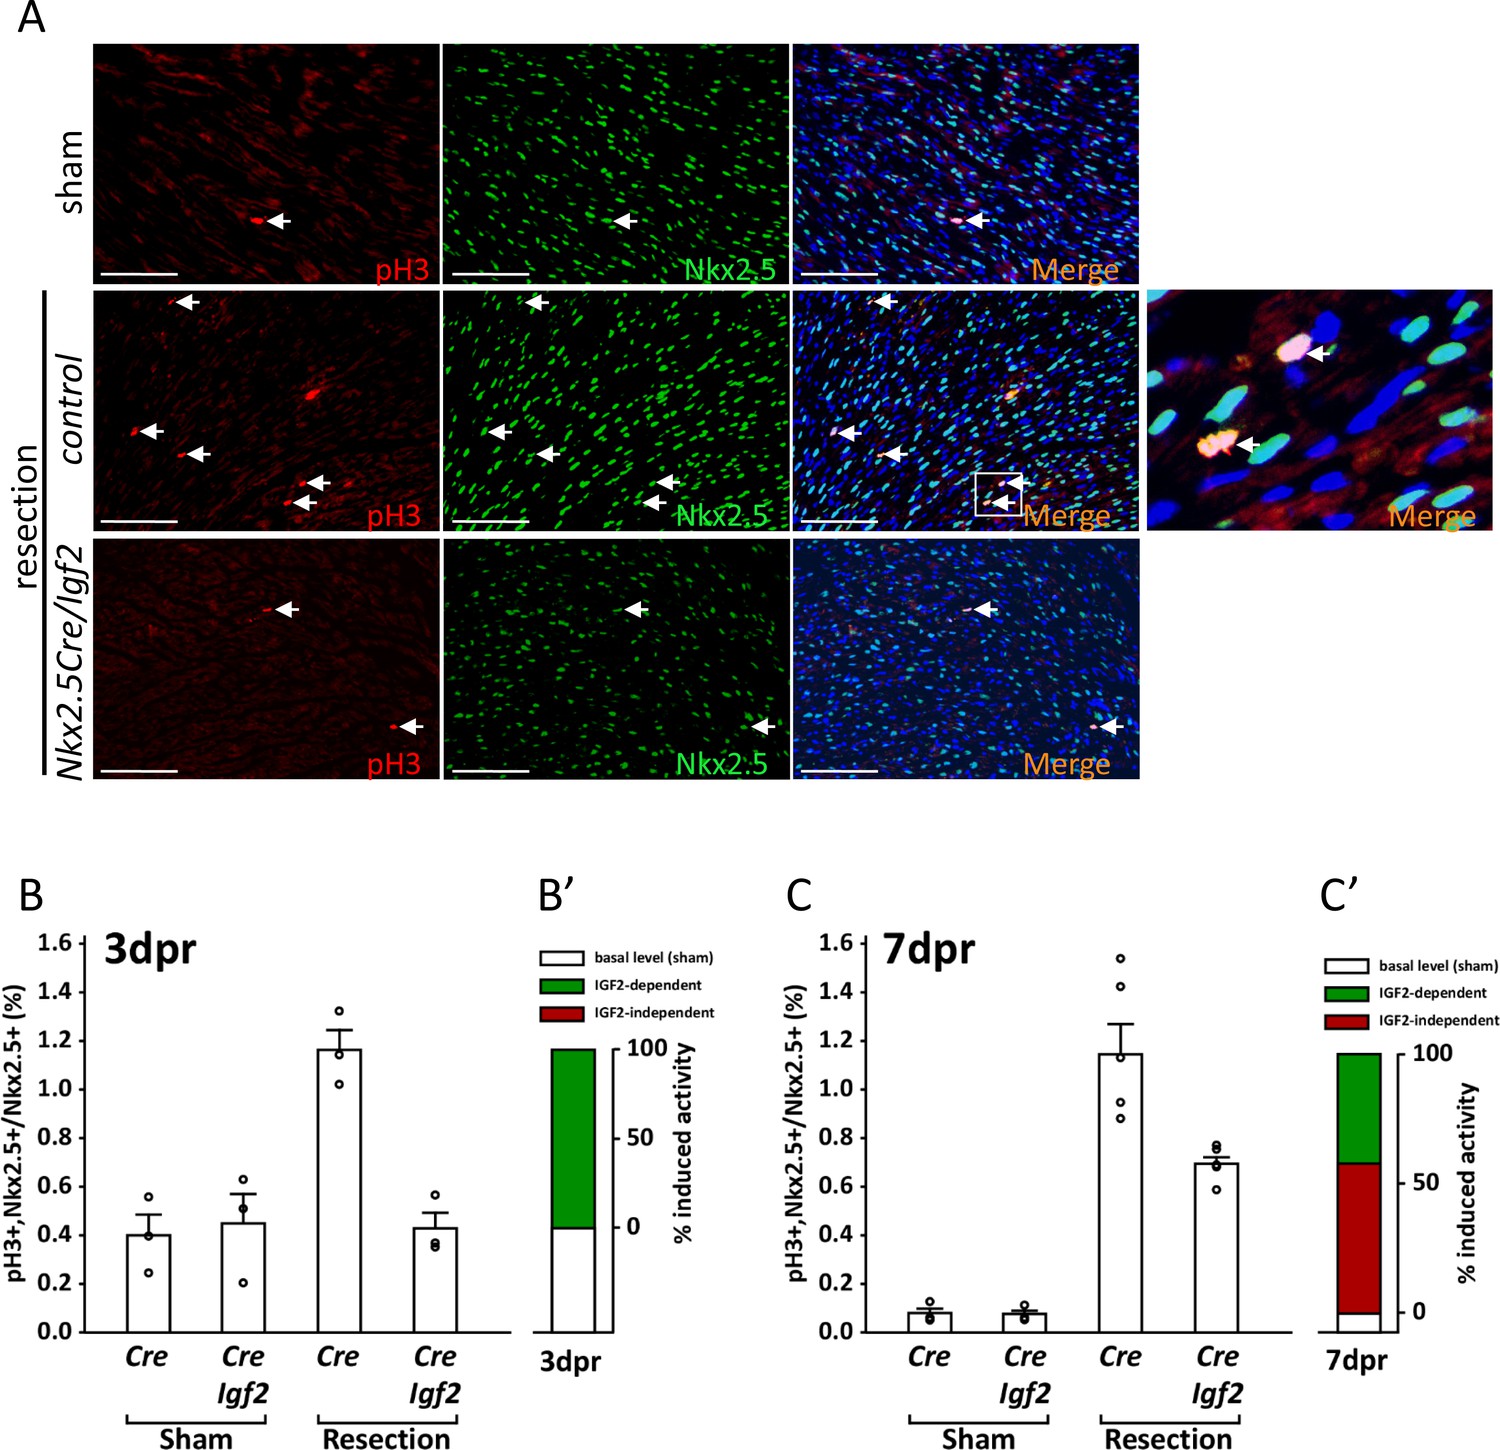
(A) Representative sections through sham-injured and resected hearts at 3dpr showing visualization of pH3 and NKX2.5 (a cardiomyocyte-specific nuclear marker). Arrows point to double labeled nuclei, one region of which is expanded in the panel at far right. (B) Quantitation of pH3+ cardiomyocyte nuclei at 3dpr. (B’) Compilation of the data of panel B, the baseline level of pH3+ cardiomyocytes in sham-operated pups (the average of both genotypes) is in white, and the higher level induced by injury is in green. Because Igf2 mutation completely eliminates injury-induced pH3+ labeling, there is no indication of IGF2-independent cell cycle entry activity (red). (C) Quantitation of pH3+ cardiomyocyte nuclei at 7dpr. (C’) Compilation of the data of panel C, the substantial IGF2-independent injury-induced pH3 labeling activity is indicated by the red bar.
Figure 6 with 1 supplement
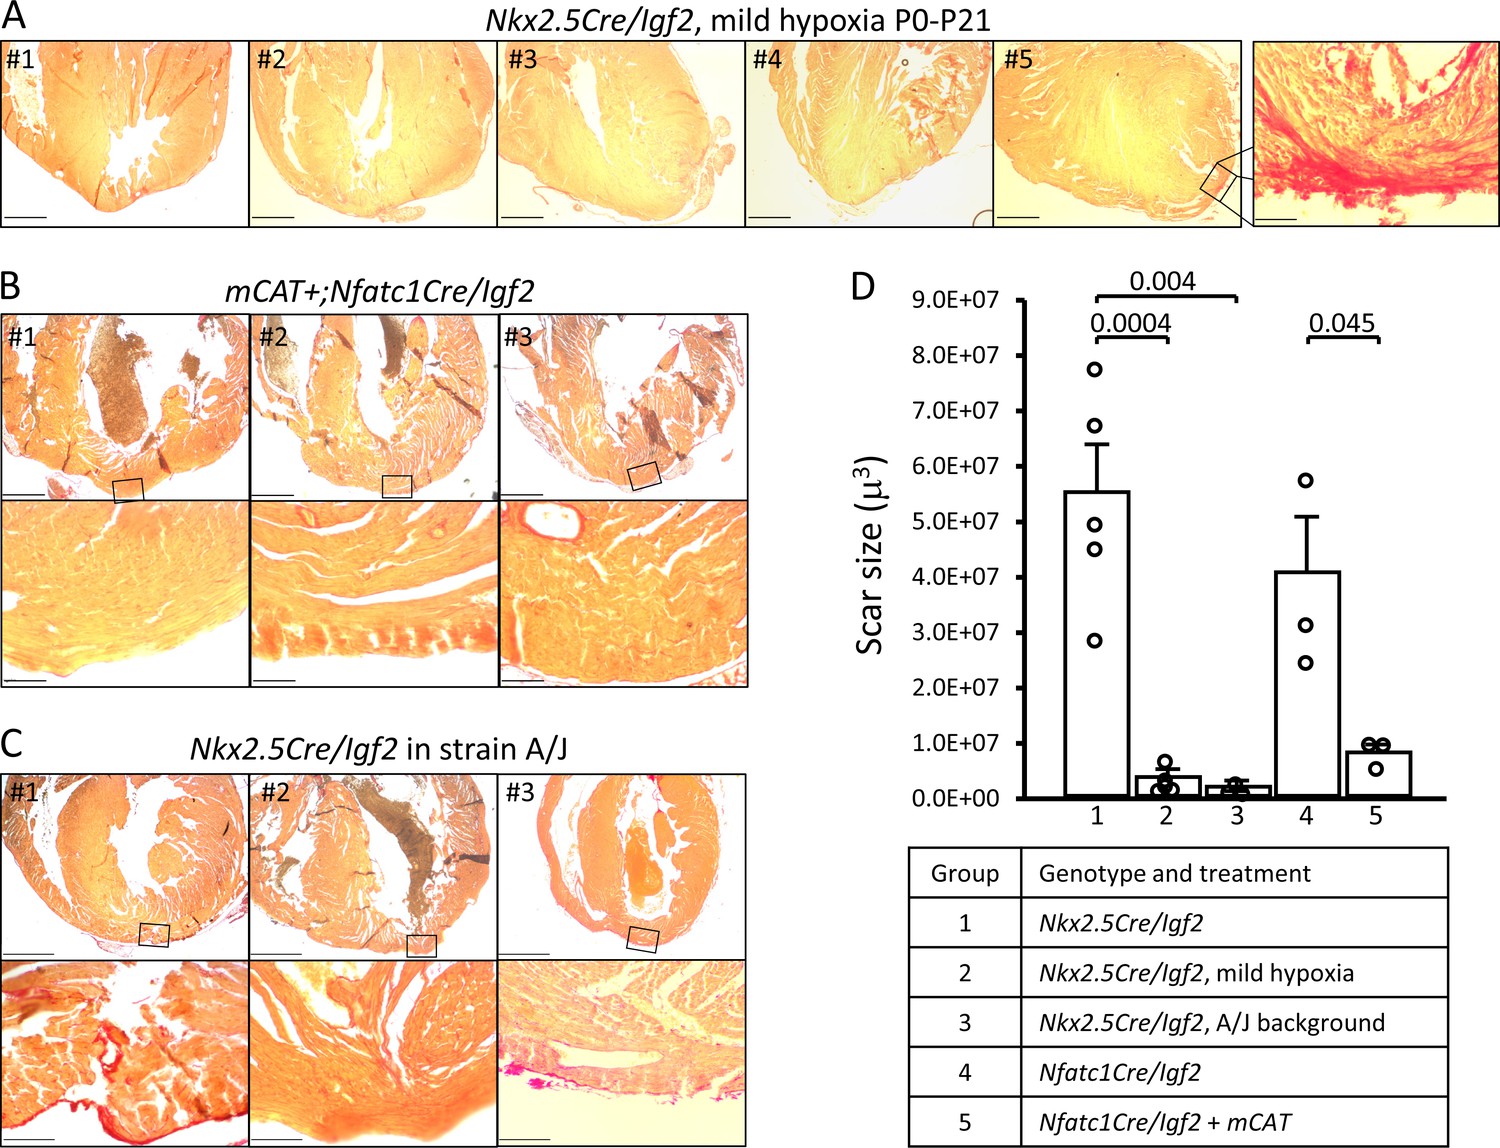
Restoration of regeneration in Igf2 mutant P21 hearts after P1 resection in three conditions that elevate mononuclear diploid cardiomyocyte composition.
All analyzed hearts of the indicated genotypes and treatments are shown. As in Figure 3, the most extensive degree of Sirius red staining for each heart at the injury site is shown. (A) Nkx2.5-Cre/Igf2 mutant hearts after mild hypoxia. Heart #5 was scored as having interspersed scar, shown at high magnification in the expanded panel; the other four were scored as having full regeneration. (B) Nfatc1-Cre/Igf2 mutants also transgenic for the mCAT transgene. All three show full regeneration. (C) Nkx2.5-Cre/Igf2 mutants in the A/J strain background. #1 is classified as interspersed scar, the other two are scored as full regeneration. Scale bars: upper rows, 1 mm; lower rows, 100µ. (D) Scar size was quantitated for Nkx2.5-Cre/Igf2 and Nfatc1-Cre/Igf2 mutants and for all of the rescued hearts shown in panels A-C.
Figure 6—figure supplement 1
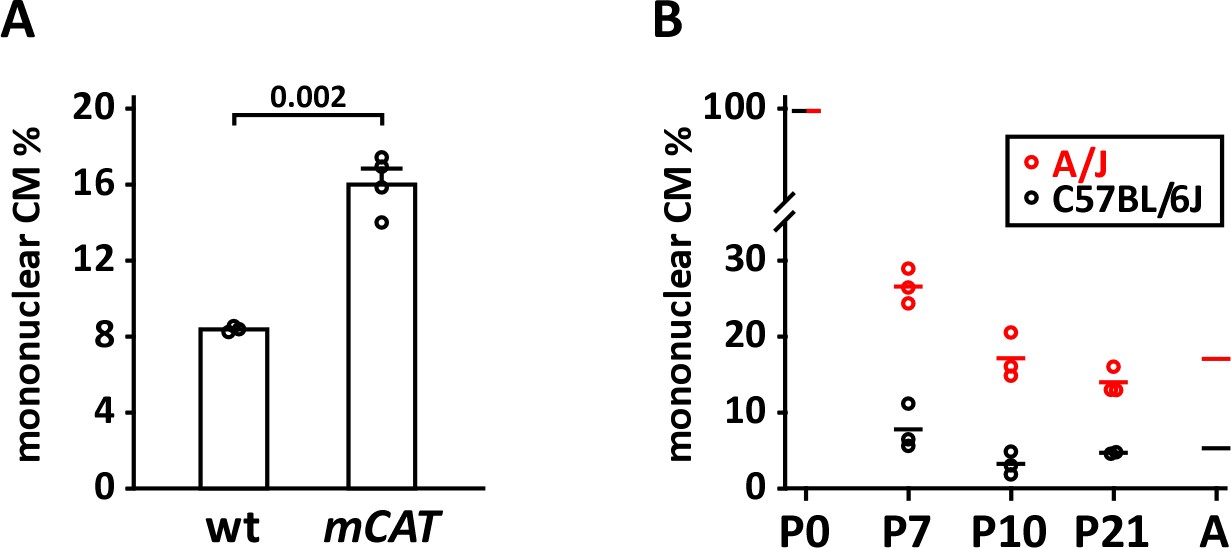
Mononuclear cardiomyocyte content.
(A) Comparison of mononuclear cardiomyocyte level in wild-type control and mCAT transgenic C57BL/6J-inbred littermate pups at P7. (B) Comparison of mononuclear cardiomyocyte percentage in uninjured strains A/J (red) and C57BL/6J (black) at P7, P10, and P21. Average values for P0 and adult (8 weeks) for both strains were taken from Patterson et al. (2017) and were not newly measured in this study.
Figure 7
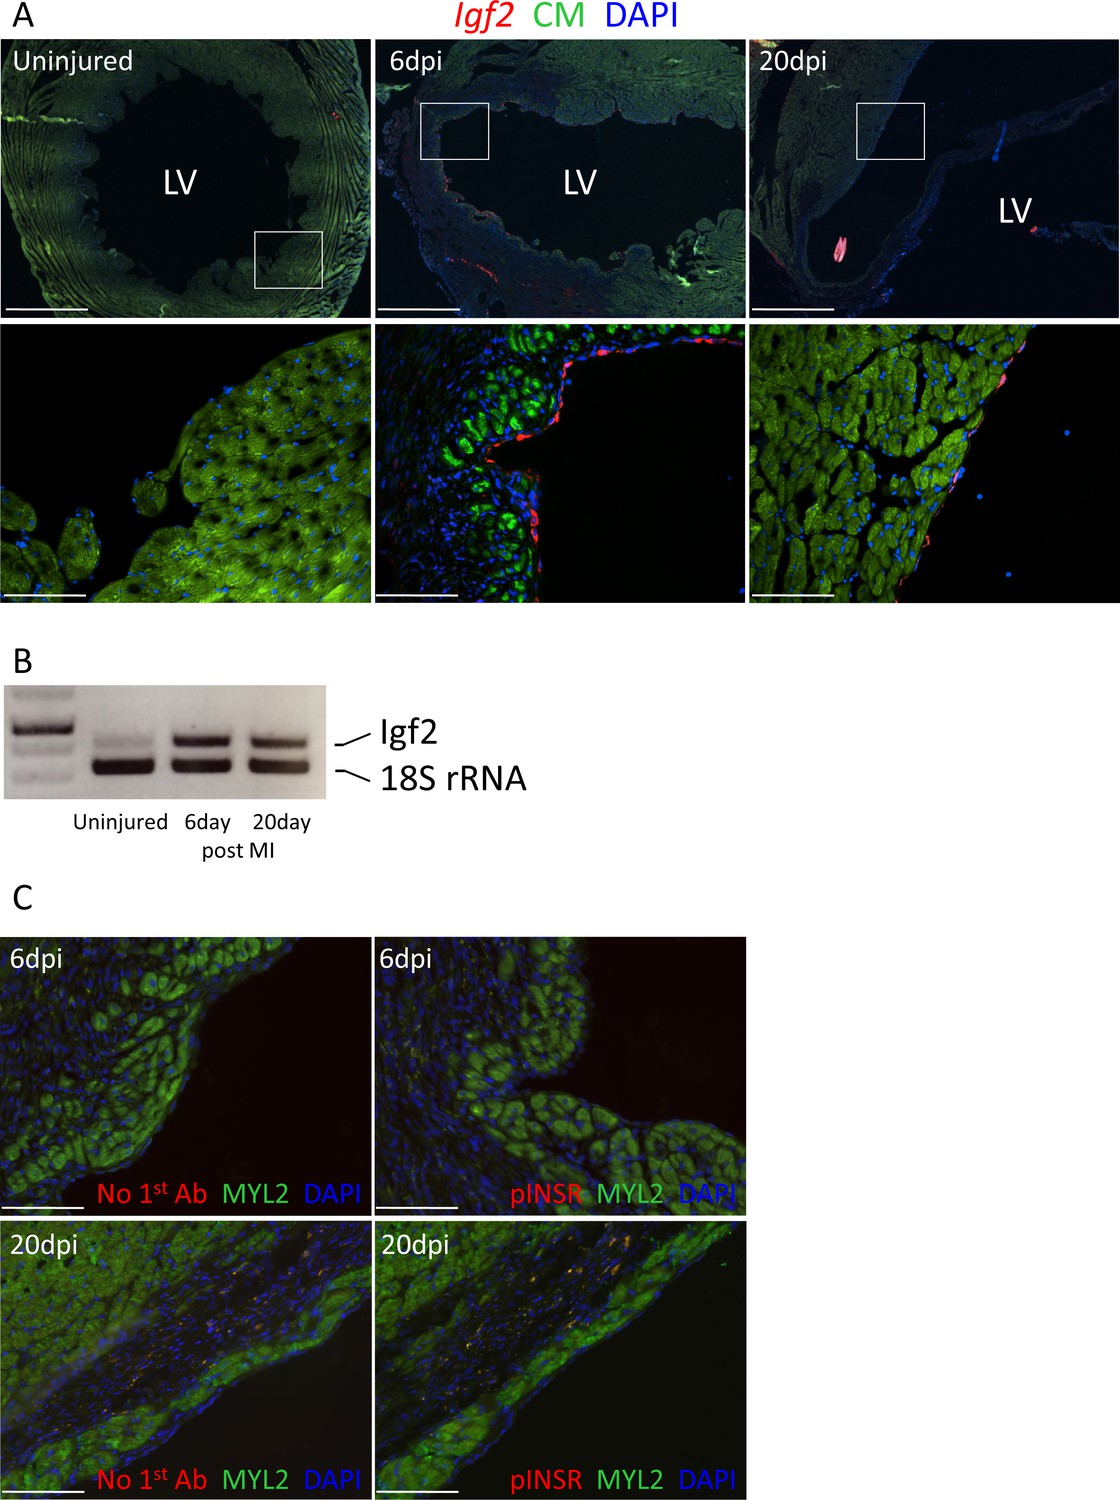
Adult heart injury induces Igf2 expression.
(A) Sections of adult hearts that were uninjured or at 6 days and 20 days after coronary artery ligation. In the injured hearts, the infarction region is evident by absence of cardiomyocyte autofluorescence (green). Igf2 is not expressed in the uninjured heart, but is expressed after infarction in the endocardium. (B) RT-PCR analysis of Igf2 expression normalized to 18S rRNA, showing minimal expression in uninjured heart and induction after injury. The first lane is a size marker. (C) No activation of INSR phosphorylation after adult heart injury.
Figure 8
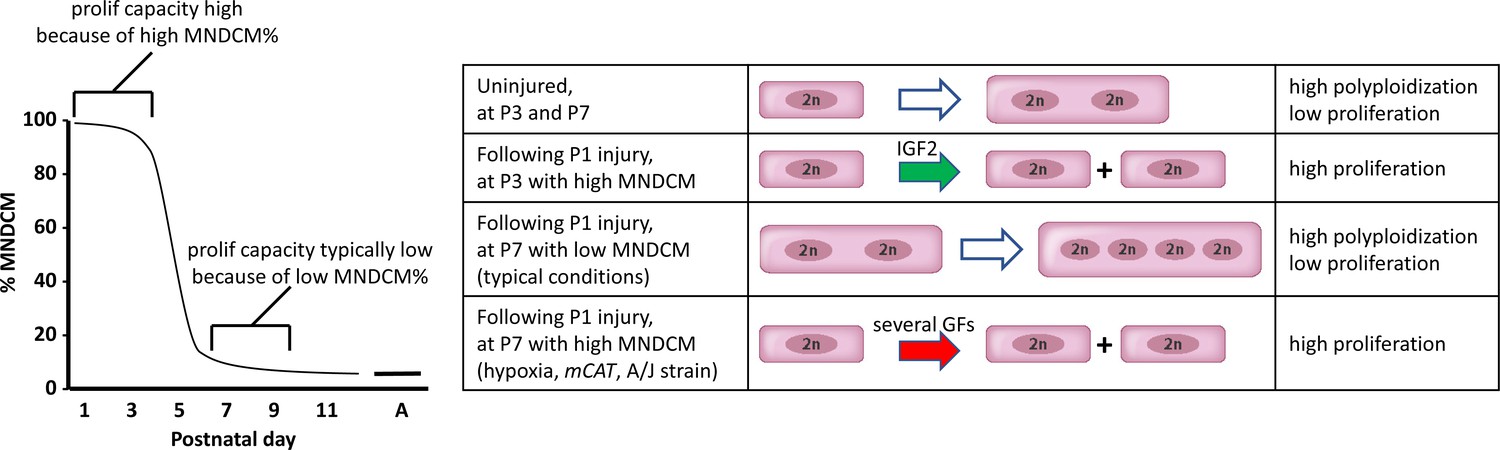
A model to explain neonatal heart regeneration.
At left is a schematic illustration of the percentage of mononuclear diploid cardiomyocytes (MNDCMs) in the ventricle from the high level at birth to the low level by P7 and later (e.g., as in C57BL/6 mice or in the mixed genetic backgrounds of mice used in most parts of this study; A, adult). IGF2 does not influence how many MNDCMs are present but rather acts on these to promote their proliferation. Consequently, early heart injury is regenerated because the MNDCM percentage is high and can sustain a high level of proliferation in response to IGF2. At right is a representation of the most common type of cell cycle outcome under different circumstances. In the normal postnatal heart in the absence of injury, cell cycle entry leads to polyploidy rather than completed mitosis. In typical hearts (environmentally and genetically normal), P1 injury induces IGF2 expression which induces proliferation at P3 by the high number of MNDCMs, whereas at P7 there are too few MNDCMs present to mount an effective regenerative response even in the presence of other growth factors (GFs) that induce cell cycle activity. With conditions that sustain a higher MNDCM level through and beyond P7, proliferation and regeneration ensue in response to other factors even without prior IGF2 signaling.
Tables
Table 1
Regeneration after P1 heart apex resection in neonates of various genotypes.
Hearts were evaluated 21 days after resection. Examples of each class of outcome are shown in the figures. Control neonates carried one of the Cre alleles listed in the table but were wild-type for the Igf2 gene. Some Nfatc1-Cre/Igf2 mutants in this table were nontransgenic littermate controls of the Nfatc1-Cre/Igf2/mCAT neonates in Figure 6B.
| Genotype | Total | No scar | Interspersed scar | Transmural scar |
|---|---|---|---|---|
| Control | 23 | 20 | 3 | 0 |
| Nkx2.5-Cre/Igf2 | 5 | 0 | 0 | 5 |
| Tek-Cre/Igf2 | 7 | 2 | 1 | 4 |
| Nfatc1-Cre/Igf2 | 7 | 0 | 1 | 6 |
| Tbx18-Cre/Igf2 | 8 | 6 | 0 | 2 |
| Myh6-Cre/Insr | 7 | 0 | 1 | 6 |
| Myh6-Cre/Igf1r | 5 | 4 | 0 | 1 |
Key resources table
| Reagent type (species) or resource | Designation | Source or reference | Identifiers | Additional information |
|---|---|---|---|---|
| Strain, strain background Mus musculus male and female | C57BL/6J, A/J | JAX | 000664, 000646 | |
| Genetic reagent (mouse) | conditional Igf1r/Insr | PMID:18650937 | Laboratory (noncommercial) source | |
| Genetic reagent (mouse) | conditional Igf2 | PMID:22674894 | Laboratory (noncommercial) source | |
| Genetic reagent (mouse) | Nkx2.5-Cre | PMID:11783008 | Laboratory (noncommercial) source | |
| Genetic reagent (mouse) | Tbx18-Cre | PMID:18480752 | Laboratory (noncommercial) source | |
| Genetic reagent (mouse) | Tek-Cre | PMID:11161575 | Laboratory (noncommercial) source; also commonly called Tie2-Cre | |
| Genetic reagent (mouse) | Nfatc1-Cre | PMID:11786533 | Laboratory (noncommercial) source | |
| Genetic reagent (mouse) | Myh6-Cre | JAX | 011038 | |
| Genetic reagent (mouse) | mCAT | JAX | 016197 | |
| Antibody | anti-phospho-IGF1R (rabbit polyclonal) | Santa Cruz | SC101703 | for immuno-fluorescence (IF) (1:50) |
| Antibody | anti-Troponin C (goat polyclonal) | Abcam | ab30807 | for IF (1:500) |
| Antibody | anti-phospho-Insulin receptor (goat polyclonal) | Santa Cruz | SC25103 | for IF (1:50) |
| Antibody | anti-MYL2 (rabbit polyclonal) | Abcam | ab79935 | for IF (1:200) |
| Antibody | anti-rabbit (donkey polyclonal) | Invitrogen | AlexaFluor 488 and 546 | for IF (1:500) |
| Antibody | anti-goat (donkey polyclonal) | Invitrogen | AlexaFluor 488 and 546 | for IF (1:500) |
| Antibody | anti-pH3 (rabbit polyclonal) | Upstate | 06–570 | for IF (1:500) |
| Antibody | anti-NKX2.5 (goat polyclonal) | Santa Cruz | SC8697 | for IF (1:200) |
| Antibody | anti-IGF2 (goat polyclonal) | R&D Systems | AF792 | for Westerns (1:1000) |
| Antibody | anti-phospho-IGF1R/INSR (rabbit polyclonal) | Invitrogen | 700393 | for Westerns; 1.5 µg/ml final concentration |
| Antibody | anti-total INSR (rabbit monoclonal) | Cell Signaling | 3025S | for Westerns (1:1000) |
| Antibody | anti-total-IGF1R (rabbit polyclonal) | Cell Signaling | 3027S | for Westerns (1:1000) |
| Antibody | anti-beta-actin (mouse monoclonal) | Santa Cruz | SC47778 | for Westerns (1:1000) |
| Antibody | anti-TnT (troponin T) (mouse monoclonal) | Abcam | ab8295 | for cell staining (1:1000) |
| Antibody | anti-CD31 (Pecam1) (rat monoclonal) | BD Biosciences | 553370 | for cell staining (1:1000) |
| Sequence-based reagent | Insr-F | This paper | PCR primer | GGTGTACTGGGAGAGGCAAG |
| Sequence-based reagent | Insr-R | This paper | PCR primer | CGGTACCCAGTGAAGTGTCT |
| Sequence-based reagent | Igf2-F | This paper | PCR primer | GGCCTTCGCCTTGTGCTGCATC |
| Sequence-based reagent | Igf2-R | This paper | PCR primer | GGATCCACGATCAGGGGACGATGACG |
Additional files
Download links
A two-part list of links to download the article, or parts of the article, in various formats.
Downloads (link to download the article as PDF)
Open citations (links to open the citations from this article in various online reference manager services)
Cite this article (links to download the citations from this article in formats compatible with various reference manager tools)
Mononuclear diploid cardiomyocytes support neonatal mouse heart regeneration in response to paracrine IGF2 signaling
eLife 9:e53071.
https://doi.org/10.7554/eLife.53071


