Defining the role of pulmonary endothelial cell heterogeneity in the response to acute lung injury
- Department of Medicine, University of Pennsylvania, United States
- Department of Cell and Developmental Biology, University of Pennsylvania, United States
- Penn-Children's Hospital of Philadelphia Lung Biology Institute, University of Pennsylvania, United States
- Penn Cardiovascular Institute, University of Pennsylvania, United States
- Penn Institute for Regenerative Medicine, University of Pennsylvania, United States
Figures
Figure 1 with 3 supplements
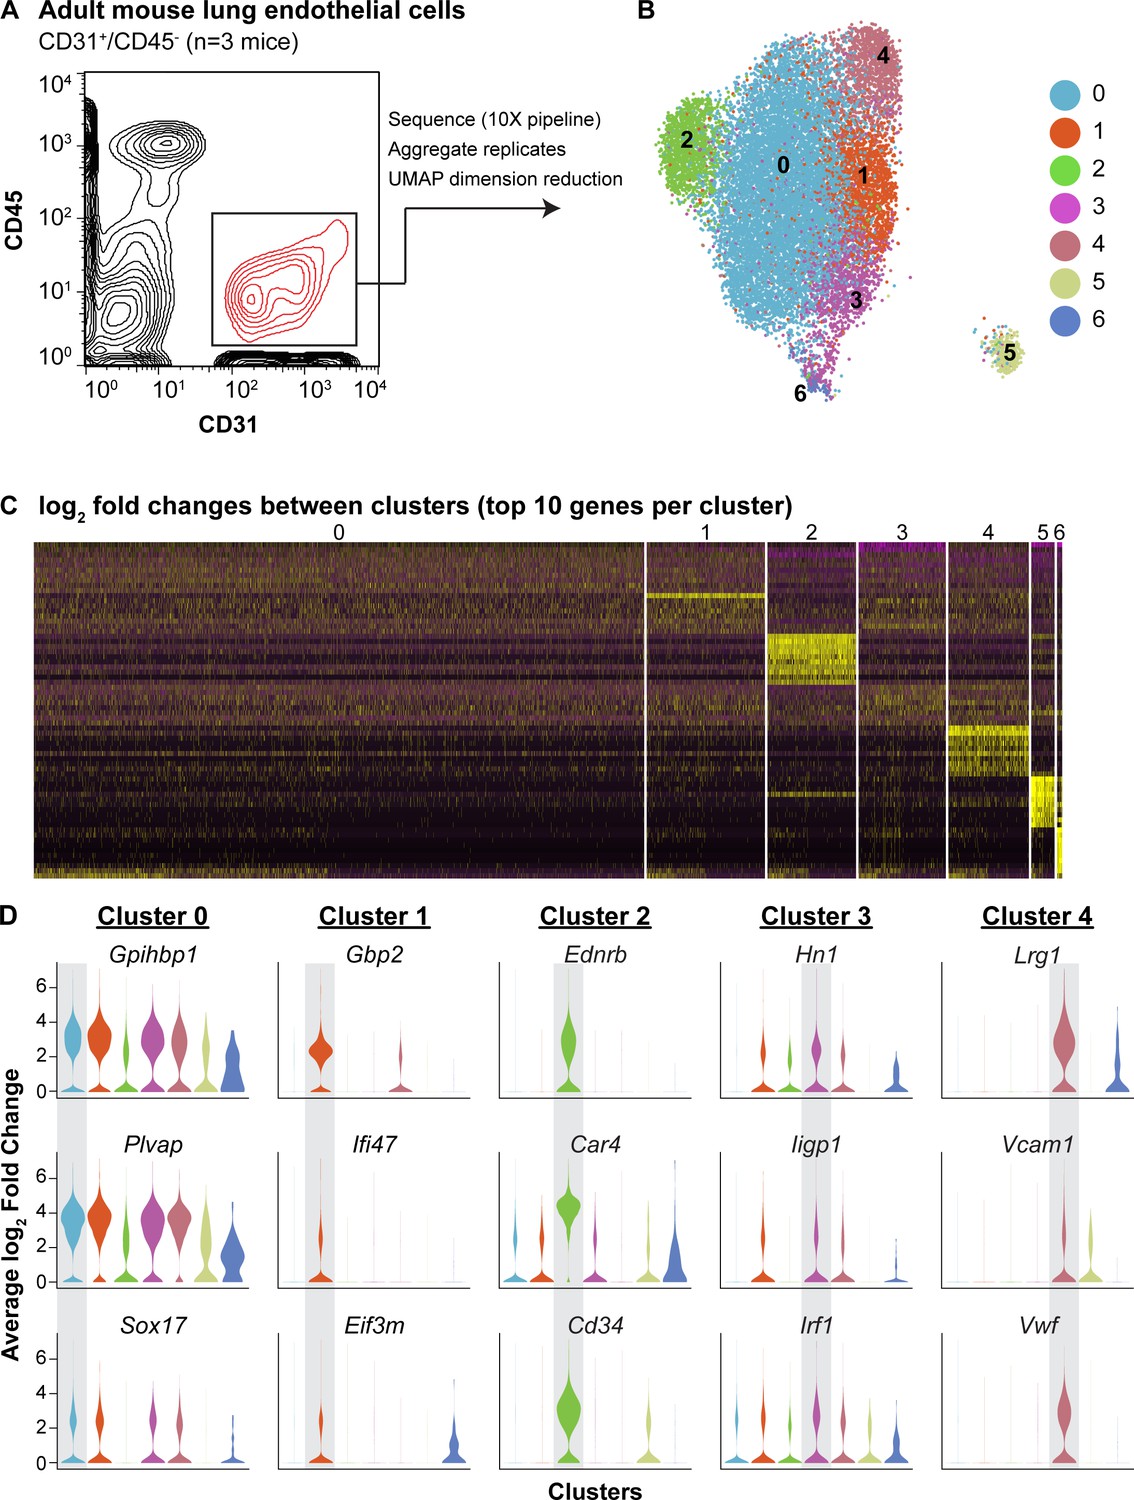
scRNA-seq analysis reveals heterogeneity of ECs in the adult mouse lung and identifies a distinct cell population high in Car4 and Cd34 expression.
(A) Experimental strategy for identifying heterogeneity in adult mouse pulmonary endothelium. A representative FACS plot demonstrates gating used to isolate CD31+/CD45- cells from adult mouse lung. (B) UMAP dimension reduction analysis of scRNA-seq data generated using a Seurat pipeline reveals seven distinct cell clusters within the CD31+/CD45- cell population. (C) Analysis of the top 70 differentially expressed genes across all cells (top 10 differentially expressed genes per cluster by log2 fold change in gene expression). (D) Violin plots show relative expression of representative, highly-expressed genes in each EC cluster across all clusters. Cluster two is defined by robust expression of Ednrb, Car4, and surface marker Cd34. See also Figure 1—figure supplement 1, 2, 3.
Figure 1—figure supplement 1
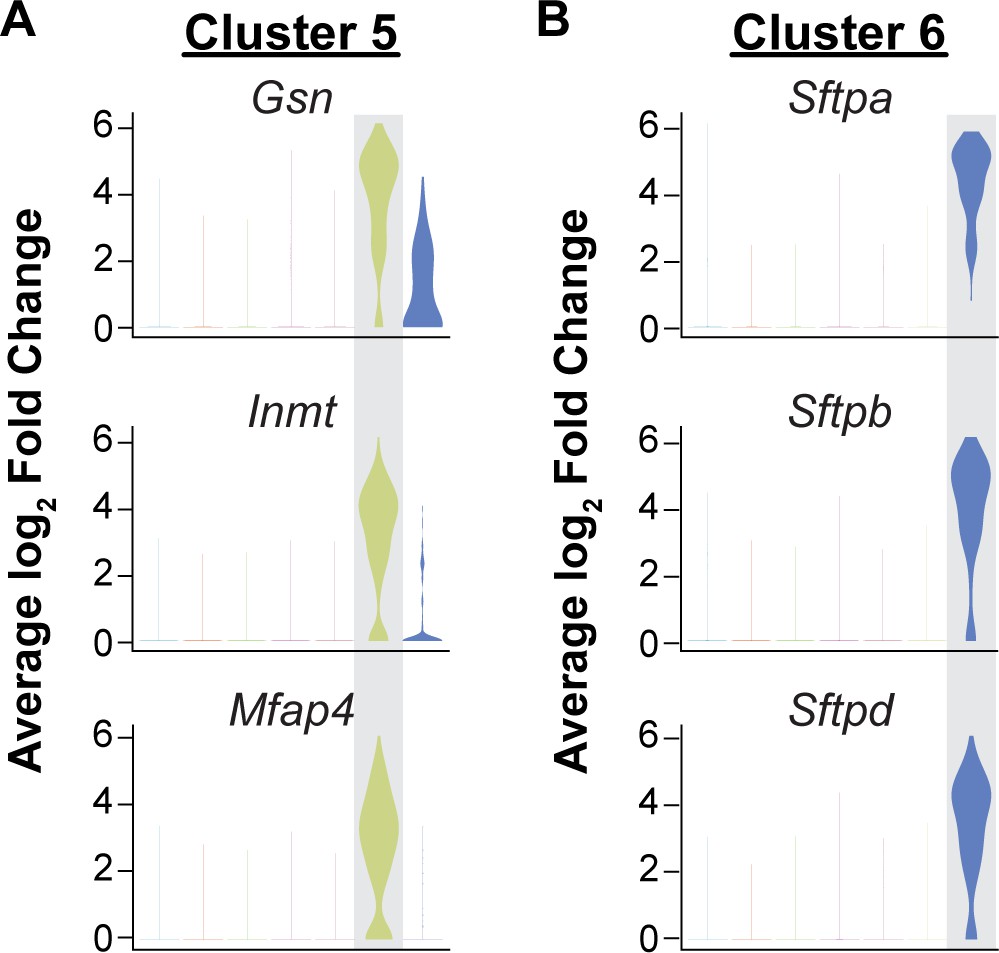
Isolation of CD45-/CD31+ cells results in capture of some mesenchymal and epithelial cells.
Identification of the top three differentially expressed genes in (A) cluster five and (B) cluster six by average log2 fold change in gene expression indicates that these clusters are likely contaminating cell types in the analysis of CD31+/CD45- cells. Cluster 5 (363/15,894 cells) is defined by high expression of cytoskeleton and extracellular matrix genes such as Gsn and Mfap4 and is likely composed of mesenchymal cells. Cells in cluster 6 (80/15,894 cells) express surfactant protein genes such as Sftpa, Sftpb, and Sftpd and likely represent epithelial cells.
Figure 1—figure supplement 2
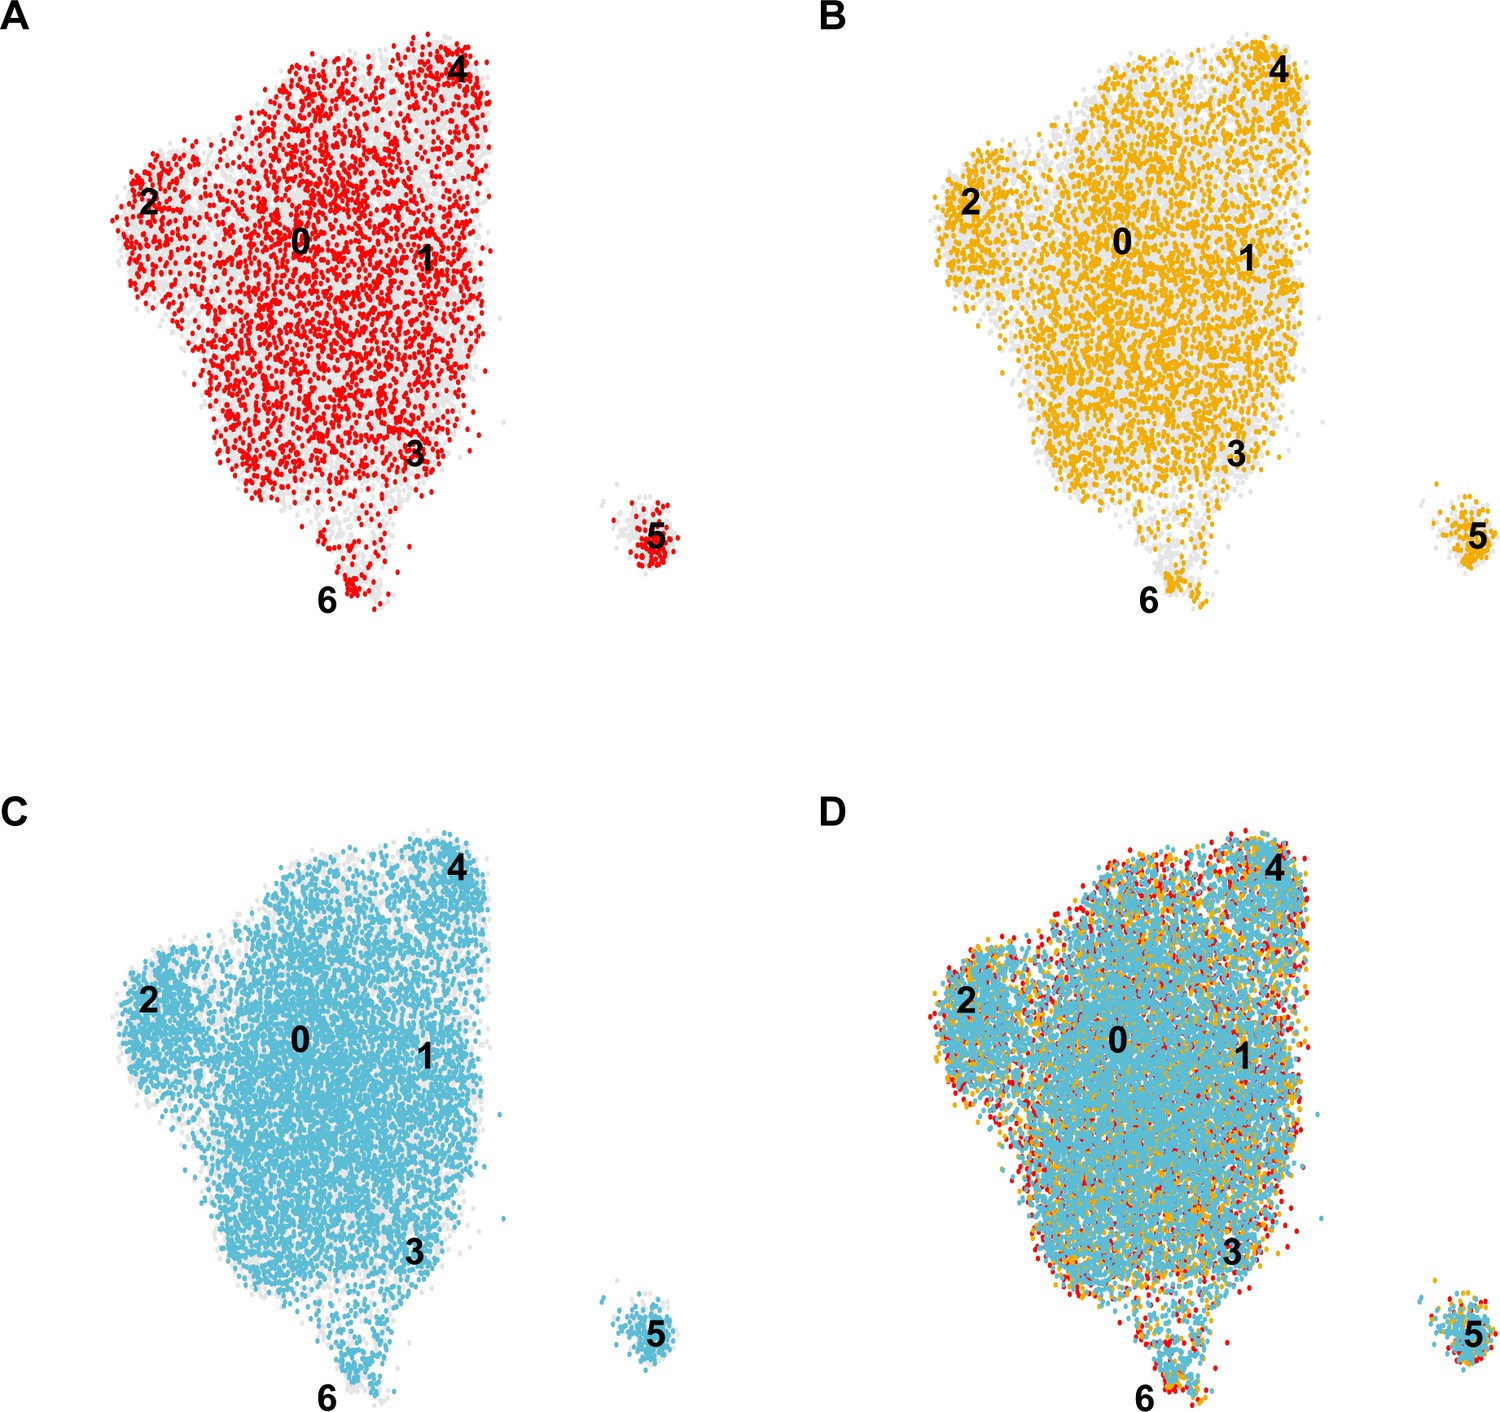
Distinct contributions of individual mice to the integrated EC-specific scRNA-seq dataset.
UMAP dimension reduction plots for scRNA-seq datasets generated from each individual C57BL/6J mouse analyzed (A–C) and the overlay demonstrating the contribution of each individual to the integrated dataset (D) demonstrate that each cluster 0–6 in the integrated dataset includes contributions from each individual mouse, indicating the consistency of the experiment across biological replicates.
Figure 1—figure supplement 3
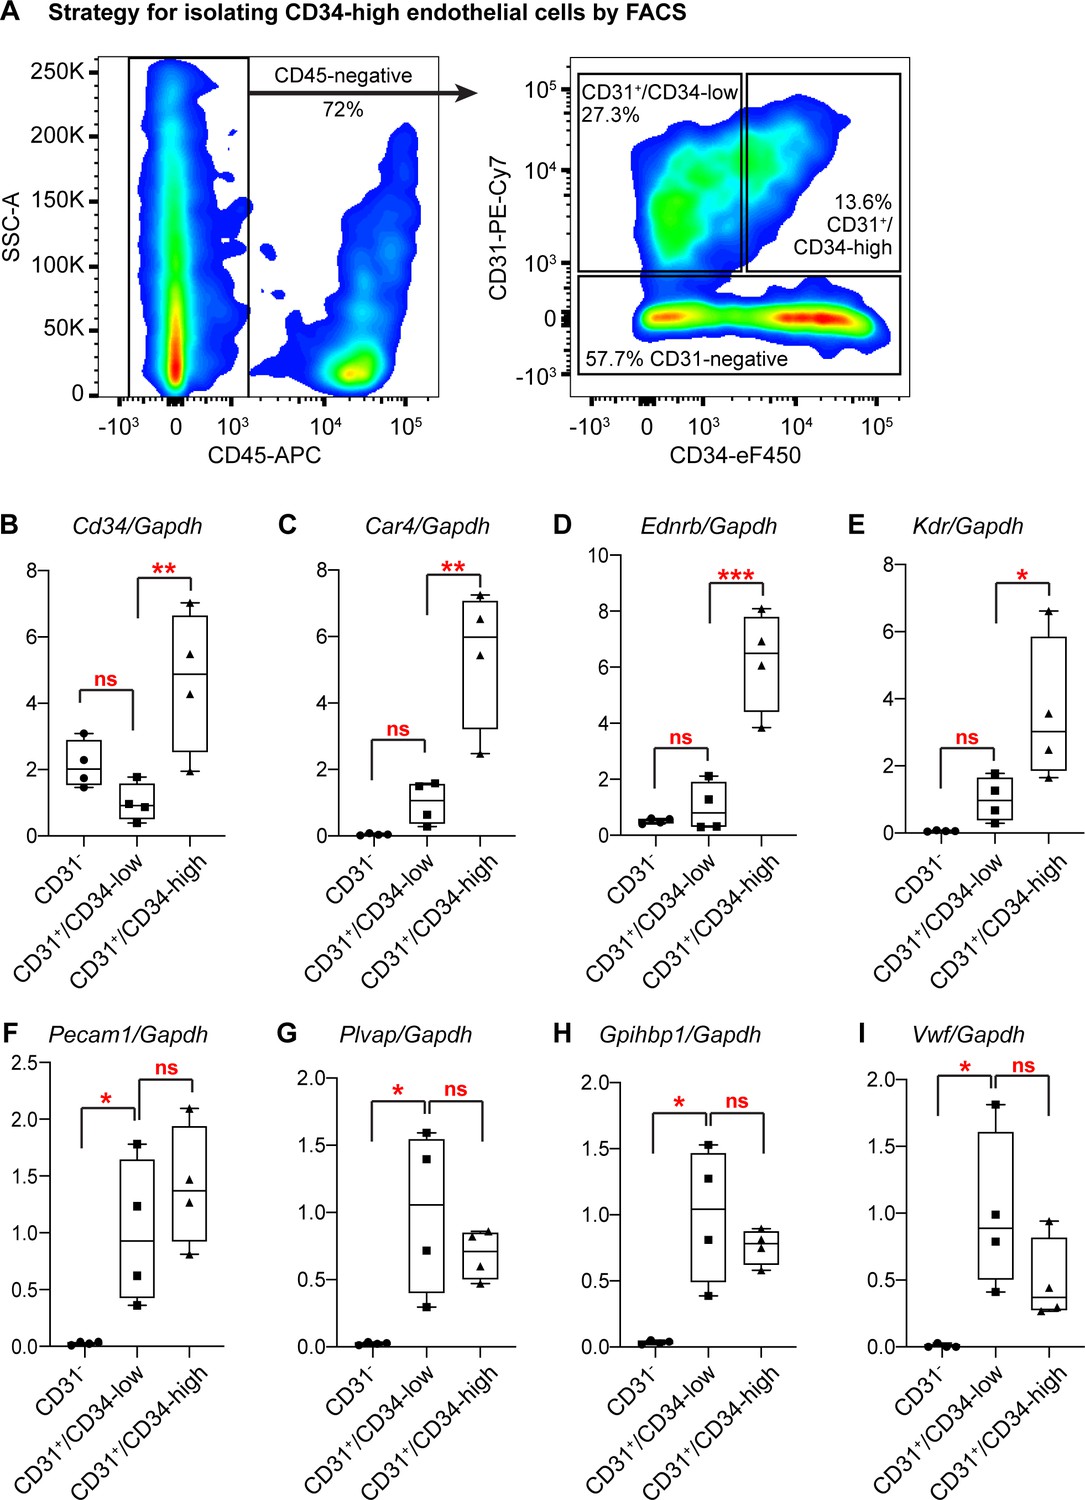
Isolation and qRT-PCR analysis of CD34-high ECs confirms their transcriptional distinction from other ECs.
(A) Gating strategy for isolating Car4-high (CD34-high) ECs, other CD34-low ECs, and non-ECs (CD45-/CD31- cells) by FACS. After isolation of each cell population, RNA extraction and subsequent qRT-PCR analysis show that in comparison to CD34-low ECs, CD34-high ECs express higher relative levels of (B) Cd34, (C) Car4, (D) Ednrb, and (E) Kdr, whereas non-ECs do not express high levels of any of these genes. In contrast, CD34-low and CD34-high ECs express comparable levels of other EC genes such as (F) Pecam1, (G) Plvap, (H) Gpihbp1, and (I) Vwf, while non-ECs express significantly lower levels of these genes. Each point represents the average of three technical replicates for N = 4 animals. *, p<0.05; **, p<0.01; ***, p<0.001; ns, not significant.
-
Figure 1—figure supplement 3—source data 1
Relative expression of endothelial cell genes in lung cell subpopulations isolated by FACS.
- https://cdn.elifesciences.org/articles/53072/elife-53072-fig1-figsupp3-data1-v2.xlsx
Figure 2
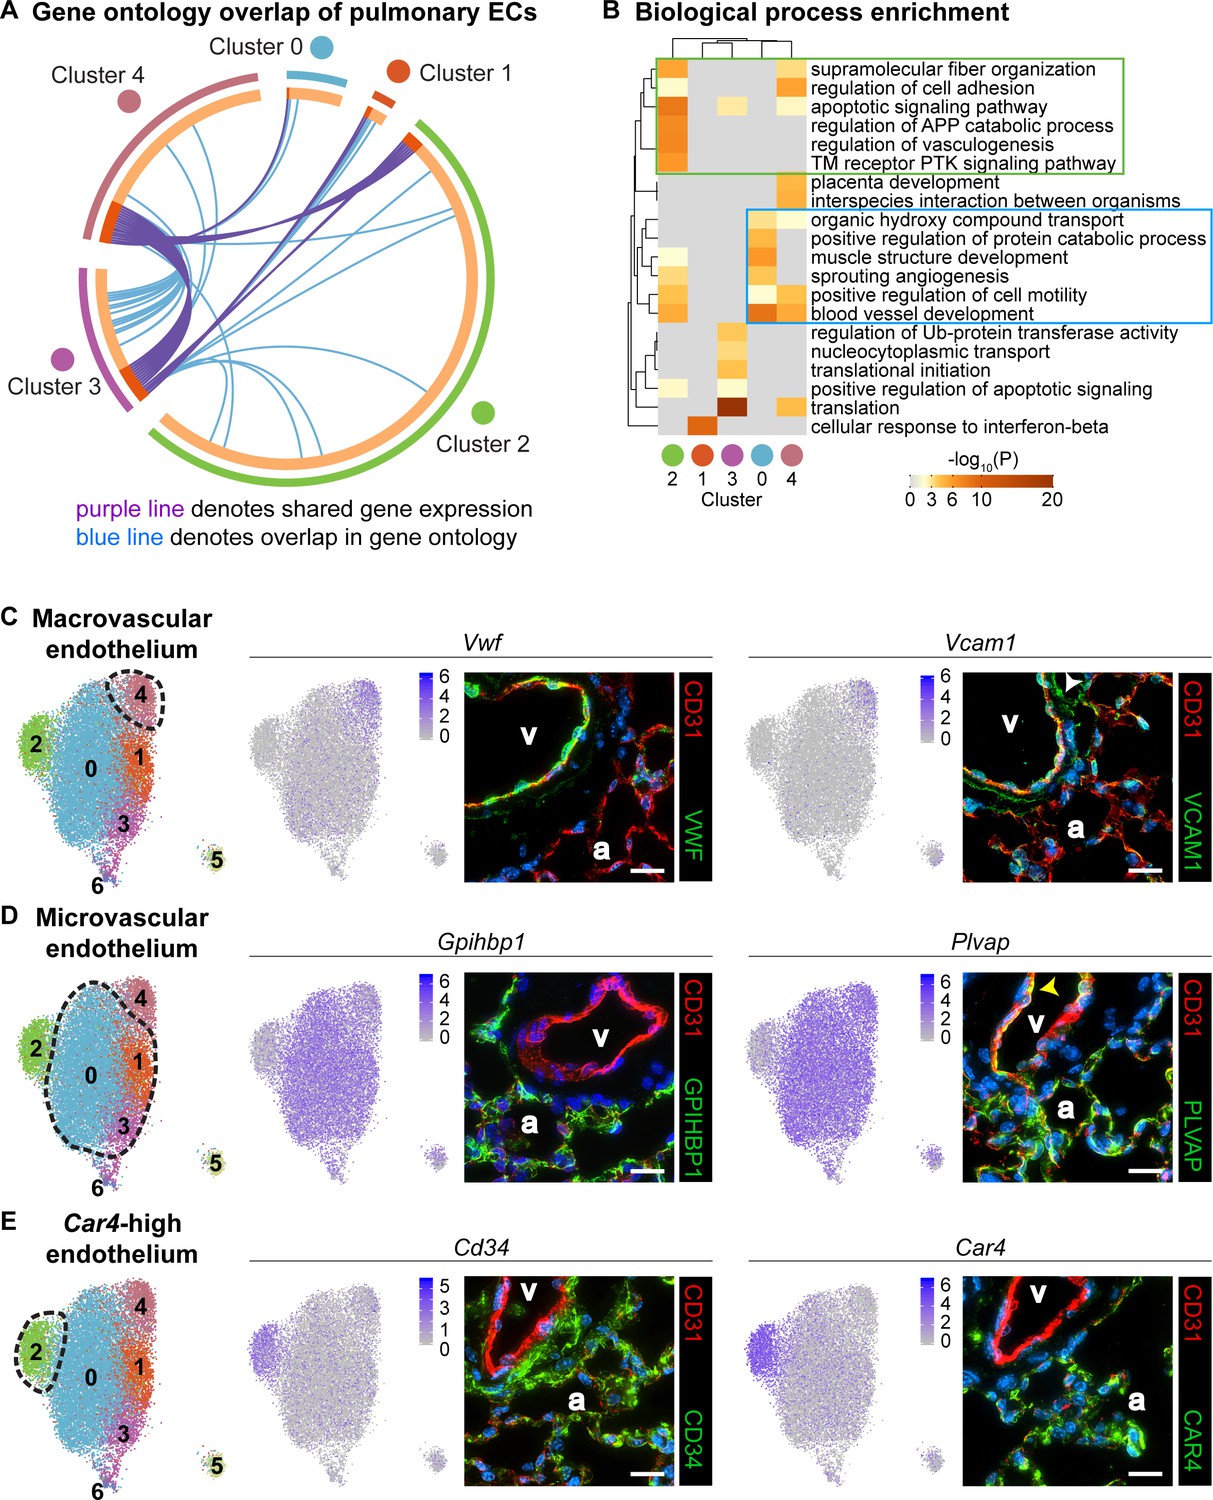
Gene ontology and localization of EC subtypes elucidates known functions and confirms divergence of clusters 2 and 4.
(A) Circos plot shows gene expression and gene ontology (GO) overlap between distinct clusters of pulmonary ECs. A purple line connecting two clusters indicates expression of the same gene in both clusters, while a blue line connecting two clusters indicates expression of different genes found within the same GO category in each cluster. (B) GO biological process enrichment performed for each cluster and displayed in heatmap format demonstrates expression of genes associated with different biological processes in each cluster, including some overlap between clusters. Cluster 2 (green box) shares enrichment of some processes related to angiogenesis and blood vessel development with cluster 0 (blue box) but is distinct in its enrichment of genes related to vasculogenesis. (C) In-depth analysis of gene expression in cluster four indicates that this cluster likely represents macrovascular ECs (maECs) with high expression of Vwf and Vcam1. IHC indicates that these proteins localize mainly to the large vessel endothelium. White arrowhead demonstrates Vcam1 located in nearby mesenchymal cells. (D) Clusters 0, 1, and three represent a heterogeneous population of microvascular ECs (miECs) with high expression of Gpihbp1 and Plvap. IHC indicates that these proteins localize to the alveolar capillary plexus endothelium. Yellow arrowhead demonstrates Plvap present in the large vessel endothelium. (E) Cluster two represents an as-yet uncharacterized population of ECs that localize to the alveolar region and express surface marker Cd34 at a higher level from that in other ECs. These cells also express high levels of Car4. CD34 and Car4 proteins localize to the alveolar space, indicating a similar spatial distribution of cells in cluster two to that of miECs. v, vessel; a, alveolar space; scale bars in (C)-(E), 20 microns.
Figure 3 with 4 supplements

CD34-expressing ECs respond robustly to H1N1 influenza injury.
In comparison to (A) normal adult mouse lung, (B) influenza-injured lungs demonstrate heterogeneous, regional alveolar damage, including regions of mild (zone 1/2) (B’) and severe (zone 3) (B’’) injury (Zacharias et al., 2018). A region of total alveolar destruction (zone 4) is outlined with a yellow dotted line. Scale bars in (A), (B), 500 microns. Scale bars in (A’), (B’), and (B’’), 100 microns. (C, C’) In control lung, CD34-expressing cells are located in the alveolar space, with a similar distribution to that of CD31-expressing miECs. (D–E) However, in zone three regions adjacent to areas of severe alveolar damage indicated by yellow dotted lines, a dramatic increase in CD34 localization by IHC suggests that these cells are recruited to sites of alveolar injury. Images are representative of N = 4 animals (H1N1 influenza injury) and N = 3 animals (control). Scale bars in (C)-(E), 100 microns. Scale bars in (C’)-(E’), 50 microns.
Figure 3—figure supplement 1
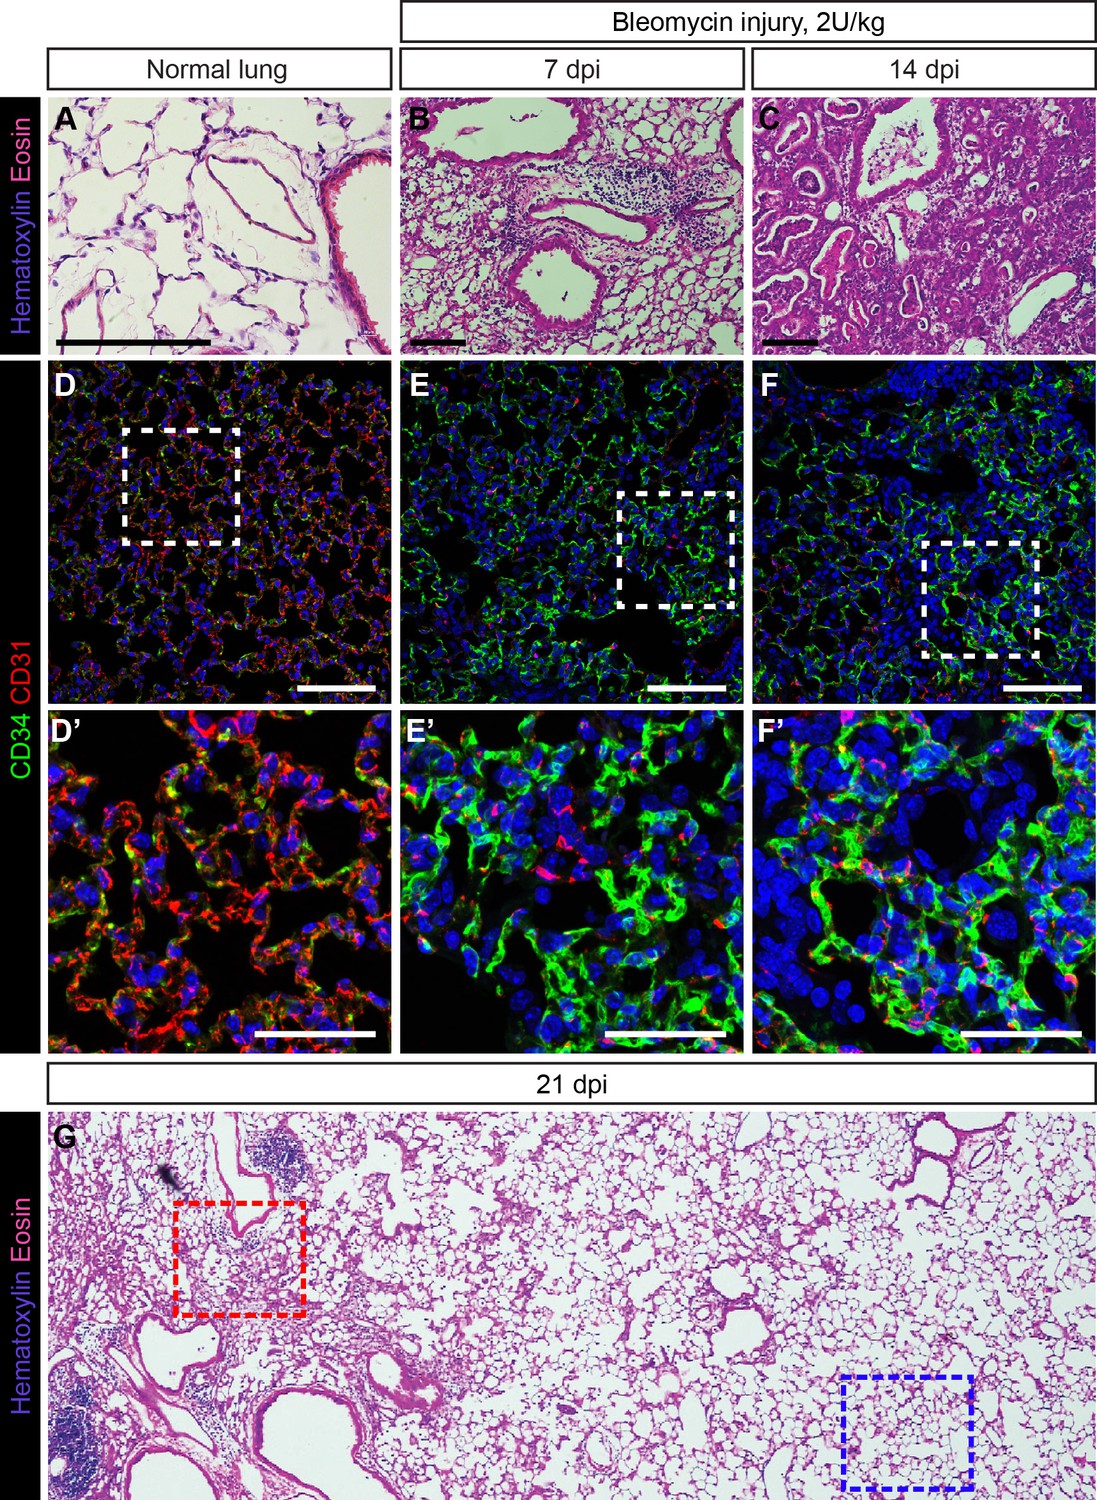
Response of CD34-expressing cells to bleomycin injury is comparable to their response to influenza injury.
H and E stained sections of adult mouse lung, either untreated (A) or treated with 2 U/kg bleomycin via intratracheal (IT) administration and examined 7 days post injury (dpi) (B) or 14 dpi (C). Damage to the lung tissue appears more extensive with longer injury and includes alveolar damage and inflammatory infiltrate in the lung. Scale bars, 100 microns. (D) CD34-expressing cells in the uninjured lung are localized throughout the alveolar space. (E, F) In bleomycin-injured lung, an increase in CD34 immunolabeling in regions of alveolar damage suggests that CD34-expressing cells may be recruited to sites of severe injury. Scale bars in (D)-(F), 100 microns. Scale bars in (D’)-(F’), 50 microns. (G) Low-magnification view of an H and E-stained lung section at 21 days post bleomycin injury reveals areas of diffuse inflammatory injury (red box) and areas with little damage (blue box). Images are representative of N = 3 animals (4–10 dpi), N = 3 animals (14 dpi), or N = 1 animal (21 dpi).
Figure 3—figure supplement 2
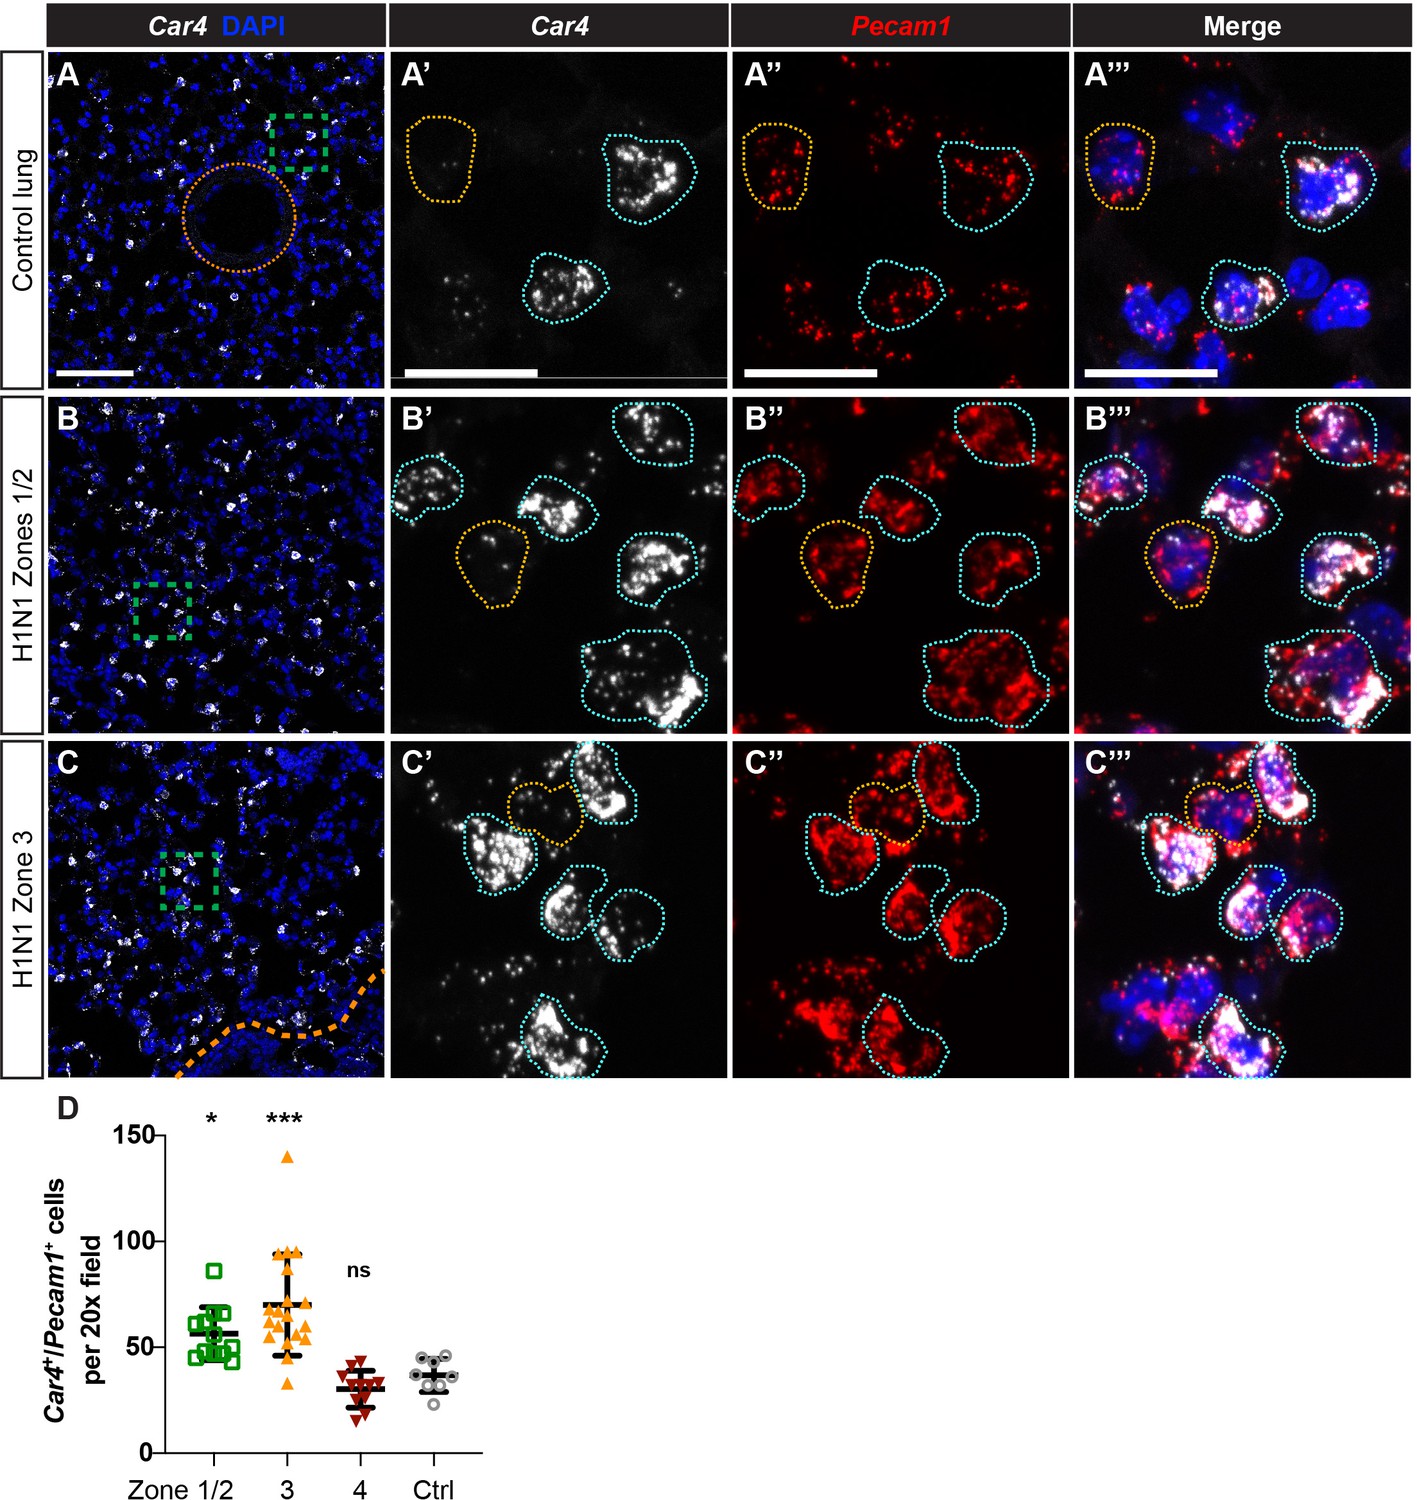
Car4-expressing ECs are increased in regions of mild to severe injury during the response to H1N1 influenza infection in the lung.
(A–A’’’) At homeostasis, Car4-expressing ECs (Car4+/Pecam1+, outlined in blue) are distributed throughout the alveolar space, but are not present in large vessels (orange dotted line). Many Pecam1+ cells in the alveolar capillary space do not express Car4 (outlined in yellow), indicating that Car4-high ECs are likely a subpopulation of microvascular ECs. (B–B’’’) At 14 days post-H1N1 influenza injury, Car4+/Pecam1+ ECs are increased in regions of mild-to-moderate injury (zones 1/2). (C–C’’’) At 14 days post-H1N1 influenza injury, Car4+/Pecam1+ ECs are likewise increased in regions of more severe injury (zone 3). Scale bars in (A), (B), and (C), 100 microns. Scale bars in (A’–A’’’), (B’–B’’’), and (C’–C’’’), 25 microns. (D) Quantification of Car4+/Pecam1+ ECs per 20x field reveals a statistically significant increase in number of these cells in zones 1/2 and zone three compared to control. Points represent individual fields quantified across H1N1-injured (N = 4) and control (N = 1) animals. *, p<0.05; ***, p<0.001; ns, not significant.
-
Figure 3—figure supplement 2—source data 1
Cell counts for total number of Car4-expressing, Pecam1-expressing cells, normalized to total number of nuclei.
- https://cdn.elifesciences.org/articles/53072/elife-53072-fig3-figsupp2-data1-v2.xlsx
Figure 3—figure supplement 3
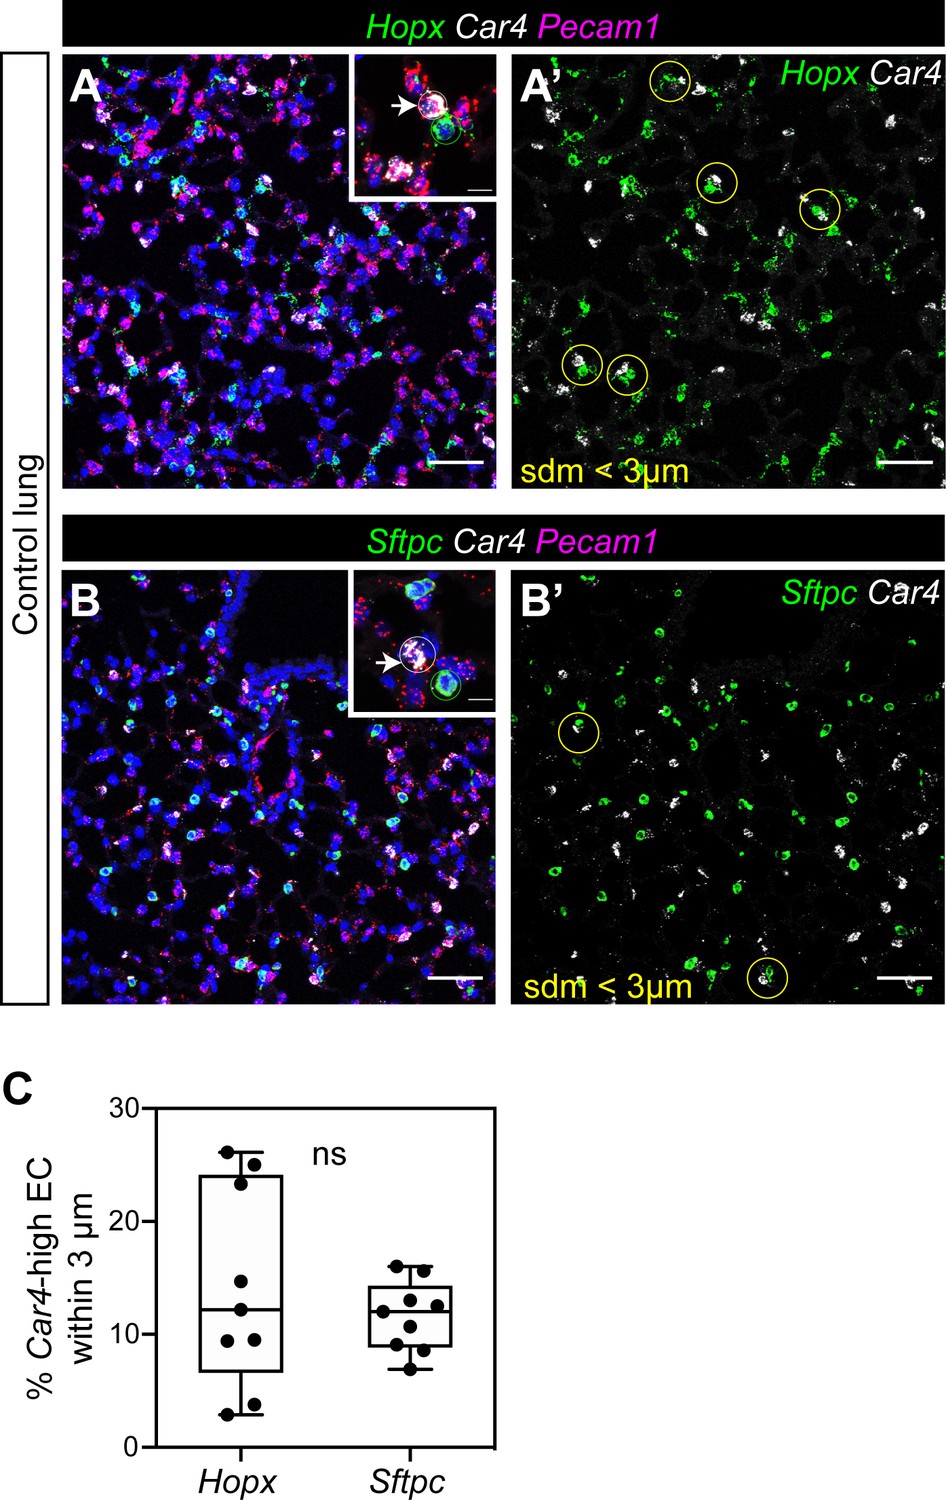
Localization of Car4-high ECs and other ECs with alveolar type 1 and type two epithelial cells.
(A, A’) RNAscope for Hopx demonstrates that Car4-high ECs (Car4+/Pecam1+) can be found adjacent to Hopx+ alveolar type 1 (AT1) cells in the distal lung (inset in A); yellow circles in A’). Other miECs (Car4-/Pecam1+) are also found adjacent to AT1 cells. (B, B’) RNAscope for Sftpc shows Car4-high ECs juxtaposed with Sftpc+ alveolar type 2 (AT2) epithelial cells (inset in B); yellow circles in B’). Other miECs (Car4-/Pecam1+) are also found near AT2 cells. (C) Percentage of Car4-high ECs within 3 microns of a Hopx+ or Sftpc+ cell. three micron radius is shown in (A’ and B’) as a yellow circle. ns, not significant. Scale bars, 50 microns.
-
Figure 3—figure supplement 3—source data 1
Percentage of Car4-high EC within 3 microns of Hopx-expressing AT1 cells or Sftpc-expressing AT2 cells.
- https://cdn.elifesciences.org/articles/53072/elife-53072-fig3-figsupp3-data1-v2.xlsx
Figure 3—figure supplement 4
Pulmonary miECs and maECs do not change localization during response to H1N1 influenza infection.
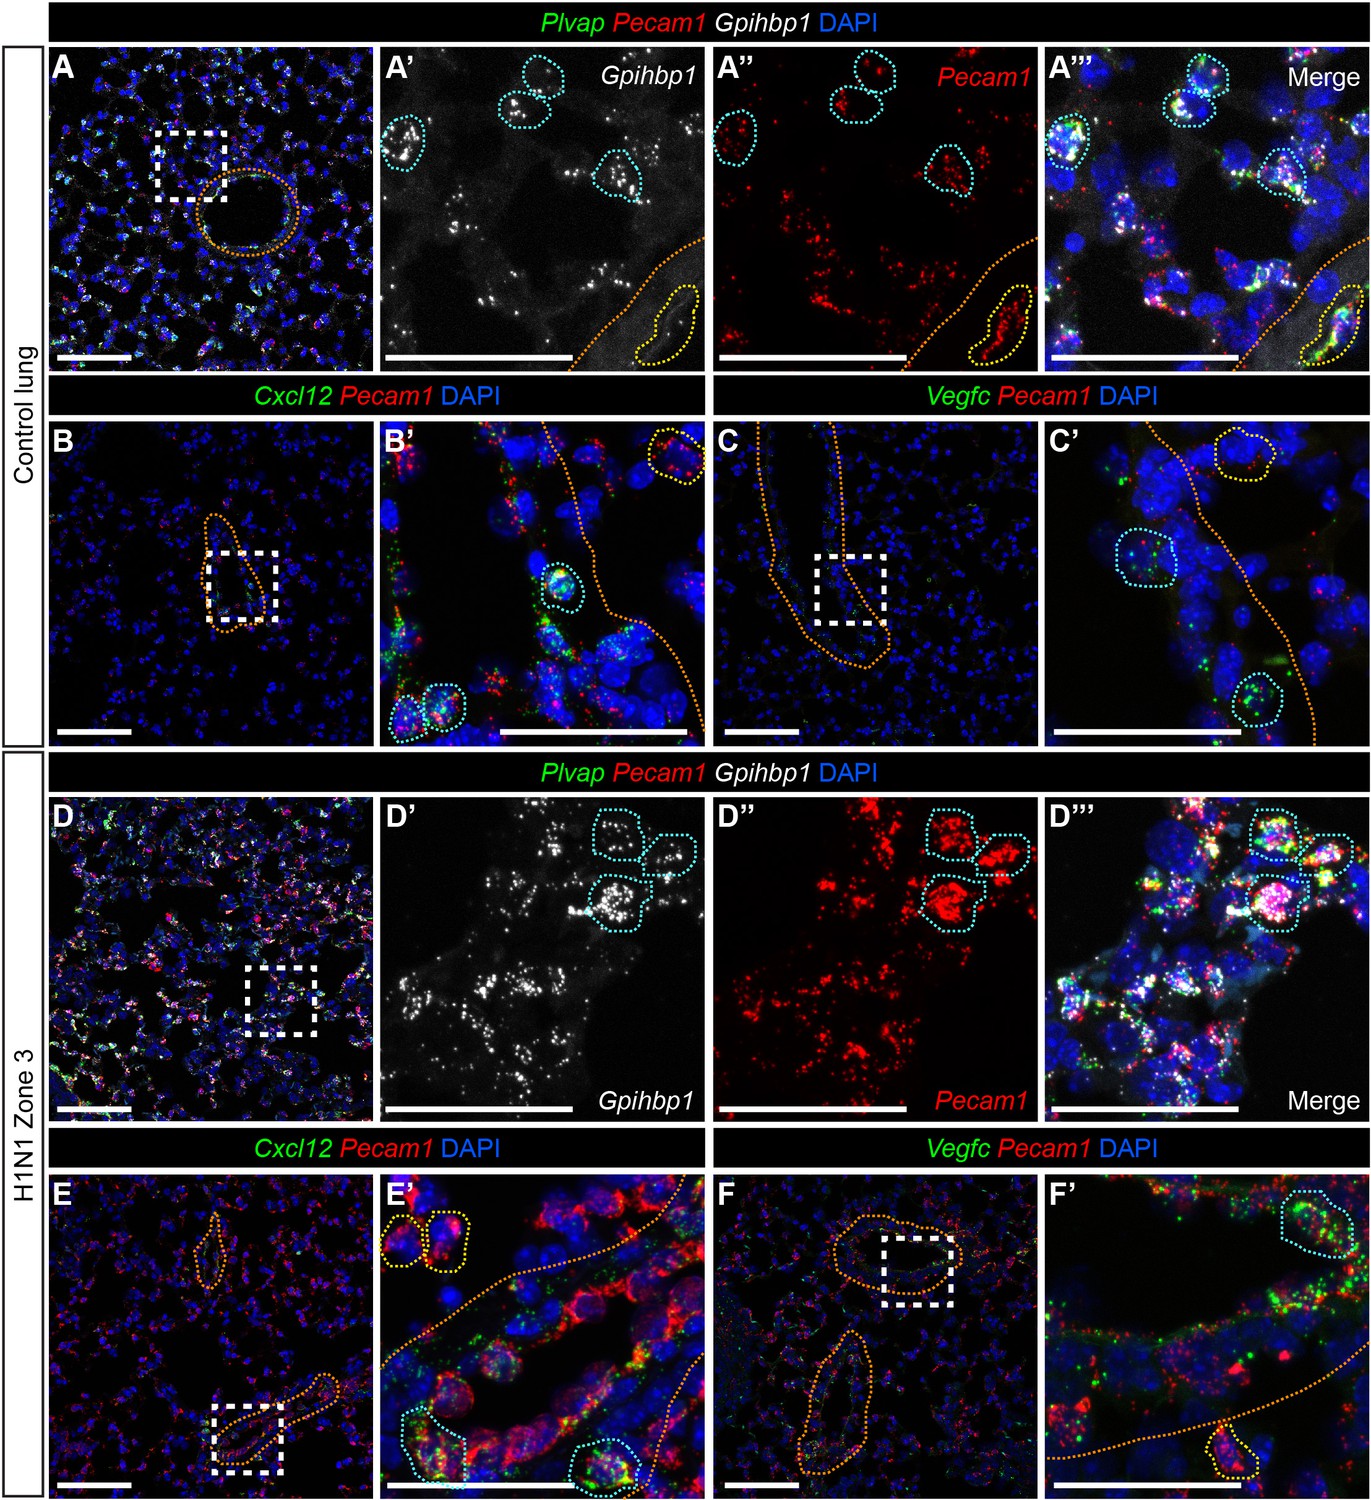
(A) RNAscope for Gpihbp1 indicates that miECs, which also express Pecam1 and Plvap (blue outlines), are located throughout the alveolar space. Gpihbp1-expressing cells are not found within large vessels, indicated by orange dotted lines. Cells within large vessels express Plvap and Pecam1 (yellow outlines). (B, B’) RNAscope for Cxcl12, a marker for arterial maECs, indicates that these cells (Cxcl12+/Pecam1+, blue outlines) localize to large vessels indicated by orange dotted lines but not to the alveolar capillary space at homeostasis. Pecam1+/Cxcl12- cells (yellow outlines) are found outside of the large vessels. (C, C’) RNAscope for Vegfc, a marker of venous maECs, localizes these cells to large vessels at homeostasis (Vegfc+/Pecam1+, blue outlines). Pecam1+/Vegfc- cells (yellow outlines) are found outside of the large vessels. (D) At 14 days post-H1N1 influenza injury, Gpihbp1/Pecam1/Plvap triple-positive miECs are still localized to the alveolar capillary space. (E, E’) After H1N1 injury, Cxcl12+/Pecam1+ arterial maECs continue to be present in large vessels, but not in the capillary endothelium. (F, F’) Vegfc+/Pecam1+ venous maECs continue to localize to large vessels after H1N1 influenza injury. Scale bars in (A), (B), (C), (D), (E), and (F), 100 microns. Scale bars in (A’–A’’’), (B’), (C’), (D’–D’’’), (E’), and (F’), 50 microns.
Figure 4 with 6 supplements
scRNA-seq analysis of whole lungs reveals the appearance of a proliferating EC population in the adult mouse lung after influenza injury.
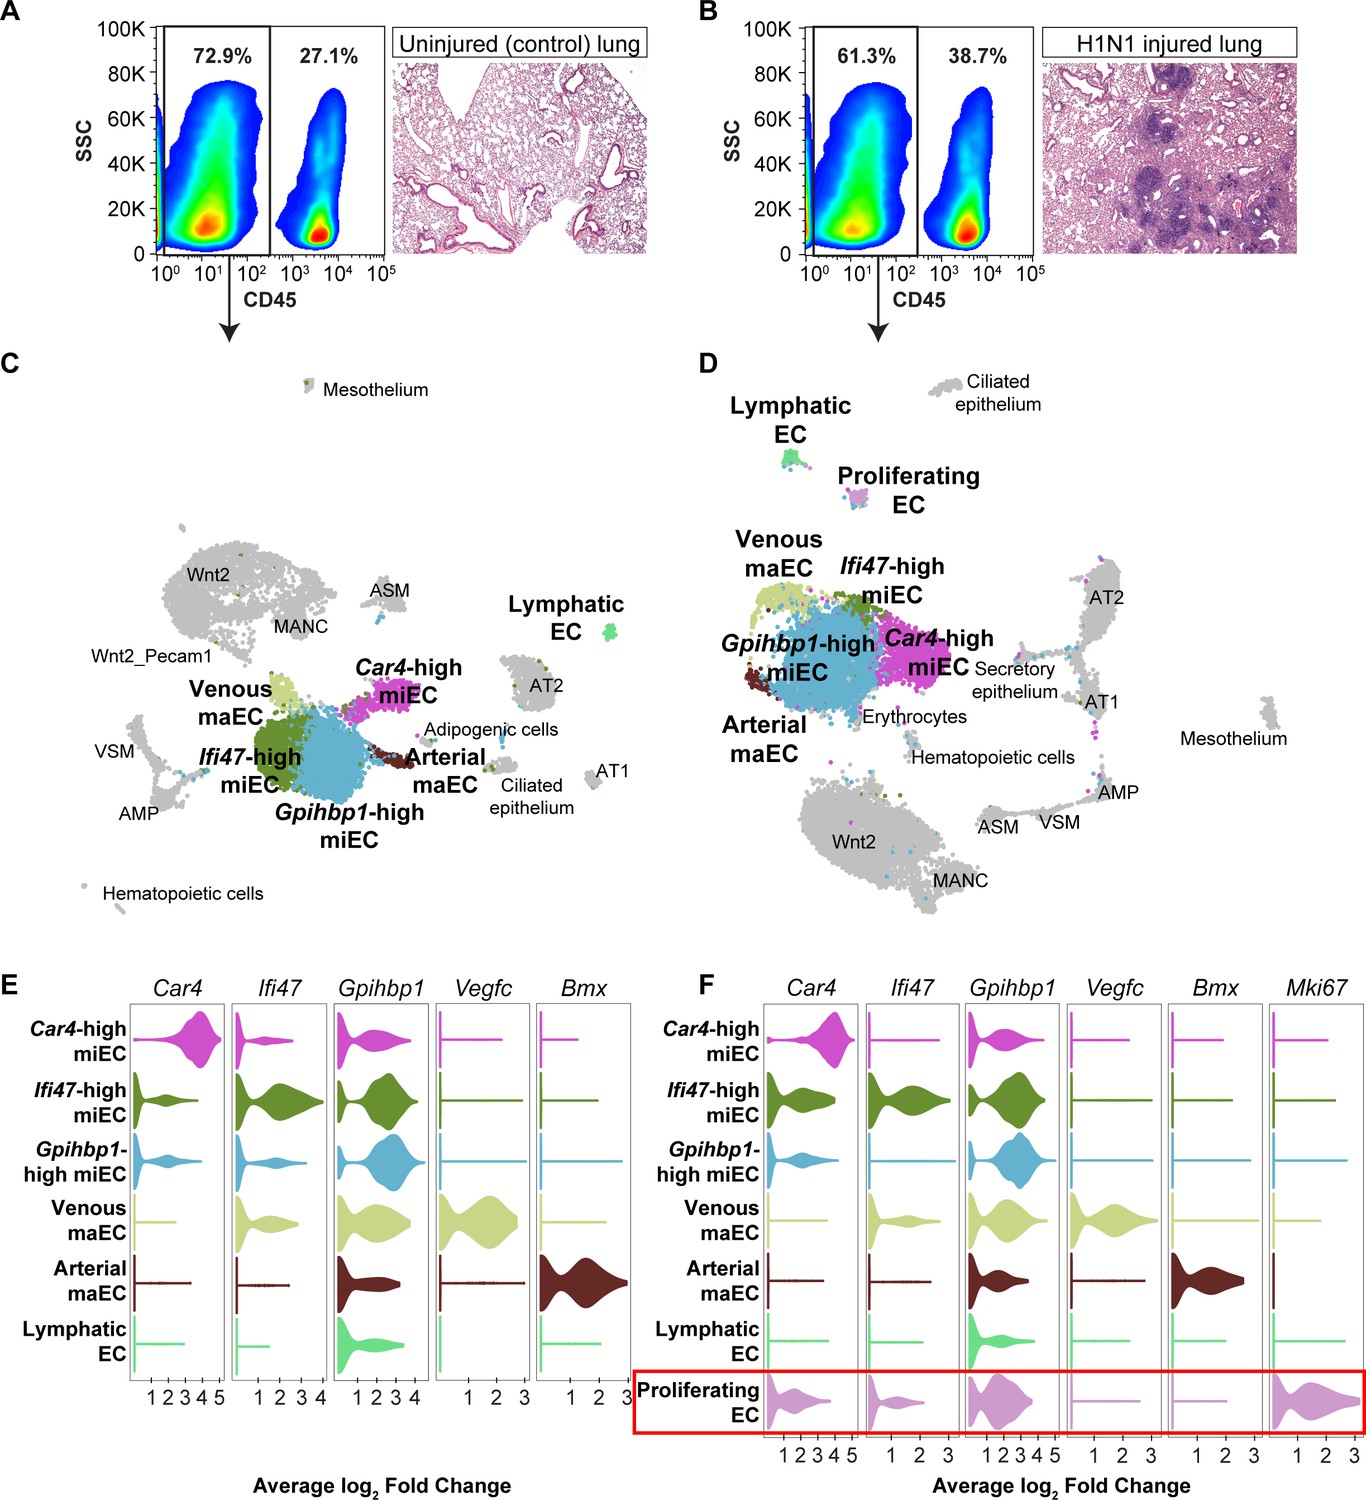
Representative FACS plots demonstrate gating used to isolate CD45- cells from (A) control and (B) influenza-infected adult mouse lungs and indicate an increase in CD45+ cells after influenza infection. H and E staining demonstrates regions of dense injury in H1N1-injured lung, visible as dark purple regions in the alveolar space. Clustering and UMAP dimension reduction of scRNA-seq data from (C) control and (D) H1N1-injured lung identifies epithelial, mesenchymal, and EC clusters. EC populations in both datasets include venous and arterial maECs, two populations of miECs, lymphatic ECs, and Car4-high ECs. In addition, a population of proliferating ECs that is not present in the control mouse lung arises after influenza injury. Violin plots show expression of representative genes for miEC, maEC, and Car4-high EC clusters across ECs in (E) control and (F) H1N1-injured lung datasets. Red box indicates the newly emergent proliferating EC population.
Figure 4—figure supplement 1
Epithelial cell clusters in control and influenza-infected adult mouse lung.
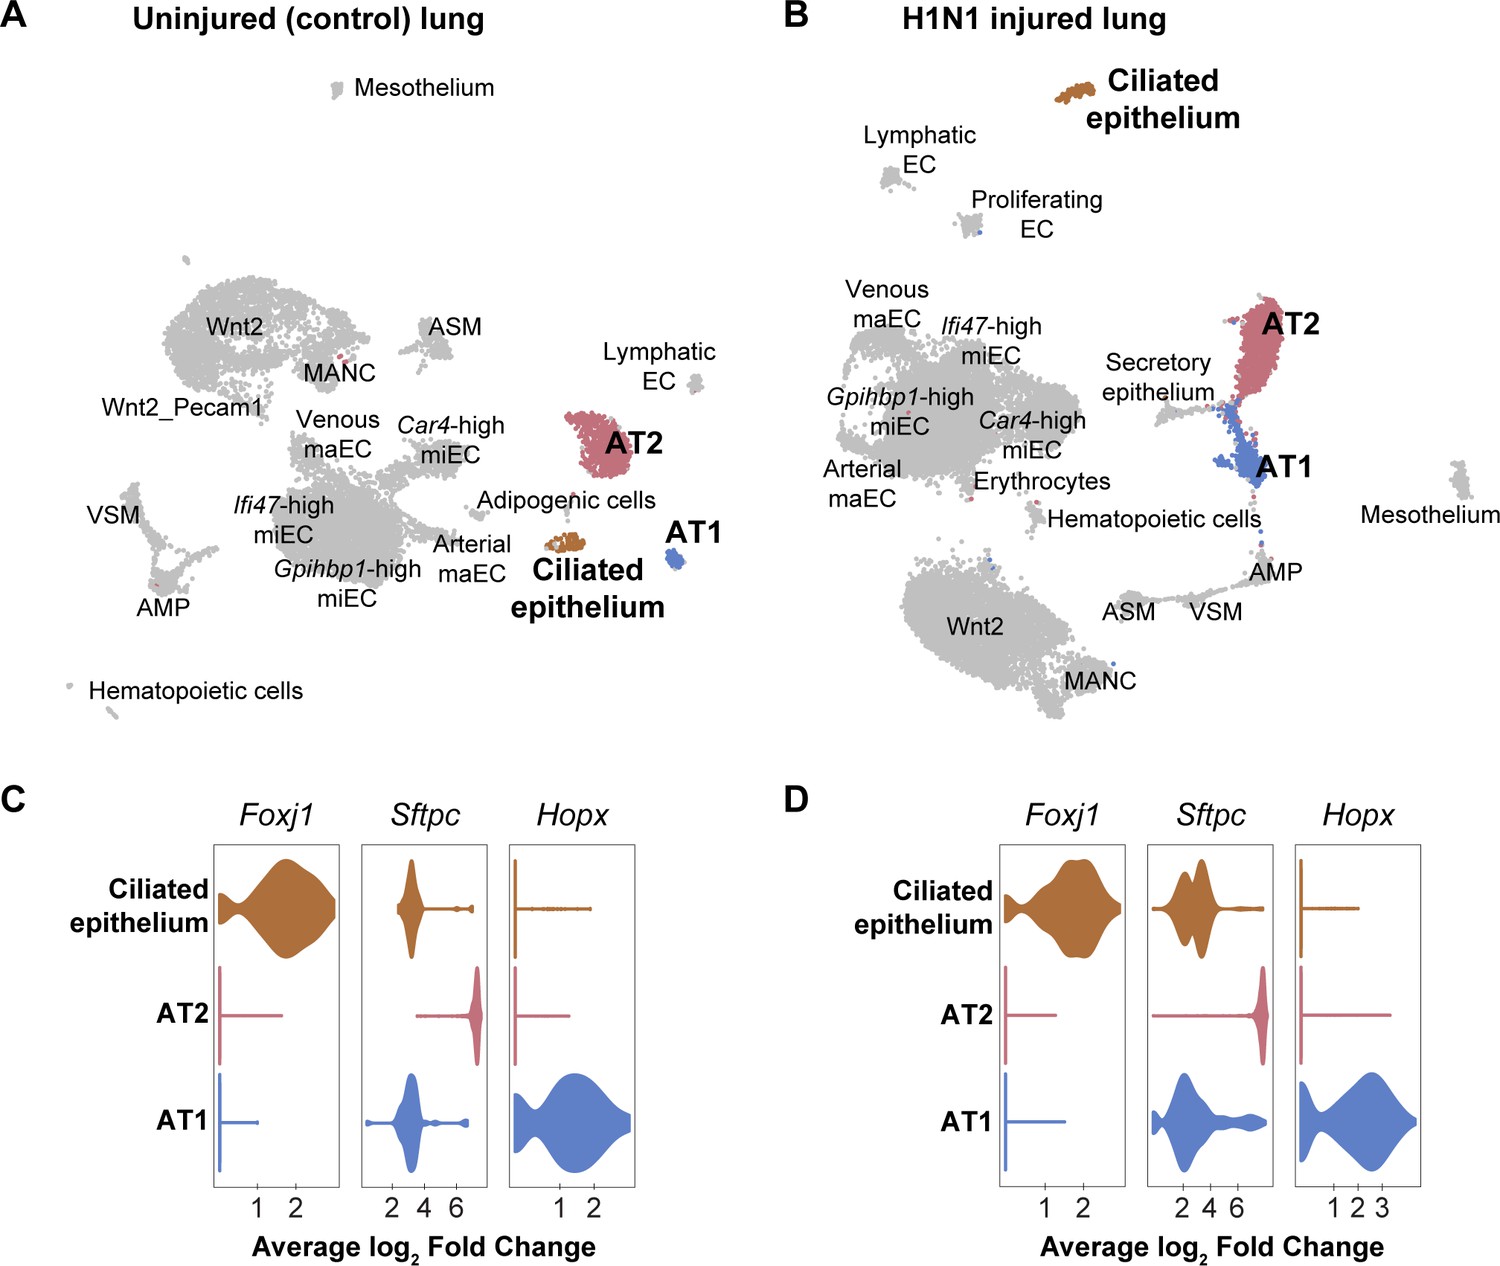
Clustering and UMAP dimension reduction of scRNA-seq data from (A) control and (B) H1N1-injured lung highlighting common epithelial cell clusters. (C), (D) Violin plots show expression of representative genes for epithelial cell clusters. Ciliated cells are characterized by high expression of Foxj1. Alveolar type 2 cells (AT2) express high levels of Sftpc, whereas alveolar type 1 cells (AT1) express high levels of Hopx. Scgb3a2-expressing secretory epithelial cells were identified in the influenza but not the control dataset, likely due to small differences in lung dissection and cell isolation between mice.
Figure 4—figure supplement 2
Mesenchymal cell clusters in control and influenza-infected adult mouse lung.
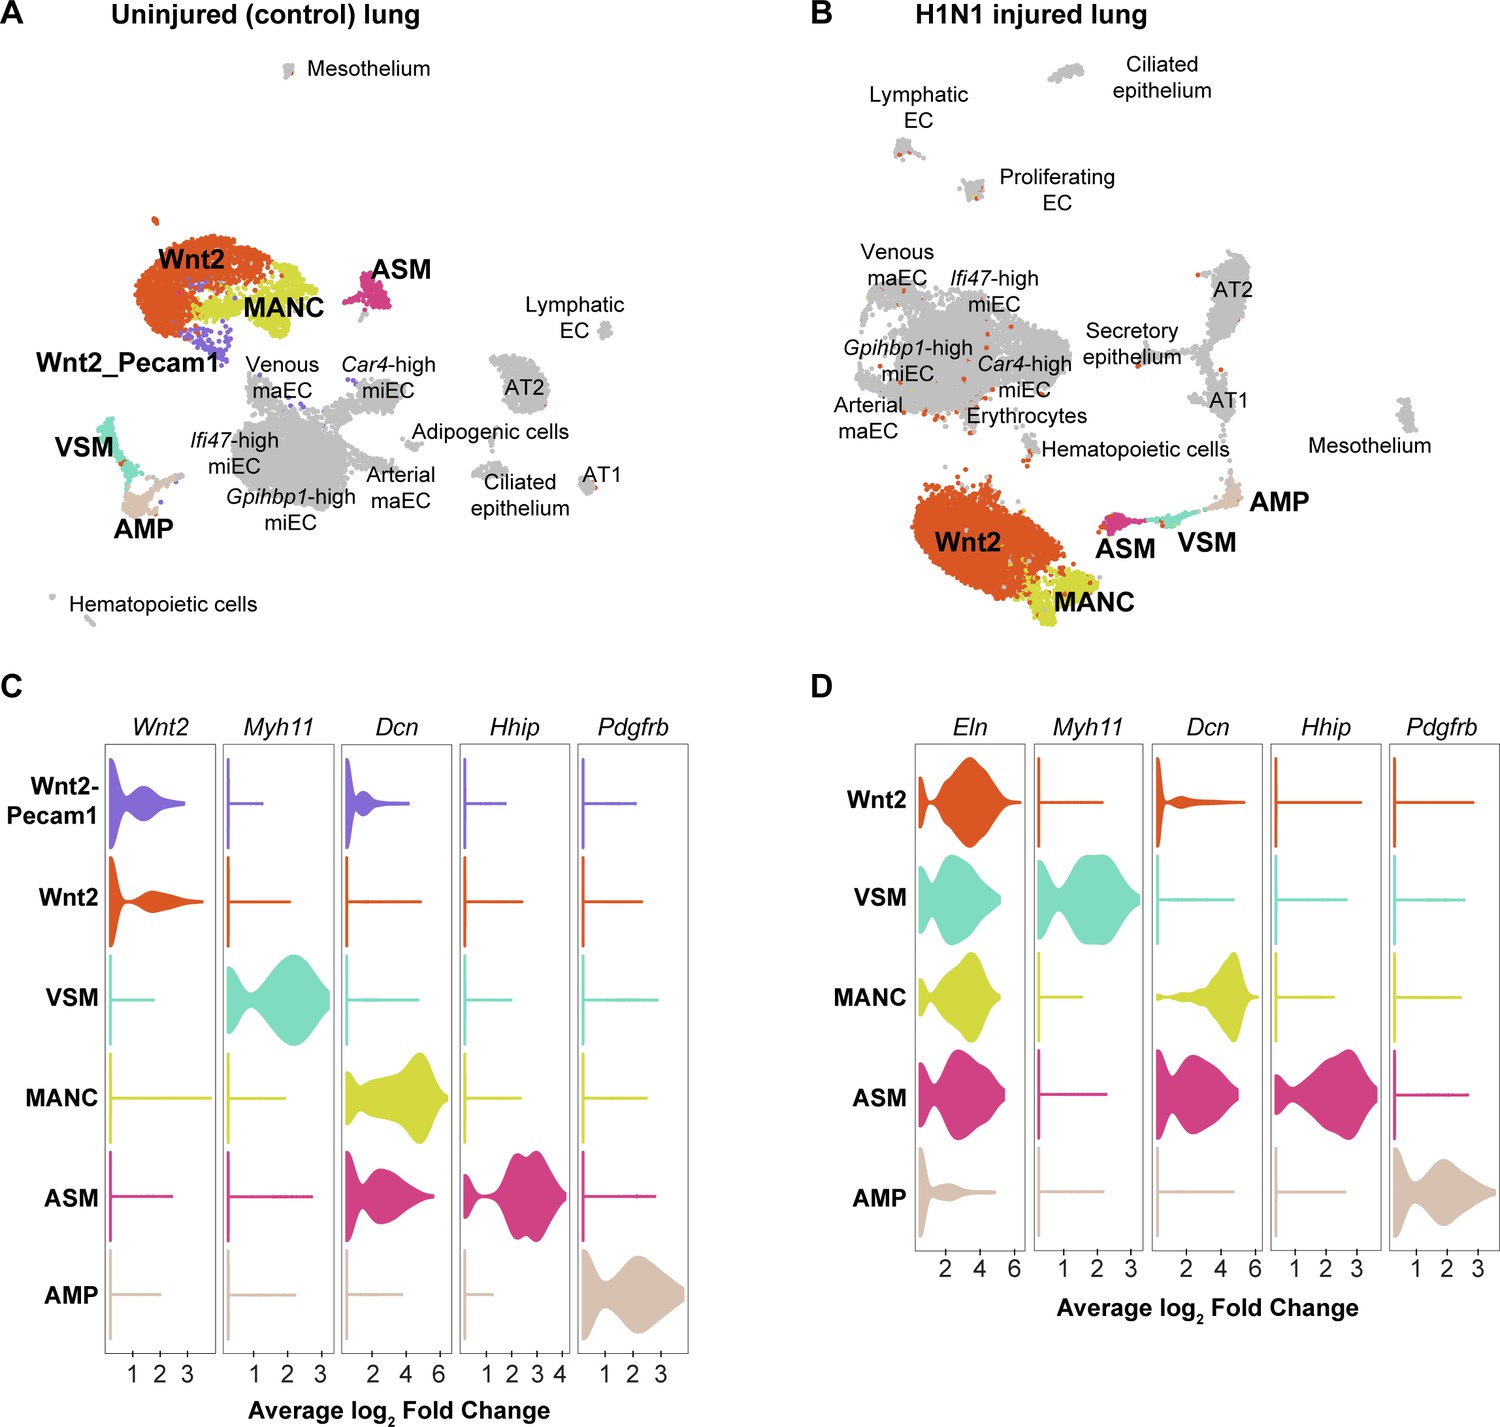
Clustering and UMAP dimension reduction of scRNA-seq data from (A) control and (B) H1N1-injured lung highlighting mesenchymal cell clusters. (C), (D) Violin plots show expression of representative genes for each mesenchymal cell cluster. Mesenchymal alveolar niche cells (MANCs) express high levels of Dcn, whereas Axin2+ myofibroblast progenitors (AMPs) express high levels of Pdgfrb (Zepp et al., 2017). Airway smooth muscle cells (ASM) express Hhip, while vascular smooth muscle cells (VSM) express Myh11. The population of mesenchymal cells we have termed ‘Wnt2-expressing’ expresses high levels of Wnt2 in the control dataset, but is characterized by high expression of Eln in the influenza dataset. In addition, a population of Wnt2-Pecam1 coexpressing cells is found in the control dataset, but not in the influenza dataset.
Figure 4—figure supplement 3
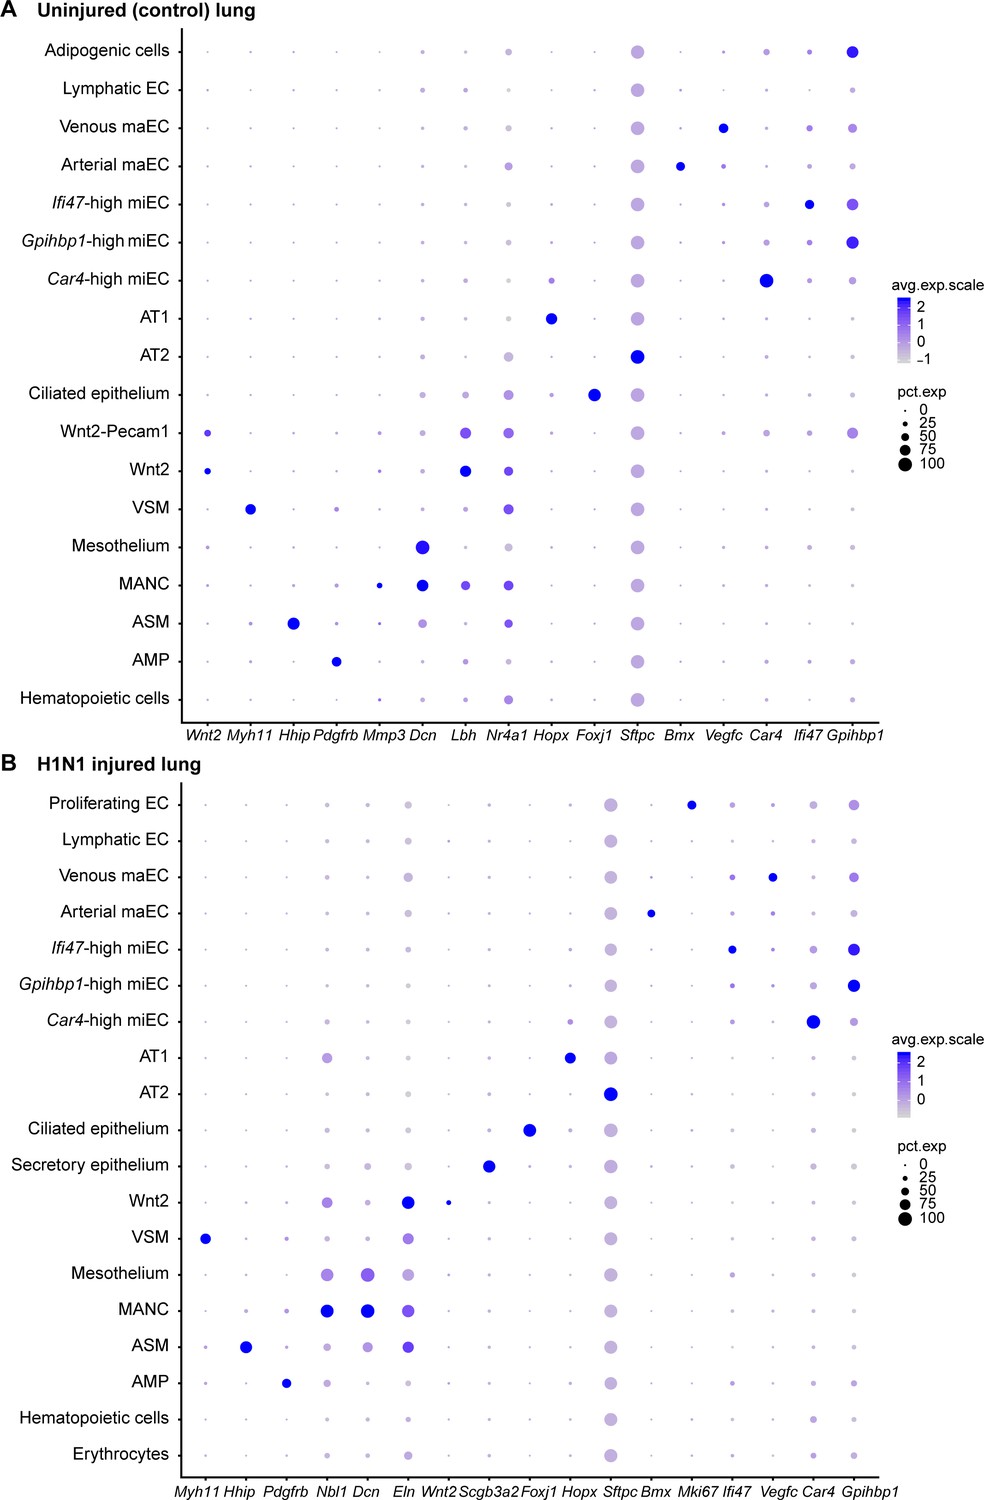
Gene expression of representative genes for each cluster across all clusters.
Dot plots demonstrate relative gene expression level in (A) control and (B) H1N1-injured lung. Gray indicates low expression and dark purple indicates high expression. Circle size indicates the percentage of the cell population expressing each gene.
Figure 4—figure supplement 4
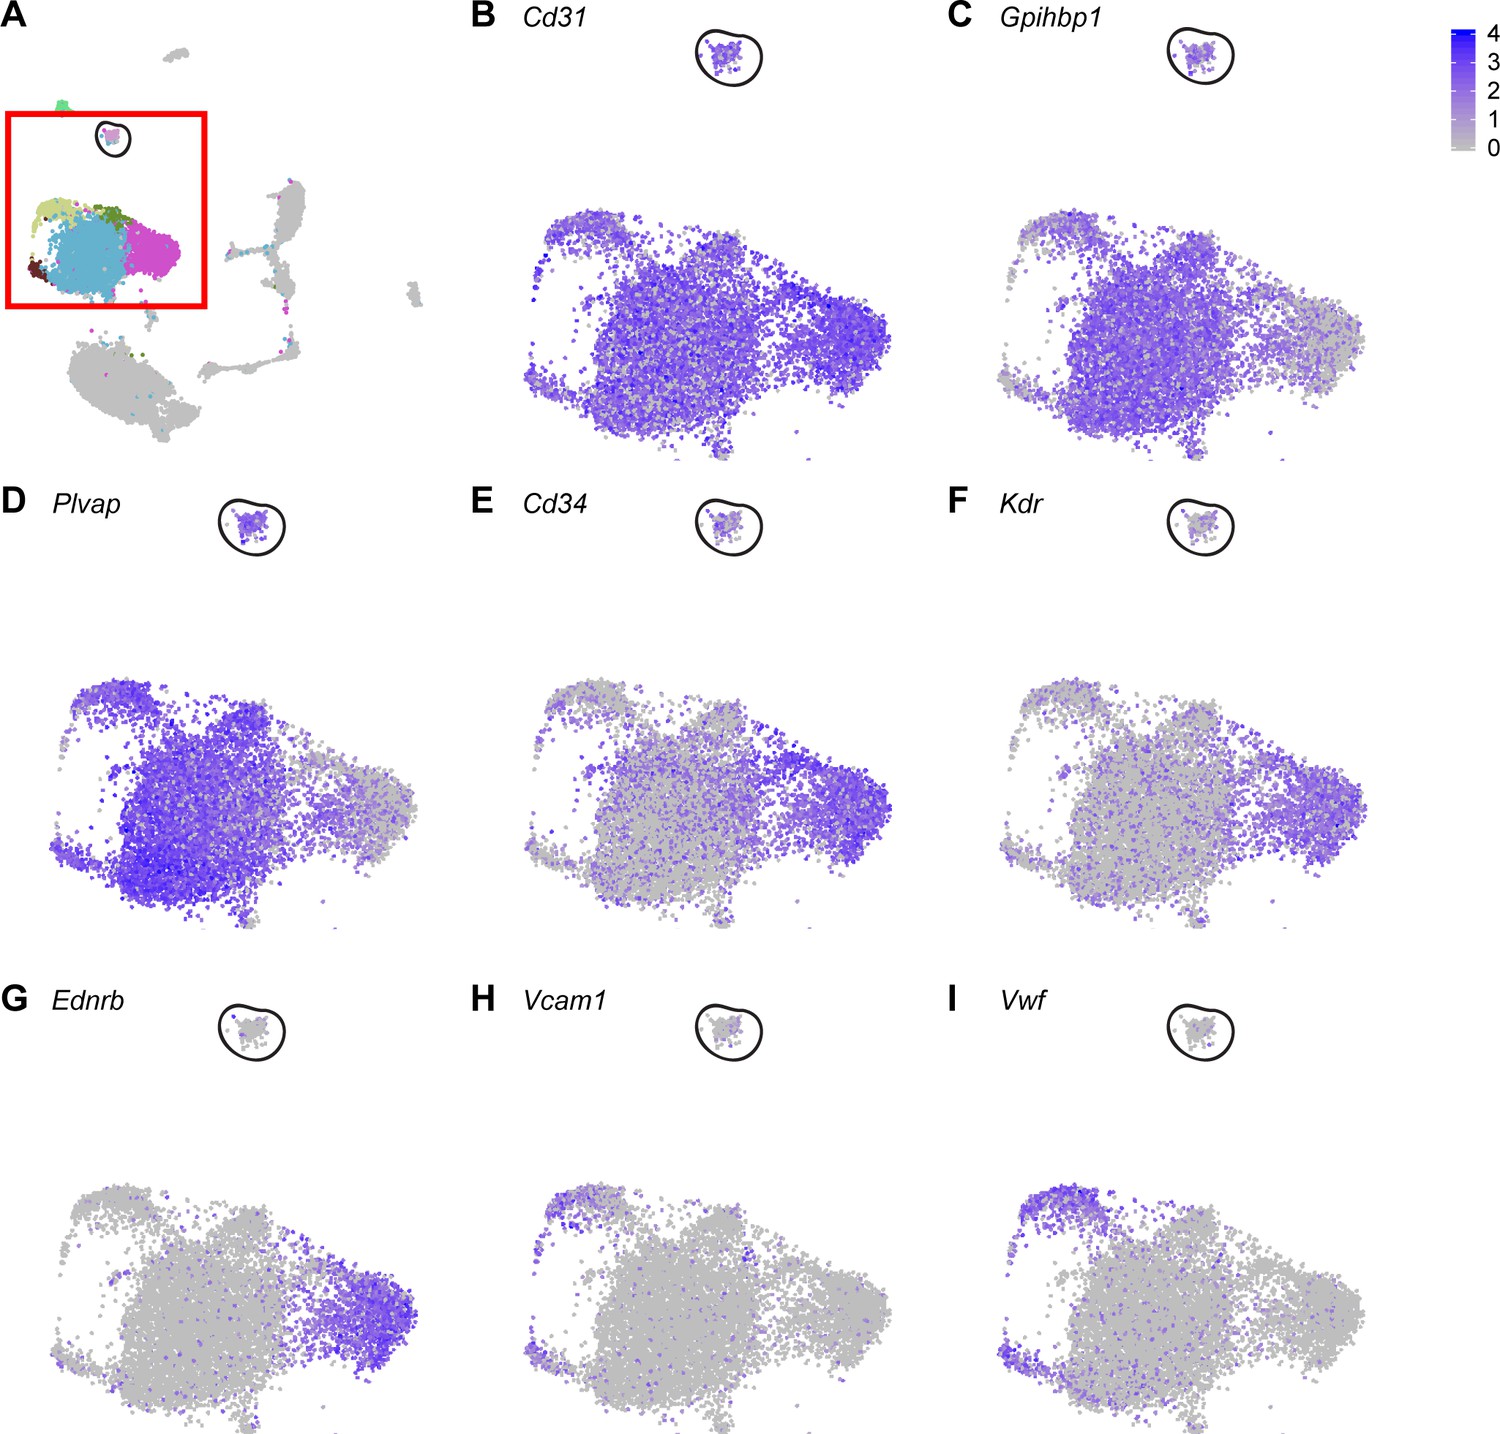
Proliferating ECs express general EC marker genes, but do not express genes that are highly expressed in Car4-high ECs.
(A) UMAP dimension reduction of H1N1 injury scRNA-seq dataset, with red box enclosing EC clusters and representing areas of increased digital zoom displayed in (B)-(I). Black circle demarcates proliferating EC cluster. Proliferating ECs express genes highly expressed in all ECs or in miECs, such as (B) Cd31, (C) Gpihbp1, and (D) Plvap. However, they express moderate levels of (E) Cd34 and do not express other genes that are highly expressed in Car4-high ECs, such as (F) Kdr or (G) Ednrb. Proliferating ECs do not express genes enriched in maECs, such as (H) Vcam1 or (I) Vwf.
Figure 4—figure supplement 5
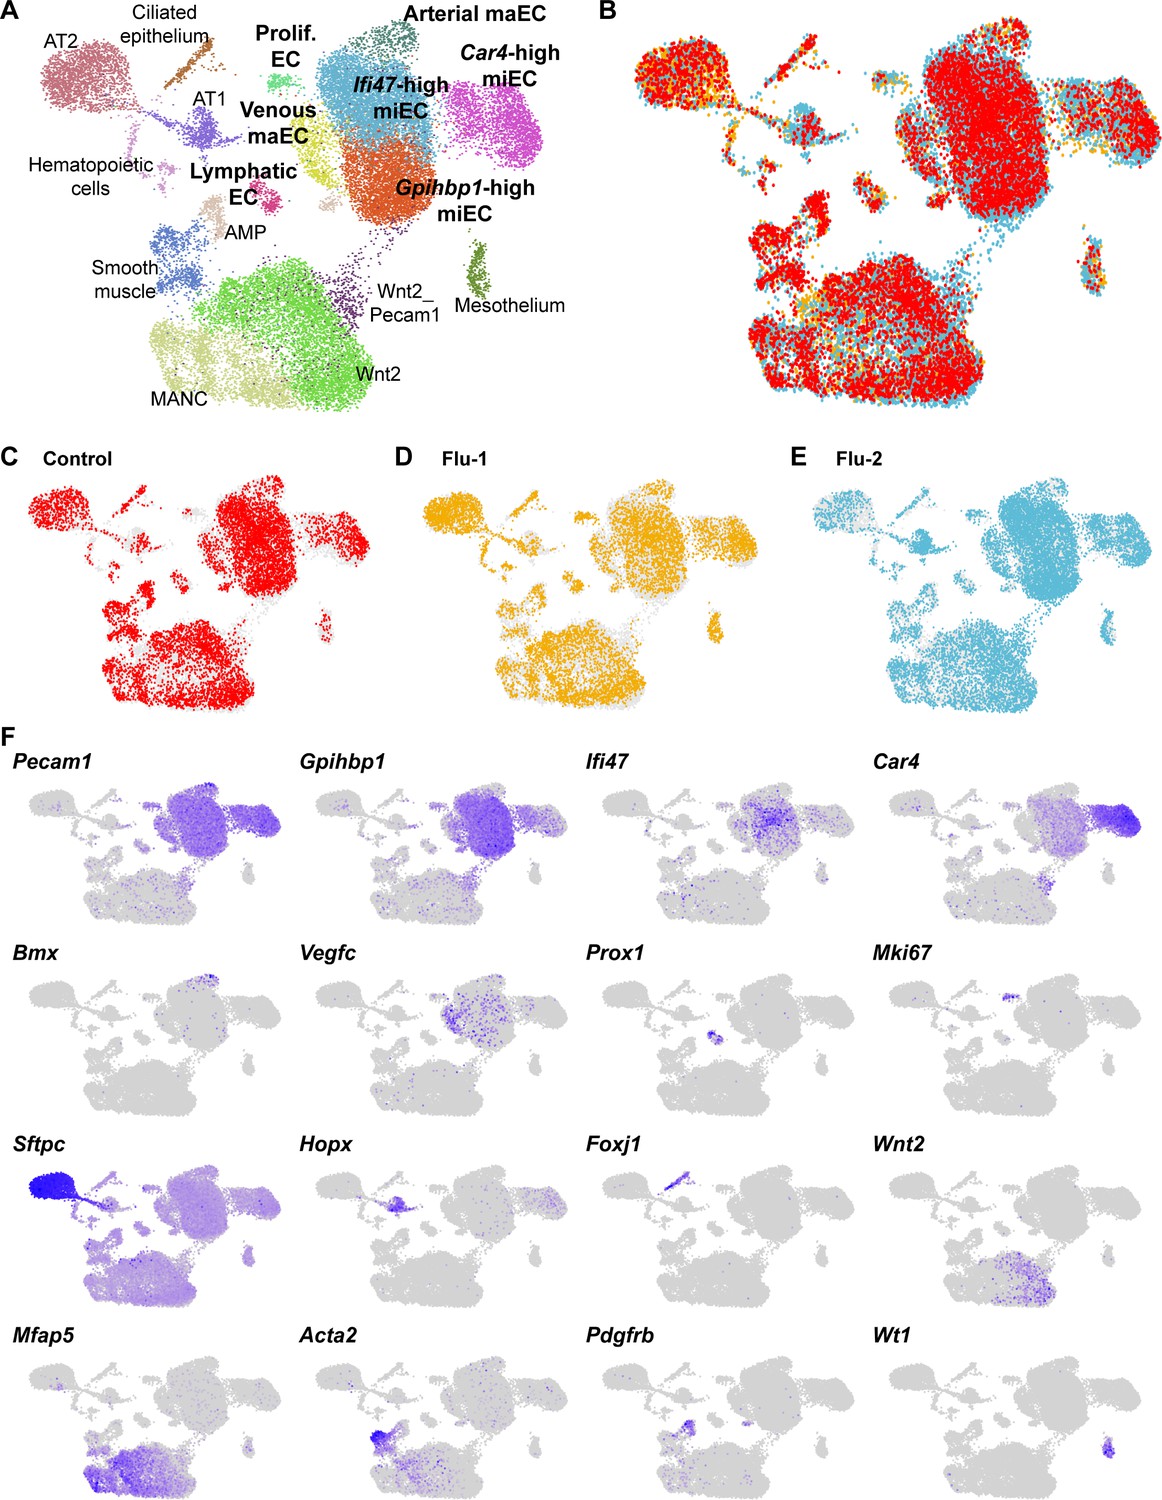
An integrated scRNA-seq dataset reveals concordance between cell types identified in individual control and H1N1 injury datasets.
(A) Aggregation of control (N = 1) and influenza (N = 2) scRNA-seq datasets results in an integrated dataset composed of similar clusters to those identified in individual datasets. (B) Overlay of individual datasets (C)-(E) in UMAP space reveals that each dataset contributes to each cluster identified in the integrated dataset, with the exception of proliferating ECs, which are found mainly in the two influenza datasets. (F) Gene expression feature plots allow identification of clusters based on expression of known cell type markers or markers previously identified within individual control and H1N1 datasets.
Figure 4—figure supplement 6

Analysis of transcriptional changes within EC clusters after H1N1 influenza injury.
(A) Violin plots show change in expression of 12 of the top significantly differentially expressed genes in Car4-high ECs between control and H1N1 influenza scRNA-seq datasets. Genes with significantly decreased expression after H1N1 injury include signaling molecules Acvrl1 (a TGF-beta pathway family member), Adgre5 (a GPCR), and Thbd (thrombomodulin, an EC-specific receptor for thrombin) as well as Ramp2, Emp2, Ier3, and Epas1 (an oxygen-responsive transcription factor). Genes with significantly increased expression after flu injury include Hsp1a1 (a heat shock protein), Sept4, Sparc, and Hes1 (a transcription factor associated with endothelial stalk cell fate). However, it should be noted that the overall transcriptional profile of Car4-high ECs does not change dramatically upon H1N1 influenza infection-mediated lung injury. (B) GO analysis of genes that are significantly differentially expressed between control and flu across all EC populations reveals that ECs respond to flu injury by increasing translation as well as proliferative and survival signaling. ECs also have an apoptotic signature indicating that they may respond to injury by undergoing cell death.
Figure 5 with 6 supplements
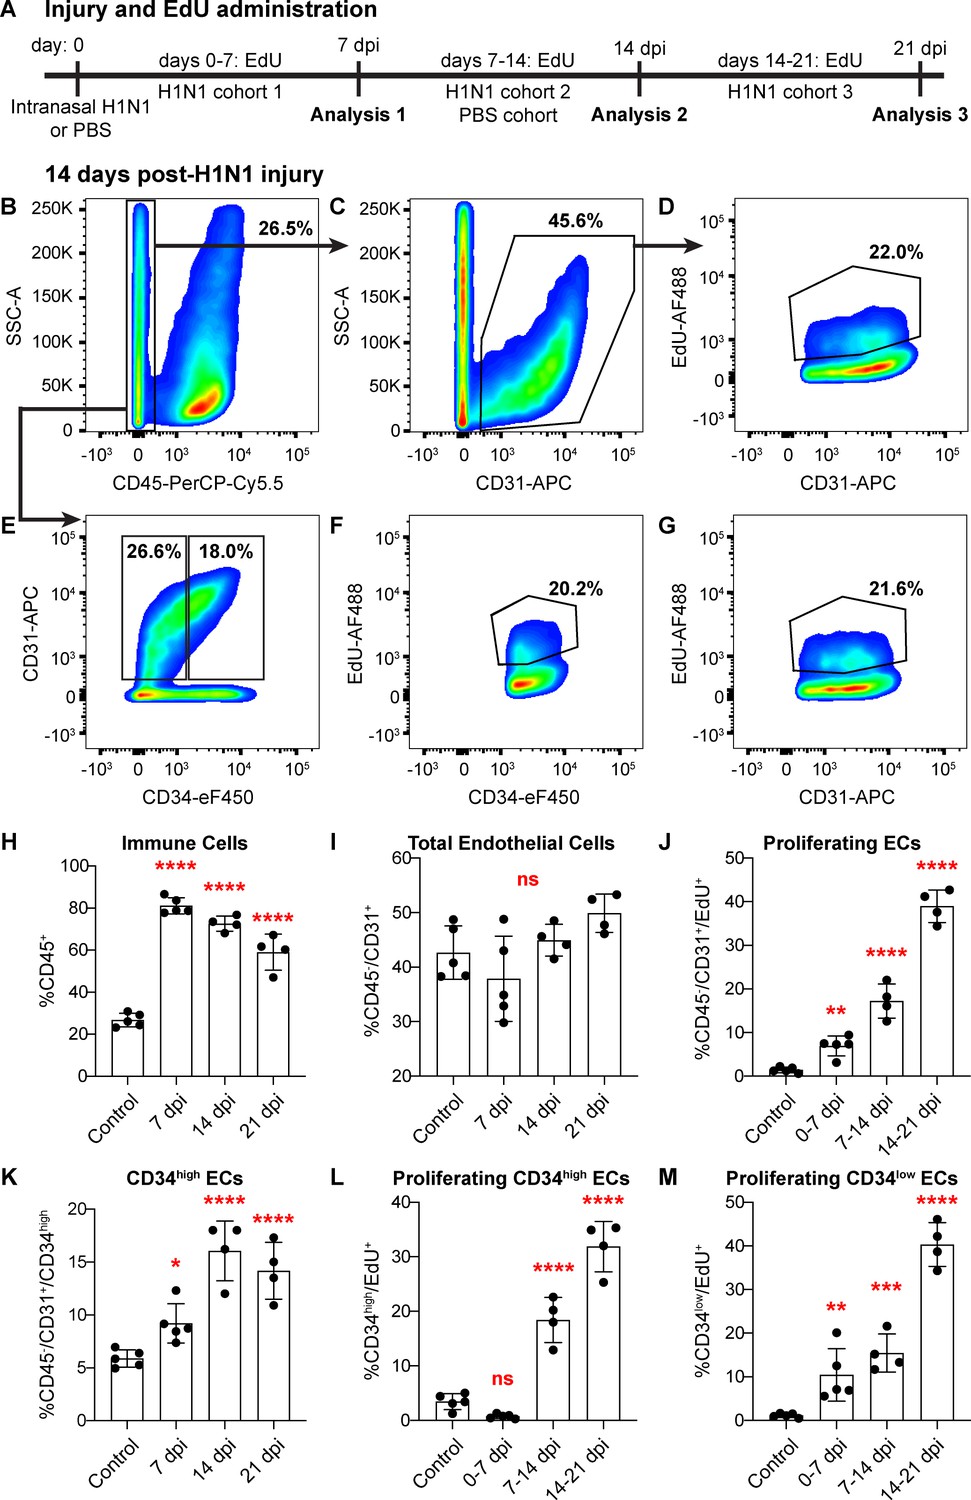
Proliferation of lung ECs increases dramatically during the regenerative response to H1N1 influenza infection.
(A) Outline of the experimental strategy used to assess EC proliferation. Mice given intranasal H1N1 or PBS (control) were given EdU ad libitum in their drinking water (0.2 g/L) either from days 0–7 following infection (N = 5), days 7–14 following infection (N = 4) or PBS (N = 5), or days 14–21 following infection (N = 4). On the last day of EdU administration, mice were euthanized and single-cell suspensions were generated for flow cytometry analysis. (B) At 14 days post-H1N1 injury, single cells isolated from the lungs of a representative mouse given EdU from days 7–14 were 26.5% CD45-negative non-immune cells, (C) of which 45.6% were CD31-positive ECs. (D) Of these ECs, 22.0% had incorporated EdU over days 7–14 of the regenerative response to H1N1 injury. (E) Separation of CD45-negative, CD31-positive ECs into CD34-high and CD34-low populations reveals that in the same representative mouse, 18% of non-immune cells were CD34-high ECs. Within these EC subpopulations, (F) 20.2% of CD34-high ECs and (G) 21.6% of CD34-low ECs had incorporated EdU over days 7–14 of the regenerative response. (H) Quantification of %CD45-positive immune cells over injury and control cohorts demonstrates a significant increase in immune cell populations within the lung at 7, 14, and 21 days post-influenza injury. (I) Quantification of %CD45-negative/CD31-positive ECs in injury and control cohorts shows no significant difference in EC numbers at 7, 14, and 21 days post-influenza injury, perhaps because H1N1 injury depletes ECs at an earlier time point after injury. (J) Quantification of %CD45-negative/CD31-positive/EdU-positive proliferating ECs across all three time windows demonstrates a significant increase in EC proliferation between control animals administered EdU for 7 days and all three time windows considered after H1N1 injury. (K) The percentage of %CD45-negative/CD31-positive/CD34-high ECs also increases significantly at days 7, 14, and 21 following H1N1 injury. When EdU incorporation is considered individually in (L) CD34-high ECs and (M) CD34-low ECs, both populations proliferate significantly during the H1N1 injury response. *, p<0.05; **, p<0.01; ***, p<0.001; ****, p<0.0001; ns, not significant.
Figure 5—figure supplement 1
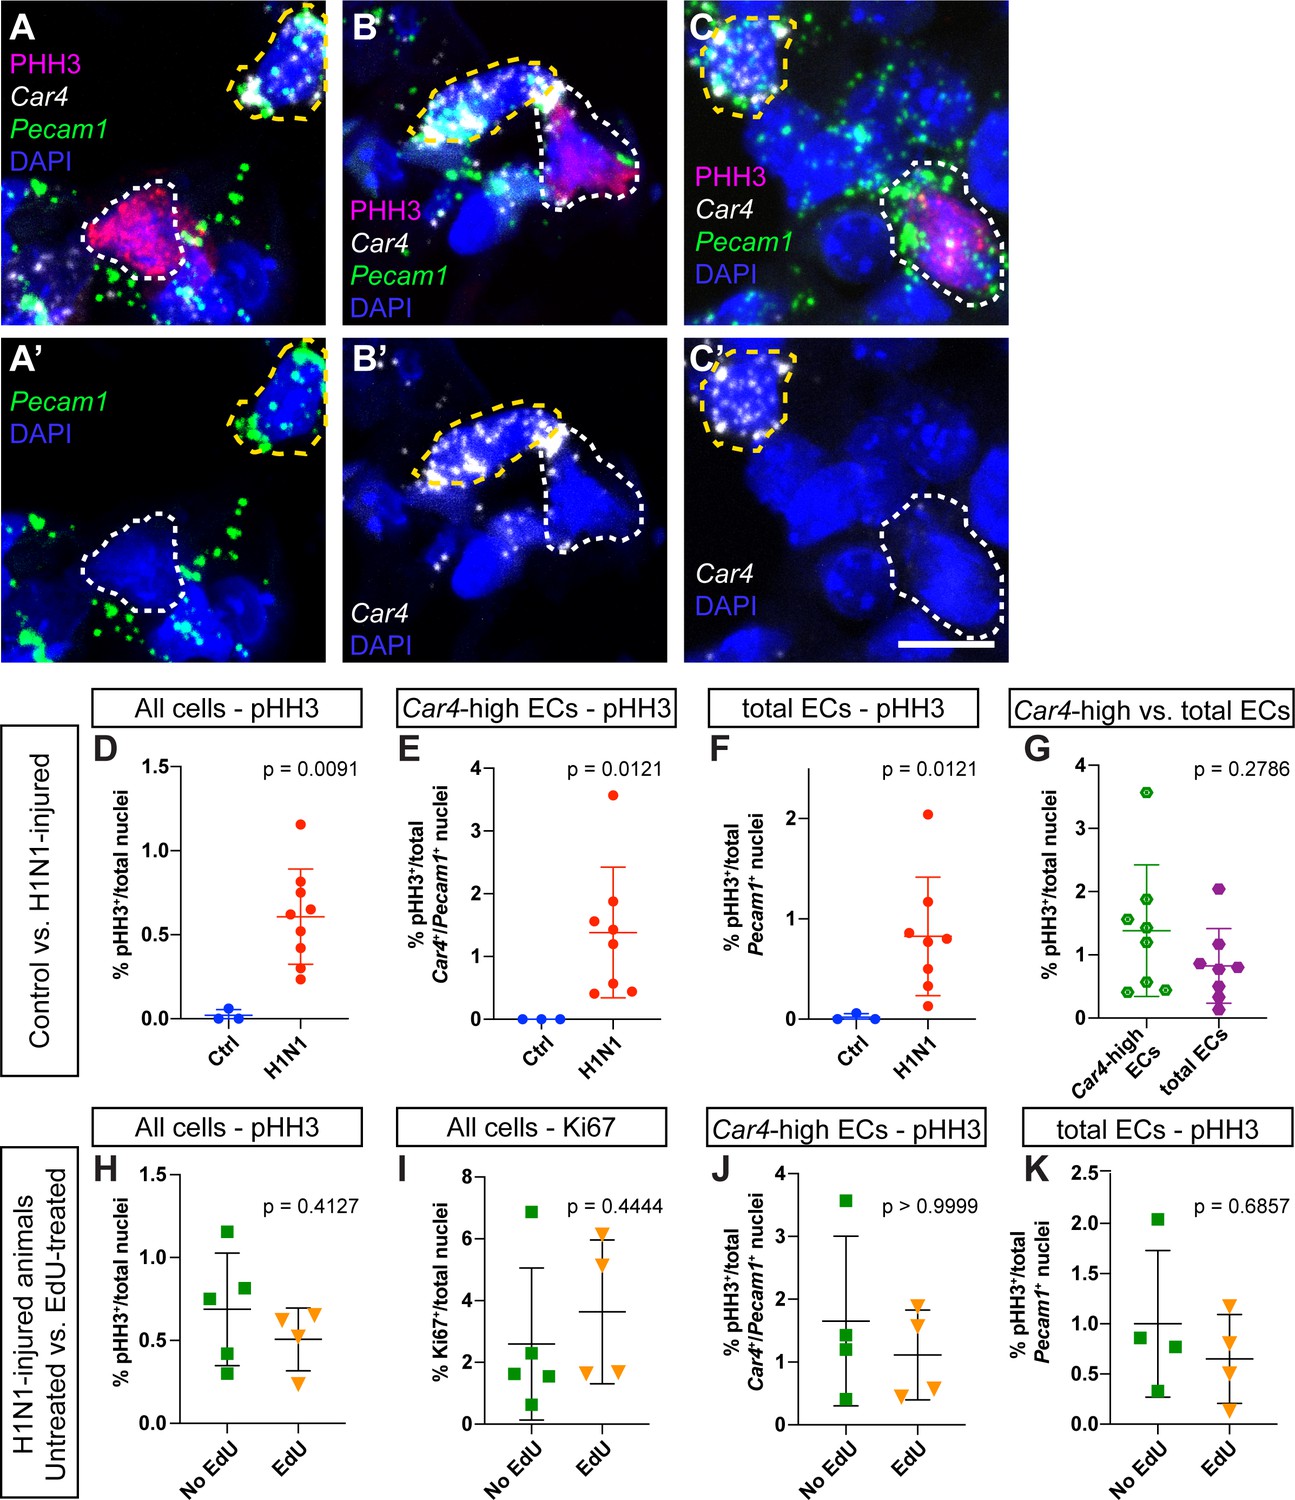
Assessment of proliferation by IHC for phospho-histone H3 reveals no differences between EdU-treated and EdU-untreated mice.
(A–C) Representative images of (A) a proliferating non-endothelial cell (white dotted line, pHH3+/Car4-/Pecam1-), (B) a proliferating Car4-high EC (white dotted line, pHH3+/Car4+/Pecam1+), and (C) a proliferating Car4- endothelial cell (white dotted line, pHH3+/Car4-/Pecam1+). Yellow dotted lines outline non-proliferative Car4-high ECs (pHH3-/Car4+/Pecam1+). (D) Comparison of total % pHH3+ cells between uninjured (N = 3) and flu-injured animals (N = 8) at 14 dpi. (E) Comparison of % pHH3+ Car4-high ECs between uninjured and flu-injured animals at 14 dpi. (F) Comparison of % pHH3+ total ECs between uninjured and flu-injured animals at 14 dpi. H1N1-injured animals have a significantly higher percentage of pHH3+ proliferating cells in each case. (G) Proliferation is not significantly different between Car4-high ECs and total ECs. Comparison of (H) % pHH3+ or (I) % Ki67+ total nuclei between EdU-treated (N = 4) and -untreated (N = 4) mice at 14 days post H1N1 injury reveals no differences in proliferation. Quantification of (J) % pHH3+Car4-high ECs or (K) % pHH3+ total ECs also reveals no differences in proliferation between Edu-treated and -untreated mice at 14 dpi. Scale bars, 10 microns.
-
Figure 5—figure supplement 1—source data 1
Cell counts for total number of proliferating cells, normalized to total number of nuclei.
- https://cdn.elifesciences.org/articles/53072/elife-53072-fig5-figsupp1-data1-v2.xlsx
Figure 5—figure supplement 2
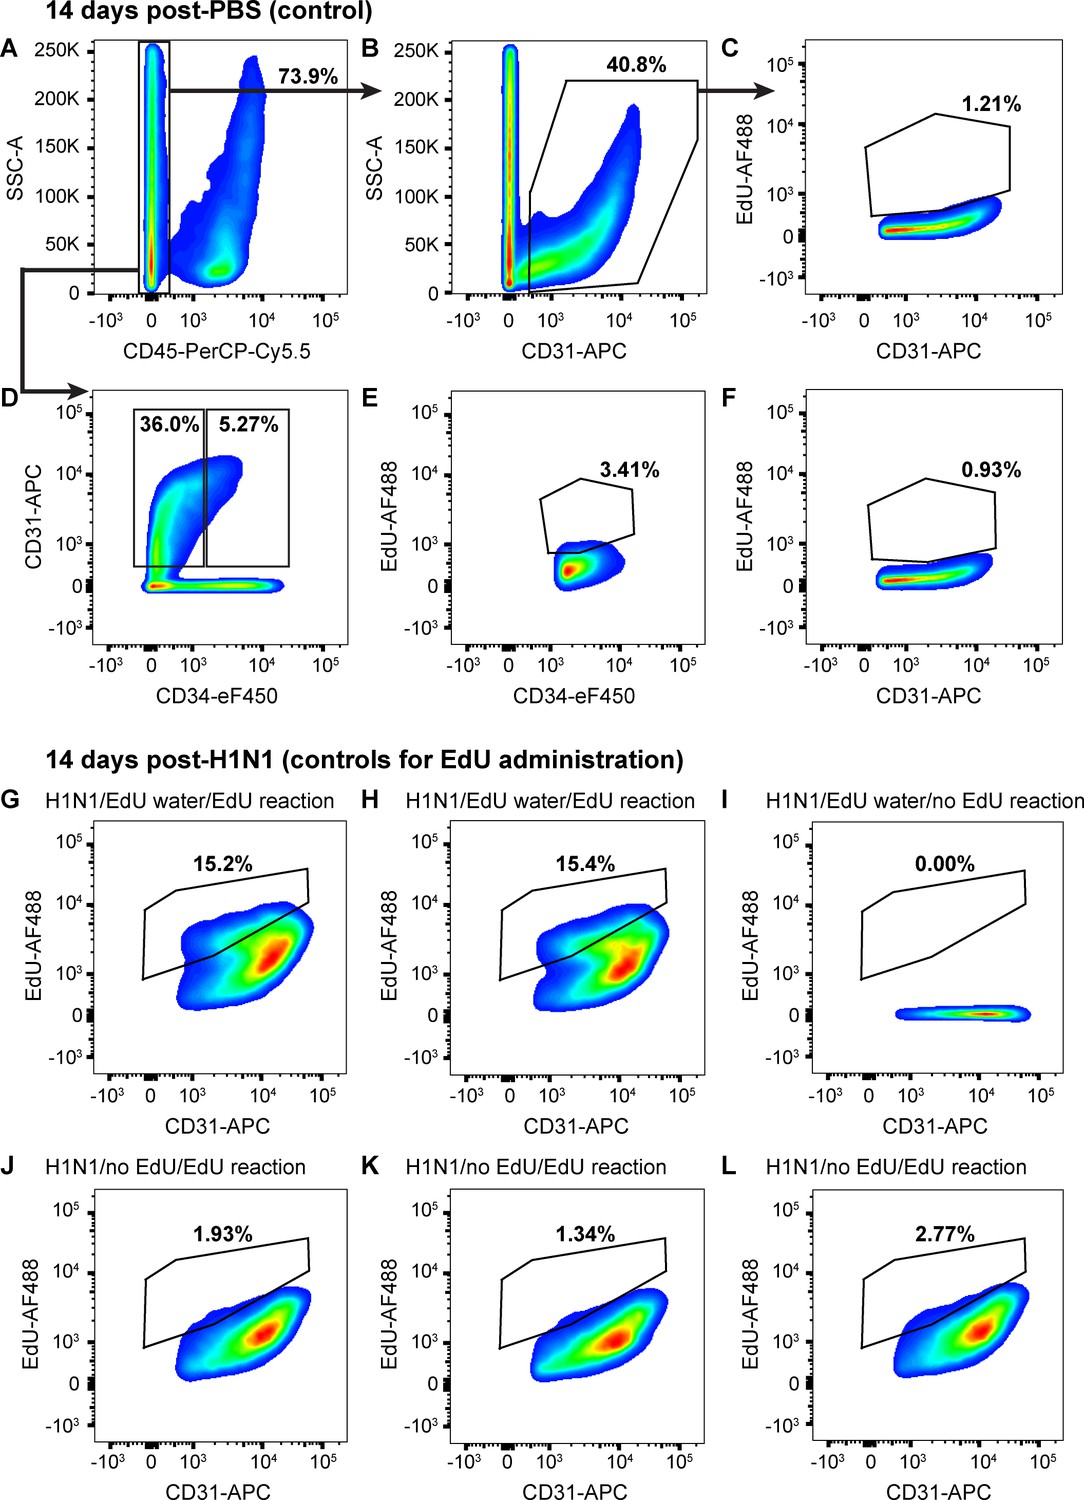
ECs proliferate very little in uninjured mice.
(A) 14 days after intranasal PBS, a single-cell suspension isolated from the lungs of a representative mouse given EdU from days 7–14 had 73.9% CD45-negative non-immune cells, (B) of which 40.8% were CD31-positive ECs. (C) Of these ECs, 1.21% had incorporated EdU over days 7–14 after PBS, indicating that sham injury elicits very little proliferative response in control mice. (D) Separation of CD45-negative, CD31-positive ECs into CD34-high and CD34-low populations demonstrates that in the same control mouse, only 5.27% of non-immune cells were CD34-high ECs, a much lower percentage than that seen 14 days post-H1N1 injury. Within these EC subpopulations, (E) 3.41% of CD34-high ECs and (F) 0.93% of CD34-low ECs had incorporated EdU over days 7–14 following PBS administration, again indicating very little EC proliferation in the uninjured lung. Quantification of these parameters across the entire control cohort is shown in Figure 5. (G, H) In a separate control experiment to assess the reliability of EdU water administration and measurement of EdU incorporation by flow cytometry, single-cell lung suspensions isolated from two mice given H1N1 on day 0 and EdU water from days 7–14 demonstrated EdU incorporation in 15.2% and 15.4% of CD31-positive ECs. (I) In contrast, no EdU-positive cells were observed in the single-cell lung suspension of a mouse given H1N1 and EdU water but without fluorescent labeling of EdU. (J, K, L) Single-cell lung suspensions isolated from three individual mice given H1N1 but no EdU water and treated with the EdU fluorescent labeling assay demonstrated low levels of background fluorescence in the EdU channel. This indicates that although background levels of fluorescence are possible in the EdU labeling assay, the size of the changes we observe between control and flu-injured animals can be reliably detected using the EdU water administration and fluorescent labeling strategy we employed.
Figure 5—figure supplement 3
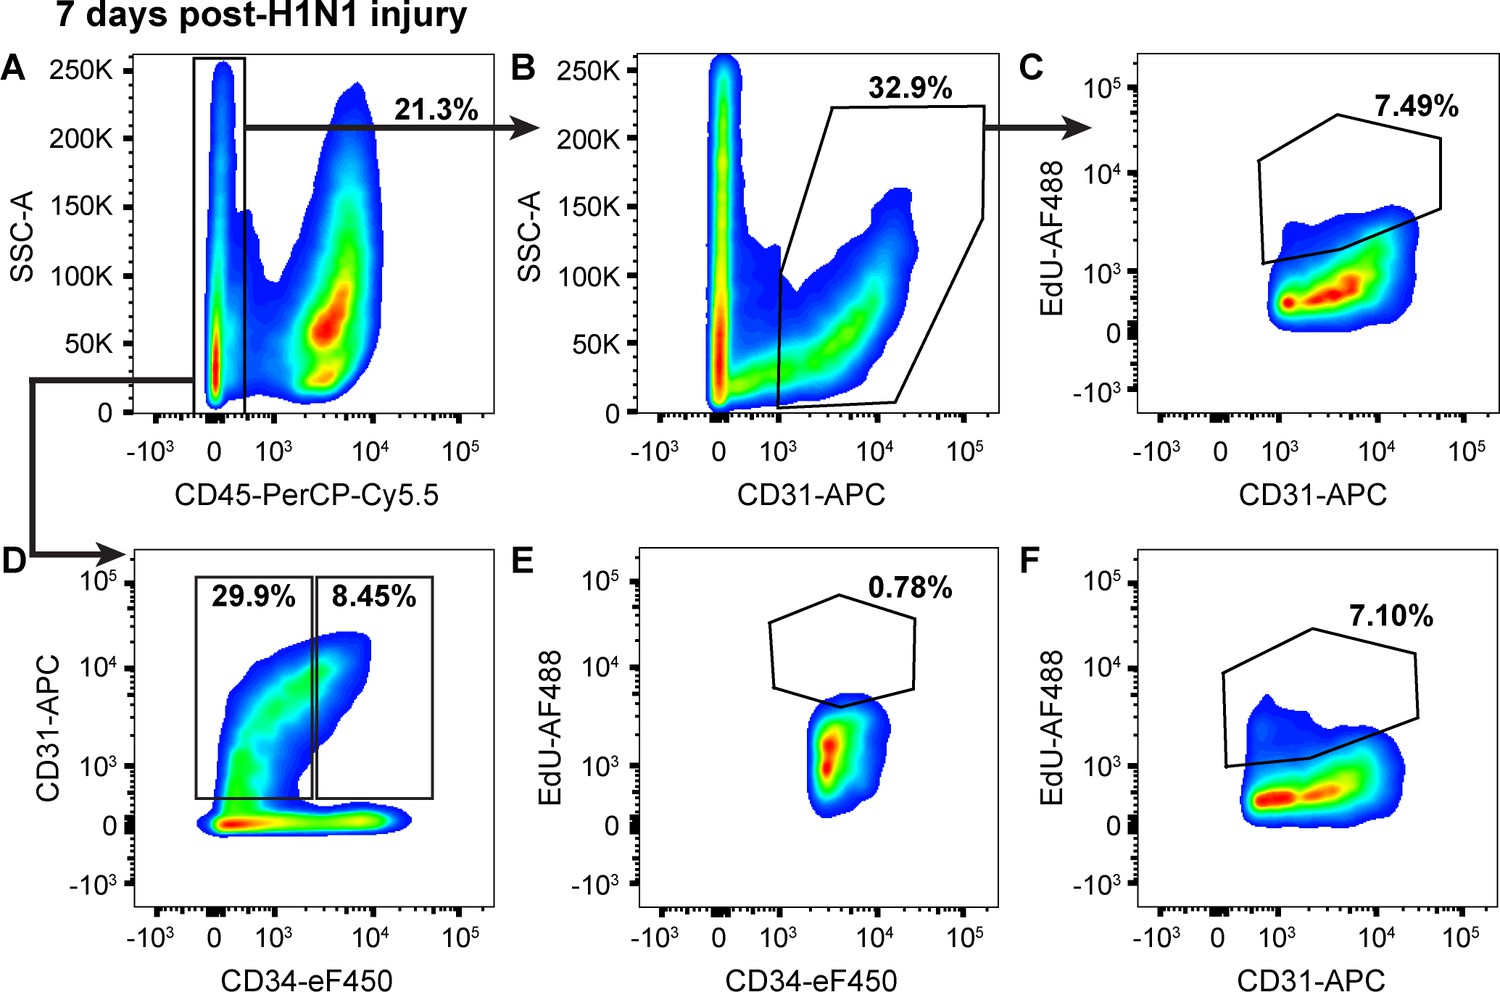
Proliferation in CD34-low ECs increases in the first seven days following H1N1 injury.
(A) 7 days after intranasal H1N1 administration, a single-cell suspension isolated from the lungs of a representative mouse given EdU from days 0–7 following injury had 21.3% CD45-negative non-immune cells, indicative of a robust immune response in the lung at this time point. (B) Of the non-immune cells, 32.9% were CD31-positive ECs. (C) Of these ECs, 7.49% had incorporated EdU over days 0–7 after influenza injury, indicating that endothelial proliferation is already increasing during this early time window. (D) Separation of CD45-negative, CD31-positive ECs into CD34-high and CD34-low populations shows that in the same representative mouse, 8.45% of non-immune cells are CD34-high ECs, a percentage intermediate between control animals and animals at 14 dpi. Within these EC subpopulations, (E) 0.78% of CD34-high ECs and (F) 7.10% of CD34-low ECs had incorporated EdU over days 0–7 following H1N1 administration, indicating that EC proliferation during this early time window following influenza injury is driven largely by CD34-low ECs. Quantification of these parameters across H1N1 cohort one is shown in Figure 5.
Figure 5—figure supplement 4
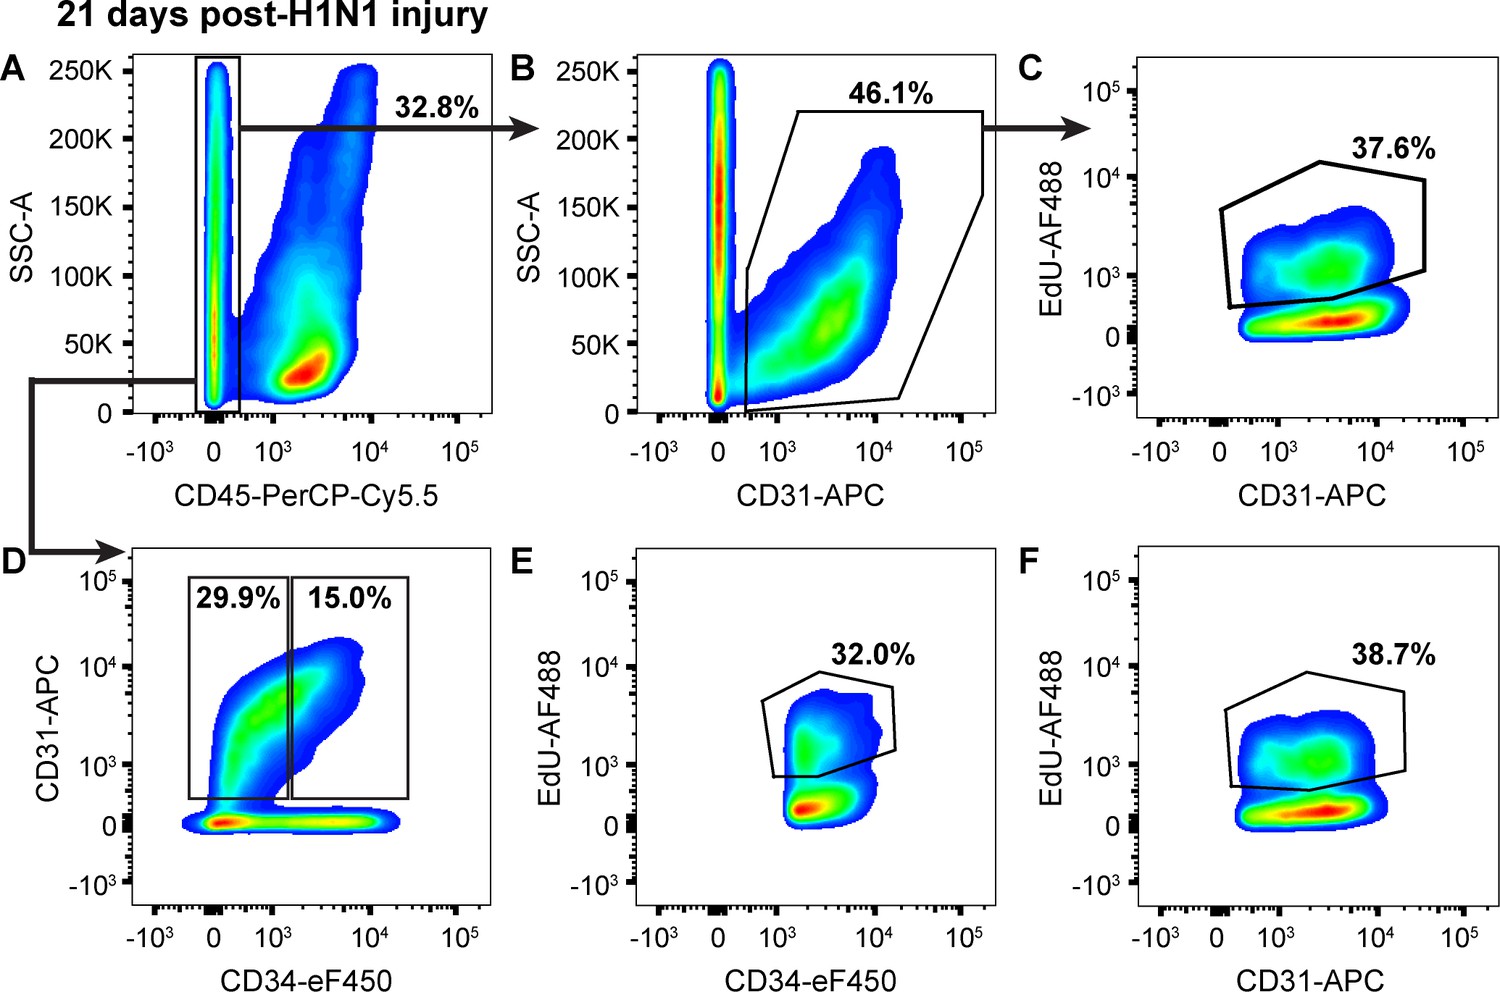
Endothelial proliferation continues to increase from 14 to 21 days following H1N1 injury.
(A) At 21 days post-H1N1 injury, single cells isolated from the lungs of a representative mouse given EdU from days 14–21 were 32.8% CD45-negative non-immune cells, indicating that immune response in the lung is still high at this later time point. (B) Of the non-immune cells, 46.1% were CD31-positive ECs. (C) Of these ECs, 37.6% had incorporated EdU over days 14–21 of the regenerative response to H1N1 injury, indicating that EC proliferation is still ongoing and even increasing later in regeneration. (D) Separation of CD45-negative, CD31-positive ECs into CD34-high and CD34-low populations reveals that in the same representative mouse, 15% of non-immune cells are CD34-high ECs, with (E) 32.0% of CD34-high ECs and (F) 38.7% of CD34-low ECs incorporating EdU over days 7–14 of the regenerative response. This indicates that both EC populations continue to proliferate over the third week of regeneration following H1N1 injury in the lung. Quantification of these parameters across H1N1 cohort three is shown in Figure 5.
Figure 5—figure supplement 5
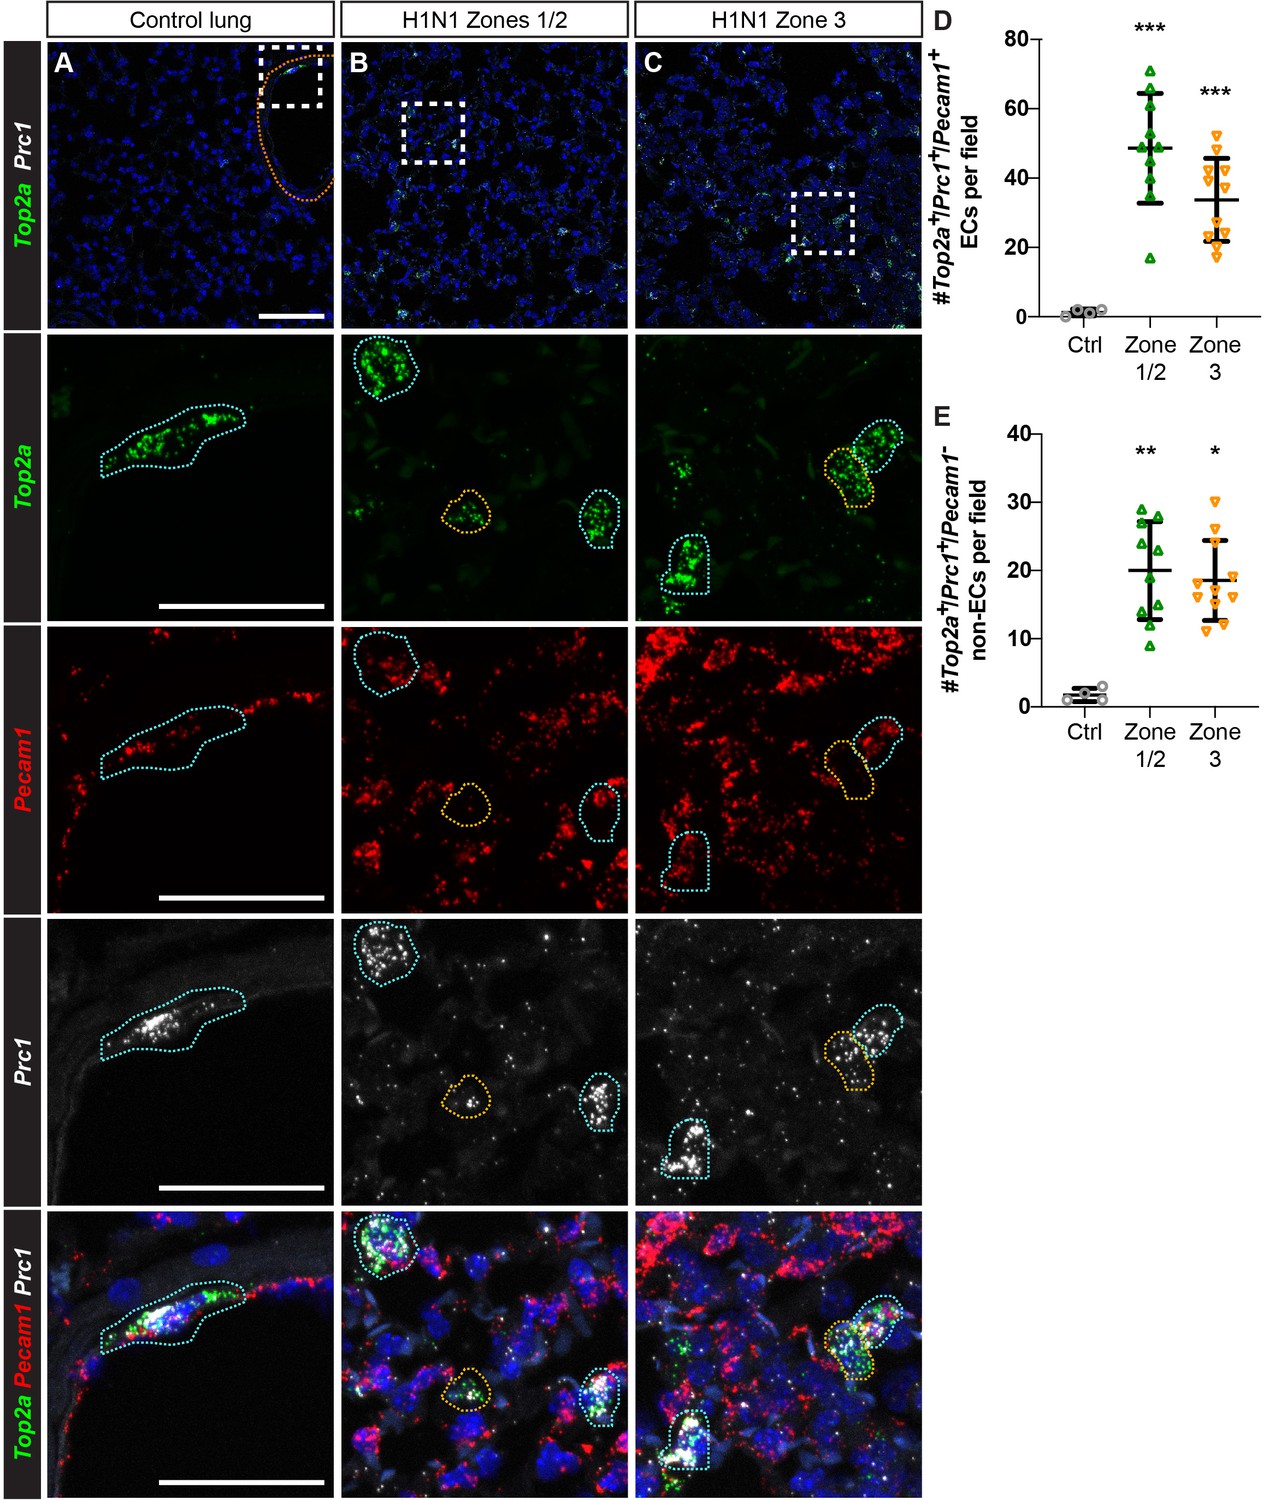
Proliferating ECs are located across regions of mild to severe injury after H1N1 influenza infection.
(A) Proliferating ECs (Top2a+/Pecam1+/Prc1+ triple-positive cells) are rare in the control lung. Orange dotted line indicates a large vessel. (B) 14 days post-H1N1 injury, proliferating Top2a+/Pecam1+/Prc1+ triple-positive cells (outlined in blue) are located in regions of mild to moderate tissue injury (zones 1/2). Proliferating Pecam1- non-ECs (outlined in yellow) can also be found in these regions. (C) Proliferating ECs and non-ECs are also found in regions of more severe tissue injury (zone 3) at 14 dpi. Scale bar in top row, 100 microns. Scale bars in other rows, 50 microns. (D) Quantification of Top2a+/Pecam1+/Prc1+ triple-positive cells per 20x field reveals a statistically significant increase in number of these cells in zones 1/2 and zone three compared to control. (E) Quantification of Top2a+/Prc1+ cells that are Pecam1- demonstrates a statistically significant increase in number of proliferating non-ECs in both zones 1/2 and zone three compared to control. Points represent individual fields quantified across H1N1-injured (N = 4) and control (N = 1) animals. *, p<0.05; **, p<0.01; ***, p<0.001; ns, not significant.
-
Figure 5—figure supplement 5—source data 1
Cell counts for total number of Top2a- and Prc1-expressing endothelial cells and non-endothelial cells, normalized to total number of nuclei.
- https://cdn.elifesciences.org/articles/53072/elife-53072-fig5-figsupp5-data1-v2.xlsx
Figure 5—figure supplement 6
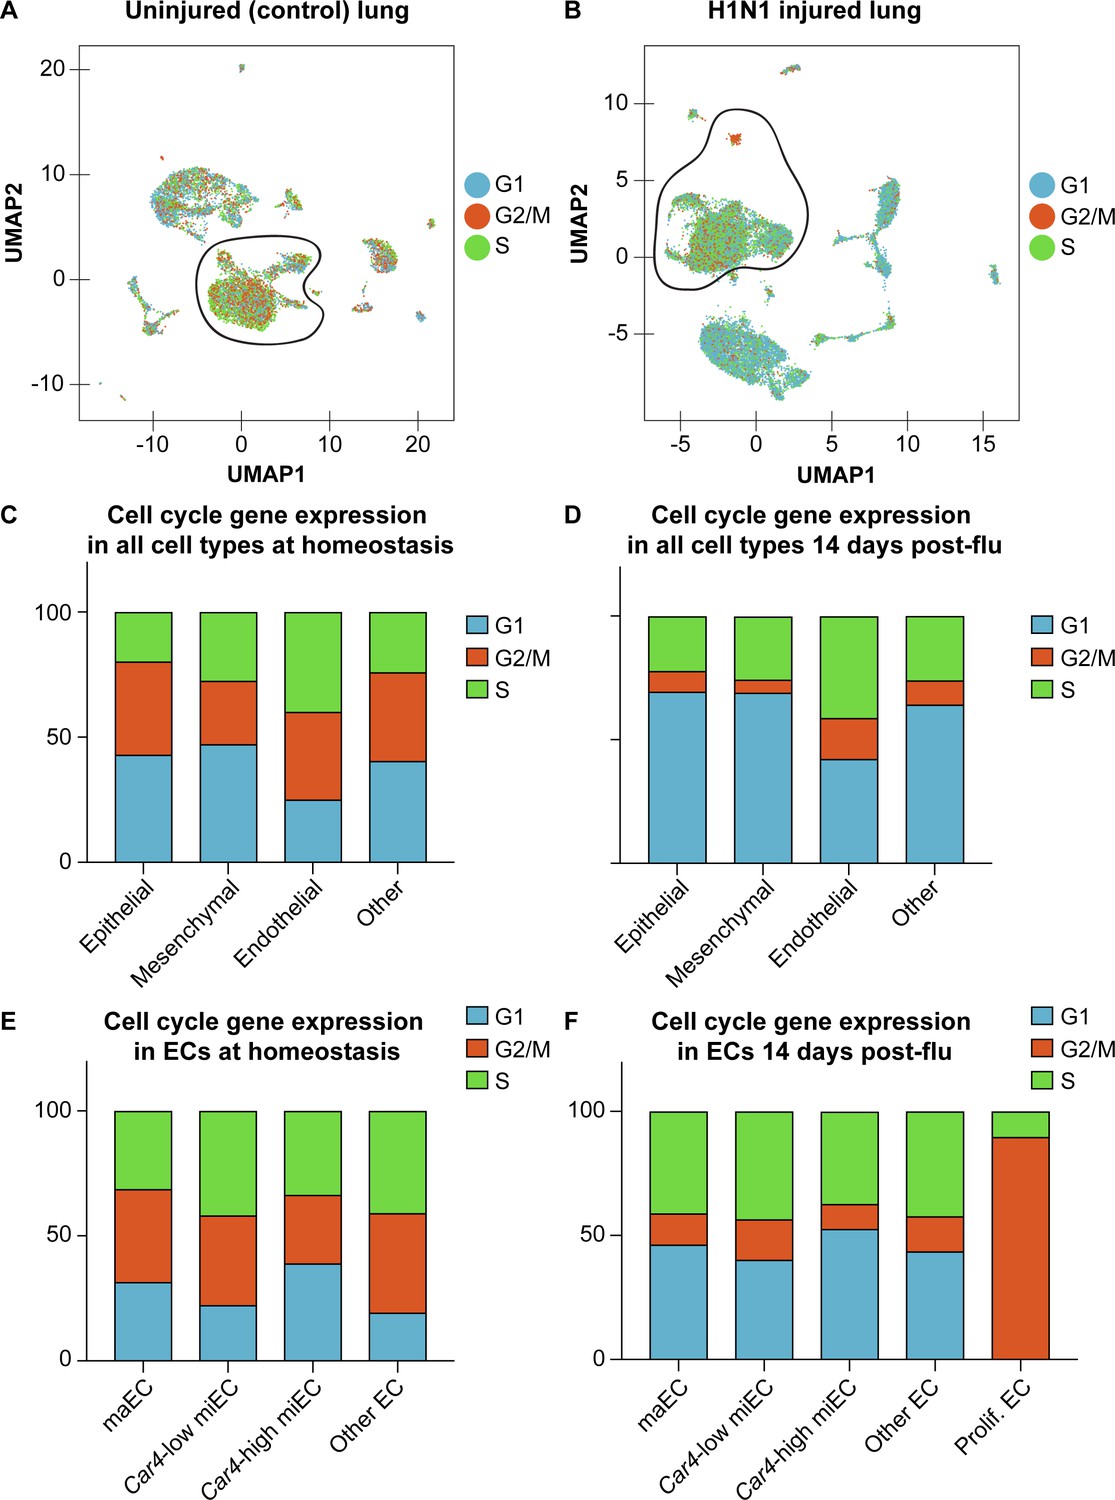
Expression of cell cycle genes in scRNA-seq transcriptomes predicts high levels of proliferation in pulmonary ECs after influenza injury.
Cell cycle scores in scRNA-seq of (A) control and (B) influenza-infected adult lung indicate that there is a high concentration of ECs expressing genes associated with S (green dots) and G2/M (orange dots) phases of the cell cycle at 14 days post influenza injury, with especially high expression of genes associated with G2/M in the small population of cells we have termed proliferating endothelium. Counts of epithelial, mesenchymal, endothelial, and other cells expressing genes associated with each phase of the cell cycle predicts that a higher percentage of ECs are in S and G2/M phases compared to other cell types, both (C) at homeostasis and (D) after influenza injury. (E) At homeostasis, miECs and other (lymphatic) ECs have the highest percentage of ECs predicted to be in S and G2/M phases based on their cell cycle gene expression profiles. (F) After influenza injury, proliferating ECs have the highest percentage of ECs predicted to be in S phase and G2/M phase.
-
Figure 5—figure supplement 6—source data 1
Percentage of cells predicted to be in G1, G2/M, or S phases based on their gene expression profiles.
- https://cdn.elifesciences.org/articles/53072/elife-53072-fig5-figsupp6-data1-v2.xlsx
Figure 6 with 2 supplements
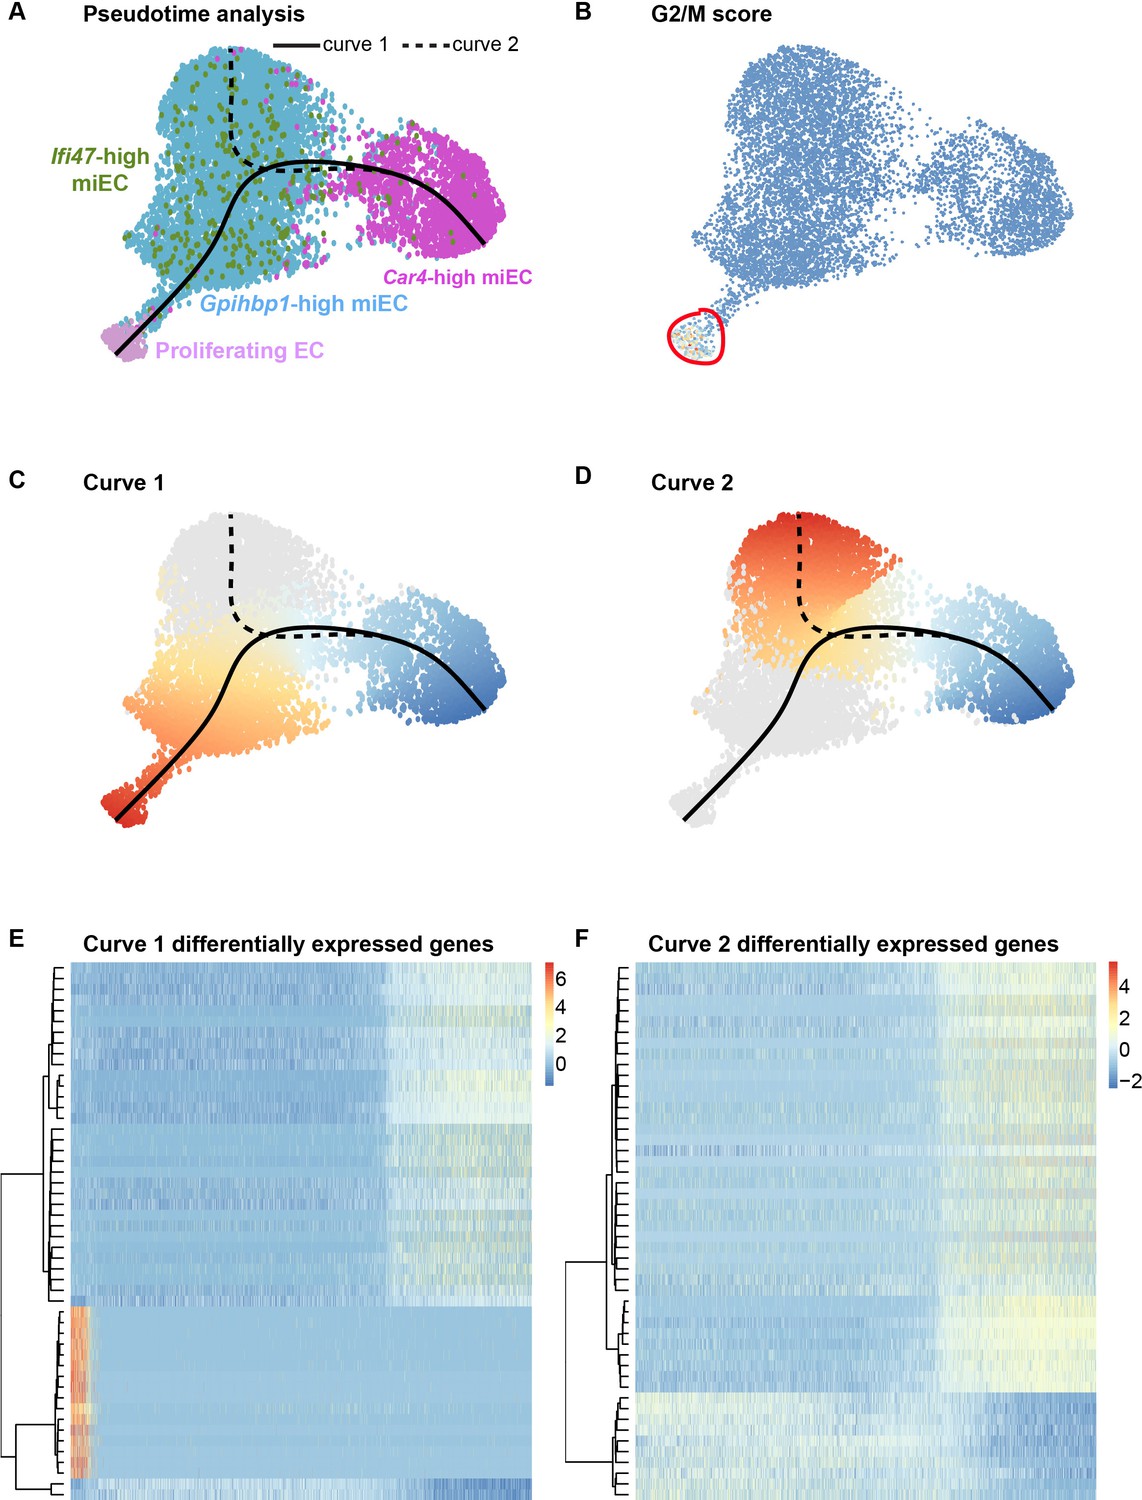
Proliferating ECs are more closely related to miECs than to Car4-high ECs.
(A) Pseudotime analysis of Car4-high EC, Gpihbp1-high miEC, Ifi47-high miEC, and proliferating EC clusters at 14 dpi using Slingshot identifies putative lineage relationships between the clusters based on gene expression similarities. Proliferating ECs are more similar in gene expression to both miEC populations than to Car4-high ECs. (B) Proliferating ECs have the highest G2/M score among all four populations, with orange/red indicating cells predicted to be in G2/M and blue indicating cells not predicted to be in G2/M. (C), (D) Slingshot identifies two lineage trajectories among the four EC populations. Curve one connects Car4-high ECs and proliferating ECs through a miEC intermediate, while curve two connects Car4-high ECs and miECs. Color indicates direction of the trajectory, which is defined by the program and proceeds from blue to red. (E), (F) Heatmaps displaying the top 50 differentially expressed genes along curves 1 and 2. Curve one demonstrates the greatest variance in gene expression along the trajectory, indicating greater gene expression differences between Car4-high ECs and proliferating ECs than between Car4-high ECs and miECs.
Figure 6—figure supplement 1
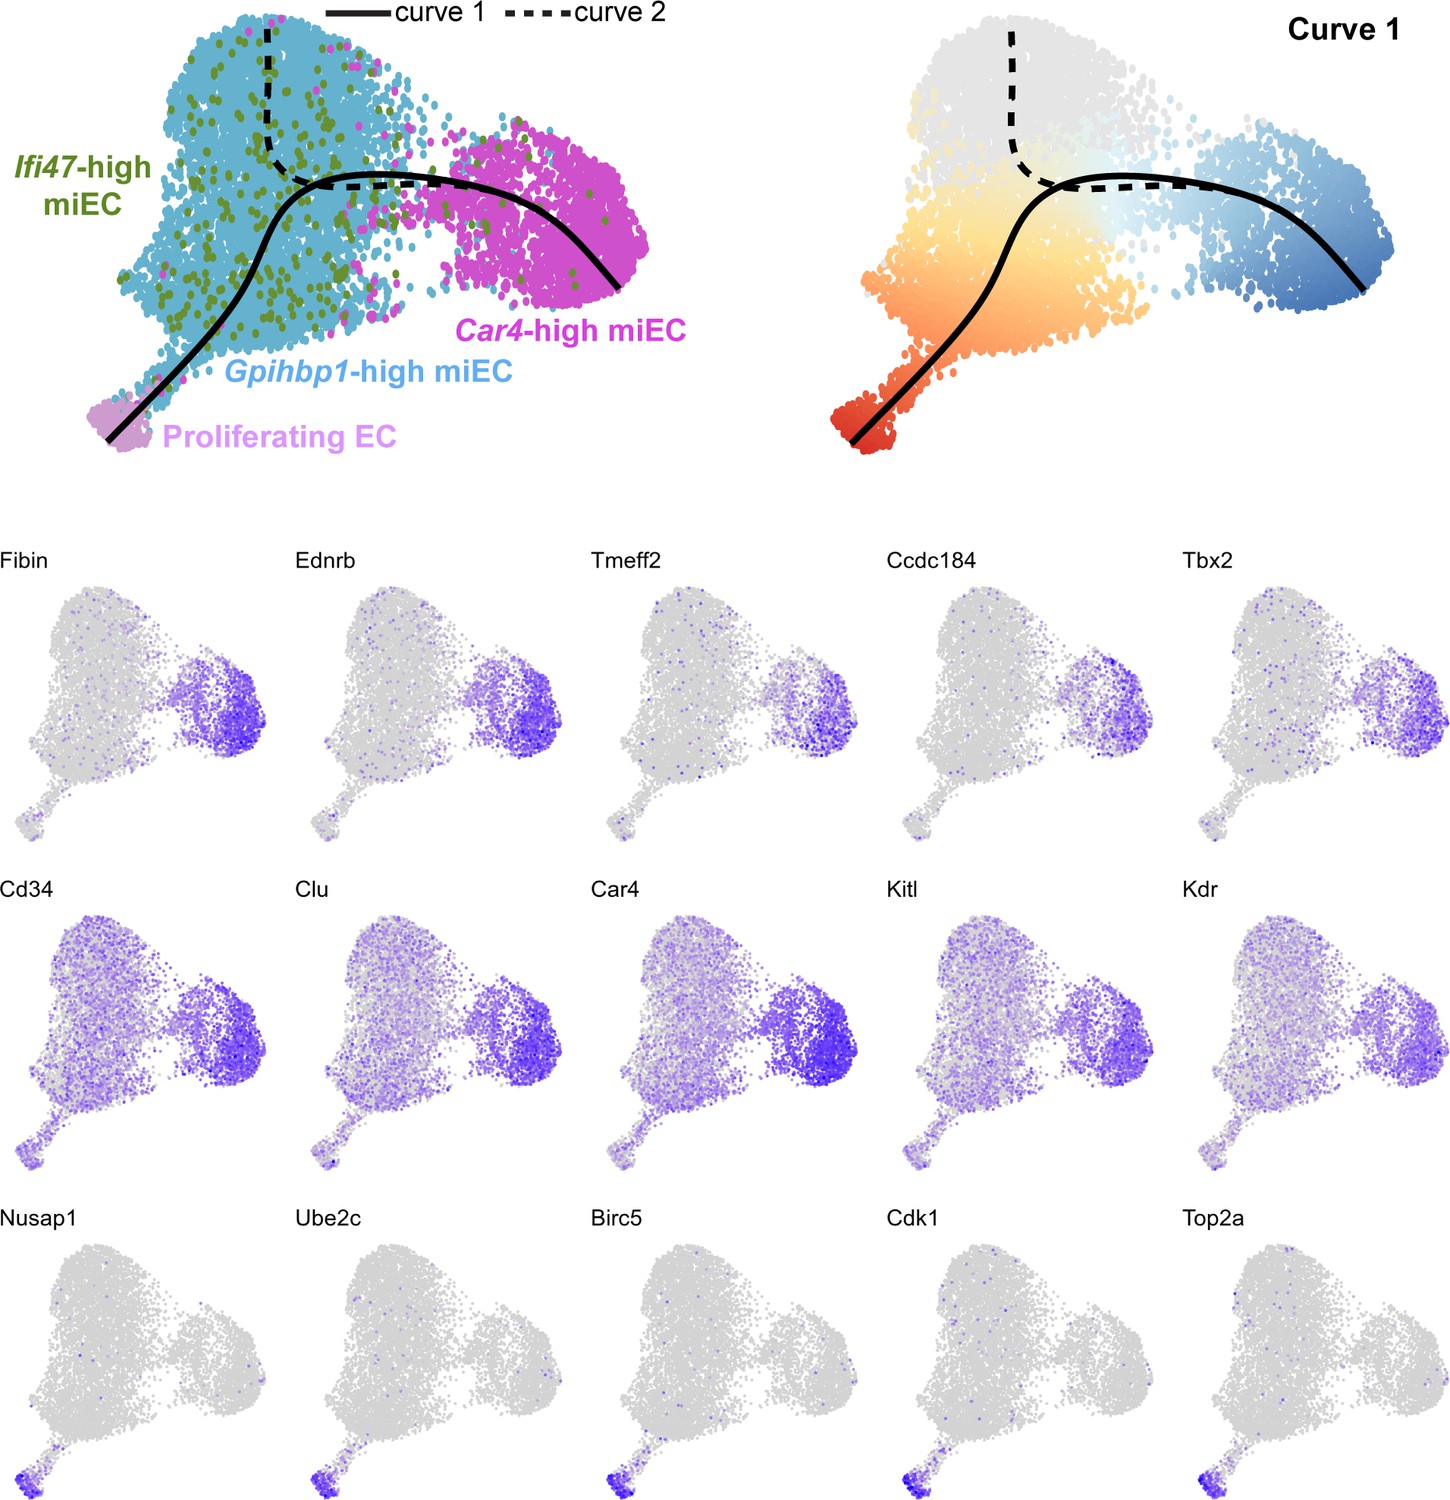
Feature plots demonstrate the expression level of each of the top 15 differentially expressed genes along curve 1 of the Slingshot pseudotime trajectory, superimposed on UMAP space to demonstrate cluster(s) in which each gene is expressed.
Figure 6—figure supplement 2
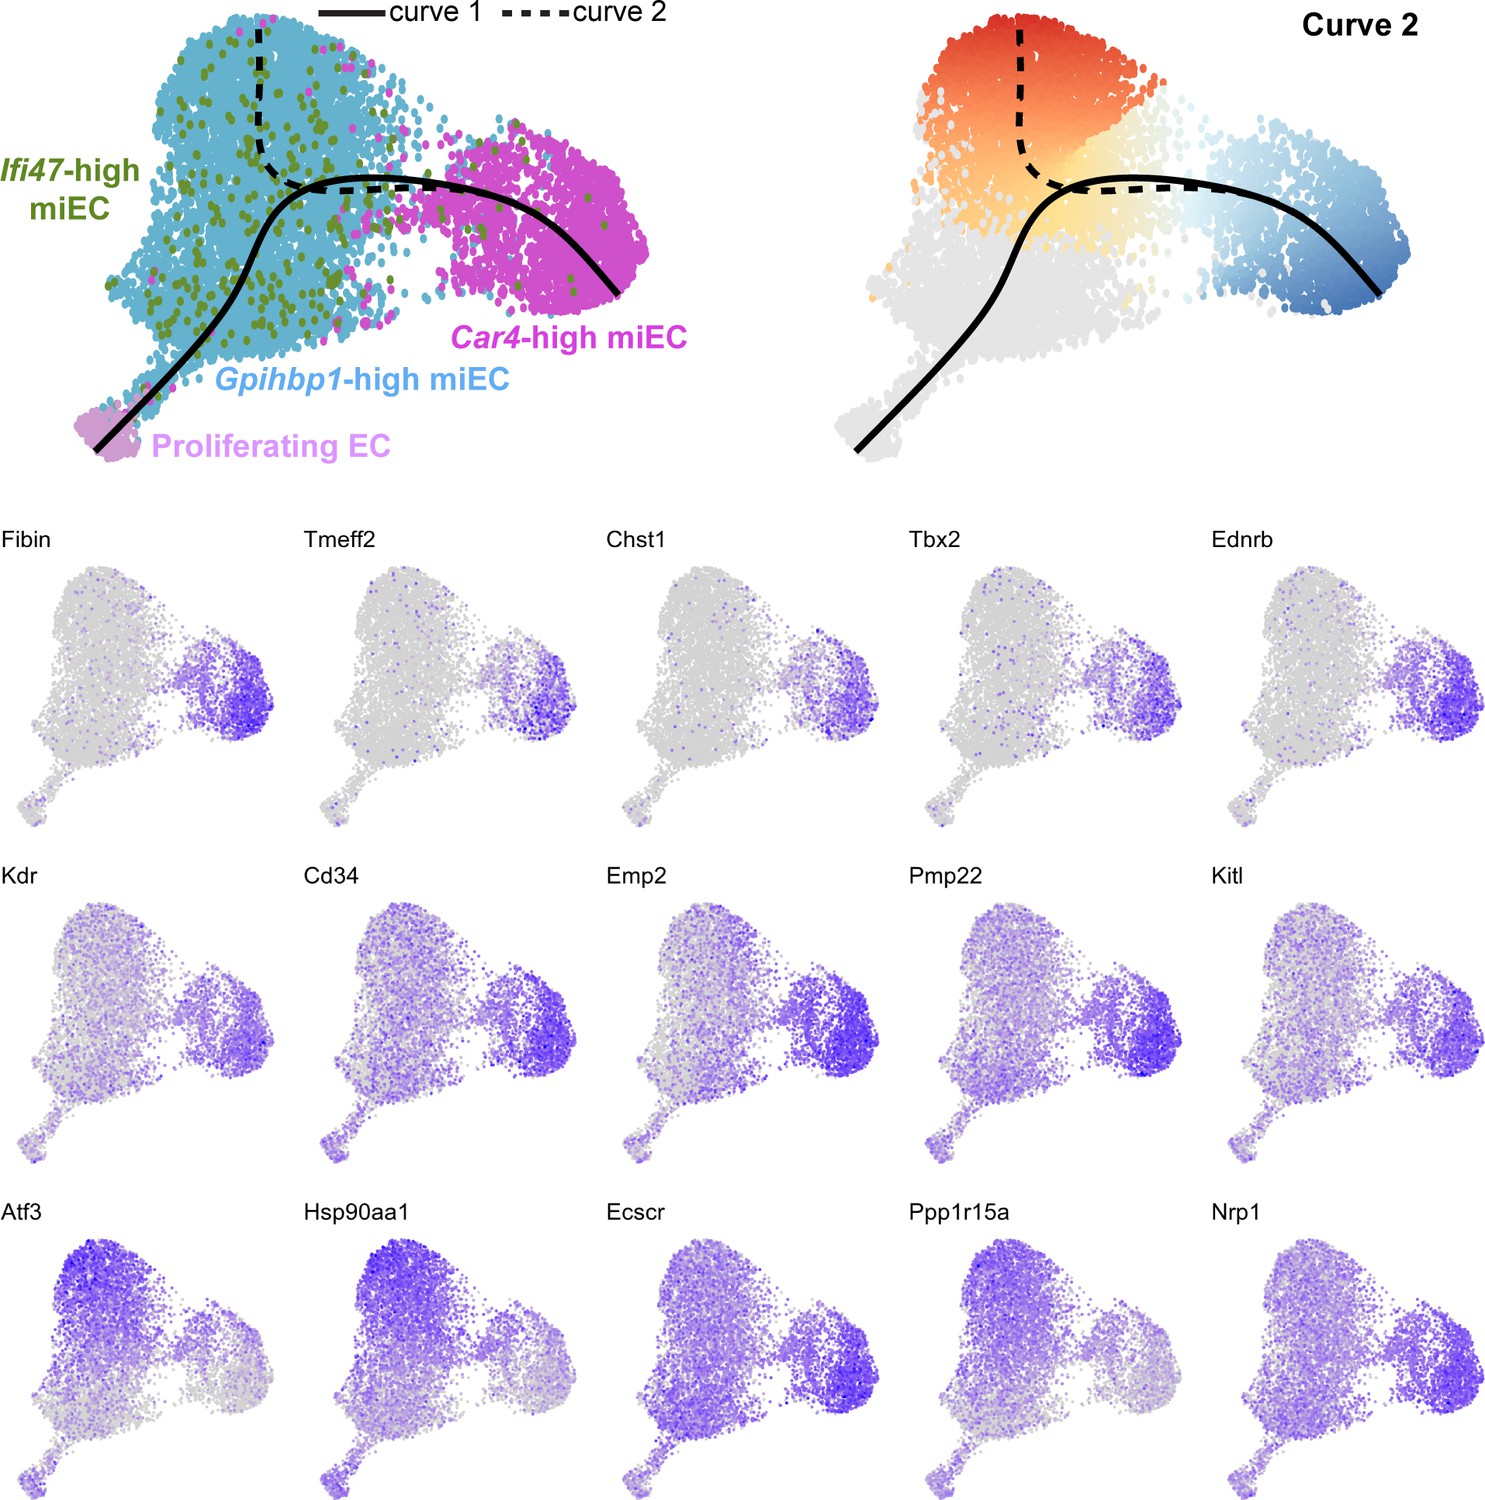
Feature plots demonstrate the expression level of each of the top 15 differentially expressed genes along curve 2 of the Slingshot pseudotime trajectory, superimposed on UMAP space to demonstrate cluster(s) in which each gene is expressed.
Figure 7

Car4-high ECs participate in epithelial-endothelial signaling both at homeostasis and after influenza injury.
(A) Ligand-receptor analysis of scRNA-seq data identifies putative AT1- and AT2-EC signaling axes in the adult mouse lung at homeostasis. Car4-high ECs and miECs are predicted to receive signals from both AT1 and AT2 cells, with the strongest possible interactions identified between AT1 cells and ECs. (B) Ligand-receptor analysis at 14 dpi demonstrates increased potential for interactions between ECs and AT1/AT2 cells, with the strongest putative signaling interactions between AT1 cells and Ifi47-high miECs as well as between AT1 cells and proliferating ECs. (C) Similarly, network analysis of putative signaling interactions between epithelial and EC populations reveals the strongest possible interactions between AT1 cells and both miECs and Car4-high ECs at homeostasis. (D) After H1N1 influenza injury, both AT1 and AT2 cells are predicted to signal robustly to all EC cell types, with the emergent population of proliferating ECs forming a central node in the signaling network.
Tables
Table 1
Top 20 differentially expressed genes in Car4-high ECs compared to other ECs in scRNA-seq of FACS-isolated lung endothelium.
| Gene name | Average log fold change | Fraction of Cd34-high, Car4-high cells expressing this gene | Fraction of other ECs expressing this gene |
|---|---|---|---|
| Igfbp7 | 2.678286614 | 0.979 | 0.327 |
| Fibin | 2.574379173 | 0.776 | 0.058 |
| Car4 | 2.424088834 | 0.975 | 0.312 |
| Emp2 | 2.052891168 | 0.861 | 0.149 |
| Ednrb | 1.978598654 | 0.609 | 0.035 |
| AW112010 | 1.934007585 | 0.608 | 0.051 |
| Pmp22 | 1.684929983 | 0.889 | 0.299 |
| Ptp4a3 | 1.634843929 | 0.730 | 0.135 |
| Ccdc184 | 1.500061919 | 0.350 | 0.017 |
| Clu | 1.497660515 | 0.784 | 0.238 |
| Ccdc68 | 1.392943656 | 0.412 | 0.040 |
| Chst1 | 1.391322461 | 0.365 | 0.016 |
| Tmeff2 | 1.389485167 | 0.402 | 0.021 |
| Cd34 | 1.363682377 | 0.737 | 0.197 |
| Enho | 1.359701549 | 0.412 | 0.028 |
| Tbx2 | 1.300007606 | 0.376 | 0.027 |
| Rprml | 1.282823428 | 0.360 | 0.014 |
| Sept4 | 1.281675924 | 0.782 | 0.269 |
| Kdr | 1.233274427 | 0.571 | 0.123 |
| Apln | 1.225917934 | 0.360 | 0.022 |
Table 2
Top 20 differentially expressed genes in proliferating ECs compared to other cell populations in scRNA-seq of whole mouse lung after influenza infection.
| Gene name | Average log fold change | Fraction of proliferating ECs expressing this gene | Fraction of all cells expressing this gene |
|---|---|---|---|
| Ube2c | 2.317853367 | 0.839 | 0.011 |
| Top2a | 2.253705903 | 0.878 | 0.011 |
| Prc1 | 2.162682748 | 0.863 | 0.012 |
| Rrm2 | 2.137769719 | 0.671 | 0.016 |
| Cenpf | 2.120348153 | 0.863 | 0.015 |
| Cks2 | 2.119347813 | 0.886 | 0.064 |
| Pbk | 2.101722647 | 0.788 | 0.008 |
| Cdc20 | 2.055640843 | 0.769 | 0.017 |
| Nusap1 | 2.04083334 | 0.898 | 0.008 |
| Birc5 | 1.983612047 | 0.847 | 0.009 |
| Cdk1 | 1.951263566 | 0.808 | 0.014 |
| Smc4 | 1.830329324 | 0.878 | 0.124 |
| Spc25 | 1.79466608 | 0.769 | 0.012 |
| Cenpa | 1.78639737 | 0.753 | 0.027 |
| Smc2 | 1.74071554 | 0.808 | 0.051 |
| Ccnb2 | 1.7002509 | 0.745 | 0.013 |
| Lockd | 1.699667491 | 0.784 | 0.024 |
| Lmnb1 | 1.640231709 | 0.792 | 0.04 |
| Fam64a | 1.620370016 | 0.741 | 0.005 |
| Racgap1 | 1.579862823 | 0.725 | 0.009 |
Table 3
Top 20 differentially expressed genes in Car4-high ECs compared to other cell populations in scRNA-seq of whole mouse lung following influenza infection.
| Gene name | Average log fold change | Fraction of Car4-high ECs expressing this gene | Fraction of all cells expressing this gene |
|---|---|---|---|
| Car4 | 2.647460241 | 0.981 | 0.281 |
| Fibin | 2.226759092 | 0.83 | 0.133 |
| Ednrb | 2.153211962 | 0.834 | 0.057 |
| AW112010 | 2.041819815 | 0.934 | 0.259 |
| Cyp4b1 | 1.822454969 | 0.986 | 0.515 |
| Emp2 | 1.774097564 | 0.957 | 0.439 |
| Ptp4a3 | 1.704881479 | 0.83 | 0.161 |
| Kitl | 1.522369803 | 0.87 | 0.258 |
| Ly6c1 | 1.517128641 | 0.993 | 0.546 |
| Kdr | 1.514651153 | 0.835 | 0.194 |
| Cd34 | 1.465370921 | 0.92 | 0.372 |
| Apln | 1.450197164 | 0.567 | 0.032 |
| Icam2 | 1.438572854 | 0.981 | 0.478 |
| Tspan13 | 1.437697131 | 0.993 | 0.585 |
| Ly6a | 1.420070001 | 0.997 | 0.647 |
| Clu | 1.398326741 | 0.905 | 0.343 |
| Ecscr | 1.346567228 | 0.953 | 0.446 |
| Nrp1 | 1.310196884 | 0.974 | 0.639 |
| Chst1 | 1.303951311 | 0.517 | 0.028 |
| Ccdc184 | 1.272517358 | 0.44 | 0.021 |
Table 4
Top 12 predicted ligand-receptor pairs for AT1-Car4-high EC signaling at homeostasis and after H1N1 influenza injury.
| Receptor | Ligand | Evidence | Receptor cluster | Ligand cluster |
|---|---|---|---|---|
| Itgb5 | Adam9 | literature supported | Car4-high EC | AT1 |
| Flt1 | Vegfa | literature supported | Car4-high EC | AT1 |
| Kdr | Vegfa | literature supported | Car4-high EC | AT1 |
| Itgb1 | Col4a1 | literature supported | Car4-high EC | AT1 |
| Itgb1 | Npnt | literature supported | Car4-high EC | AT1 |
| Itgb1 | Lamc2 | literature supported | Car4-high EC | AT1 |
| Itgb1 | Adam9 | literature supported | Car4-high EC | AT1 |
| Nrp1 | Sema3b | literature supported | Car4-high EC | AT1 |
| Nrp1 | Vegfa | literature supported | Car4-high EC | AT1 |
| Nrp1 | Sema3a | literature supported | Car4-high EC | AT1 |
| Bmpr2 | Bmp4 | literature supported | Car4-high EC | AT1 |
| Fgfr3 | Fgf1 | literature supported | Car4-high EC | AT1 |
Table 5
Primer sequences.
| Gene | Primer type | Forward sequence (5’ to 3’) | Reverse sequence (5’ to 3’) |
|---|---|---|---|
| Cd34 | qRT-PCR | TGGGTAGCTCTCTGCCTGAT | TGGTAGGAACTGATGGGGAT |
| Car4 | qRT-PCR | CAGCTCCTTCTTGCTCTGCT | CCCCAAGCAACTGCTTCTA |
| Ednrb | qRT-PCR | CCCTAAGGGTCTGCATGCTT | GGCCACTTCTCGTCTCTGC |
| Kdr | qRT-PCR | TGTGCGACCCCAAATTCCAT | ACTGGGCATCATTCCACCAA |
| Cd31 | qRT-PCR | CTGGTGCTCTATGCAAGCCT | AGTTGCTGCCCATTCATCAC |
| Gpihbp1 | qRT-PCR | CACAGCGGAACCGACAAAG | ACTGGCAACAGGTCTGAGTC |
| Plvap | qRT-PCR | CGTCAAGGCCAAGTCGCT | AGGGTTGACTACAGGGAGCC |
| Vwf | qRT-PCR | GTGTAAACGGGCATCTCCTC | CCGTCTTCAGTAGCTGGCAT |
| Gapdh | qRT-PCR | CGTCCCGTAGACAAAATGGT | TTGATGGCAACAATCTCCAC |
Key resources table
Reagent type (species) or resource | Designation | Source or reference | Identifiers | Additional information |
|---|---|---|---|---|
| Strain, strain background (Mus musculus, male, female) | C57BL/6J | Jackson Laboratory | Stock #000664 | |
| Antibody | anti-CD31(rat monoclonal) | HistoBioTec | DIA-310; RRID:AB_2631039 | IHC (1:200) |
| Antibody | anti-CD31 (rabbit monoclonal) | Thermo Fisher | MA5-16337; RRID:AB_2537856 | IHC (1:50) |
| Antibody | anti-Vwf (rabbit polyclonal) | Dako | A0082; RRID:AB_2315602 | IHC (1:500) |
| Antibody | anti-Vcam1 (CD106) (rat monoclonal) | eBioscience | 14–1061; RRID:AB_467419 | IHC (1:100) |
| Antibody | anti-Gpihbp1 (rabbit polyclonal) | Thermo Fisher | PA1-16976; RRID:AB_2294825 | IHC (1:100) |
| Antibody | anti-Plvap (rat monoclonal) | Bio-Rad | MCA2539T; RRID:AB_1102821 | IHC (1:50) |
| Antibody | anti-CD34 (rat monoclonal) | PharMingen | 553731; RRID:AB_395015 | IHC (1:25) |
| Antibody | anti-Car4 (rat monoclonal) | R and D Systems | MAB2414; RRID:AB_10718416 | IHC (1:100) |
| Antibody | anti-Sftpc (goat polyclonal) | Santa Cruz Biotechnology | sc-7706; RRID:AB_2185507 | IHC (1:50) |
| Antibody | anti-Hopx (mouse monoclonal) | Santa Cruz Biotechnology | sc-398703; RRID:AB_2687966 | IHC (1:100) |
| Antibody | anti-Ki67 (rabbit monoclonal) | Abcam | ab16667; RRID:AB_302459 | IHC (1:50) |
| Antibody | anti-phospho-histone H3 (mouse monoclonal) | Cell Signaling Technology | 9706; RRID:AB_331748 | IHC (1:200) |
| Antibody | CD45-PE-Cy7 (rat monoclonal) | Thermo Fisher | 25-0451-82; RRID:AB_2734986 | Flow cytometry (1:200) |
| Antibody | CD45-APC (rat monoclonal) | Thermo Fisher | 17-0451-83; RRID:AB_469393 | Flow cytometry (1:200) |
| Antibody | CD45-PerCP-Cy5.5 (rat monoclonal) | Thermo Fisher | 45-0451-82; RRID:AB_1107002 | Flow cytometry (1:200) |
| Antibody | CD31-PE (rat monoclonal) | Thermo Fisher | 12-0311-83; RRID:AB_465633 | Flow cytometry (1:200) |
| Antibody | CD31-PE-Cy7 (rat monoclonal) | Thermo Fisher | 25-0311-82; RRID:AB_2716949 | Flow cytometry (1:200) |
| Antibody | CD31-APC (rat monoclonal) | Thermo Fisher | 17-0311-82; RRID:AB_657735 | Flow cytometry (1:200) |
| Antibody | CD34-eF450 (rat monoclonal) | Thermo Fisher | 48-0341-80; RRID:AB_2043838 | Flow cytometry (1:50) |
| Chemical compound, drug | PR8-GP33 H1N1 influenza virus | PMID:23516357 | Dr. E. John Wherry | |
| Chemical compound, drug | Pharmaceutical-grade bleomycin | Hospira | Prescription only | 15U/vial |
| Commercial assay or kit | Click-iT Plus EdU Cell Proliferation Kit | Thermo Fisher | C10632 | |
| Other | RNAscope probe mm-Vegfc | Advanced Cell Diagnostics | 492701 | |
| Other | RNAscope probe mm-Cxcl12 | Advanced Cell Diagnostics | 422711 | |
| Other | RNAscope probe mm-Car4-C3 | Advanced Cell Diagnostics | 468421-C3 | |
| Other | RNAscope probe mm-Prc1-C3 | Advanced Cell Diagnostics | 577121-C3 | |
| Other | RNAscope probe mm-Top2a | Advanced Cell Diagnostics | 491221 | |
| Other | RNAscope probe mm-Gpihbp1-C3 | Advanced Cell Diagnostics | 540631-C3 | |
| Other | RNAscope probe mm-Plvap | Advanced Cell Diagnostics | 440221 | |
| Other | RNAscope probe mm-Pecam1-C2 | Advanced Cell Diagnostics | 316721-C2 | |
| Other | RNAscope probe mm-Sftpc | Advanced Cell Diagnostics | 314101 | |
| Other | RNAscope probe mm-Hopx | Advanced Cell Diagnostics | 405161 |
Additional files
Download links
A two-part list of links to download the article, or parts of the article, in various formats.
Downloads (link to download the article as PDF)
Open citations (links to open the citations from this article in various online reference manager services)
Cite this article (links to download the citations from this article in formats compatible with various reference manager tools)
Defining the role of pulmonary endothelial cell heterogeneity in the response to acute lung injury
eLife 9:e53072.
https://doi.org/10.7554/eLife.53072


