Uncovering the functional anatomy of the human insula during speech
- McGovern Medical School at UT Health Houston, United States
- University of Texas Health Science Center at Houston, United States
- Texas Medical Center, United States
Figures
Figure 1
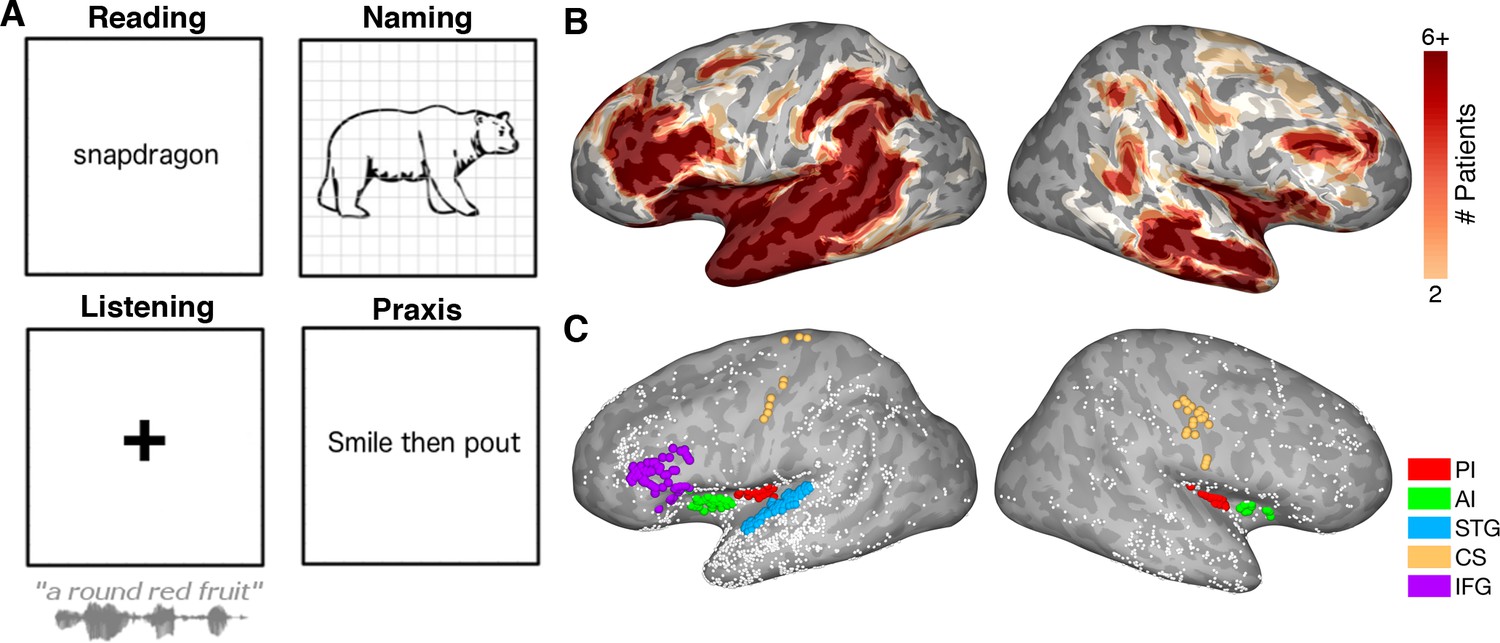
Experimental design.
(A) Schematic representation of the four tasks. (B) Representative spatial coverage map on a standard N27 inflated surface illustrating how many patients had electrodes in each brain region. (C) Individual electrodes shown on the same brain surface. Colored electrodes represent those included in each ROI for the grouped electrode analyses. PI: Posterior Insula, AI: Anterior Insula, STG: Superior Temporal Gyrus, CS: Central Sulcus, IFG: Inferior Frontal Gyrus.
Figure 2 with 3 supplements
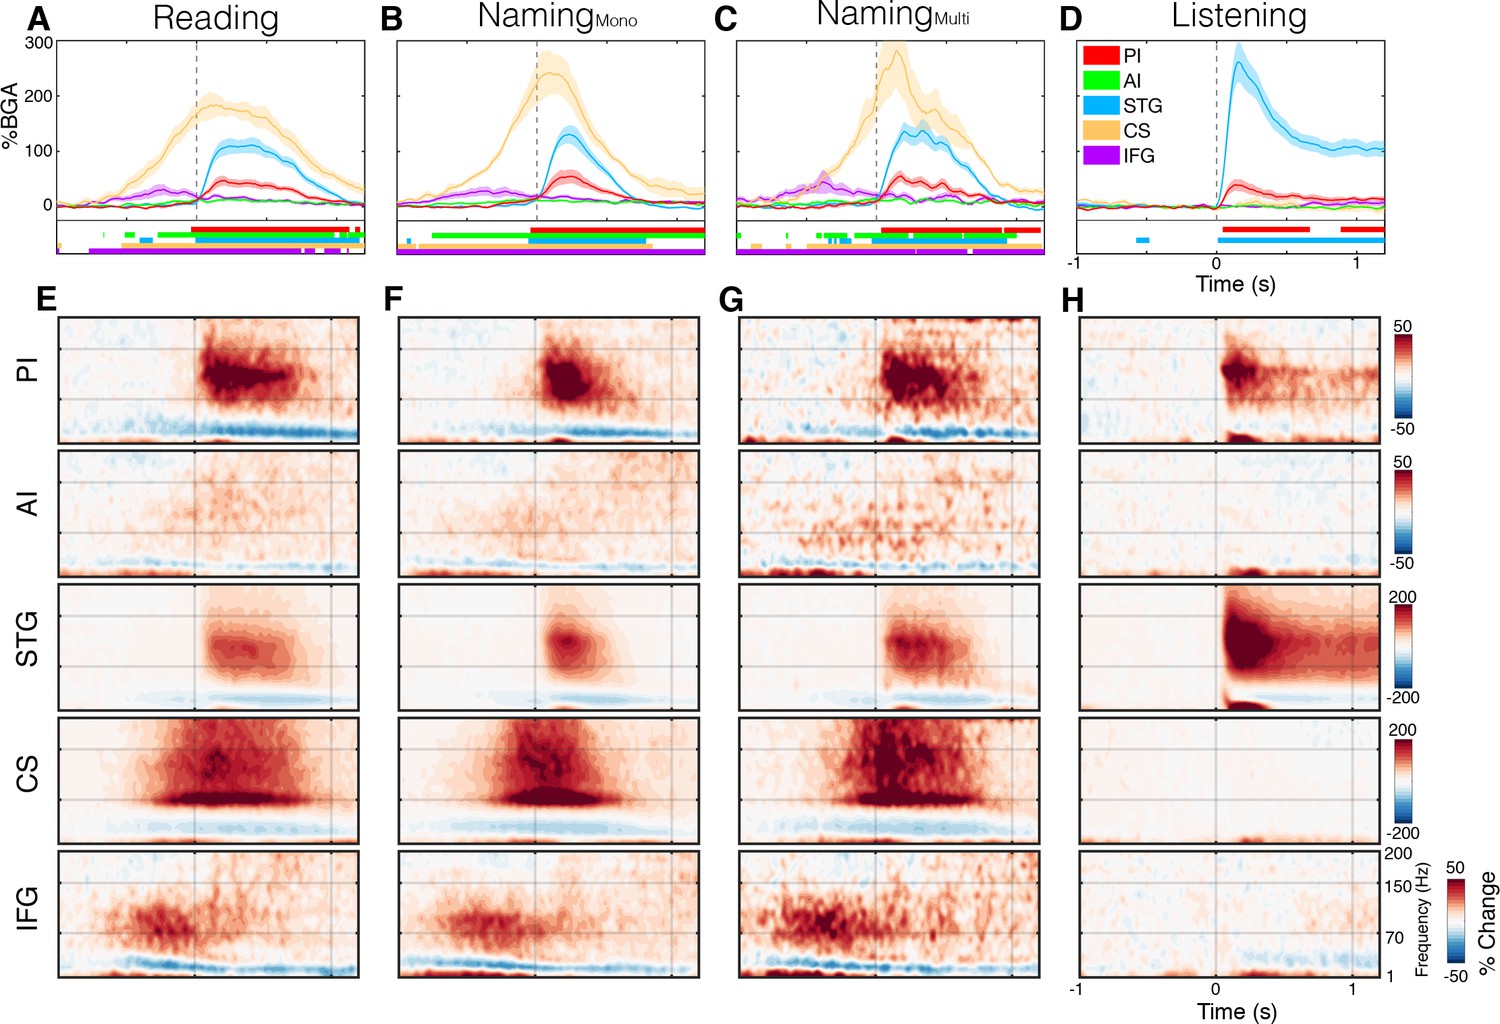
Spectrotemporal representations of activity in the ROIs.
Broadband gamma activity (A–D) and spectrogram (E–H) plots of activity within each ROI, averaged across subjects during the complex reading (A,E; n = 27), monosyllabic naming (B,F; n = 23), multisyllabic naming (C,G; n = 23) and listening (D,H; n = 21) tasks. Colored bars under the BGA plots represent regions of significant activation (q < 0.05). Responses are time locked to speech onset in the reading and naming tasks and to the stimulus onset in listening.
-
Figure 2—source data 1
Source data for Figure 2A–D.
- https://cdn.elifesciences.org/articles/53086/elife-53086-fig2-data1-v2.mat
Figure 2—figure supplement 1
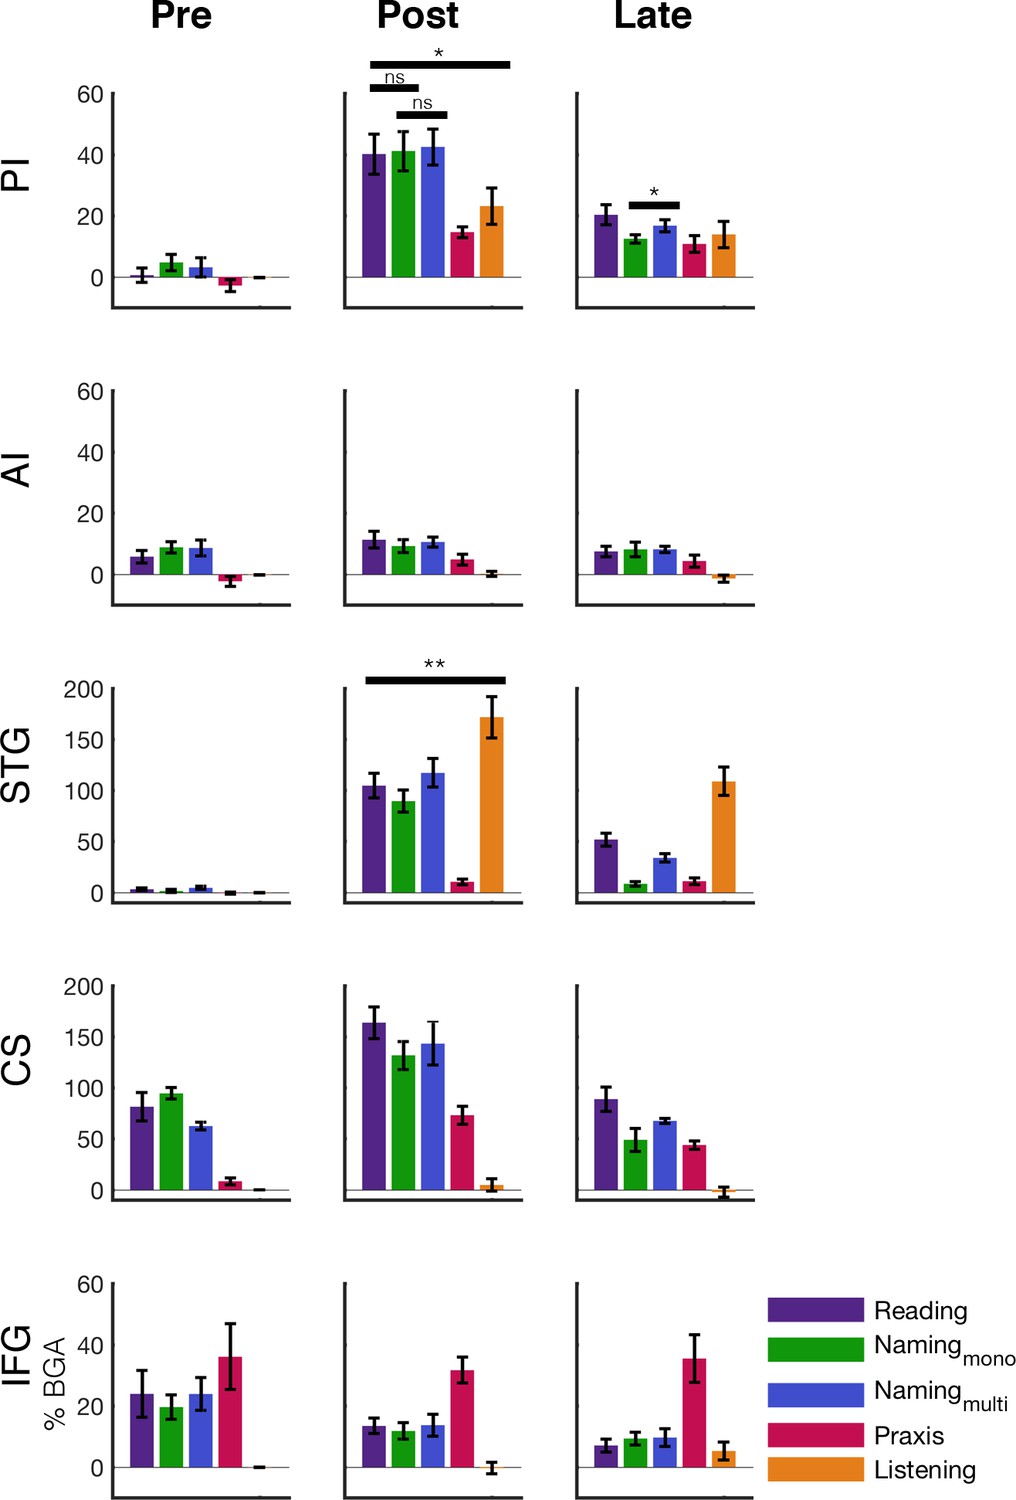
Time windowed analysis of activity in the ROIs.
Broadband gamma activity bar plots of activity within each ROI, averaged across pre-articulatory (−500 to −100 ms), post-articulatory (200 to 600 ms) and late post-articulatory (600 to 1000 ms) windows for each task. Error bars represent standard error margin. Significance bars show contrasts discussed in main text; ns p>0.05, *p<0.05, **p<0.01. Responses are time locked to speech onset in the reading and naming tasks and to the stimulus onset in listening. PI: Posterior Insula, AI: Anterior Insula, STG: Superior Temporal Gyrus, CS: Central Sulcus, IFG: Inferior Frontal Gyrus.
Figure 2—figure supplement 2
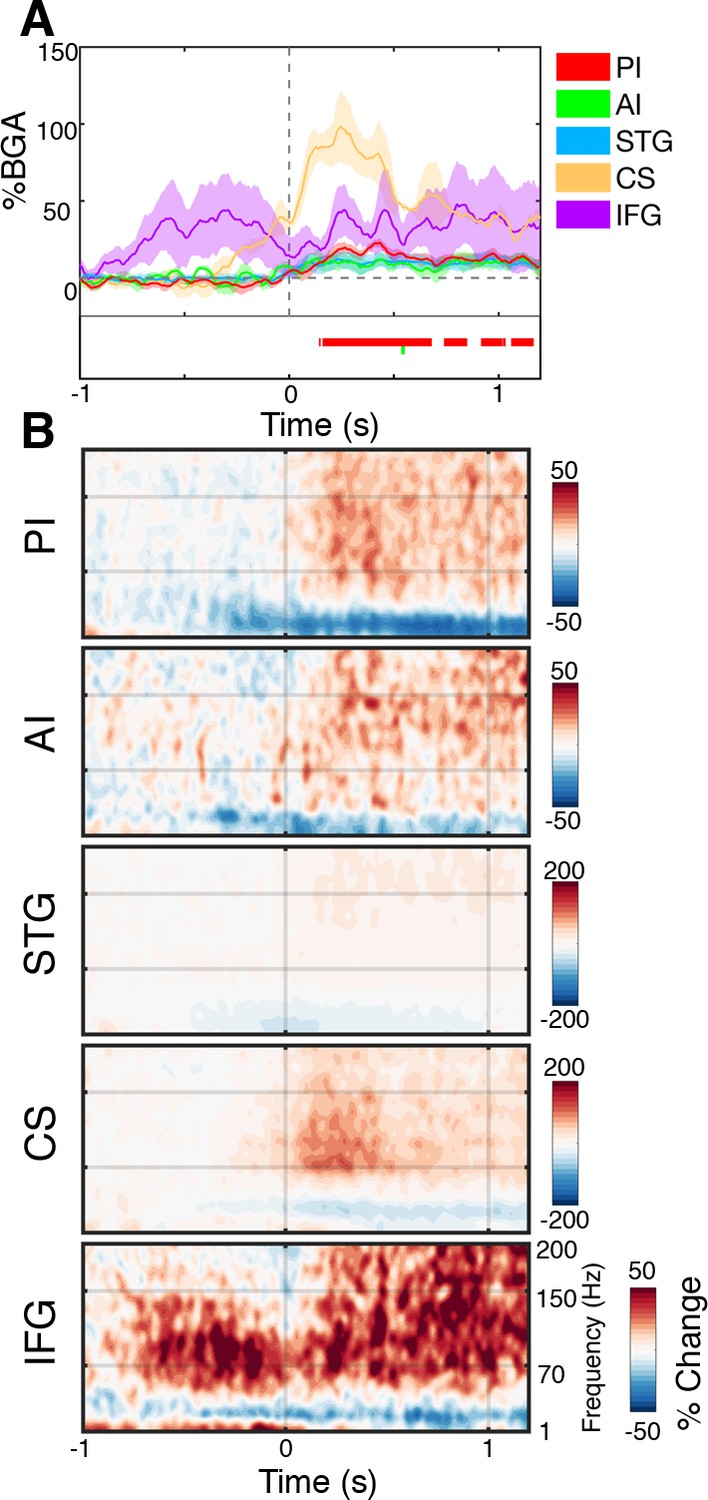
Spectrotemporal representations of activity in the praxis task.
Broadband gamma activity (A) and spectrogram (B) plots of activity within each ROI, averaged across subjects during the praxis task. Colored bars under the BGA plot represent regions of significant activation (q < 0.05). Responses are time locked to movement onset. PI: Posterior Insula (n = 24 (7); # electrodes (# patients)); AI: Anterior Insula (n = 10 (5)); STG: Superior Temporal Gyrus (n = 48 (6)); CS: Central Sulcus (n = 9 (2)); IFG: Inferior Frontal Gyrus (n = 7 (4)).
Figure 2—figure supplement 3

Evoked oscillations during speech articulation.
The broadband gamma measures used through the paper are measures of invoked oscillations. To further evaluate the role of insular cortex, we calculated event related potentials (ERPs) using electrodes in this region, relative to speech production. ERPs were calculated for each ROI for the three speech conditions: complex word reading (A), monosyllabic naming (B) and multisyllabic naming (C). STG and IFG both showed periods of significant evoked activity (q < 0.05), however, neither insular ROI displayed any periods of significant evoked activity.
Figure 3
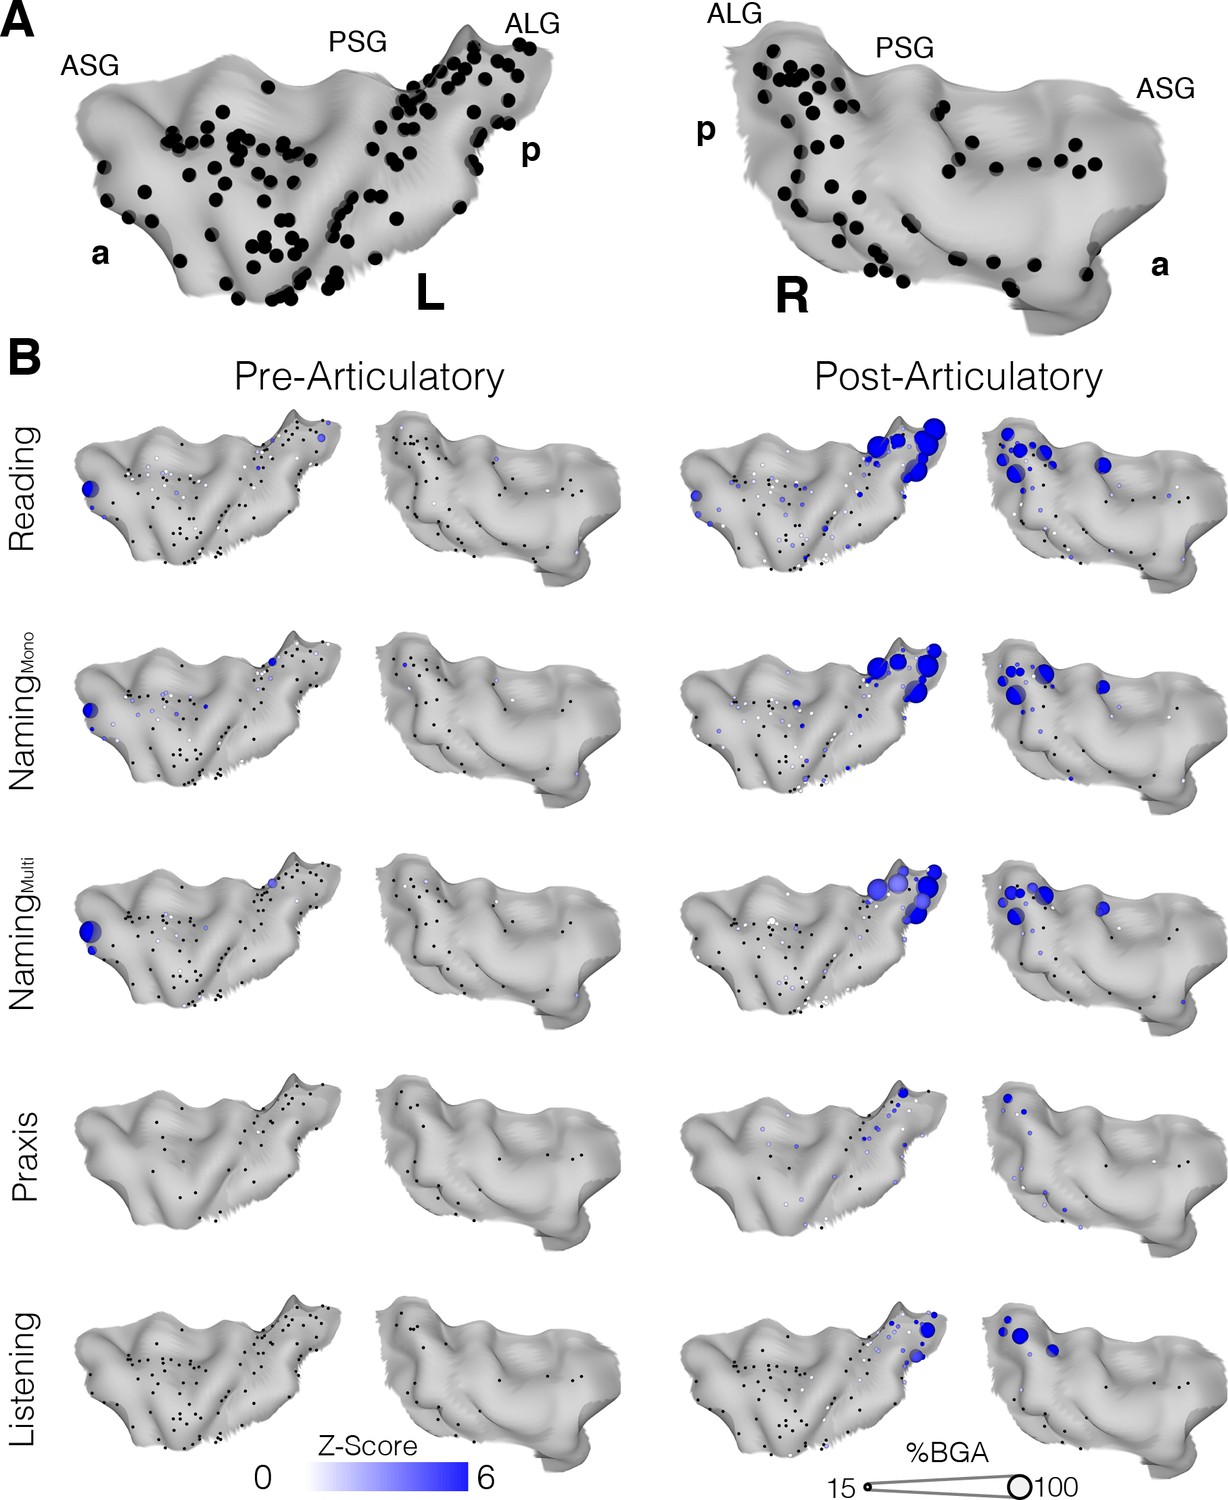
Topographic maps of a standardized insula.
(A) Insula coverage map showing all insula electrodes from patients who did the reading task on a standard N27 pial surface insula. (B) Activity maps showing activation above baseline for each task in either the pre (−500 to −100 ms) or post (200 to 600 ms) articulatory time window. ASG: Anterior Short Gyrus, PSG: Posterior Short Gyrus, ALG: Anterior Long Gyrus. Electrodes with a non-significant activation (q > 0.05) shown in black.
-
Figure 3—source data 1
Source data for Figure 3B.
- https://cdn.elifesciences.org/articles/53086/elife-53086-fig3-data1-v2.mat
Figure 4
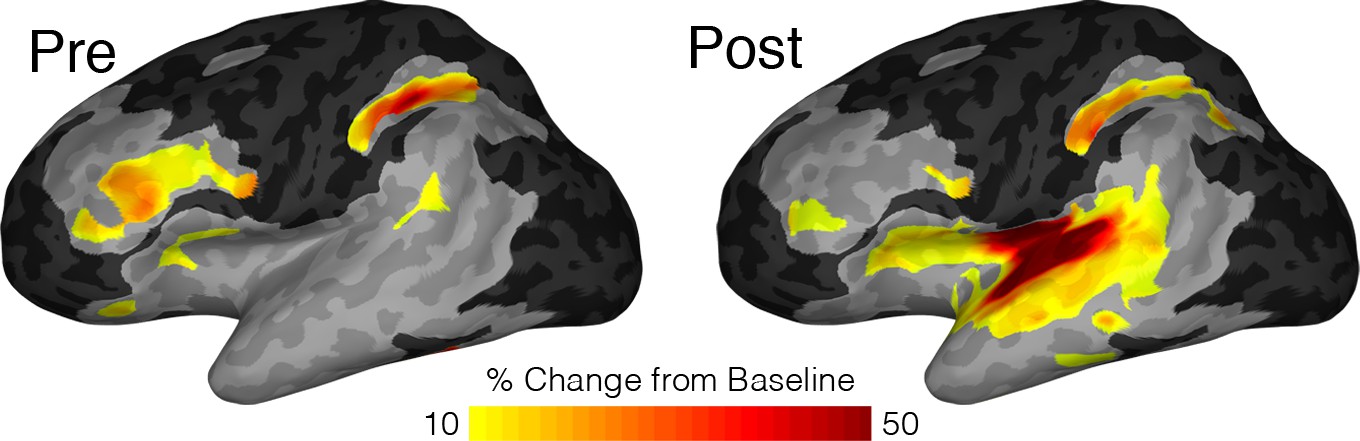
MEMA map showing left hemispheric activity in the pre (−500 to −100 ms) and post (200 to 600 ms) articulatory periods during the reading task.
Regions are shown for clusters with significant activity (p<0.01, corrected), absolute BGA change of >10% and coverage of at least three patients. Regions excluded for lack of patient coverage are shown in black.
Figure 5 with 1 supplement
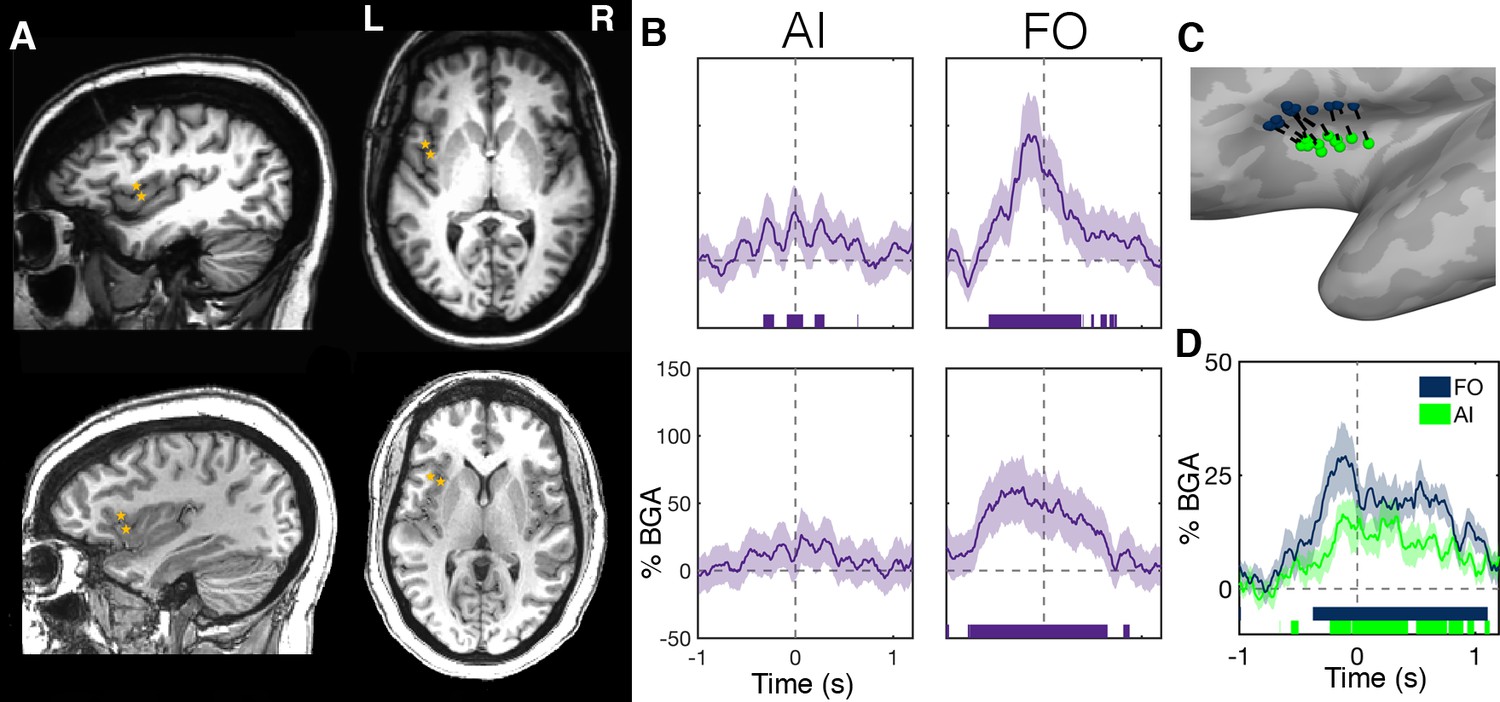
Within-patient differences in anterior insula and frontal operculum activity.
(A) Electrode pairs within two representative patients showing two neighboring electrodes, one within anterior insula (AI) and another within frontal operculum (FO). (B) Activity of these electrodes while reading, showing much greater activity within the FO electrodes. Electrode locations (C) and BGA (D) for neighboring electrode pairs used for within patient comparisons of AI and FO activity. Colored bars under the BGA plots represent regions of significant activation (q < 0.05).
-
Figure 5—source data 1
Source data for Figure 5B.
- https://cdn.elifesciences.org/articles/53086/elife-53086-fig5-data1-v2.mat
Figure 5—figure supplement 1
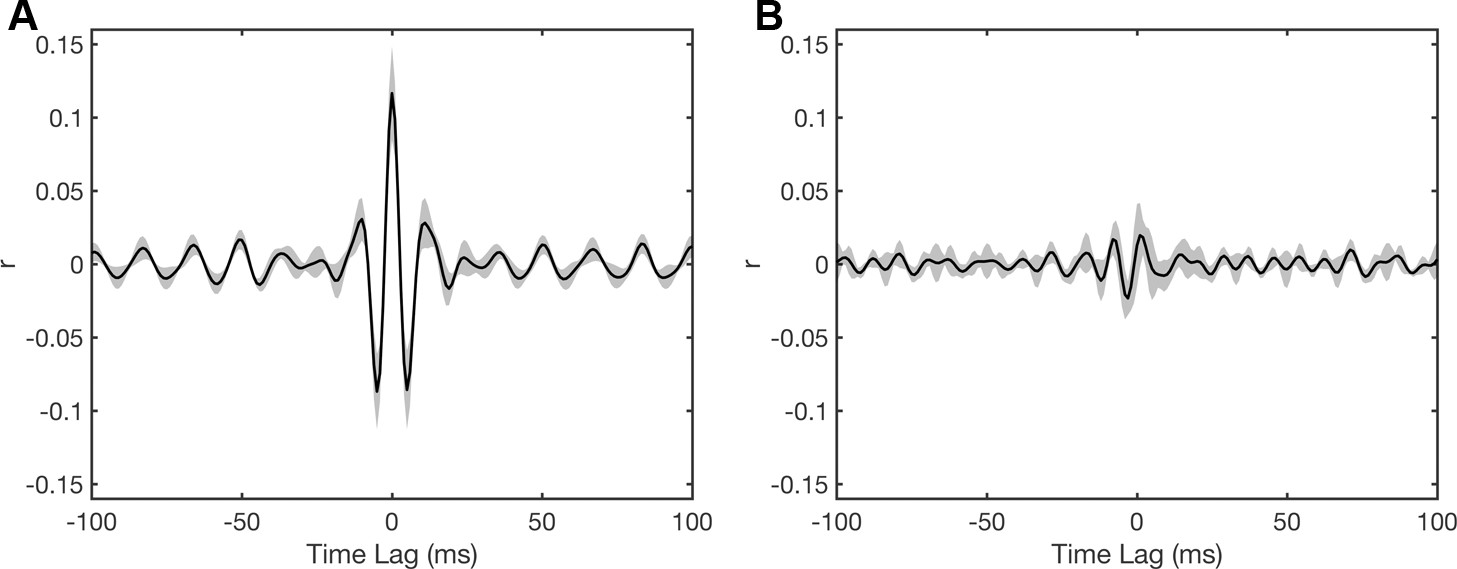
Time-lagged between-region cross-correlations.
Results of time lagging the insular and peri-insular recordings on the resultant cross-correlation values for the AI-FO (A) and PI-STG (B) comparisons. Correlation magnitude was maximal at 0 ms (r = 0.11 ± 0.03, mean ± SE) for the AI-FO comparison and at −4 ms (r = −0.02 ± 0.01) for the PI-STG comparison. Cross-correlations were performed within-patient, on the band-limited (70–150 Hz) voltage traces from the most proximal electrode pair across regions, in the time window ±1 s from articulation onset. Negative time lag represents insula preceding the peri-insular region.
Figure 6
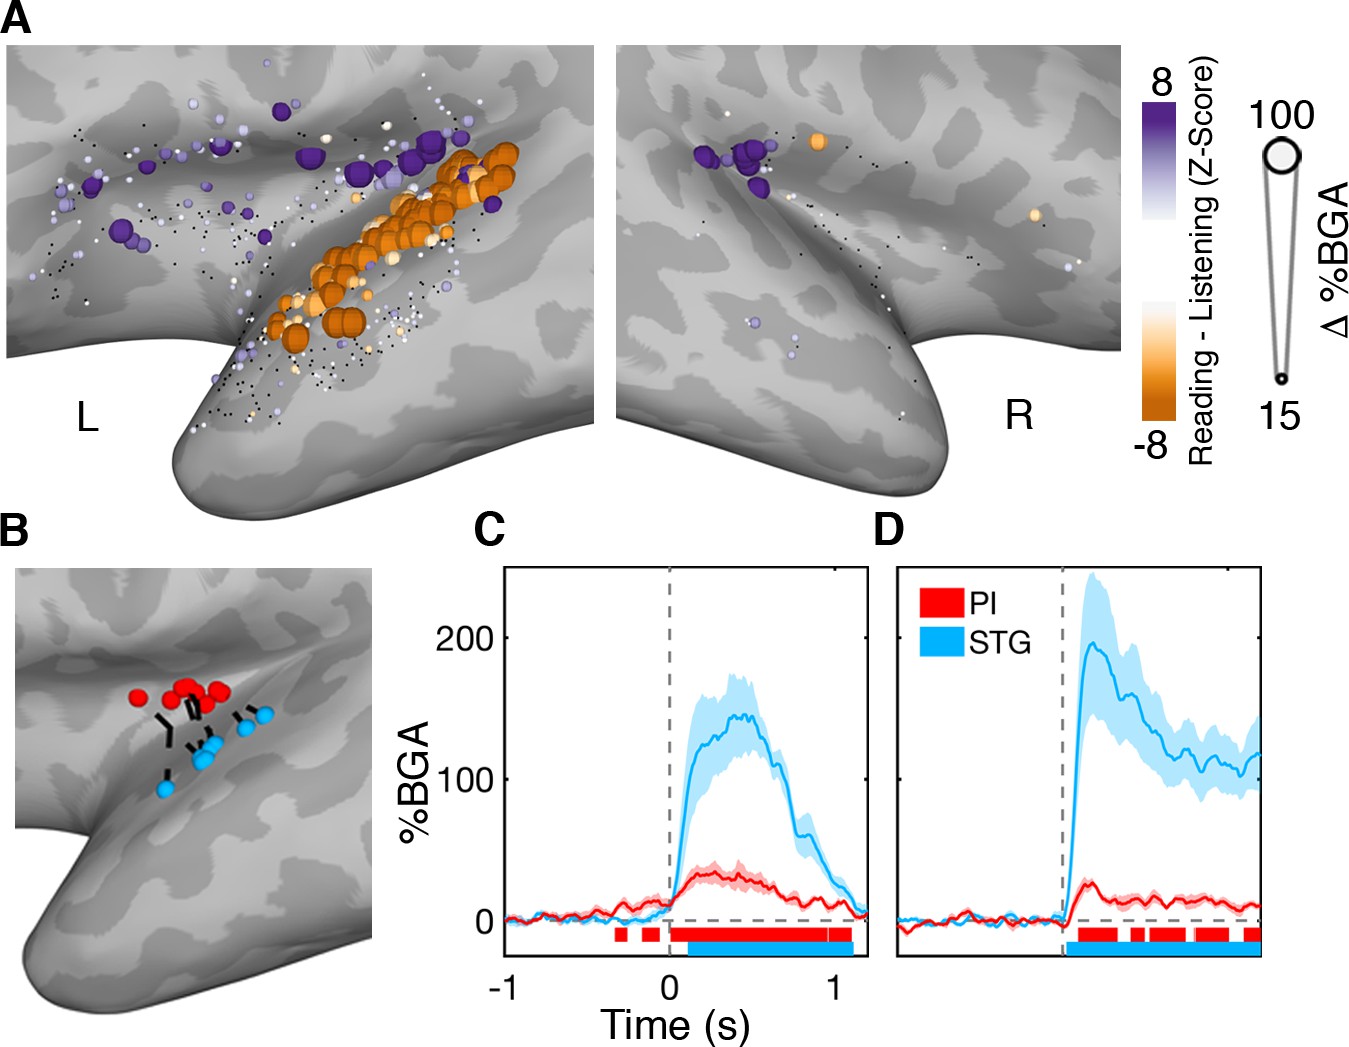
Functional dissociation of posterior insula from superior temporal gyrus.
(A) Contrast map comparing activation during self-generated speech in the reading task to external speech from the listening task in the 200 to 600 ms window. STG showed greater activation during speech perception while PI activity was greater during speech production. Electrodes with a non-significant difference (q > 0.05) shown in black. Electrode locations (B) and BGA for reading (C) and listening (D) for electrode pairs used for within patient comparisons of PI and STG activity. Colored bars under the BGA plots represents regions of significant activation (q < 0.05).
-
Figure 6—source data 1
Source data for Figure 6A.
- https://cdn.elifesciences.org/articles/53086/elife-53086-fig6-data1-v2.mat
Videos
Video 1
MEMA video of left hemispheric activity during the reading task.
MEMA was run on short, overlapping time windows (150 ms width, 10 ms spacing). Regions are shown for clusters with significant activity (p<0.01, uncorrected), absolute BGA change of >15% and coverage of at least three patients. Regions excluded for lack of patient coverage are shown in black.
Additional files
-
Source code 1
MATLAB plotting function for visualization of source data files.
- https://cdn.elifesciences.org/articles/53086/elife-53086-code1-v2.m
-
Transparent reporting form
- https://cdn.elifesciences.org/articles/53086/elife-53086-transrepform-v2.pdf
Download links
A two-part list of links to download the article, or parts of the article, in various formats.
Downloads (link to download the article as PDF)
Open citations (links to open the citations from this article in various online reference manager services)
Cite this article (links to download the citations from this article in formats compatible with various reference manager tools)
Uncovering the functional anatomy of the human insula during speech
eLife 8:e53086.
https://doi.org/10.7554/eLife.53086


