FoxO suppresses endoplasmic reticulum stress to inhibit growth of Tsc1-deficient tissues under nutrient restriction
- Institute of Molecular Systems Biology, ETH Zürich, Switzerland
Figures
Figure 1 with 2 supplements
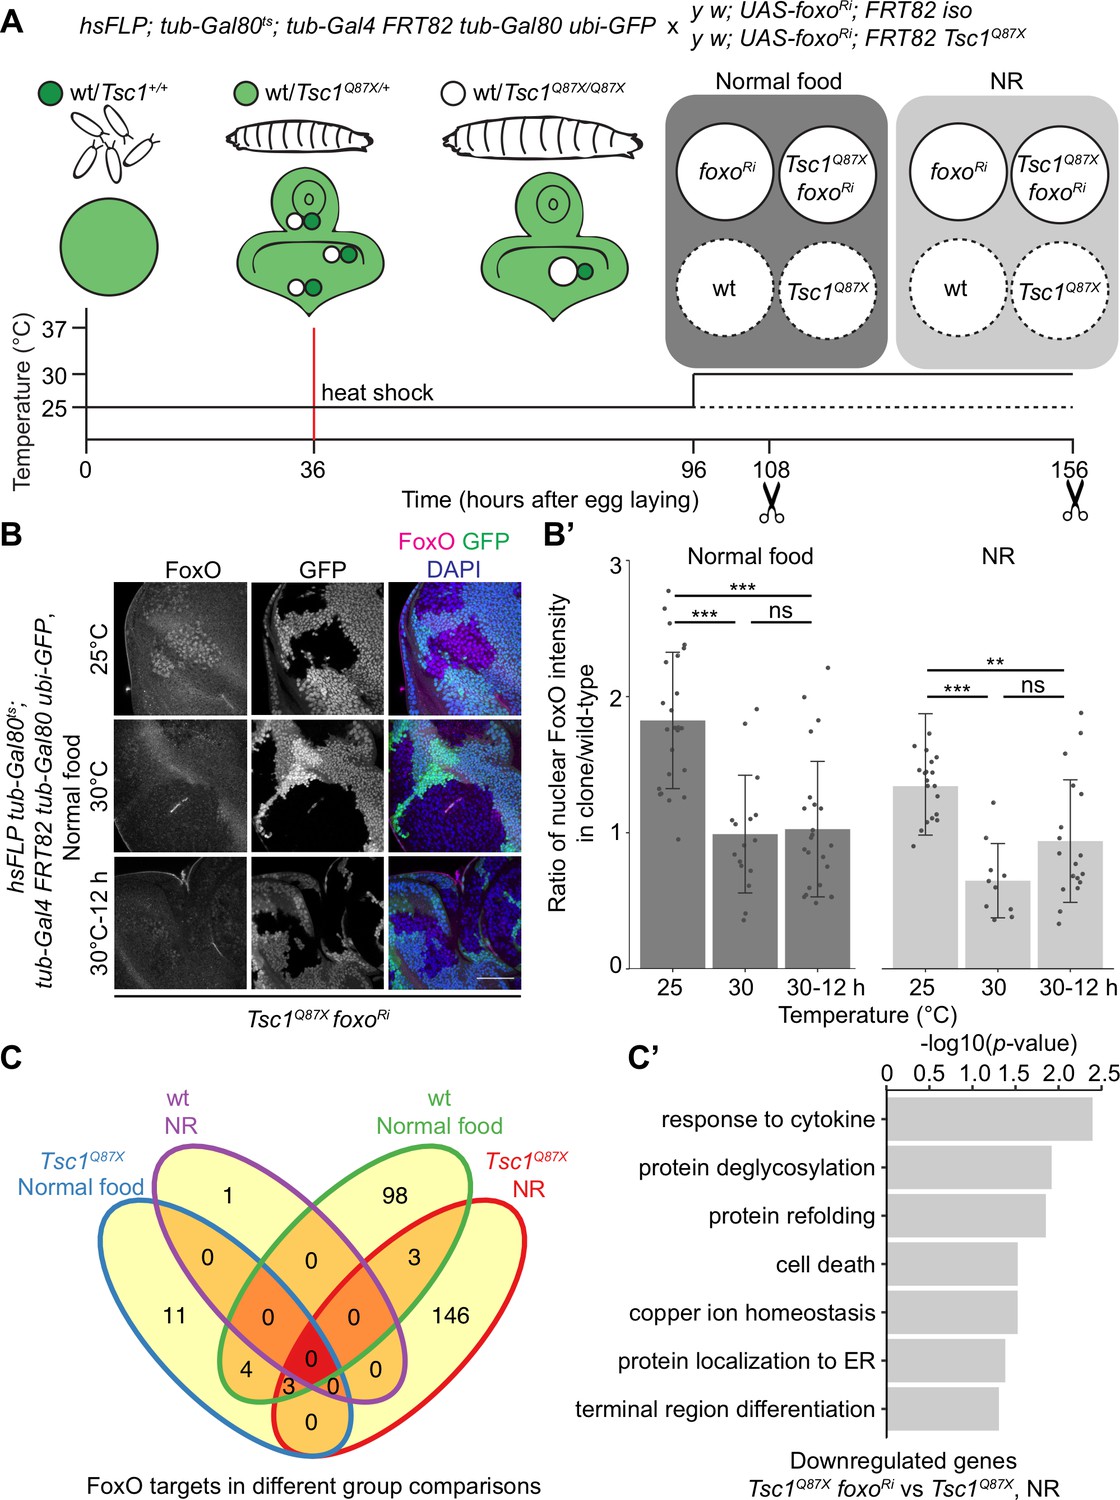
Transcriptomics analysis to identify FoxO targets in Tsc1 mutant cells.
(A) Schematic of the experimental setup to generate temporal knockdown of foxo in wild-type or Tsc1 mutant clones, and isolation of single clones using LCM at 108 hr after egg laying (AEL) from normal food and 156 hr AEL from NR. Solid or dashed lines represent clones isolated from larvae shifted to 30°C for 12 hr or maintained at 25°C, respectively. (B) FoxO staining of eye imaginal discs with Tsc1 mutant clones dissected from larvae raised on normal food at 25°C, 30°C or shifted from 25°C to 30°C for 12 hr. Clones are negatively marked by GFP, and DAPI stains nuclei. Scale bar = 50 µm. (B’) Quantification of ratio of nuclear FoxO intensity in Tsc1 mutant clone over wild-type from larvae raised on normal food or NR at temperatures described in B. n > 9. Data are represented as mean ± SD. **p<0.01, ***p<0.001 and ns = not significant. (C) Venn diagram depicting number of genes, upregulated and downregulated, between all conditions tested. p<0.0025 and FDR < 0.2. (C’) Gene ontology analysis of the downregulated genes in Tsc1 mutant cells upon foxo knockdown as compared to Tsc1 mutant cells under NR.
Figure 1—figure supplement 1
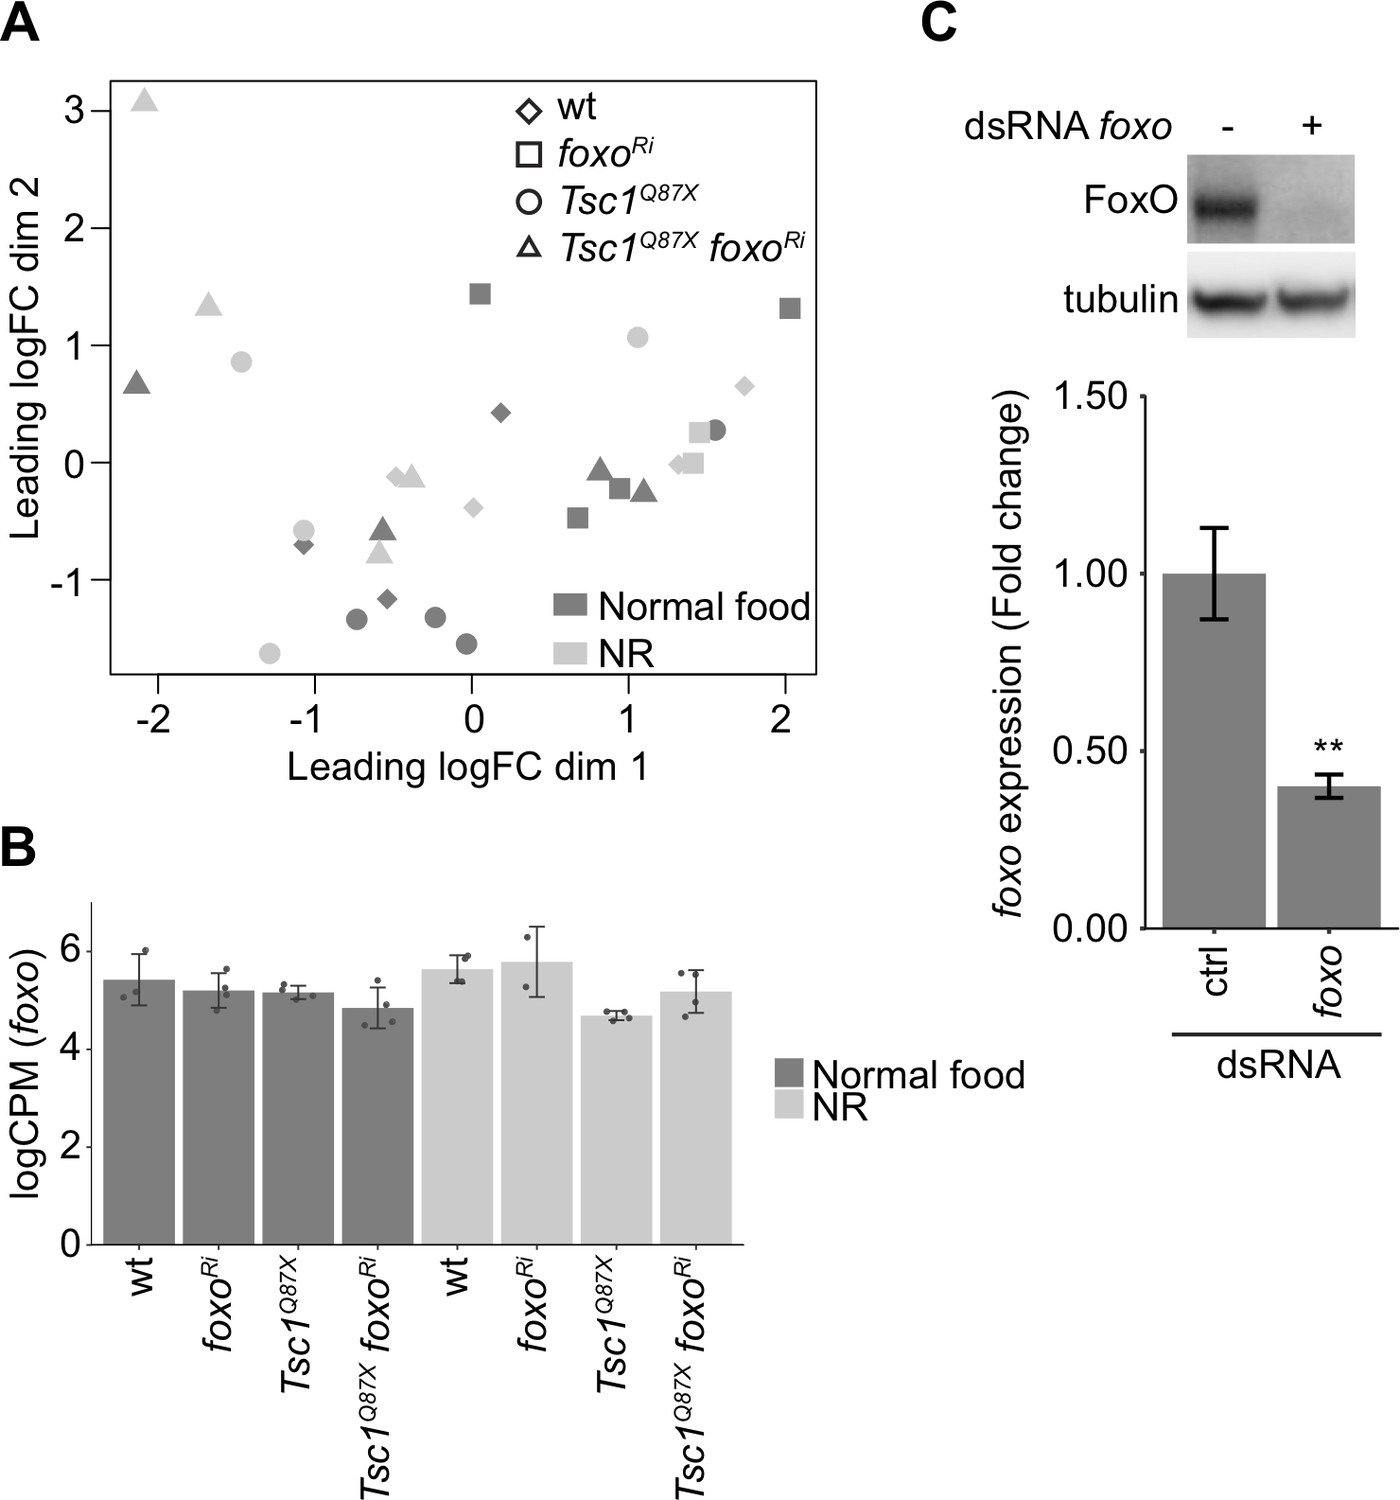
Validation of RNA-seq data.
(A) Multidimensional scaling plot of log counts per million (CPM) of ctrl and Tsc1 mutant cells, with or without foxo knockdown, from different food conditions. (B) foxo expression levels in indicated conditions. Data are represented as mean ± SD. (C) Immunoblot and RT-qPCR analysis of Kc167 cells transfected with dsRNA against ctrl or foxo. n = 3. Data are represented as mean ± SD. **p<0.01.
Figure 1—figure supplement 2
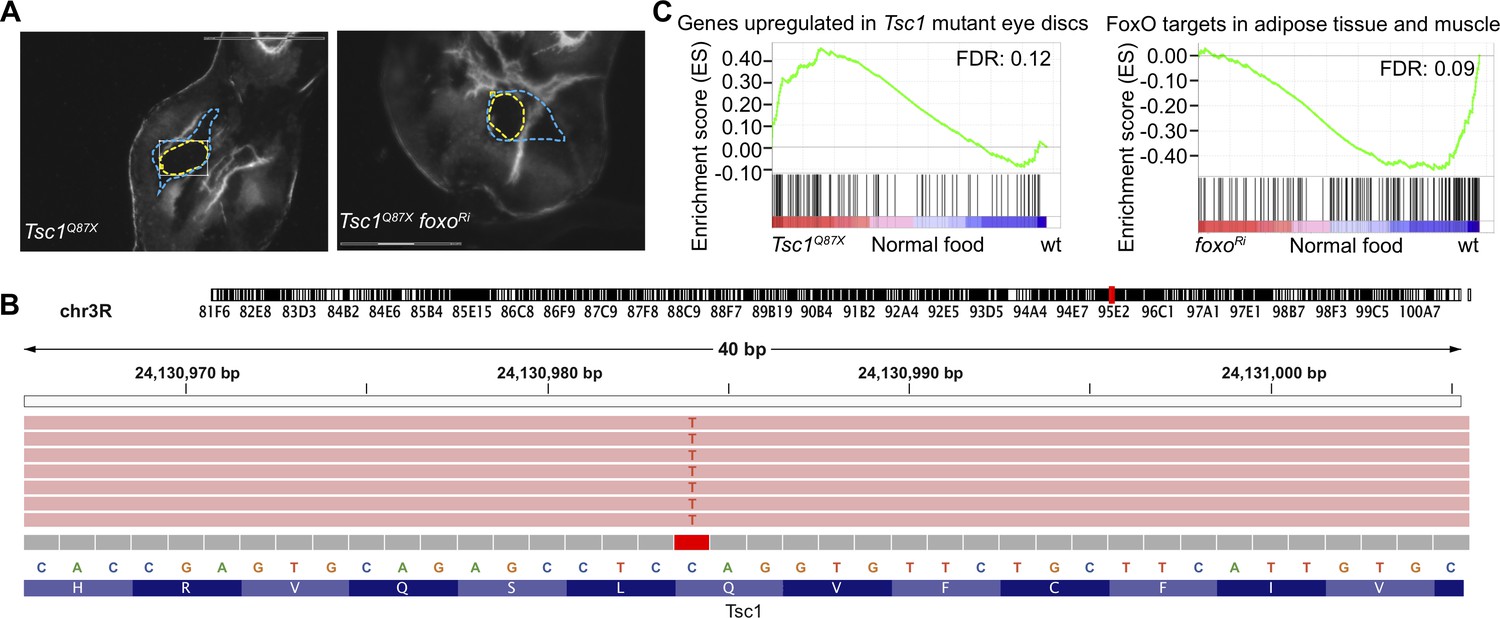
Contamination status of isolated clones.
(A) Representative images of isolated Tsc1Q87X and Tsc1Q87X foxoRi clones. Blue dashed lines mark the GFP-negative clones from which the selected clones (outlined in yellow) were isolated. Scale bar = 150 µm. (B) Mapping of sequences from Tsc1Q87X foxoRi cells isolated from a larva raised under NR to the Tsc1 locus at the position of Q87X point mutation using Integrative Genomics Viewer (Robinson et al., 2011). (C) GSEA plots depicting correlation between differentially expressed genes in Tsc1 mutant cells as compared to wild-type on normal food and genes upregulated in Tsc1 mutant eye discs (Harvey et al., 2008), and differentially expressed genes in wild-type versus foxo knockdown cells on normal food and FoxO targets (Teleman et al., 2008).
Figure 2 with 2 supplements
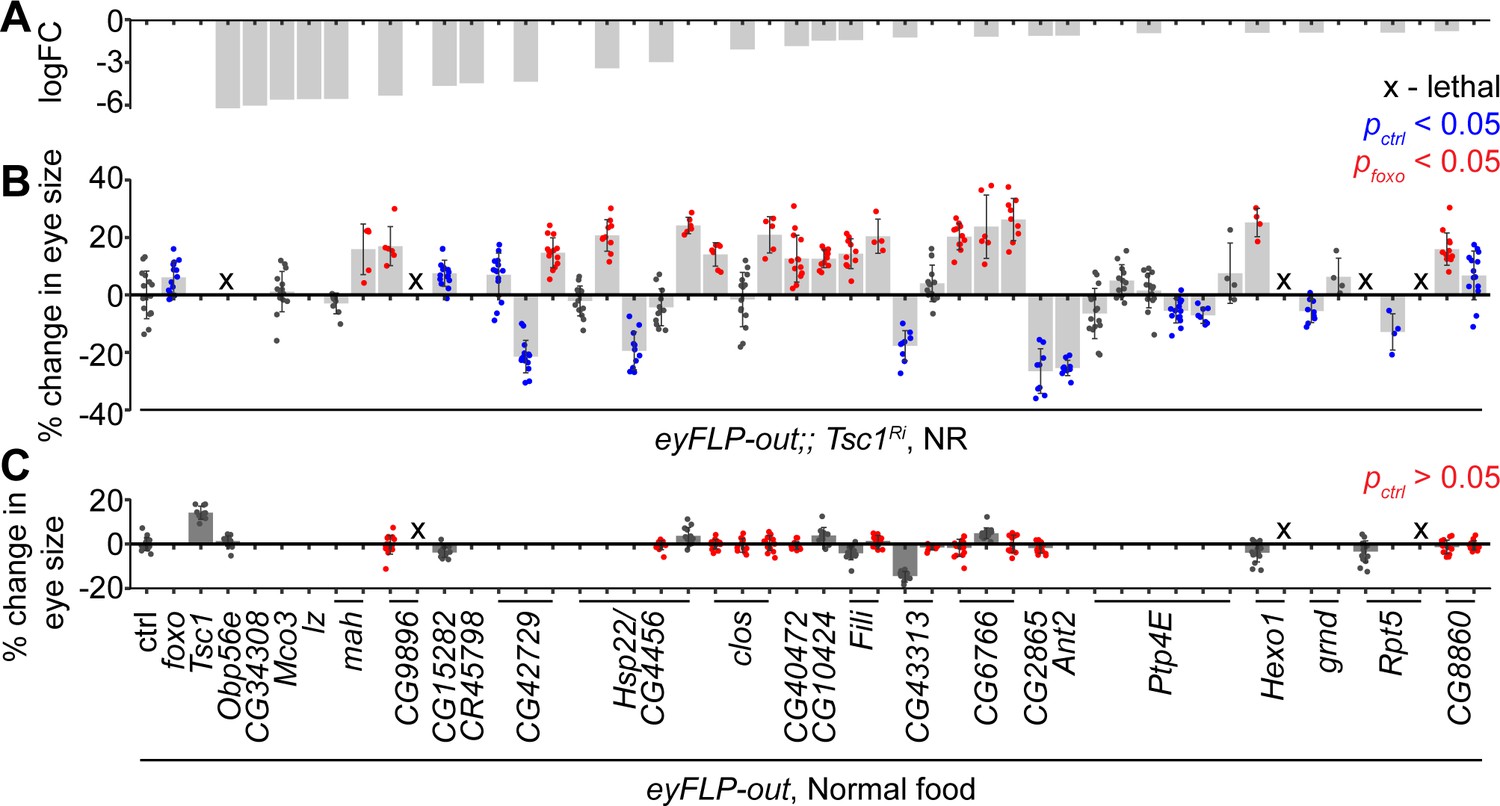
In vivo RNAi assay to validate downregulated genes in Tsc1 mutant cells upon foxo knockdown.
(A) log fold change (FC) of downregulated genes in Tsc1 mutant cells with foxo knockdown versus Tsc1 mutant cells under NR. (B) Percentage change in adult eye size upon knockdown of candidate genes in Tsc1 knockdown background under NR. n > 3. Blue or red points represent a significant (p<0.05) change as compared to ctrl or foxo knockdown, respectively. The RNAi lines are ordered as in the Materials and methods. (C) Percentage change in adult eye size upon knockdown of candidate genes in wild-type background on normal food. n > 9. Red points represent a non-significant (p>0.05) change as compared to ctrl. Data are represented as mean ± SD.
Figure 2—figure supplement 1
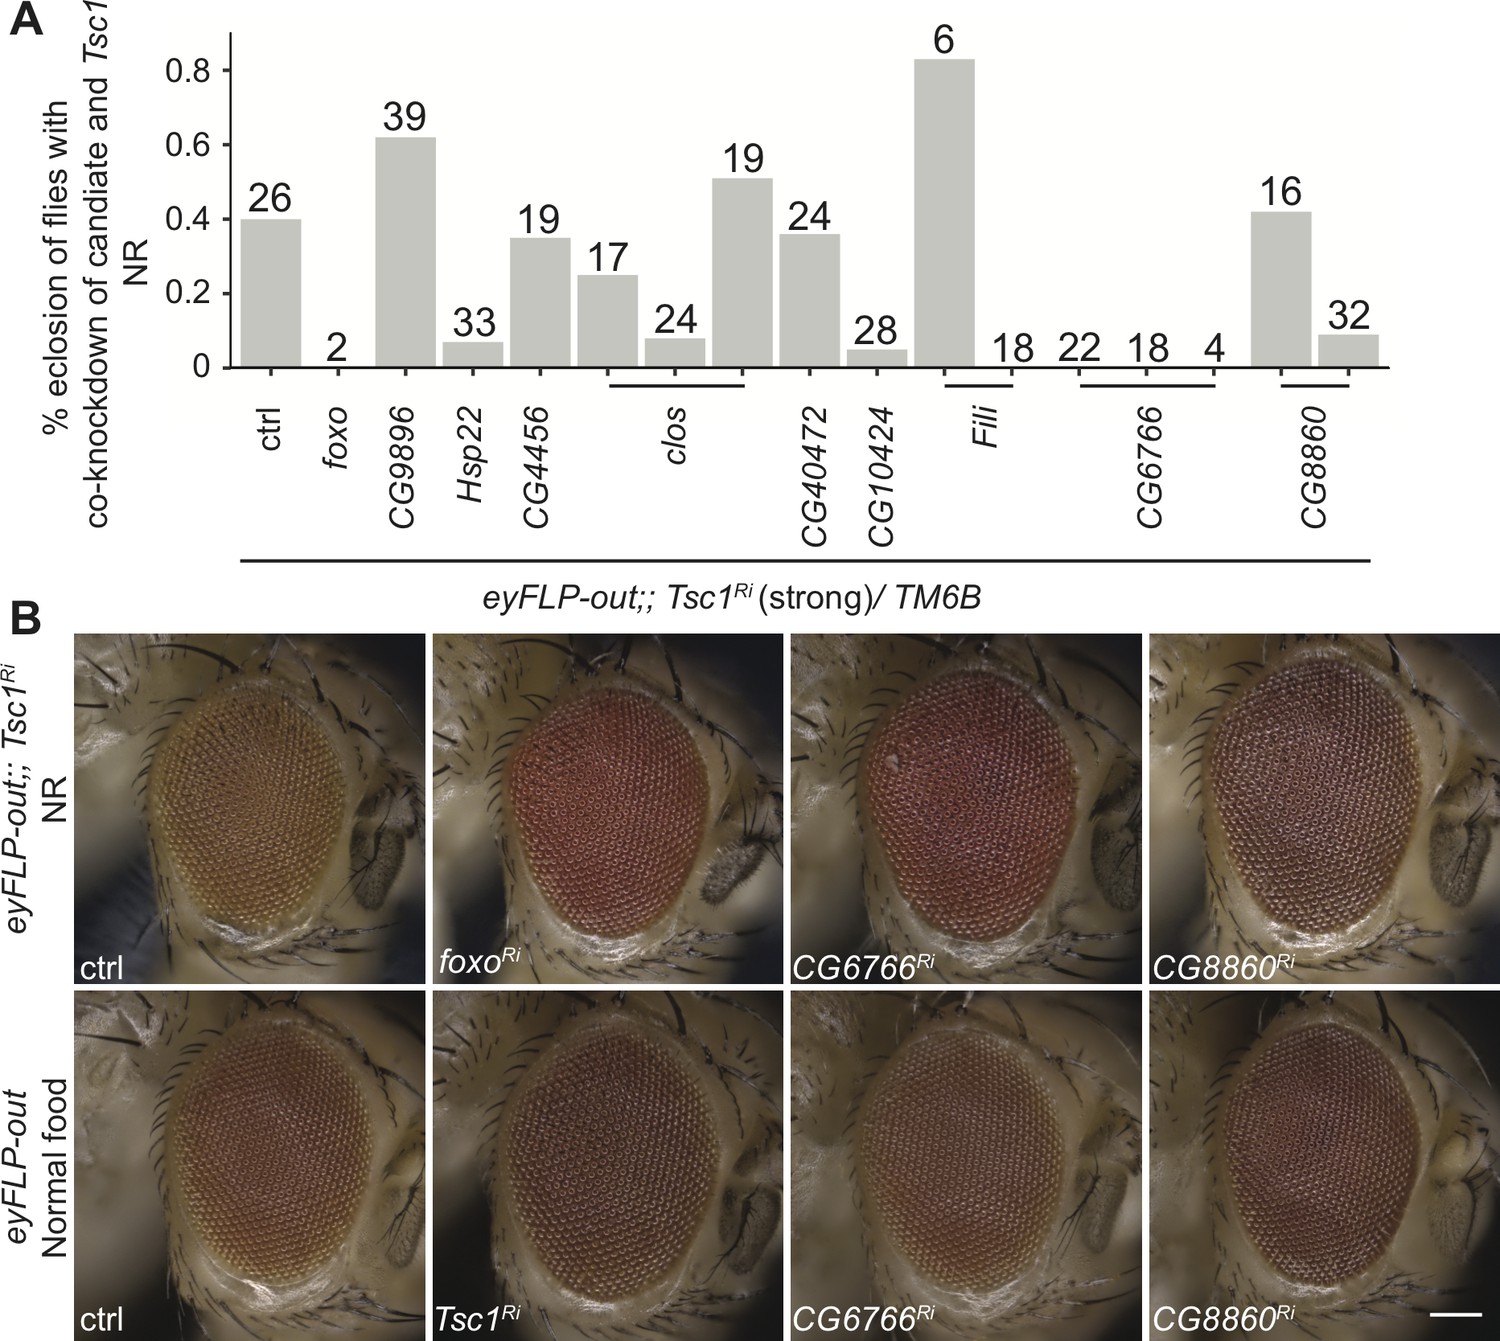
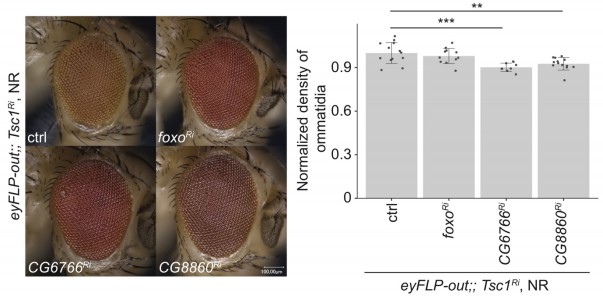
In vivo RNAi assay of downregulated candidates with strong Tsc1 knockdown and representative phenotypes of top hits.
(A) Percentage eclosion of flies with co-knockdown of candidate with Tsc1 under NR. Numbers above bars indicate the number of eclosed flies for each cross. (B) Representative images of eyes from control and candidate crosses from screens in Figure 2B and C. Scale bar = 100 µm.
Figure 2—figure supplement 2
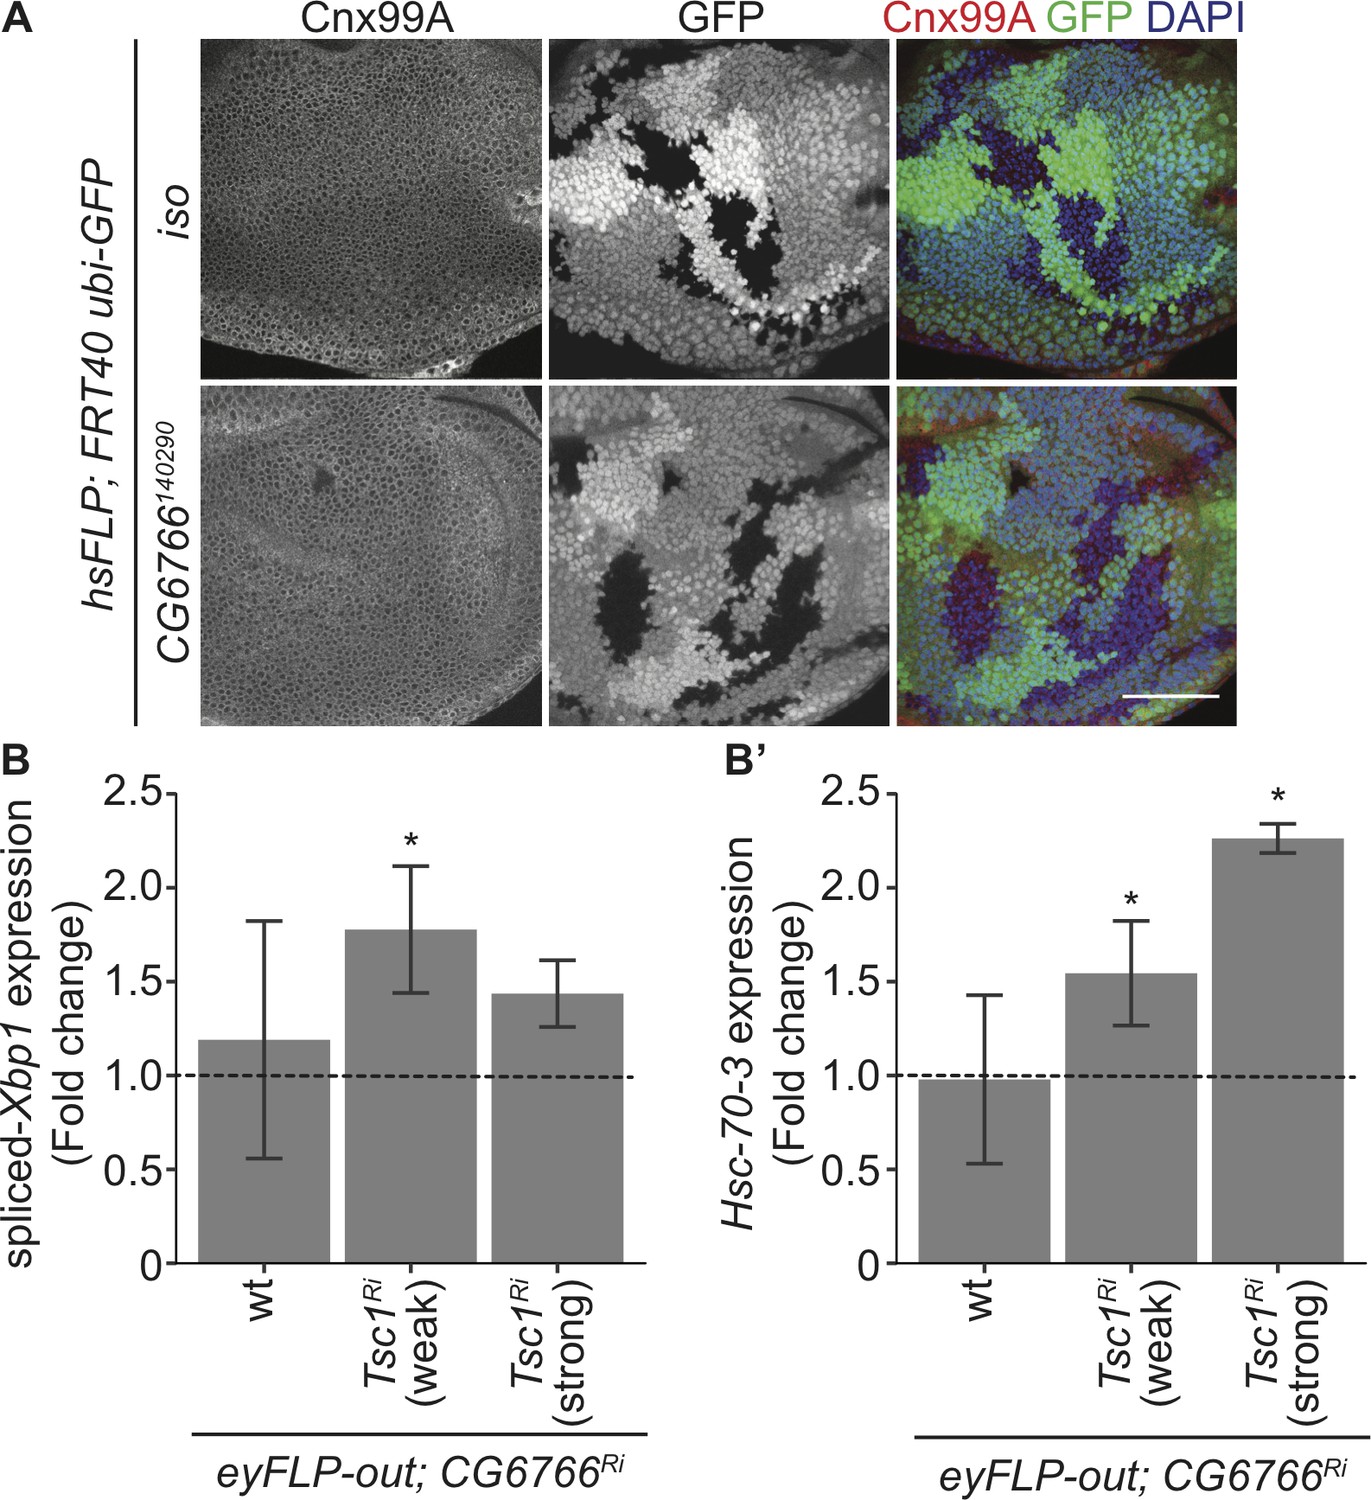
Loss of CG6766 enhances ER stress in Tsc1 mutant cells.
(A) Calnexin 99A staining of eye imaginal discs with control (iso) or CG6766 mutant clones dissected from larvae raised under normal feeding conditions. Clones are marked by the absence of GFP, and DAPI stains nuclei. Scale bar = 50 µm. (B–B’) RT-qPCR analysis of (B) spliced-Xbp1 and (B’) Hsc-70–3 on eye imaginal discs with knockdown of CG6766 in wild-type, weak knockdown of Tsc1 and strong knockdown of Tsc1 background, respectively, dissected from larvae raised under normal feeding conditions. Dashed line represents normalized value of corresponding controls. Data are represented as mean ± SD. *p<0.05.
Figure 3
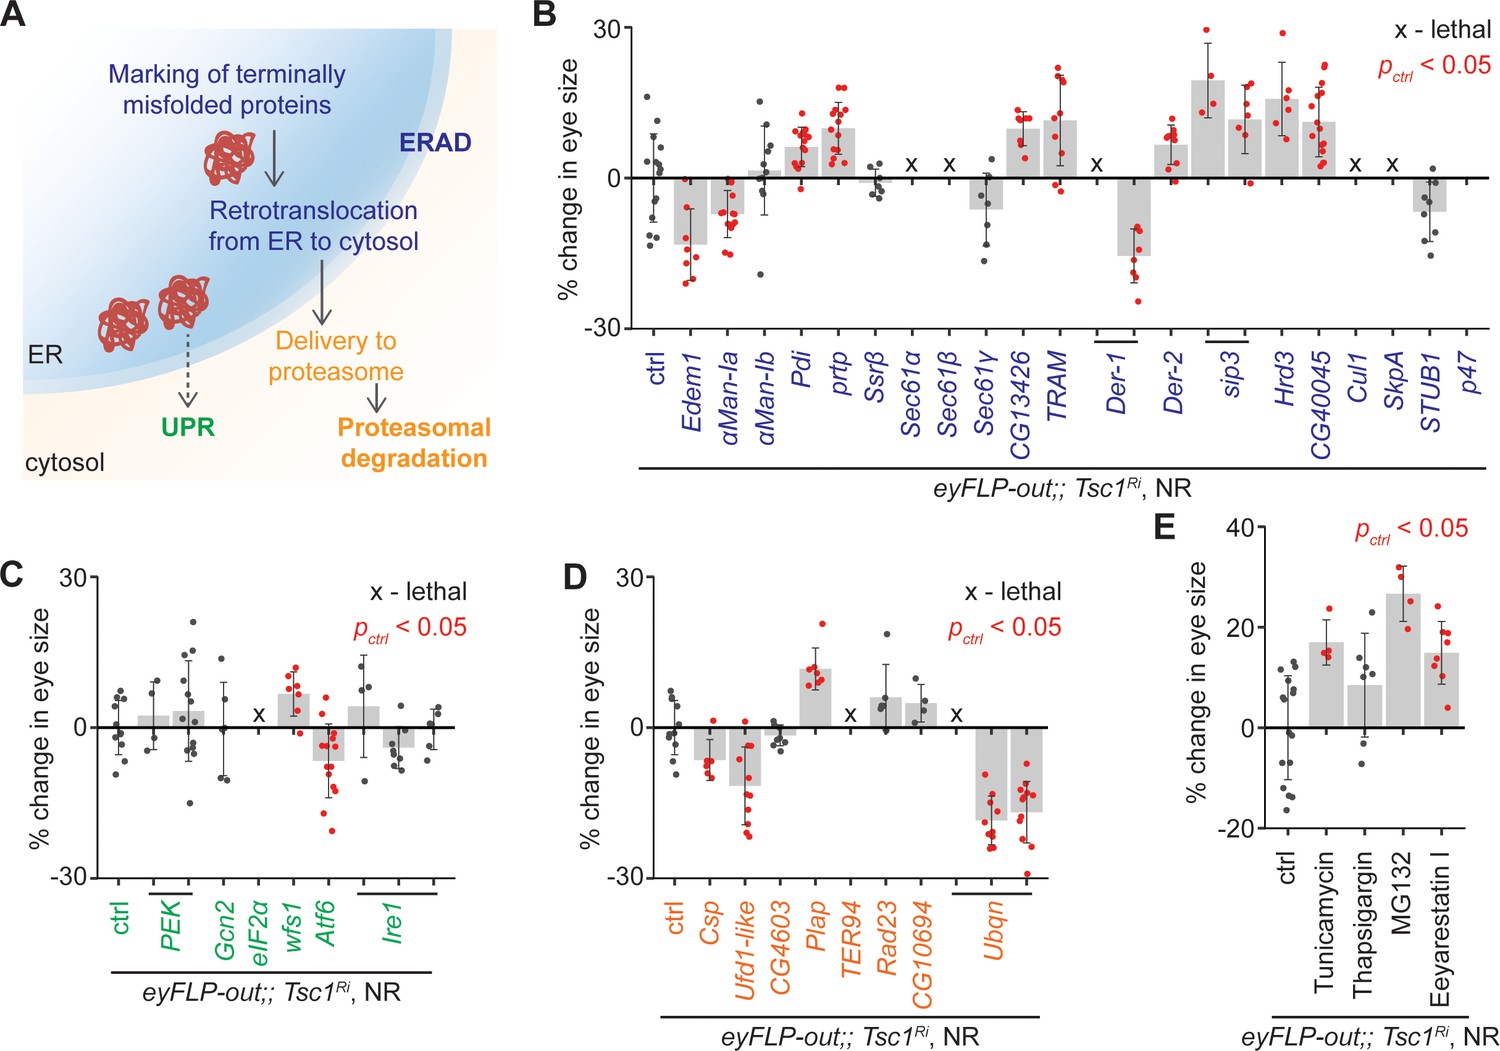
Upregulation of ER stress increases Tsc1 knockdown overgrowth.
(A) Schematic depicting involvement of genes tested in (B), (C) and (D) in different ER stress regulation mechanisms according to the KEGG database. Blue, green and orange denote components of ERAD, UPR and proteasomal degradation pathways, respectively. Percentage change in adult eye size upon knockdown of (B) ERAD, (C) UPR and (D) proteasomal degradation pathway components in Tsc1 knockdown background under NR. Note that experiments in (C) and (D) were performed together and therefore have the same control. (E) Percentage change in Tsc1 knockdown adult eye size upon addition of the indicated small molecule inhibitors to the fly food under NR. n > 3. Data are represented as mean ± SD. Red points represent a significant (p<0.05) change as compared to ctrl.
Figure 4 with 1 supplement
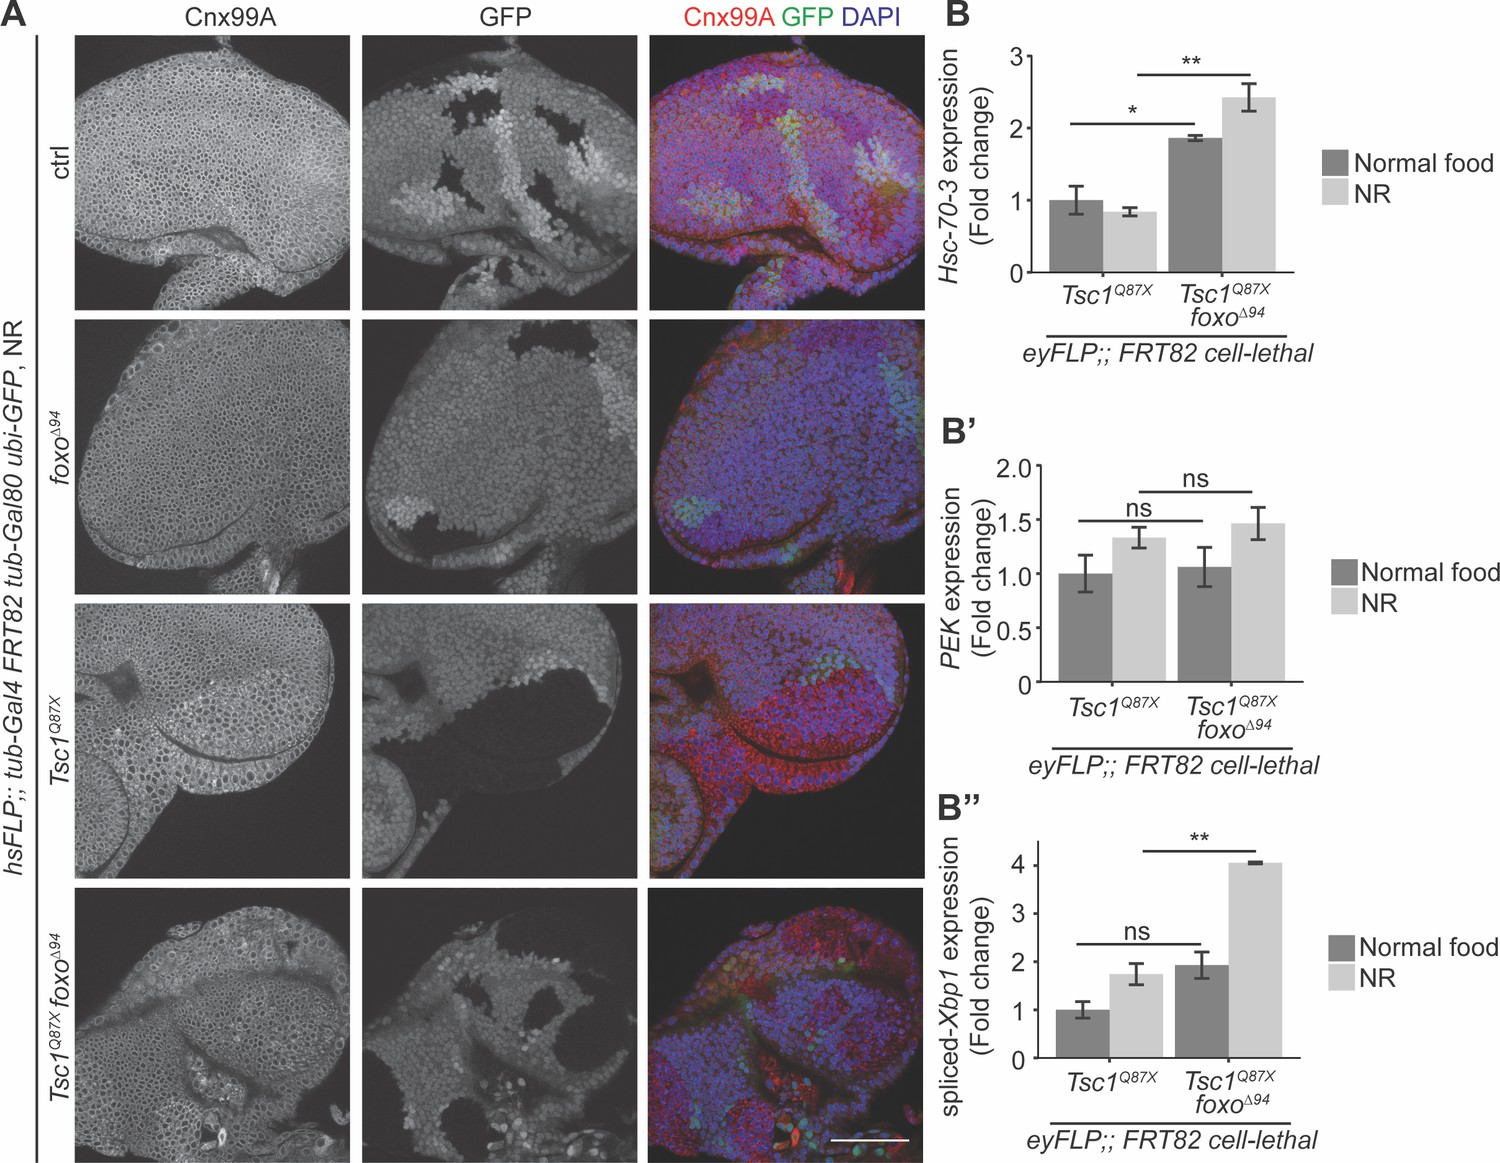
Loss of foxo enhances ER stress in Tsc1 mutant cells.
(A) Calnexin 99A staining of eye imaginal discs with ctrl, foxo, Tsc1 or Tsc1 foxo mutant clones dissected from larvae raised under NR. Clones are marked by the absence of GFP; DAPI stains nuclei. Scale bar = 50 µm. (B–B’’) RT-qPCR analysis of (B) Hsc-70–3, (B’) PEK and (B’’) spliced-Xbp1 on Tsc1 or Tsc1 foxo mutant eye imaginal discs dissected from larvae raised under normal food or NR. n = 2 with triplicates. Data are represented as mean ± SD. *p<0.05, **p<0.01 and ns = not significant.
Figure 4—figure supplement 1
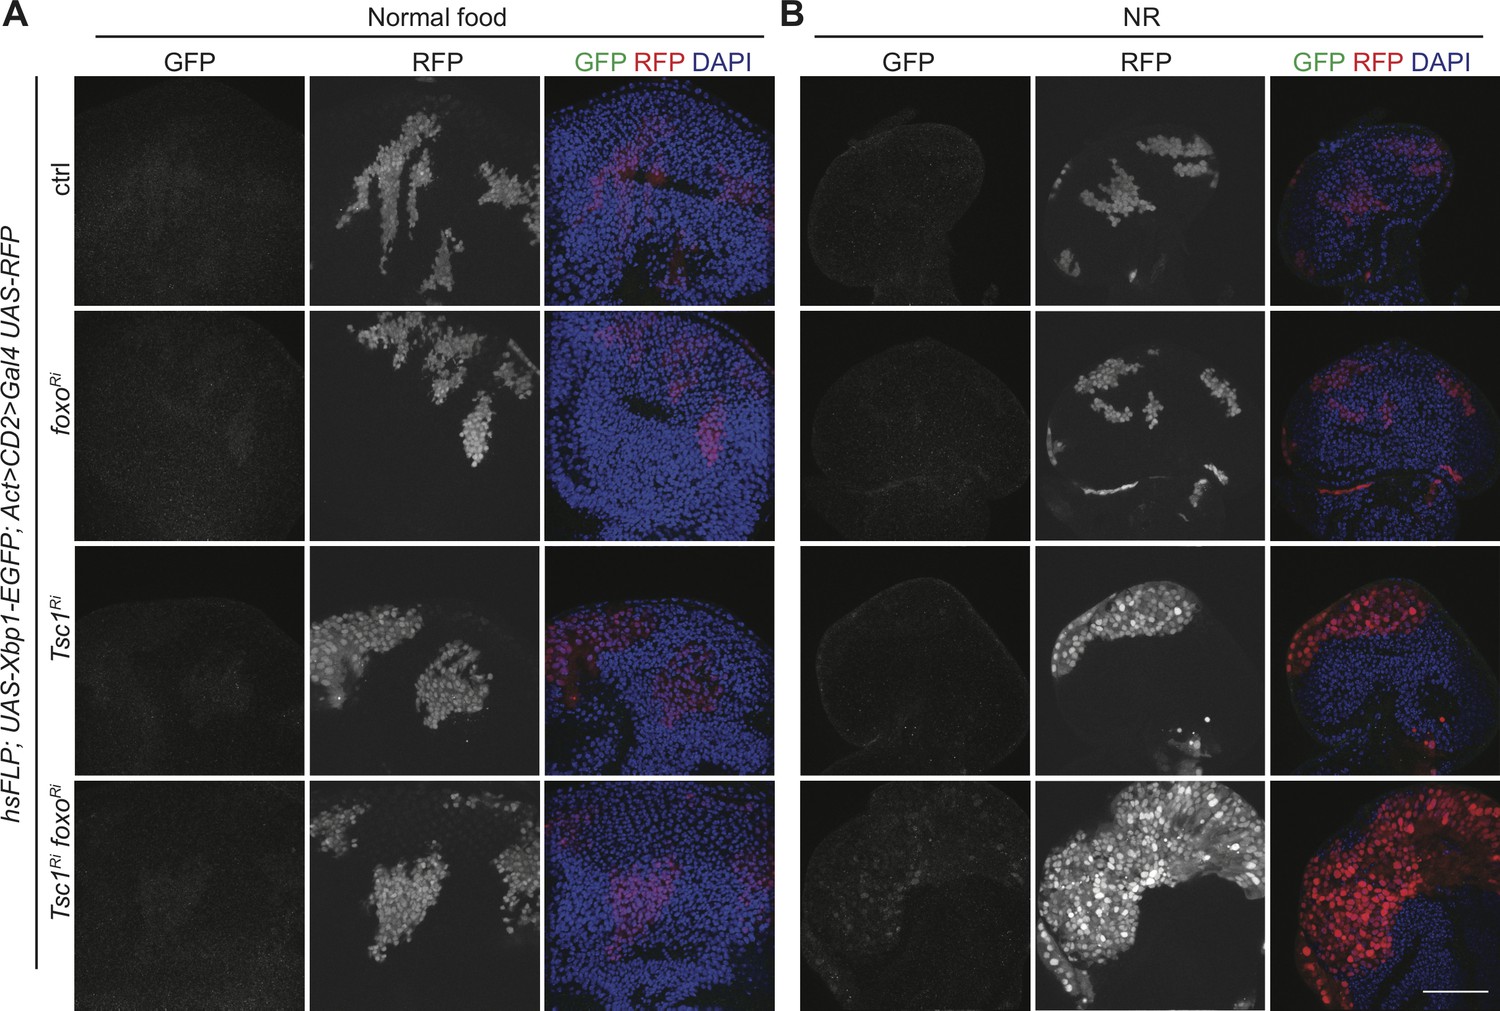
FoxO suppresses Ire1 pathway activation in Tsc1 mutant cells under NR.
(A–B) GFP staining to detect Xbp1-EGFP of eye imaginal discs with ctrl, foxo, Tsc1 or Tsc1 foxo knockdown clones dissected from larvae raised under (A) normal food or (B) NR. Clones are marked by RFP and DAPI stains nuclei. Scale bar = 50 µm.
Author response image 1
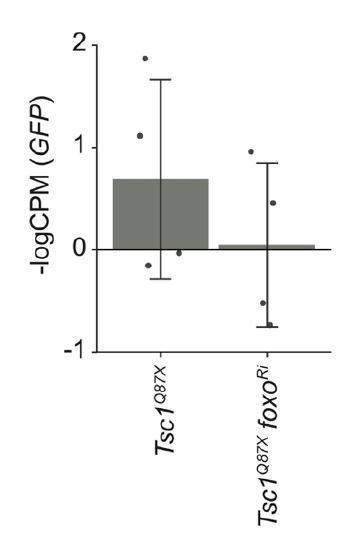
GFP expression levels in Tsc1 mutant clones with and without foxo knockdown isolated from larvae raised under normal feeding conditions.
Data are represented as mean ± SD.
Author response image 2
Additional files
-
Supplementary file 1
Key Resources Table.
- https://cdn.elifesciences.org/articles/53159/elife-53159-supp1-v1.docx
-
Supplementary file 2
Primer sequences for dsRNA synthesis and qPCR.
- https://cdn.elifesciences.org/articles/53159/elife-53159-supp2-v1.docx
-
Transparent reporting form
- https://cdn.elifesciences.org/articles/53159/elife-53159-transrepform-v1.pdf
Download links
A two-part list of links to download the article, or parts of the article, in various formats.
Downloads (link to download the article as PDF)
Open citations (links to open the citations from this article in various online reference manager services)
Cite this article (links to download the citations from this article in formats compatible with various reference manager tools)
FoxO suppresses endoplasmic reticulum stress to inhibit growth of Tsc1-deficient tissues under nutrient restriction
eLife 9:e53159.
https://doi.org/10.7554/eLife.53159


