Preparation for upcoming attentional states in the hippocampus and medial prefrontal cortex
- Department of Psychology, Columbia University, United States
- Department of Psychology, Sabanci University, Turkey
- Affiliate Member, Zuckerman Mind Brain Behavior Institute, Columbia University, United States
Figures
Figure 1 with 1 supplement
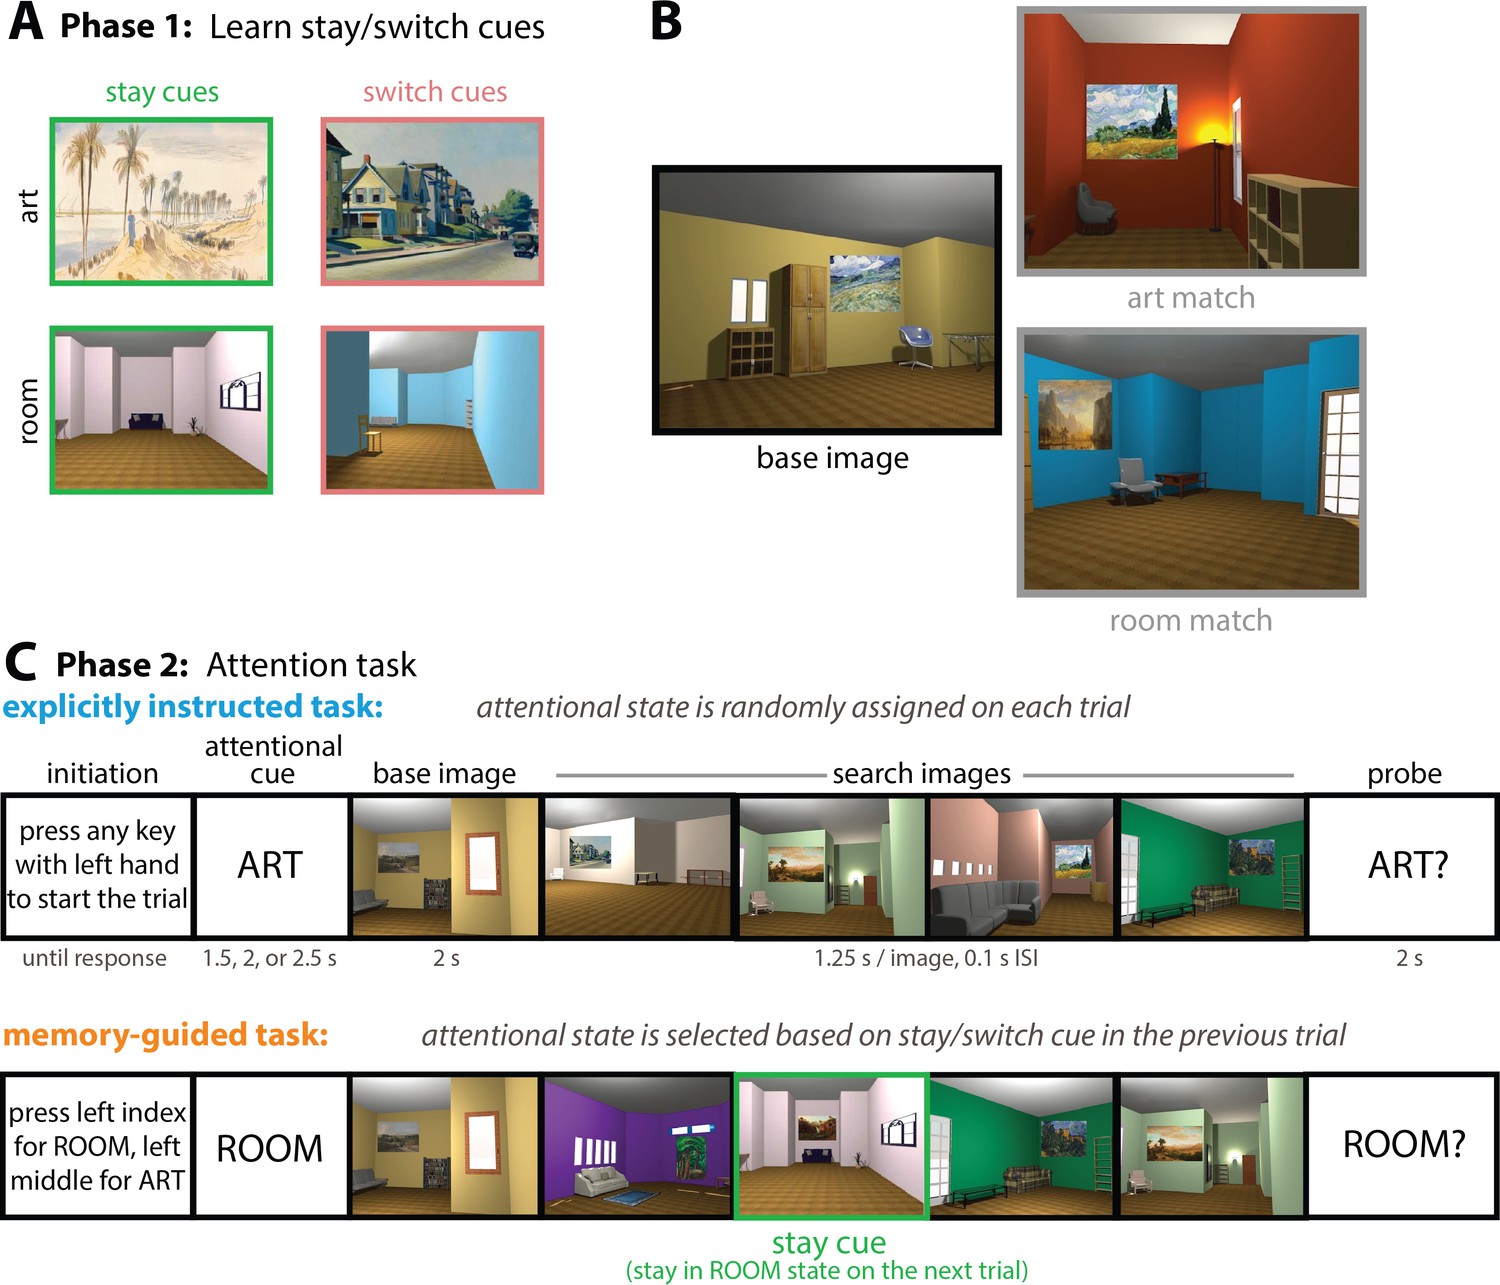
Task design.
(A) Before entering the MRI scanner, participants learned stay and switch cues (Phase 1) that would be embedded in a subsequent attention task (Phase 2). One painting and one room were ‘stay’ cues, and one painting and one room were ‘switch’ cues. ‘Stay’ cues indicated that, during the subsequent memory-guided attention task, participants should stay in the same attentional state on the following trial. ‘Switch’ cues indicated that participants should switch to the other attentional state on the following trial. (B) The attention task involved the presentation of 3D-rendered rooms with paintings. Participants had to attend either to the style of the paintings (‘art’ trials) or the spatial layout of the rooms (‘room’ trials). On ‘art’ trials, the task was to find paintings that could have been painted by the same artist because of their similarity in artistic style, even though the content of the paintings might be different (e.g., the art match and base image have paintings by the same artist). On ‘room’ trials, the task was to find rooms that had the same spatial layout from a different perspective, even though their other features (wall color, specific furniture exemplars) varied (e.g., the room match and the base image have the same spatial layout from a different perspective). (C) Trial structure of the attention task. In the explicitly instructed task, the attentional state on each trial was randomly assigned (‘ART’ or ‘ROOM’). On ‘art’ trials, participants had to determine if any of the paintings in the search set was painted by the same artist as the painting in the base image (i.e., if there was an art match). On ‘room’ trials, participants had to determine if any of the rooms in the search set had the same spatial layout as the room in the base image (i.e., if there was a room match). The memory-guided task was similar, except the attentional cue was not explicitly instructed at the beginning of each trial. Instead, participants had to choose their attentional goal at the beginning of each trial based on the stay or switch cue in the previous trial. Here, there is a room ‘stay’ cue (outlined in green), indicating that on the next trial, the participant should select ‘room’ as their attentional goal. If instead there was a room ‘switch’ cue, the participant would have to select ‘art’ as their attentional goal on the following trial. Particular stay and switch cues only appeared in the attended dimension: I.e., art stay/switch cues only appeared on trials where art was attended, and room stay/switch cues only appeared on trials where rooms were attended. Finally, some trials contained neither a stay cue nor a switch cue. On trials following such ‘no cue’ trials, participants were free to choose either ‘art’ or ‘room’ as their attentional state. Stay/switch cues were also embedded in the search set in the explicitly instructed task, but there they had no relevance for the upcoming attentional state.
Figure 1—figure supplement 1
Analysis approaches for examining preparatory activity.
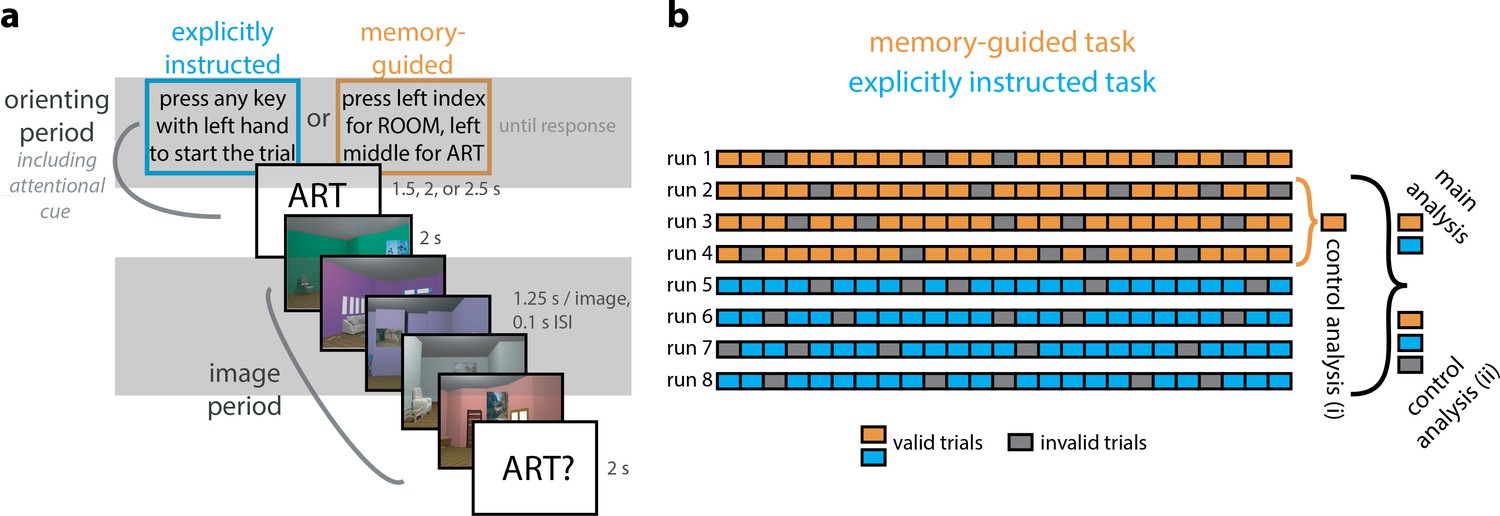
(A) Activity patterns from orienting periods were compared to activity patterns from image periods to look for preparatory coding. To separate orienting period and image period activity patterns, we excluded from analysis all ‘boundary’ TRs (i.e., the last TR of the orienting period, and the first and last TR of the image period). It was not necessary to drop the first TR of the orienting period because it followed a blank inter-trial interval. The last TR of the orienting period was not removed if it was the only TR during which the attentional cue was presented. The first TR of the image period was removed to reduce autocorrelation with the orienting period. The last TR of the image period was removed because it can also include the probe. The latter is particularly important, because otherwise orienting period pattern similarity with the image period could be a result of the overlap in text between the attentional cue and the probe. The gray boxes roughly highlight the time points considered for analysis for the orienting period (top gray box) and image period (bottom gray box). Note that trial onsets are not locked to TRs, so this is only a rough guide. In one additional control analysis, we included the last TR of the orienting period in the analyses. (B) Various approaches were taken to define ‘template’ patterns of activity from image periods, which were then compared to activity patterns during the orienting periods. All comparisons were done across runs, to prevent within-run autocorrelation from affecting the results. Here, we show each run of the experiment as a row (orange = memory-guided runs; blue = explicitly instructed runs). The other task order (explicitly instructed first, then memory-guided) can occur as well, but only one order is shown for simplicity. Each run contains 25 trials (filled boxes), 80% of which are valid trials (colored boxes) and 20% of which are invalid trials (gray boxes). Trial order is hypothetical; valid and invalid trials occur randomly throughout a run. The main analysis approach defined template patterns of activity from the image period of valid trials in both tasks (memory-guided, explicitly instructed), excluding trials from the same run as the orienting period of interest. In this example, activity patterns from any orienting period in run 1 would be correlated with image period templates defined from runs 2–8, with only valid trials used. For control analysis (i), separate image period templates were used for the memory-guided and explicitly instructed conditions, and again only valid trials were used. In this example, an orienting period in run 1 would be compared against image period templates defined from runs 2–4 (i.e., other runs of the same task; an orienting period in run 5 would be compared against image period templates defined from runs 6–8). Finally, control analysis (ii) was similar to the main analysis except both valid and invalid trials were used in the templates.
Figure 2

Behavioral results.
Sensitivity (A’) in detecting (art or room) matches, shown separately for each task (memory-guided, explicitly instructed) and for valid vs. invalid trials (filled and open circles, respectively). Circles are individual participants. Solid lines show average A’ across participants, and error bars indicate the standard error of the mean for the within-participant valid – invalid difference. The dashed line indicates chance performance (A’=0.5). A’ was higher on valid vs. invalid trials and was not significantly different between the memory-guided and explicitly instructed tasks.
Figure 3

Univariate activity for memory-guided vs. explicitly instructed attention.
(A) BOLD activity was higher for the memory-guided vs. explicitly instructed task, for both the hippocampus and vmPFC. Circles show parameter estimates (i.e., univariate BOLD activity) for individual participants. Solid lines show average parameter estimates across individuals, and error bars indicate standard error of the mean for the within-participant task difference (i.e., memory-guided – explicitly instructed). (B) The univariate activity enhancements for memory-guided attention (i.e., memory-guided parameter estimates – explicitly instructed parameter estimates) in the hippocampus and vmPFC were correlated across individuals.
Figure 4
Representations of current attentional states.
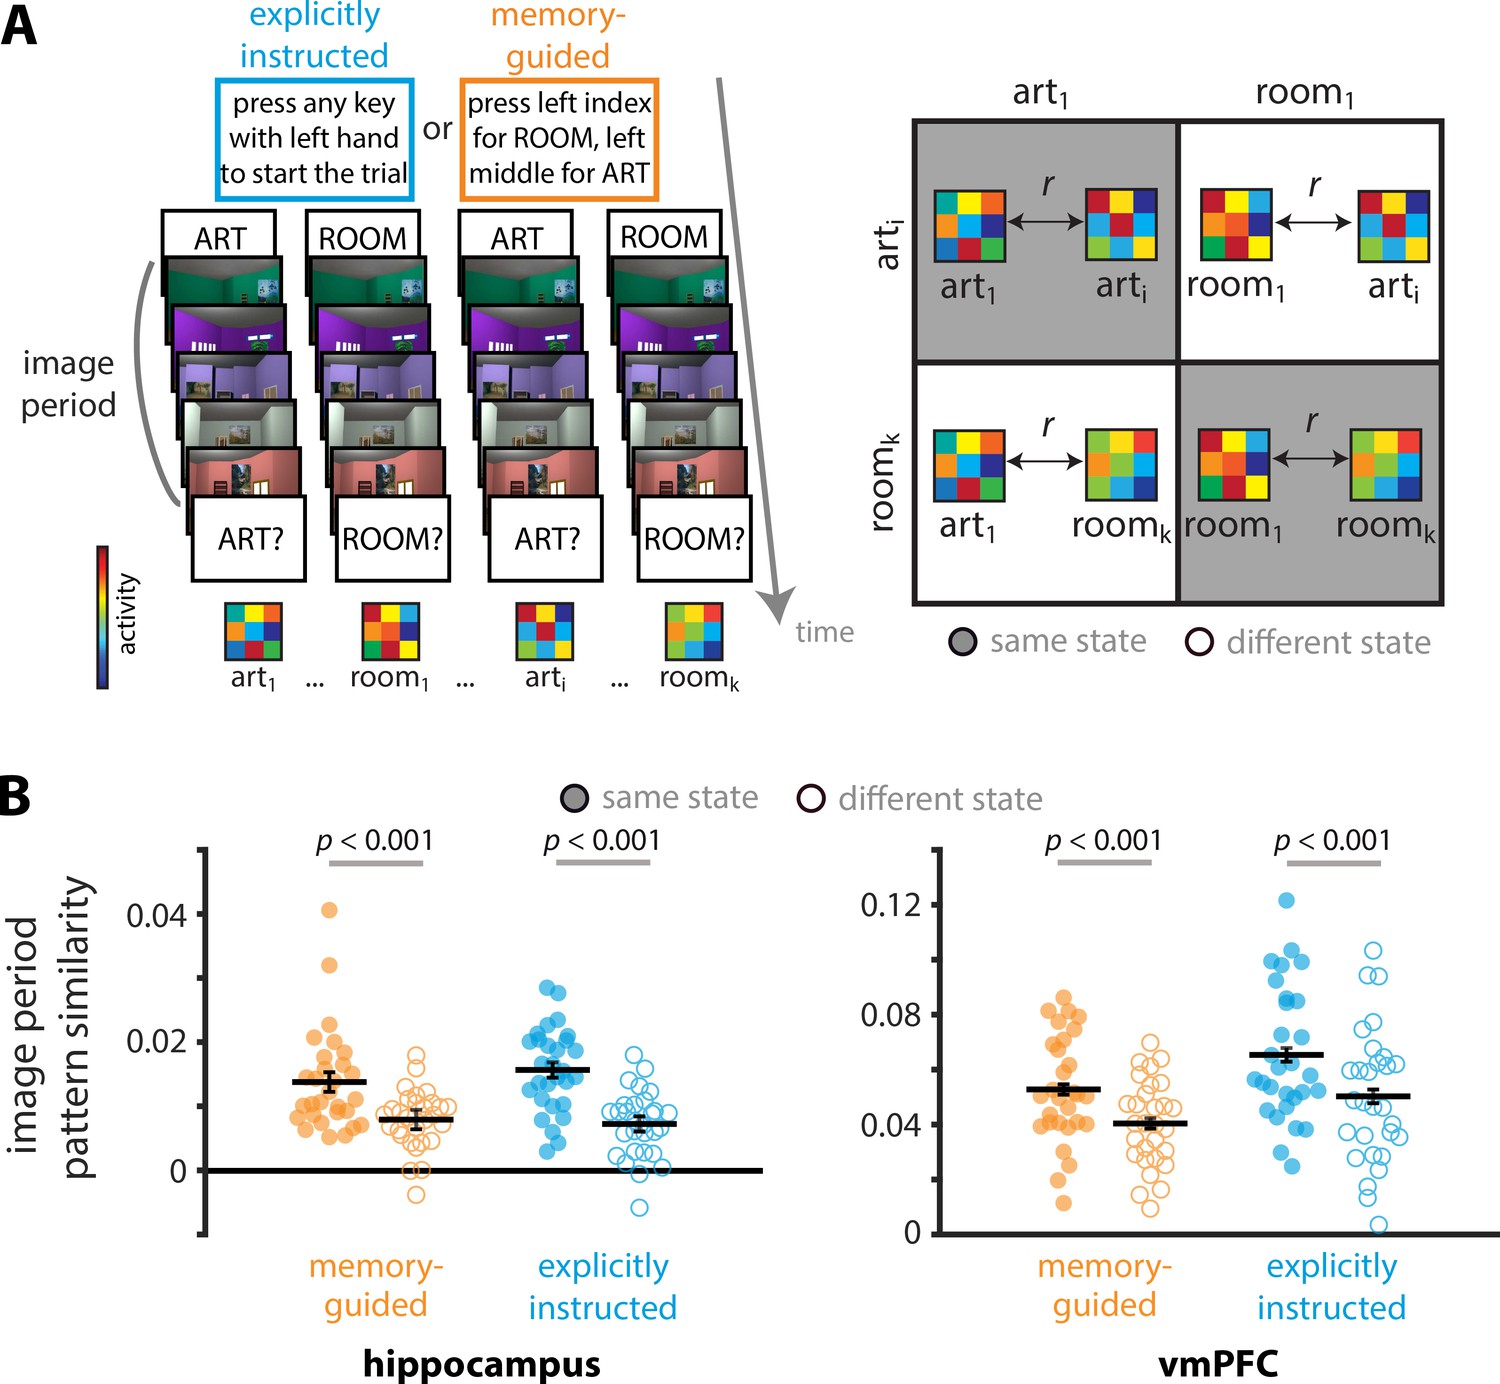
(A) Image period pattern similarity was calculated by correlating activity patterns across trials of the same vs. different attentional states, separately for each task. Here art1, room1, arti, and roomk indicate 1st art trial, 1st room trial, ith art trial, and kth room trial within a given task (memory-guided, explicitly instructed) respectively. Correlations were compared for trials of the same attentional state (i.e., art-art and room-room; right panel, gray background) and trials of different attentional states (i.e., art-room; right panel, white background). (B) Both the hippocampus and vmPFC represented current attentional states, with higher pattern similarity for trials of the same vs. different attentional states. Full circles and empty circles show pattern similarity for each participant for trials of the same state and different state, respectively. Solid lines show average pattern similarity across individuals. The results are shown as Pearson correlations, but statistical tests were performed after applying the Fisher transformation. The error bars indicate standard error of the mean for the within-participant attentional state difference (i.e., same - different) for each task.
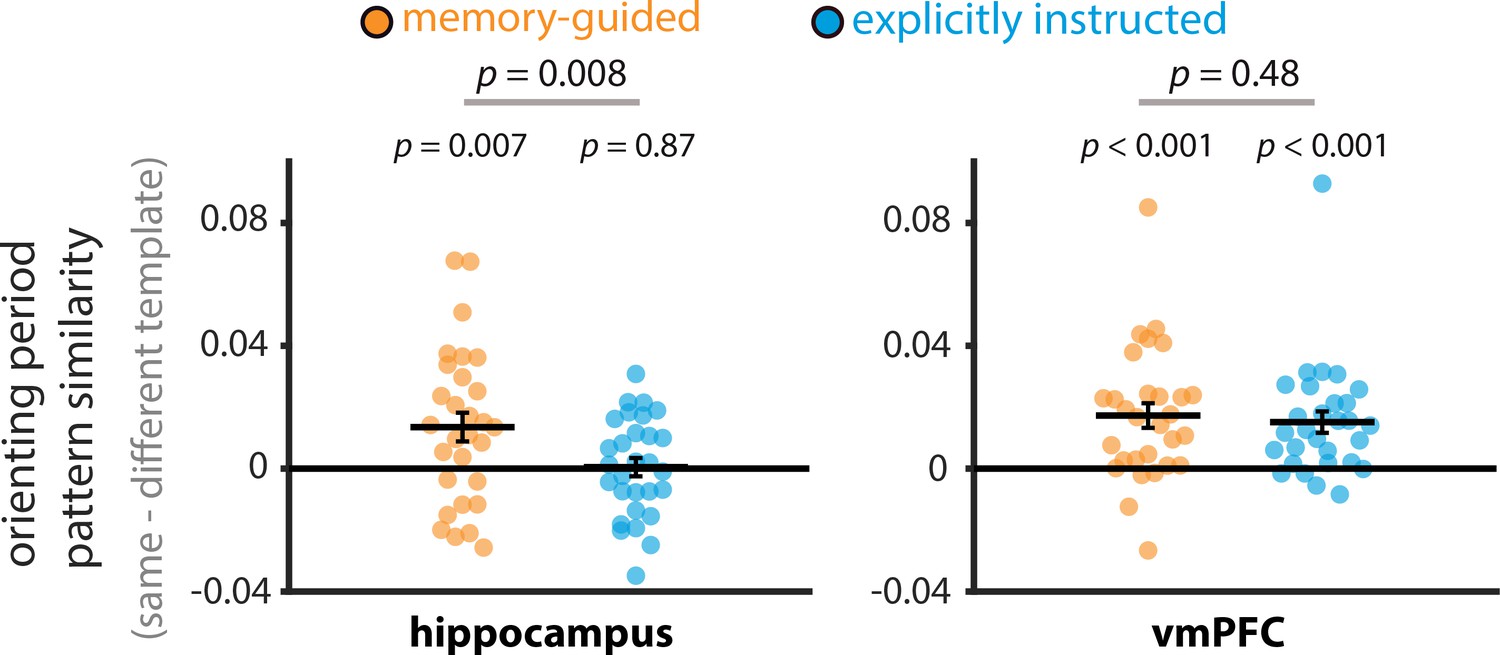
Figure 5 with 2 supplements
Representations of upcoming attentional states.
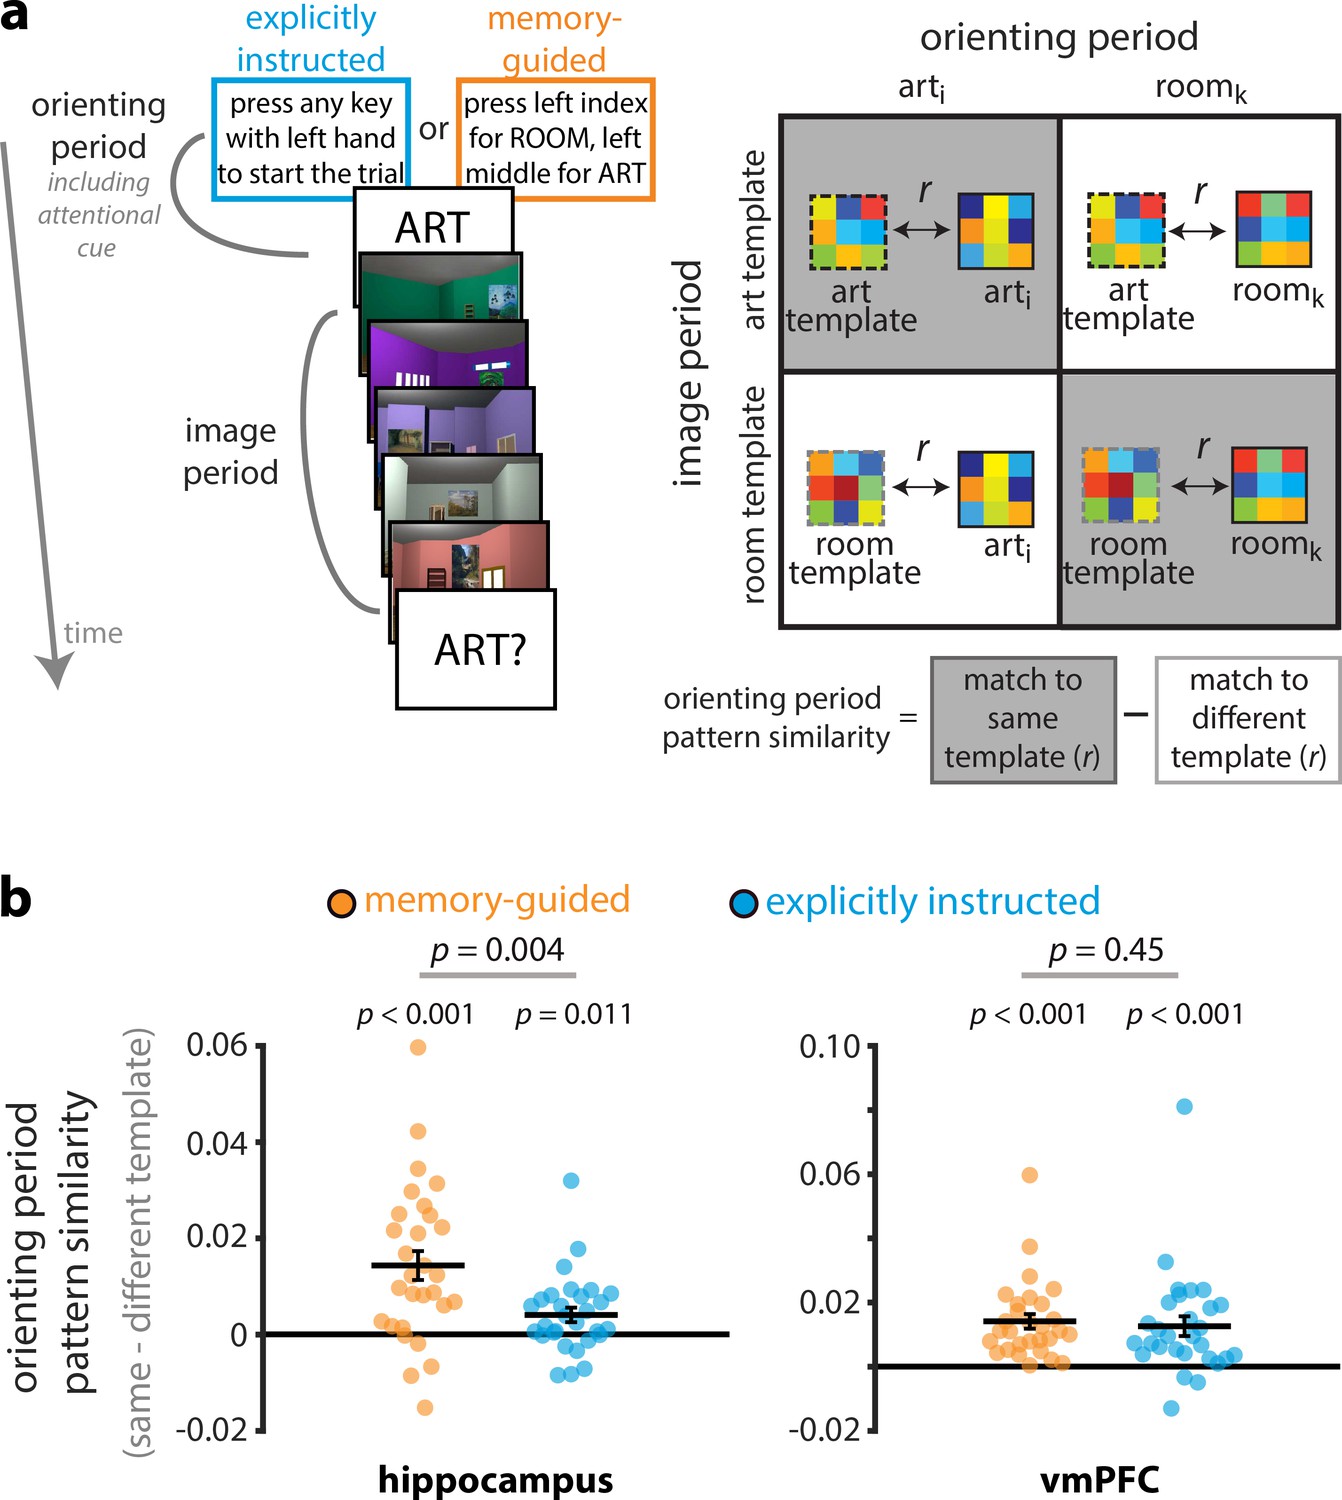
(A) Art and room attentional state ‘templates’ were created by averaging image period activity patterns across trials, separately for art and room attentional states. Next, the orienting period activity pattern for each trial was correlated with these templates to obtain match to same template (e.g., room orienting period to room template) and match to different template (e.g., room orienting period to art template) pattern similarity values. Lastly, the match-to-different-template correlation was subtracted from the match-to-same-template correlation to obtain a measure of preparatory attentional state representations. (B) Pattern similarity values are shown as difference scores between the match-to-same-template correlation and the match-to-different-template correlation: More positive values indicate more evidence for the upcoming attentional state, and more negative values indicate more evidence for the other attentional state. Both the hippocampus and vmPFC showed preparatory coding, with orienting period activity patterns resembling the upcoming attentional state more than the other attentional state. In the hippocampus, this preparatory coding was stronger for memory-guided vs explicitly instructed attention. Circles and solid lines show individual and average pattern similarities, respectively. The results are shown as Pearson correlations, but statistical tests were performed after applying the Fisher transformation. The error bars indicate standard error of the mean for the within-participant difference in attentional state match (i.e., match to same template – match to different template) for each task.
Figure 5—figure supplement 1
Representations of upcoming attentional states following ‘switch’ cue trials.
The analysis approach here is the same as that in Figure 5, except that only orienting periods following ‘switch’ cues were included in this analysis. Pattern similarity values are shown as difference scores between the match-to-same-template correlation and the match-to-different-template correlation: More positive values indicate more evidence for the upcoming attentional state, and more negative values indicate more evidence for the other attentional state (i.e., the attentional state on the previous trial). In the hippocampus, orienting period activity patterns resembled the upcoming attentional state more than the other (previous trial’s) attentional state, but only in the memory-guided task. A direct comparison revealed that preparatory coding (representation of the upcoming attentional state) was significantly stronger for memory-guided vs. explicitly instructed attention in the hippocampus. In vmPFC, preparatory coding was observed for both the memory-guided and explicitly instructed tasks, and this preparation did not differ in strength. Circles and solid lines show individual and average pattern similarities, respectively. The results are shown as Pearson correlations, but statistical tests were performed after applying the Fisher transformation. The error bars indicate standard error of the mean for the within-participant difference in attentional state match (i.e., match to same template – match to different template) for each task.
Figure 5—figure supplement 2

Whole-brain searchlight analysis of preparatory attentional states during the orienting period.
Results are shown for the memory-guided (left panel) and explicitly instructed (right panel) tasks. Only a few isolated voxels reached significance using family-wise error rate correction (p<0.05). Significant voxels are circled in green to aid their detection. No voxels survived correction for multiple comparisons in the contrast memory-guided > explicitly instructed attention.
Figure 6
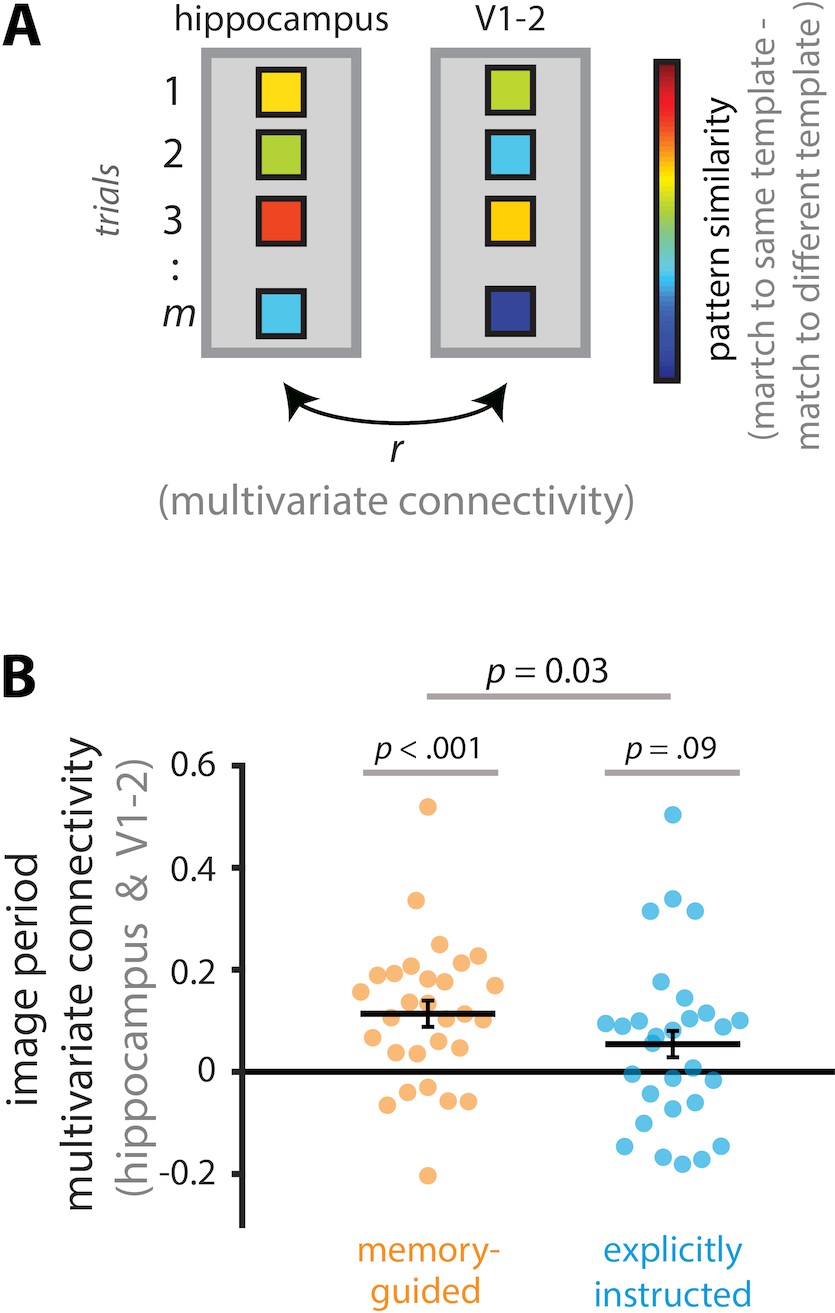
Multivariate connectivity between the hippocampus and V1-2.
(A) To calculate multivariate connectivity, we first created art and room attentional state ‘templates’ by averaging image period activity patterns across trials, separately for art and room attentional states. Second, these templates were correlated with activity patterns for individual trials, separately for same (i.e., art trial-art template, room trial-room template) and different (i.e., art trial-room template, room trial-art template) attentional states. Third, for each trial, we calculated a measure of multivariate attentional state ‘quality’ by subtracting its correlation with the different state template (e.g., art trial-room template) from its correlation with the same state template (e.g., art trial-art template). These steps were performed separately for the hippocampus and V1-2. Lastly, we computed multivariate connectivity between the hippocampus and V1-2 by correlating their multivariate attentional state ‘quality’ scores across all trials. (B) Multivariate connectivity was greater than zero for the memory-guided task, but not different from zero for the explicitly instructed task, and the difference between tasks was statistically significant. The results are shown as Pearson correlations, but statistical tests were performed after applying the Fisher transformation. Circles and solid lines show individual-participant and average multivariate connectivity values, respectively. The error bars indicate standard error of the mean for the within-participant task difference (i.e., memory-guided - explicitly instructed).
Figure 7

Regions of interest.
Hippocampus (red), V1-2 (blue), and vmPFC (orange) are shown in the right hemisphere of the brain, but all regions of interest are bilateral.
Additional files
Download links
A two-part list of links to download the article, or parts of the article, in various formats.
Downloads (link to download the article as PDF)
Open citations (links to open the citations from this article in various online reference manager services)
Cite this article (links to download the citations from this article in formats compatible with various reference manager tools)
Preparation for upcoming attentional states in the hippocampus and medial prefrontal cortex
eLife 9:e53191.
https://doi.org/10.7554/eLife.53191


