A tryparedoxin-coupled biosensor reveals a mitochondrial trypanothione metabolism in trypanosomes
- Biochemie-Zentrum der Universität Heidelberg, Germany
- Division of Redox Regulation, DKFZ-ZMBH Alliance, German Cancer Research Center (DKFZ), Germany
Figures
Scheme 1
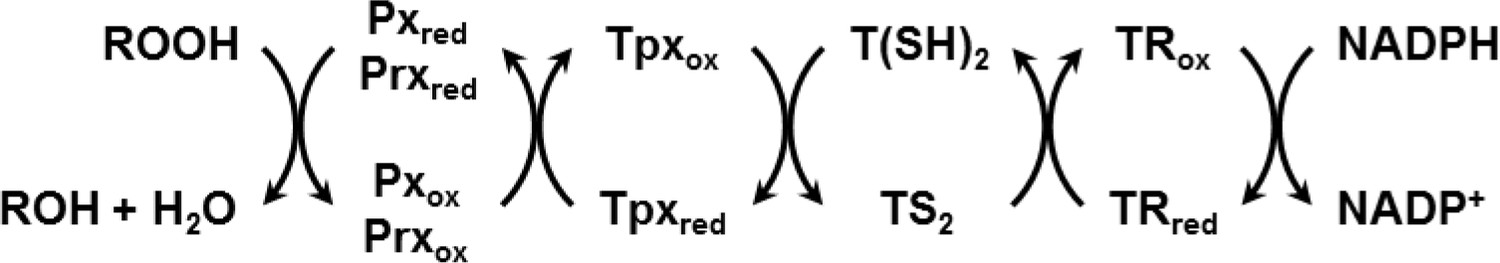
Reduction of hydroperoxides (ROOH) to the respective alcohol (ROH) by Px- and Prx-type enzymes in T. brucei.
The reduced form of the thiol peroxidases is restored by interaction with the Tpx/T(SH)2 couple followed by TR and NADPH as final electron source.
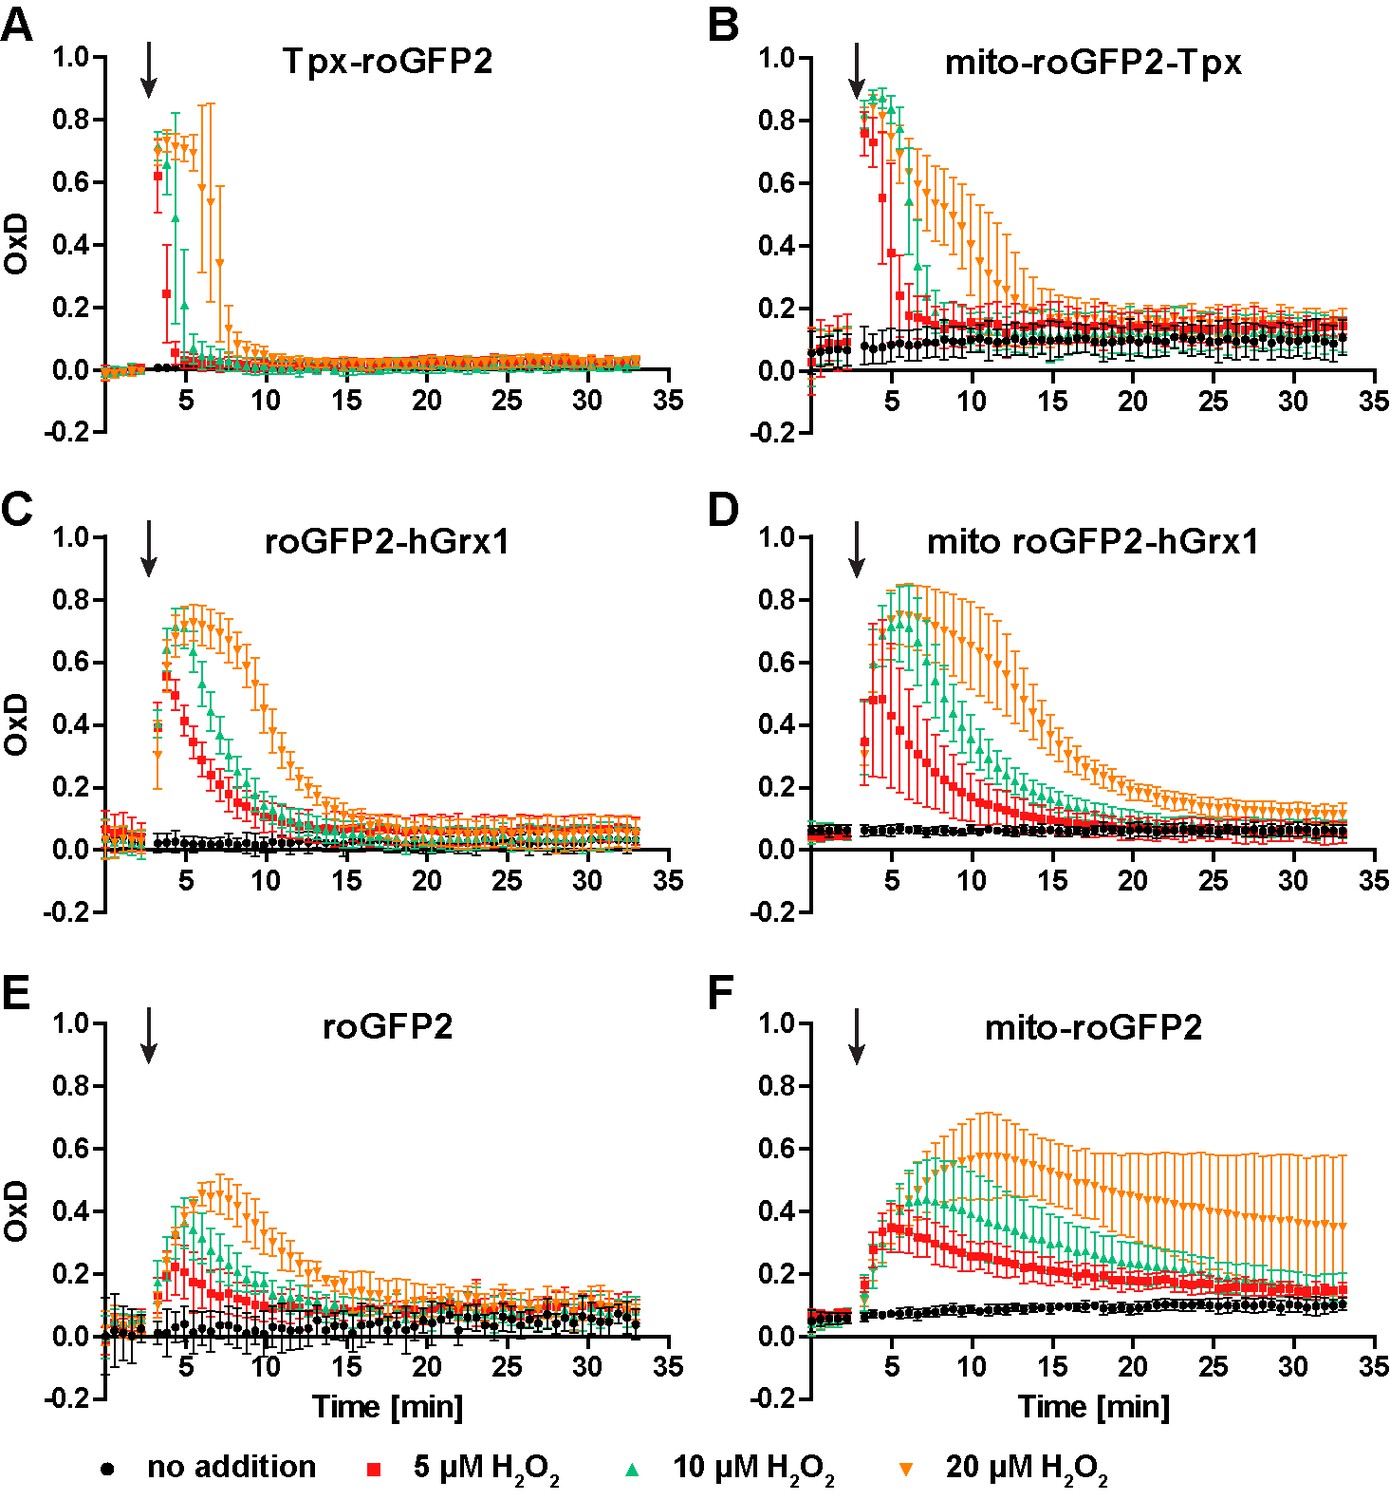
Figure 1 with 3 supplements
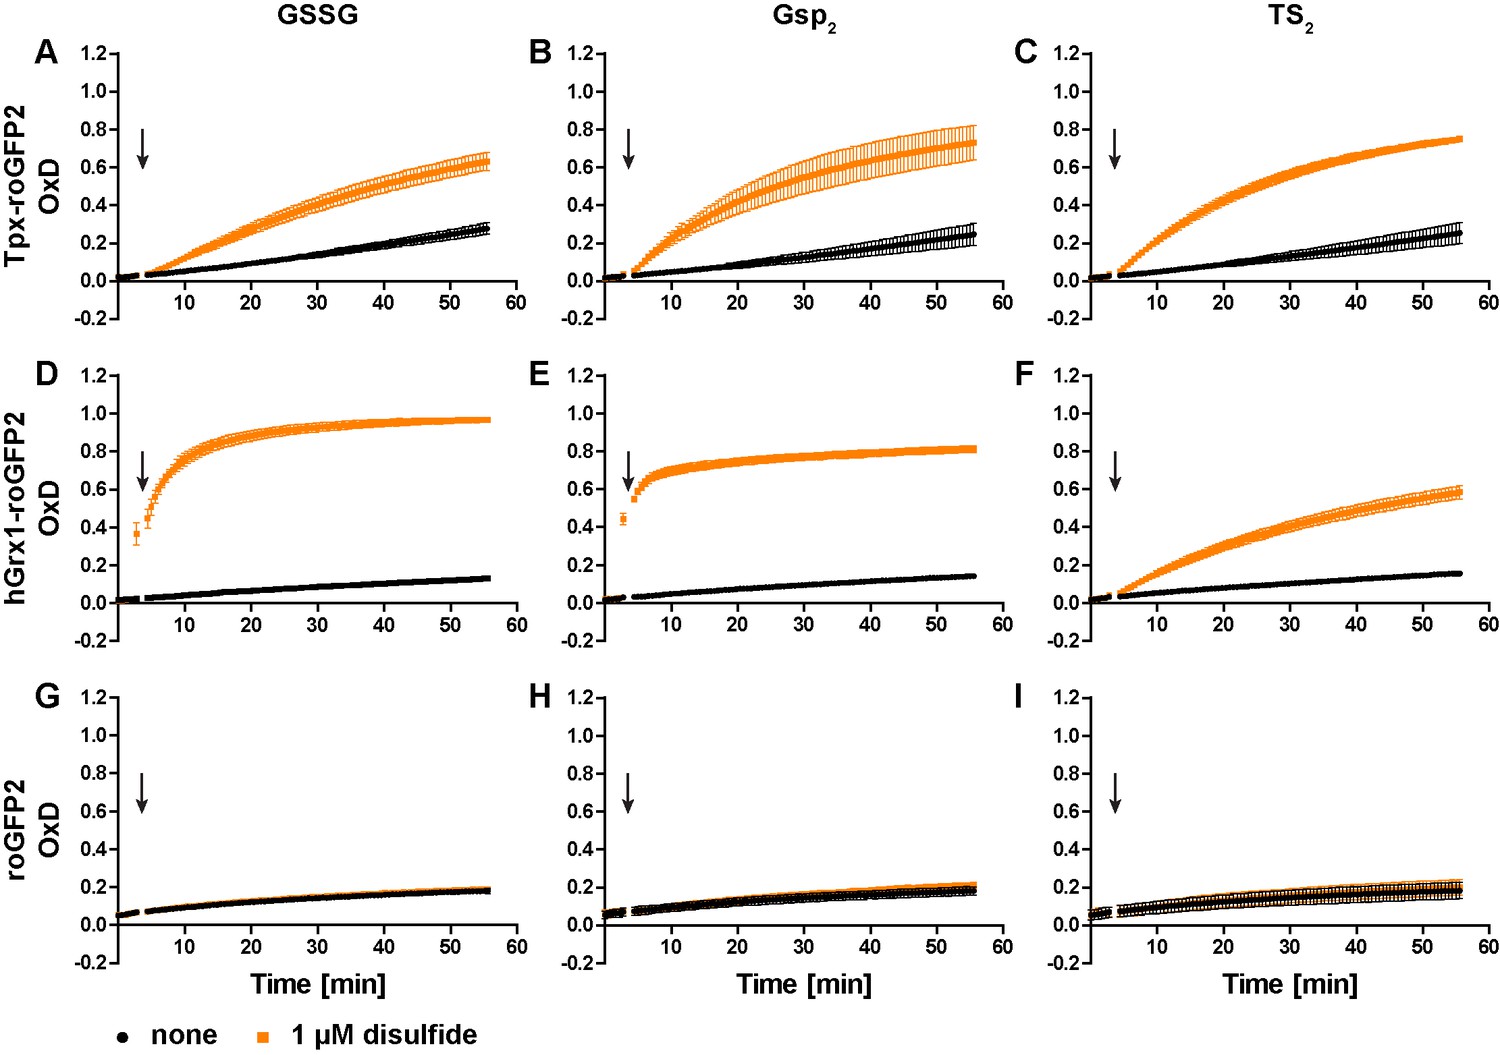
Oxidation of the recombinant roGFP2-based sensors by an equimolar concentration of GSSG, Gsp2, or TS2.
1 µM of pre-reduced recombinant (A-C) Tpx-roGFP2, (D–F) hGrx1-roGFP2, and (G–I) roGFP2 was subjected to plate reader-based fluorescence measurements. After 3 min, 1 µM (A, D, G) GSSG, (B, E, H) Gsp2, or (C, F, I) TS2 or the same volume of buffer (none) was added (arrow). The data represent the mean ± standard deviation (SD) of three independent experiments.
Figure 1—figure supplement 1
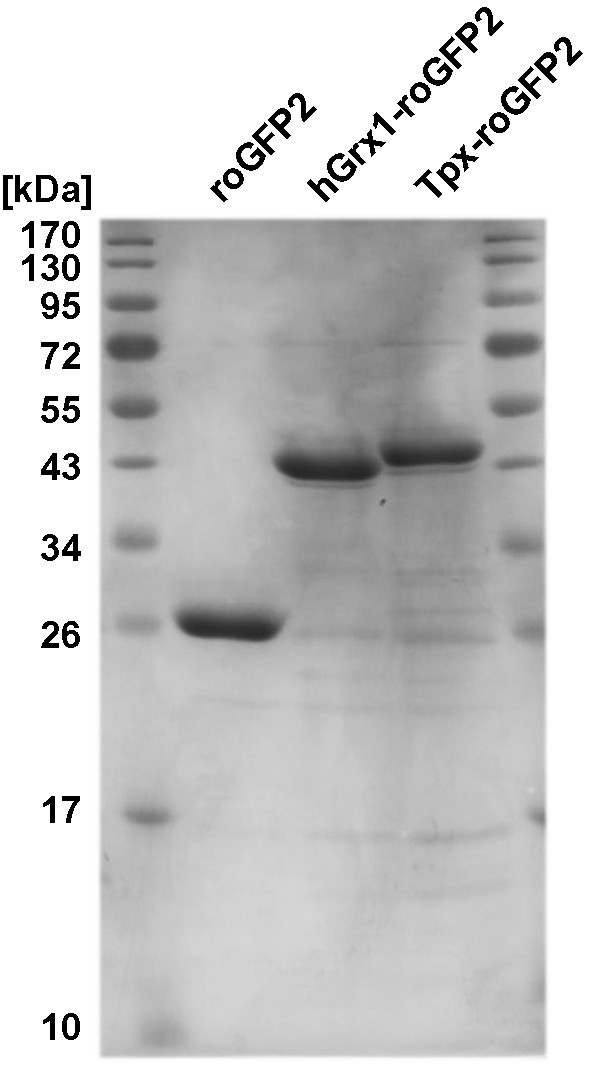
Purification of the recombinant sensors.
C-terminally His6-tagged Tpx-roGFP2, hGrx1-roGFP2 and roGFP2 were purified by affinity chromatography on a Ni2+ NTA column. The purity of the recombinant proteins was verified by subjecting 10 μg of Tpx-roGFP2 (46.2 kDa), hGrx1-roGFP2 (42.0 kDa), and roGFP2 (27.9 kDa) to SDS-PAGE on a 12% gel followed by Coomassie staining.
Figure 1—figure supplement 2
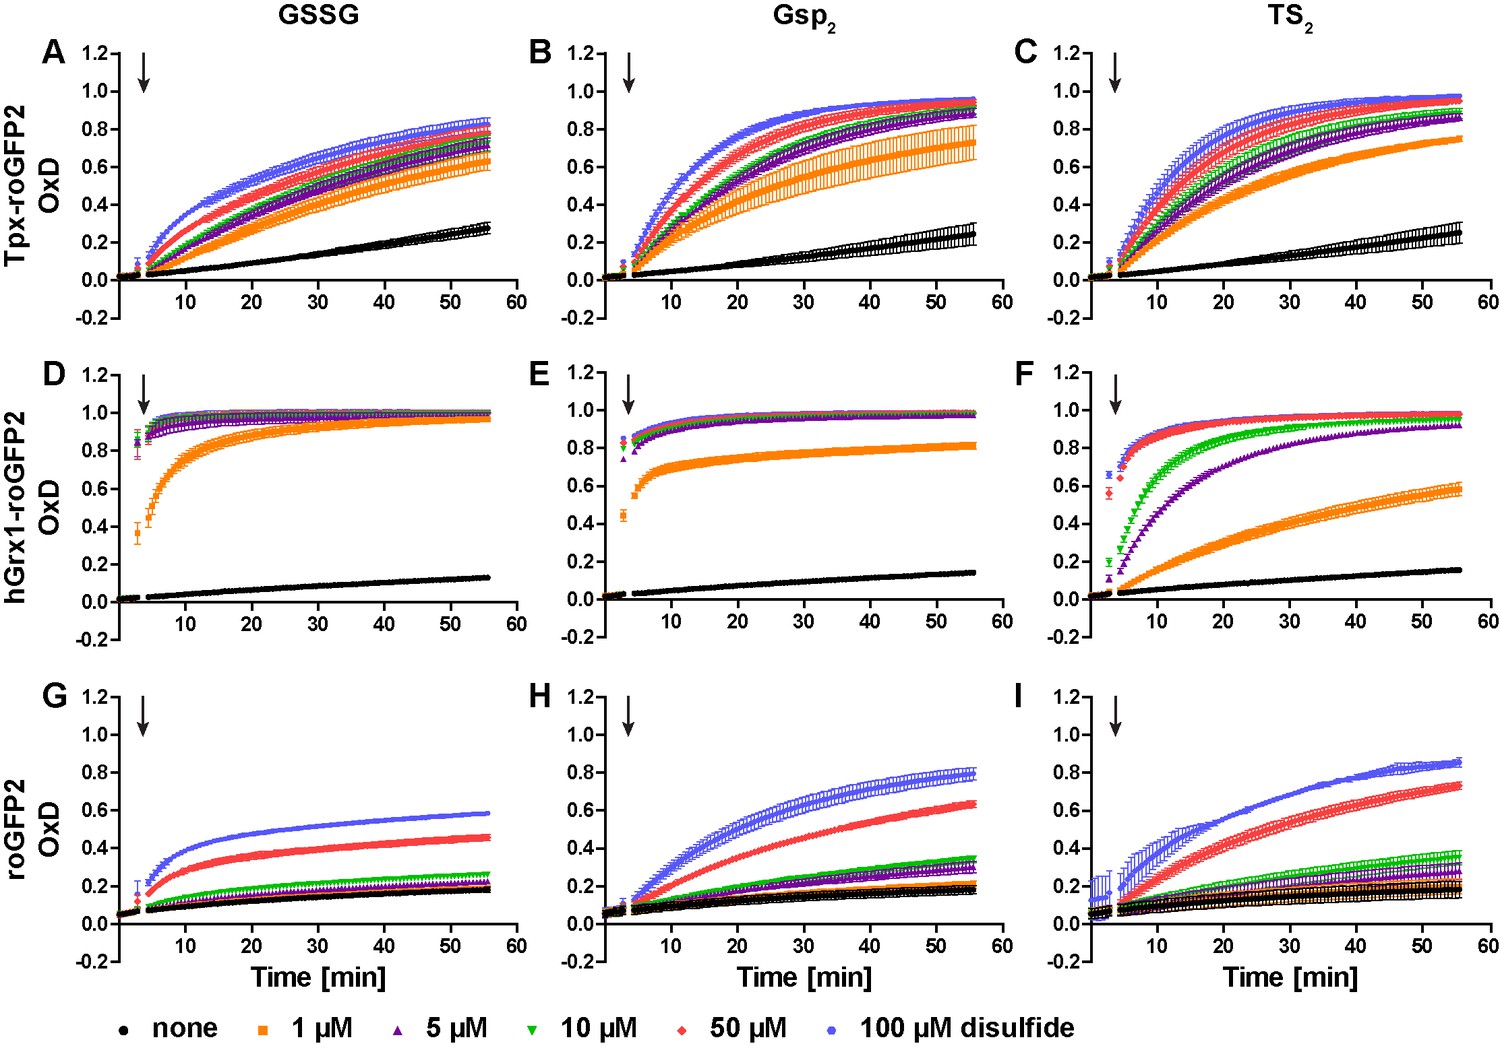
Oxidation of recombinant roGFP2-sensors by different concentrations of GSSG, Gsp2, and TS2.
Pre-reduced recombinant (A–C) Tpx-roGFP2, (D–F) hGrx1-roGFP2, and (G–I) roGFP2 were subjected to fluorescence measurements. After 3 min, different concentrations of (A, D, G) GSSG, (B, E, H) Gsp2, or (C, F, I) TS2 were added (arrow). The data are the mean ± SD of three independent experiments.
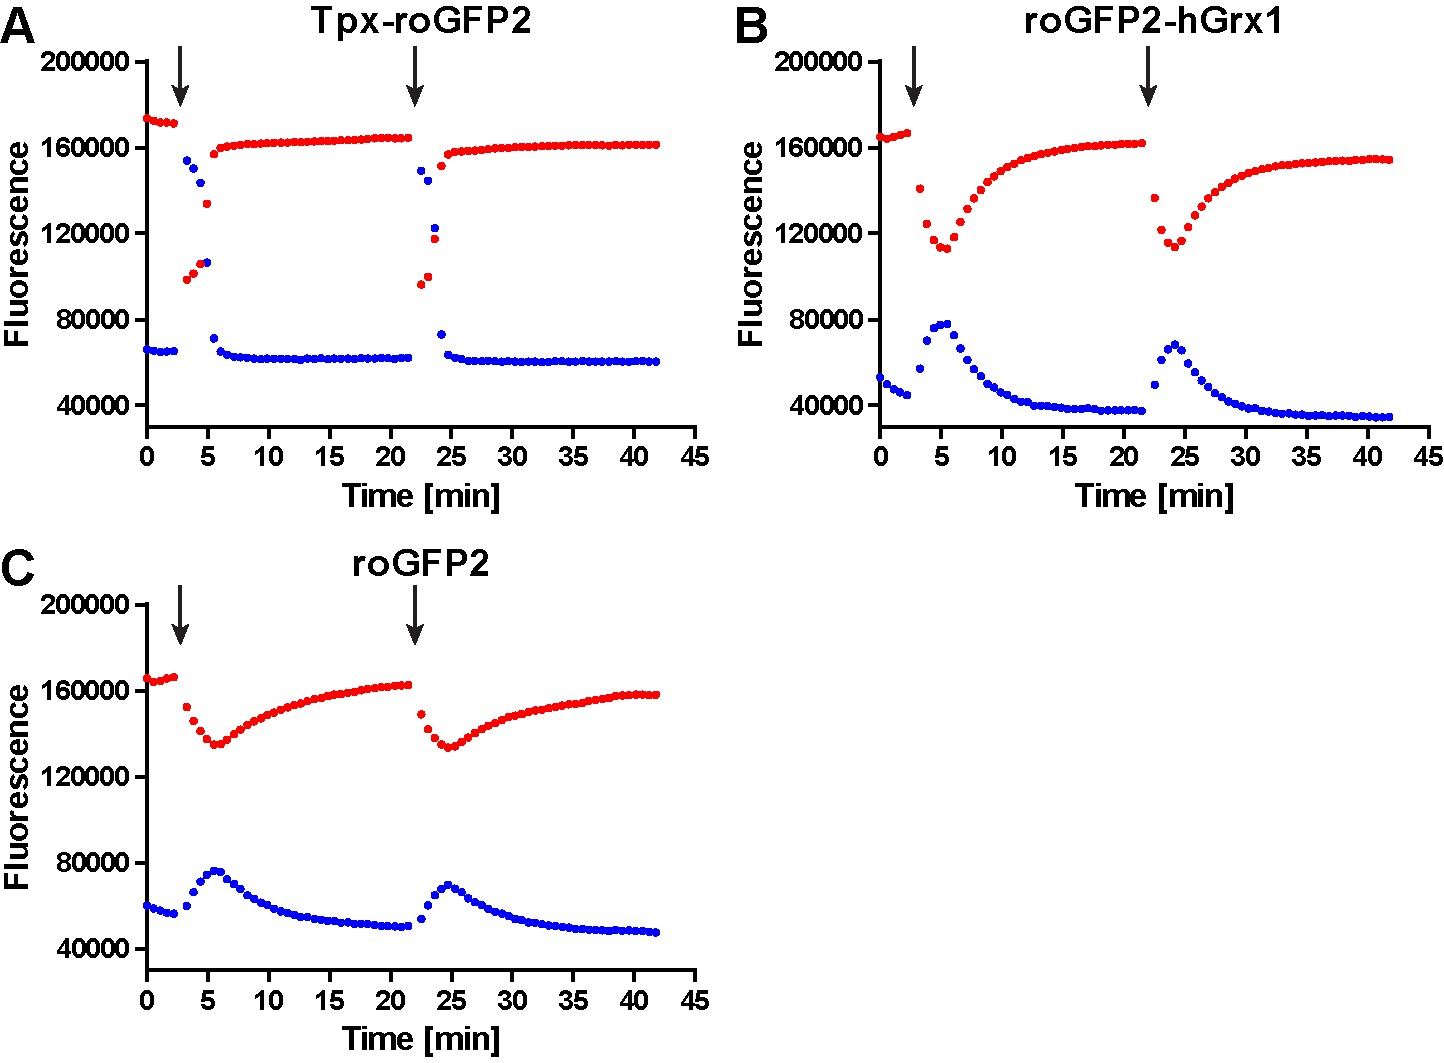
Figure 1—figure supplement 3
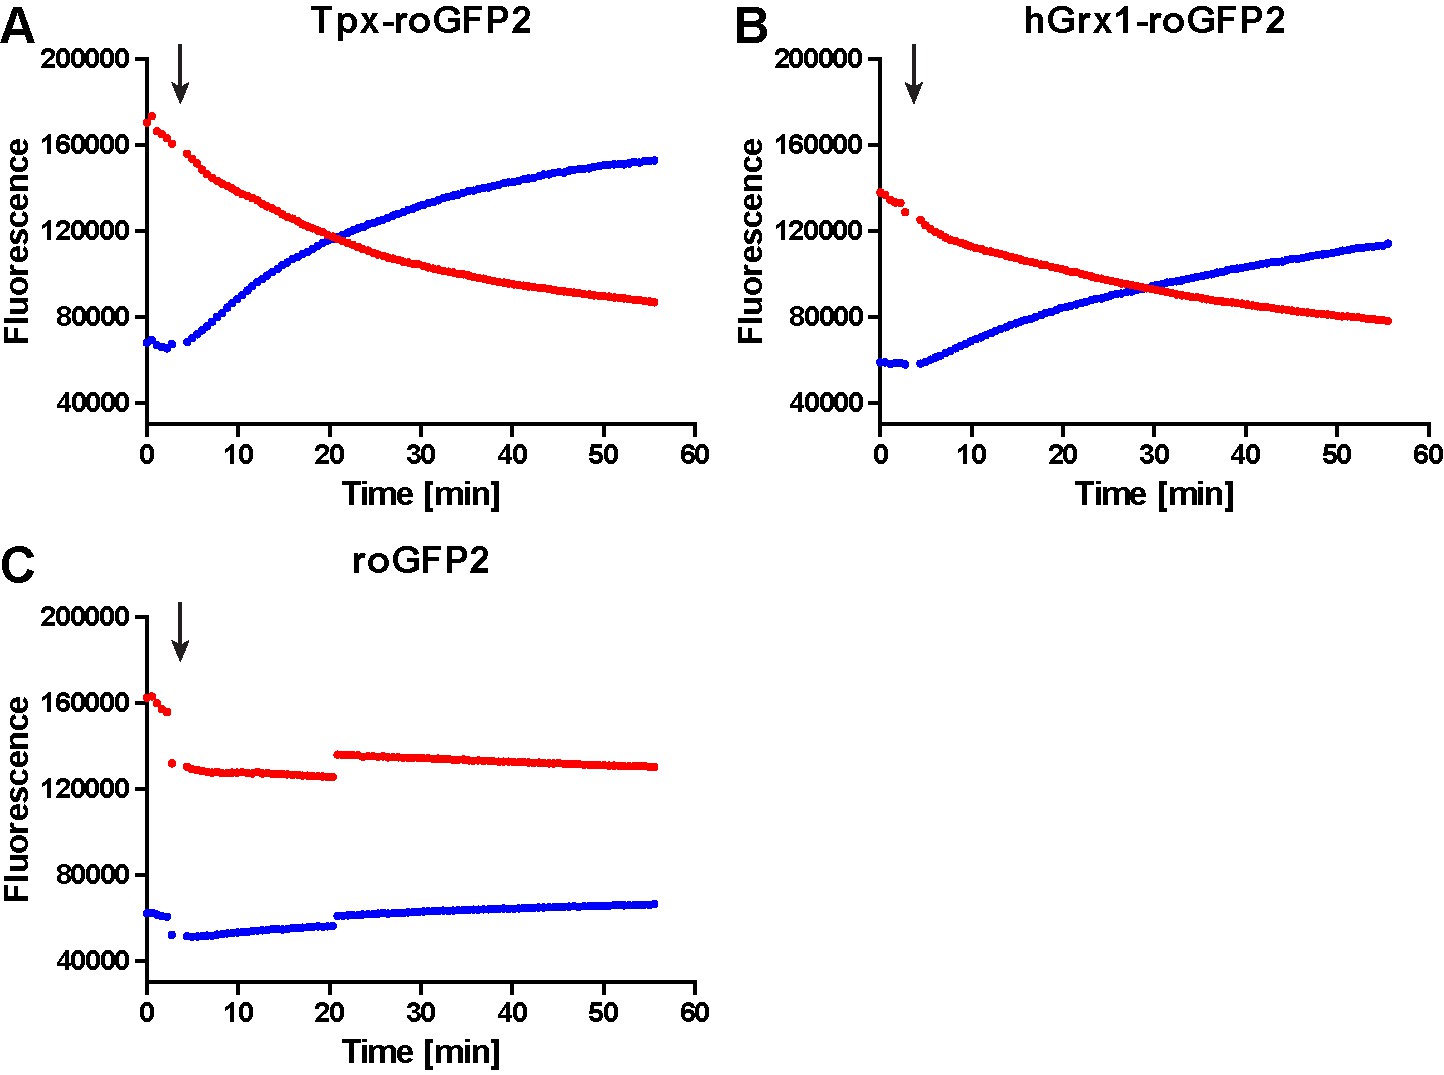
Unprocessed fluorescence intensity curves for 1 µM pre-reduced (A) Tpx-roGFP2, (B) hGrx1-roGFP2 and (C) roGFP2 treated with 1 µM TS2 (arrow).
The fluorescence was excited at 400 nm (blue) and 485 nm (red) and the emitted light detected at 520 nm.
-
Figure 1—figure supplement 3—source data 1
Original data for Figure 1—figure supplement 3.
- https://cdn.elifesciences.org/articles/53227/elife-53227-fig1-figsupp3-data1-v2.xlsx
Figure 2 with 4 supplements
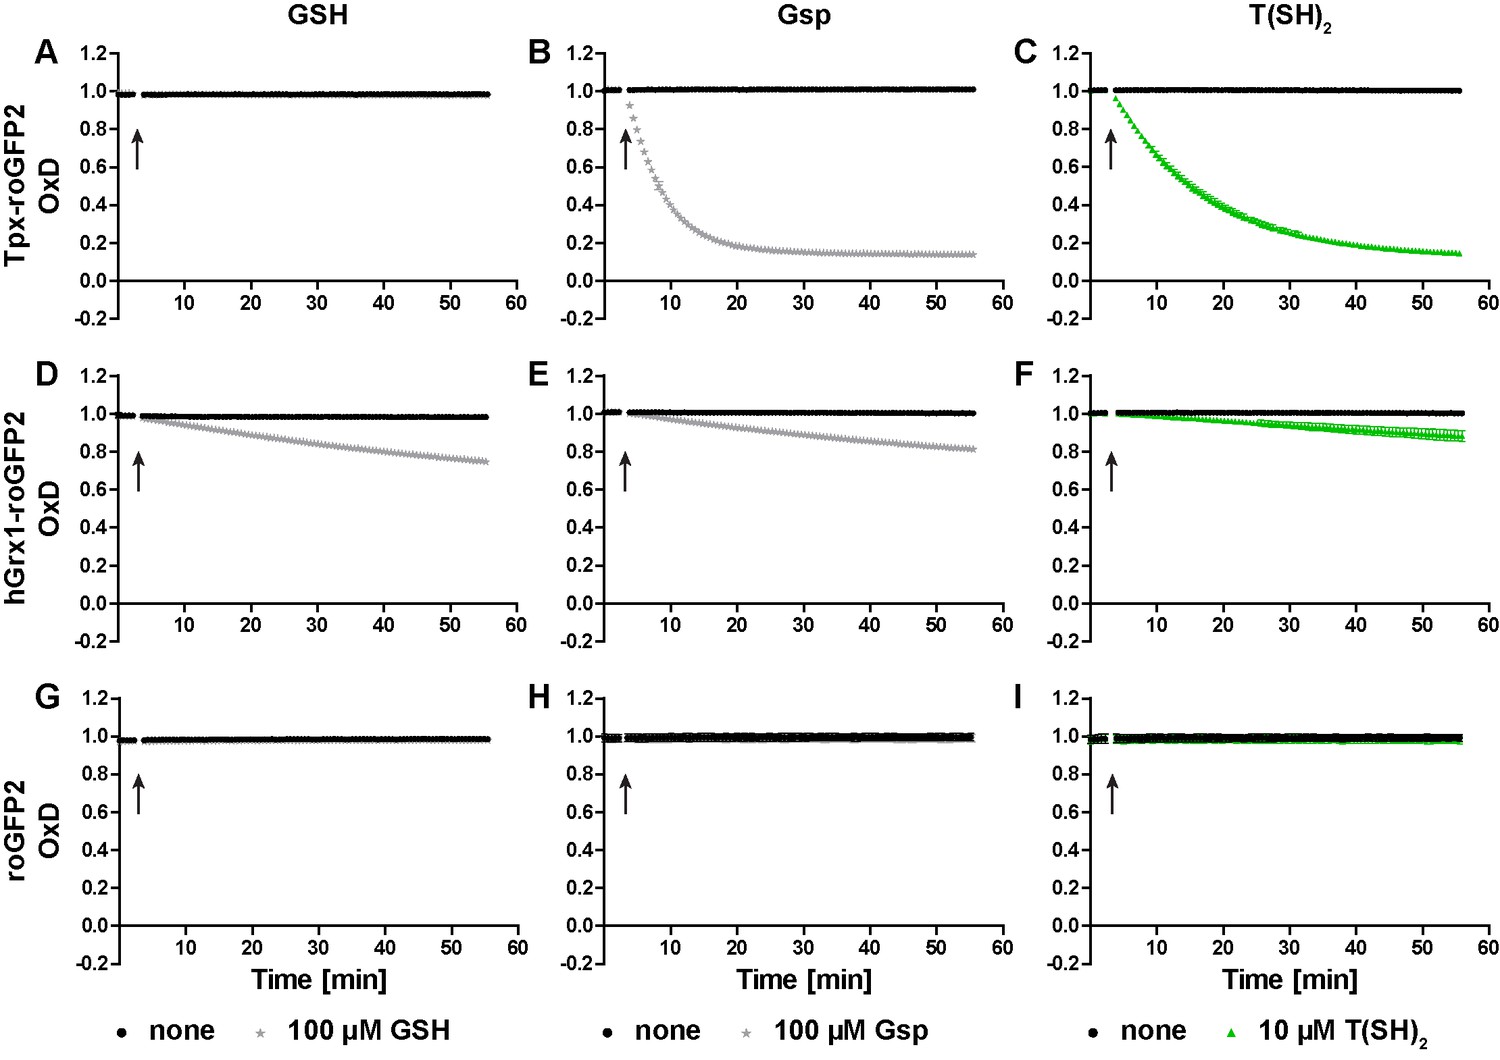
Reduction of the roGFP2-based sensors by GSH, Gsp, and T(SH)2.
(A–C) Tpx-roGFP2, (D–F) hGrx1-roGFP2, and (G–I) roGFP2 were subjected to fluorescence measurements. After 3 min, (A, D, G) 100 µM GSH, (B, E, H) 100 µM Gsp, (C, F, I) 10 µM T(SH)2, or the same volume of buffer (none) was added (arrow). To keep the thiols reduced during the experiment, the reaction mixtures were supplemented with (A, D, G) 5 mM NADPH and 300 mU hGR or (B, C, E, F, H, I) 0.5 mM NADPH and 30 mU TR. Data are the mean ± SD of three independent experiments except for the ones with 100 µM GSH, which are the mean of two measurements.
Figure 2—figure supplement 1
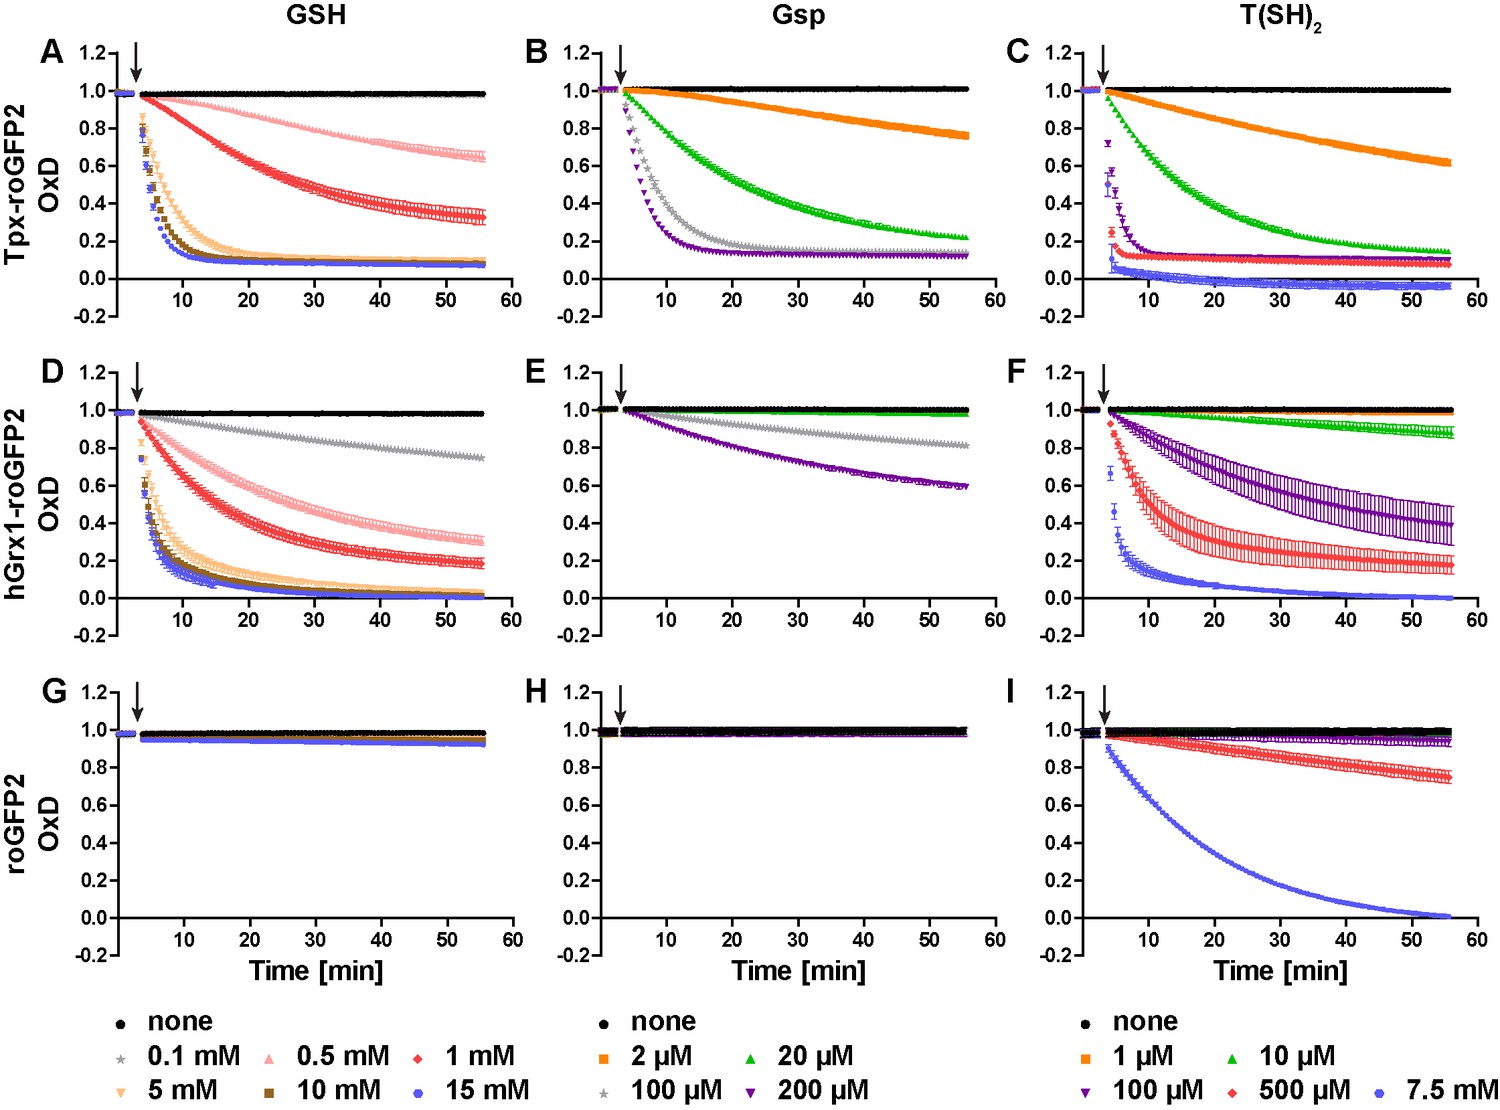
Reduction of roGFP2 sensors by different concentrations of GSH, Gsp, or T(SH)2.
(A–C) Tpx-roGFP2, (D–F) hGrx1-roGFP2, and (G–I) roGFP2 were subjected to fluorescence measurements. After 3 min, the indicated concentrations of (A, D, G) GSH, (B, E, H) Gsp, (C, F, I) T(SH)2, or the same volume of buffer (none) was added (arrow). The reaction mixtures contained (A, D, G) 5 mM NADPH and 300 mU hGR or (B, C, E, F, H, I) 0.5 mM NADPH and 30 mU TR except for the reaction with 7.5 mM T(SH)2 where 2.5 mM NADPH and 500 mU TR were used. Data represent the mean ± SD of three independent experiments. Values for 0.1 mM GSH are the mean of two measurements.
Figure 2—figure supplement 2
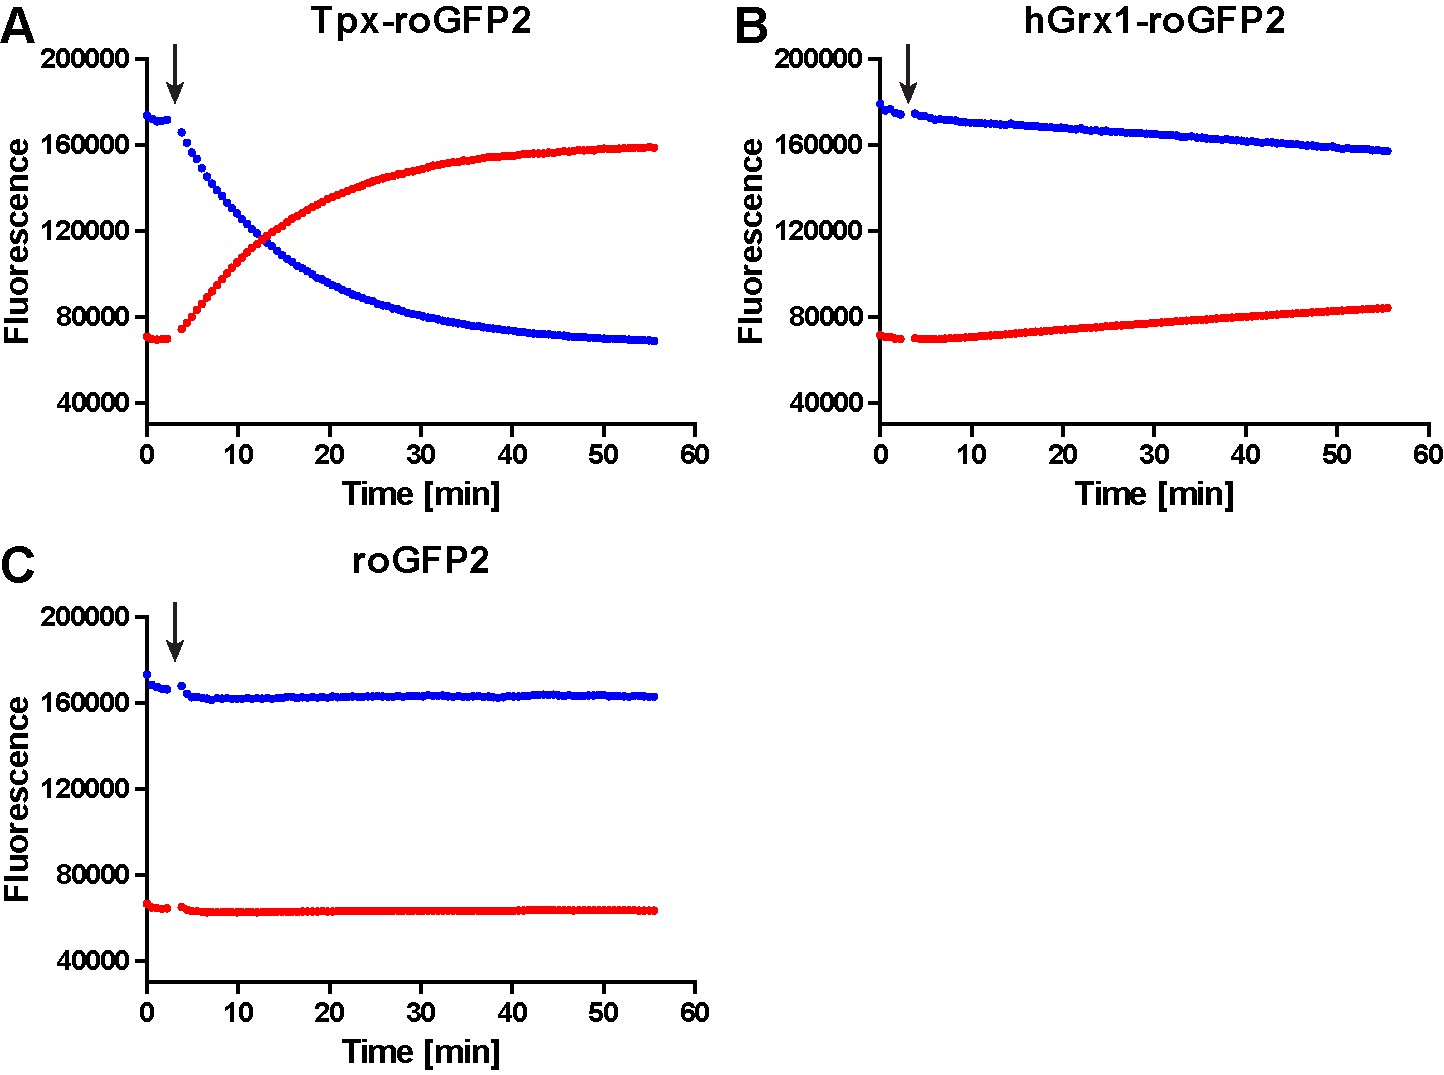
Unprocessed fluorescence intensity curves for 1 µM (A) Tpx-roGFP2, (B) hGrx1-roGFP2 and (C) roGFP2 treated with 10 µM T(SH)2 (arrow).
The fluorescence was excited at 400 nm (blue) and 485 nm (red) and the emitted light detected at 520 nm.
-
Figure 2—figure supplement 2—source data 1
Original data for Figure 2—figure supplement 2.
- https://cdn.elifesciences.org/articles/53227/elife-53227-fig2-figsupp2-data1-v2.xlsx
Figure 2—figure supplement 3
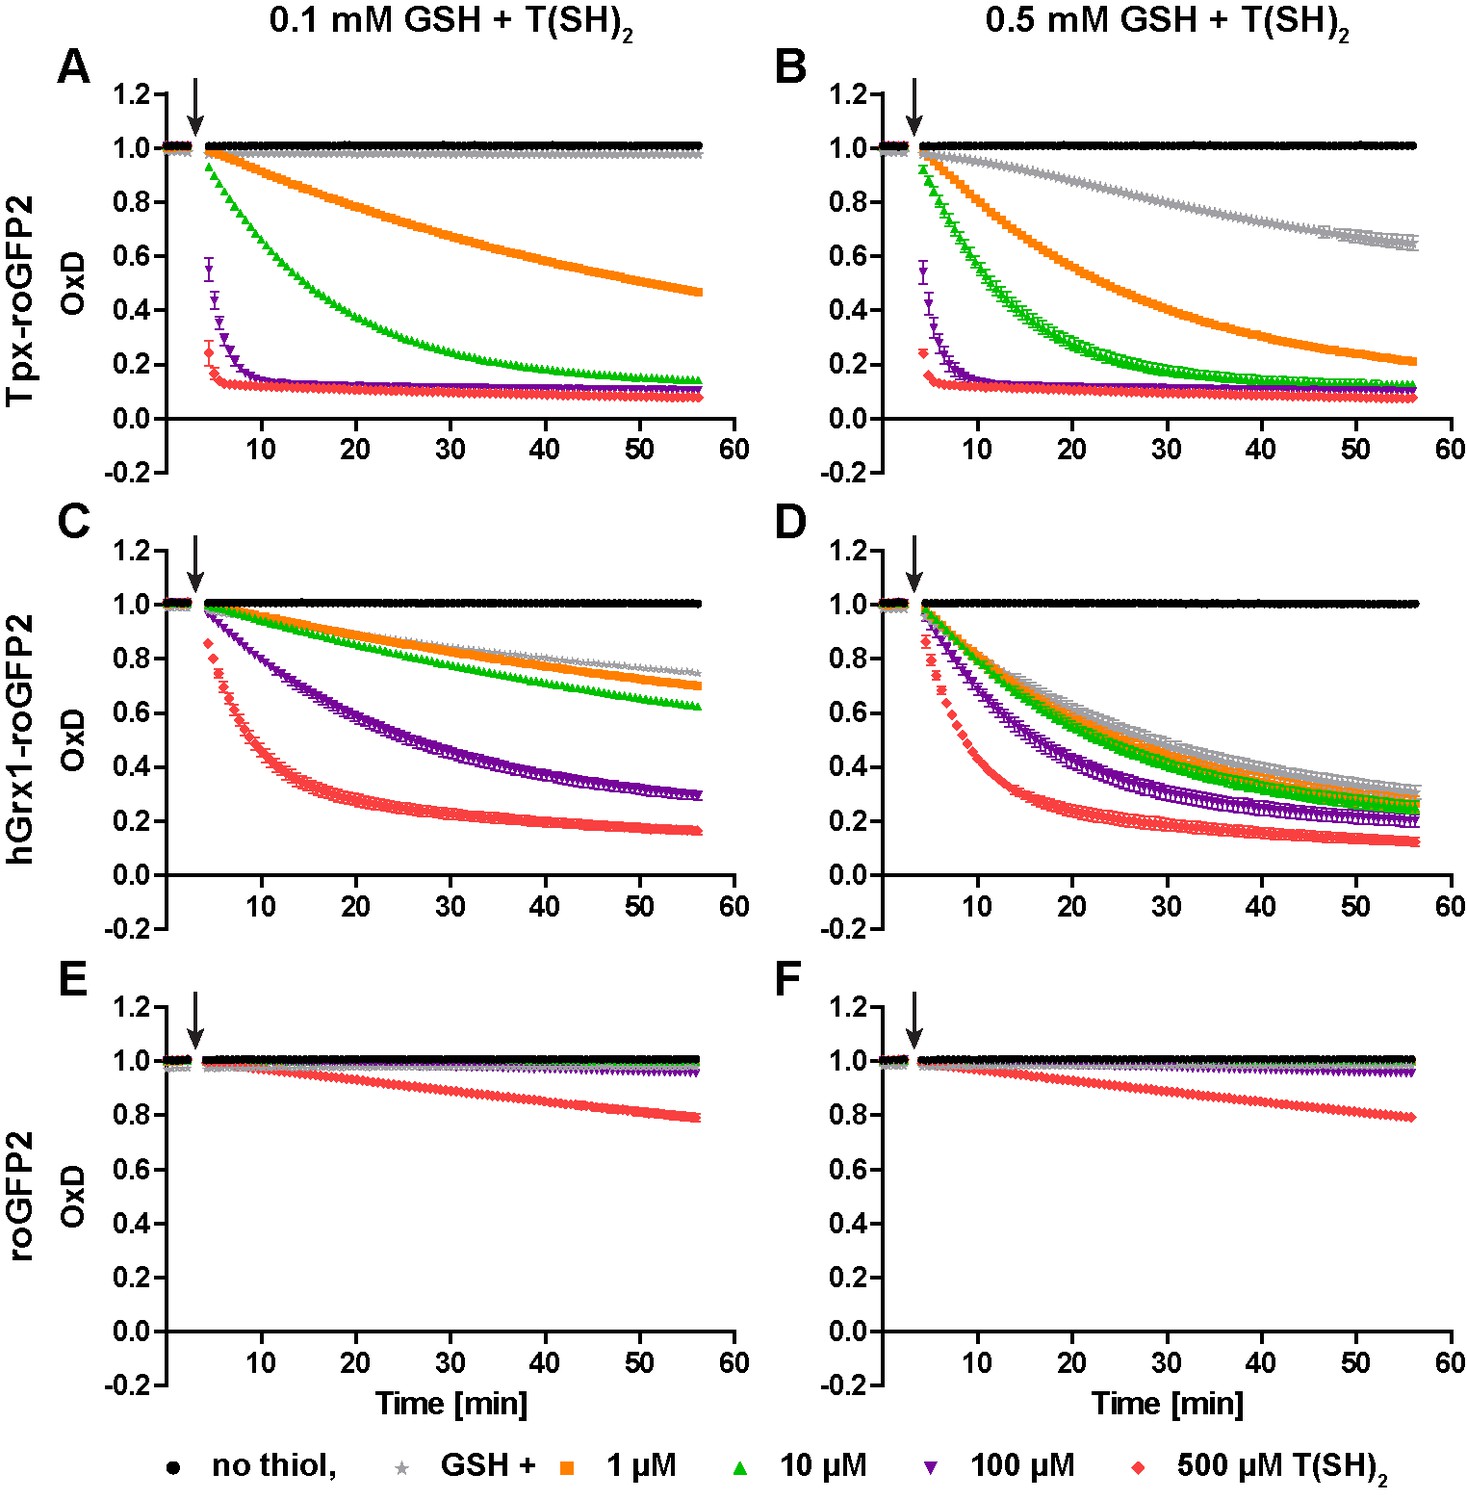
T(SH)2 and GSH act additively upon sensor reduction.
Recombinant (A, B) Tpx-roGFP2, (C, D) hGrx1-roGFP2, and (E, F) roGFP2 were treated with (A, C, E) 0.1 mM GSH or (B, D, F) 0.5 mM GSH plus different concentrations of T(SH)2. Both thiols were added 3 min after starting the measurement (arrow). The reaction mixtures contained 0.5 mM NADPH, 50 mU hGR and 30 mU TR to keep both thiols reduced. Data are the mean ± SD of three individual experiments. For comparison, the data for 0.1 mM and 0.5 mM GSH (gray stars) from Figure 2—figure supplement 1 were included.
Figure 2—figure supplement 4
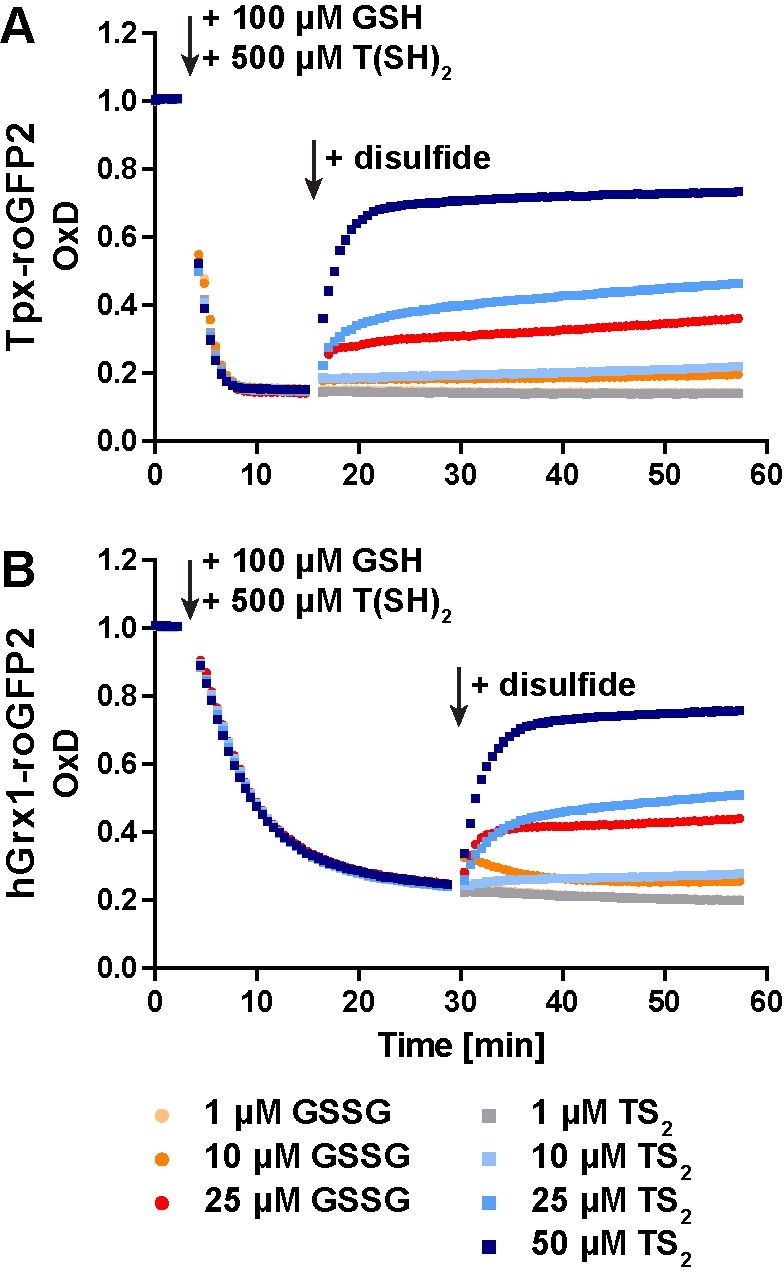
In the presence of GSH and T(SH)2, Tpx-roGFP2 and hGrx1-roGFP2 are preferably oxidized by TS2 compared to GSSG.
As stock solutions of GSH and T(SH)2 contain about 1% and 10% of the disulfide form, all assays were supplemented with 100 μM NADPH as well as 100 mU of TR and hGR. Thus, the final disulfide concentration in the reaction may be slightly lower. However, lower NADPH concentrations were not applicable. In the presence of 50 μM NADPH, the sensors were only reduced to an OxD of 0.7 and reacted marginally upon addition of the disulfides. (A) Tpx-roGFP2 and (B) hGrx1-roGFP2 were mixed with TR, hGR, and NADPH and subjected to fluorescence measurements. After 3 min, 100 μM GSH and 500 μM T(SH)2 were added. After (A) 15 min or (B) 29 min the sensors had reached a constant lowest OxD, and different concentrations of GSSG and TS2 were added. The data are the mean of two experiments.
Figure 3 with 4 supplements
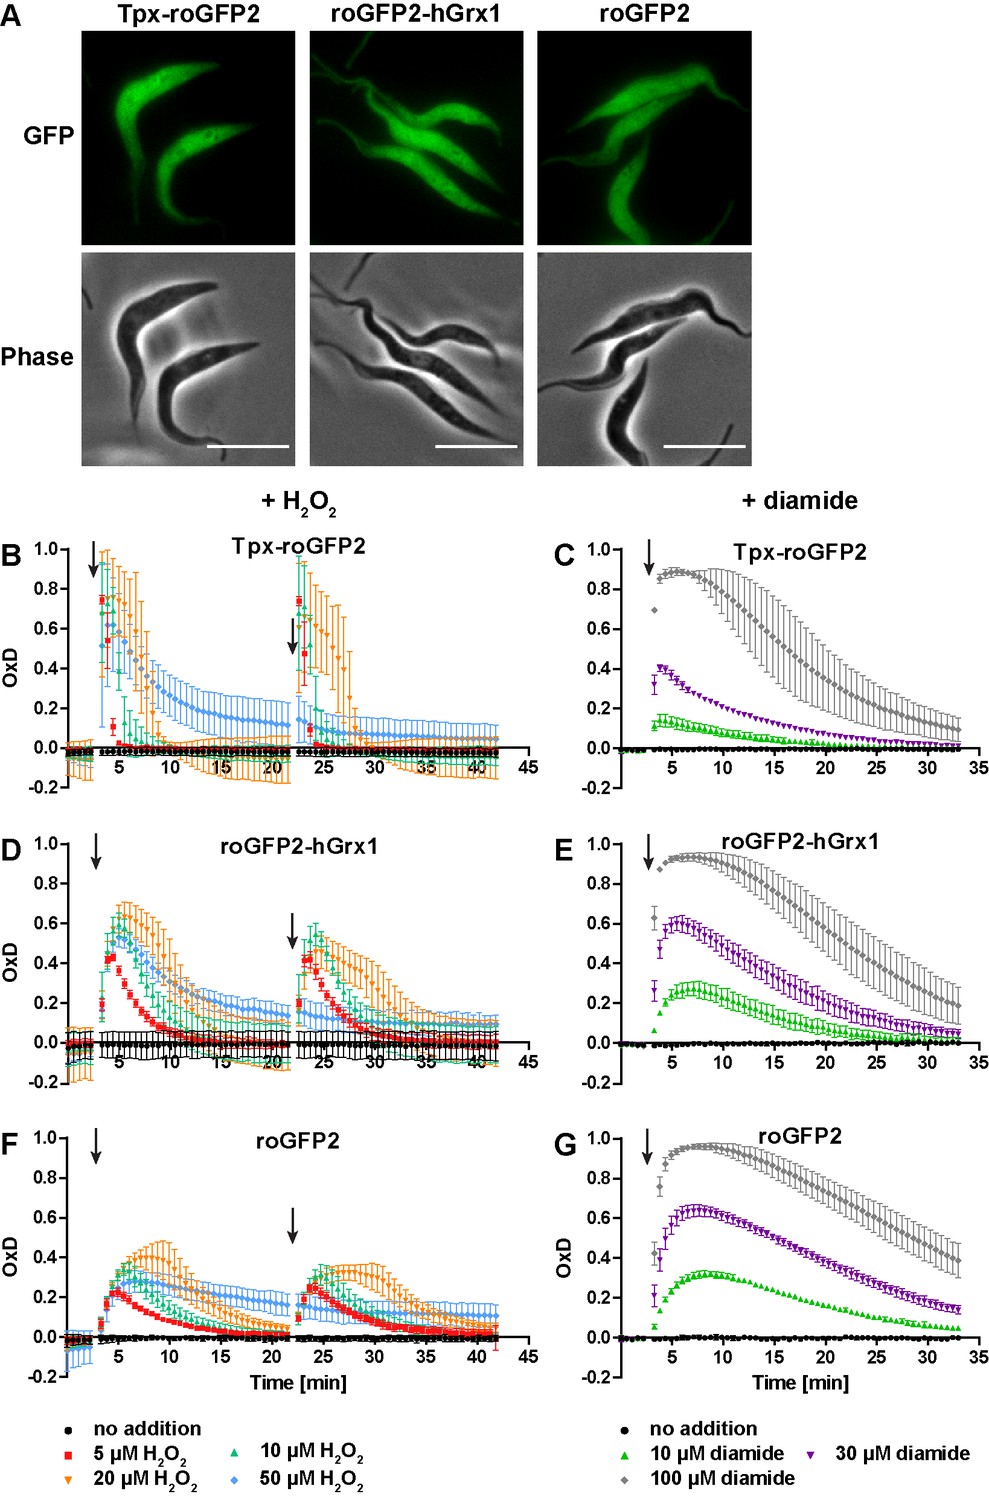
The cytosolic sensors are fully reduced and get reversibly oxidized upon treating the parasites with H2O2 or diamide.
(A) Live cell imaging of Tpx-roGFP2-, roGFP2-hGrx1-, and roGFP2-expressing PC T. brucei. Phase: phase contrast image. Scale bar: 10 µm. (B–G) 1 × 10⁷ PC T. brucei constitutively expressing (B, C) Tpx-roGFP2, (D, E) roGFP2-hGrx1, or (F, G) roGFP2 in the cytosol were analyzed in the plate reader based assay. (B, D, F) After 3 min and 22 min, the indicated concentration of H2O2 was injected (arrow). (C, E, G) Diamide was added after 3 min (arrow). The data are the mean ± SD of at least three individual experiments.
Figure 3—figure supplement 1
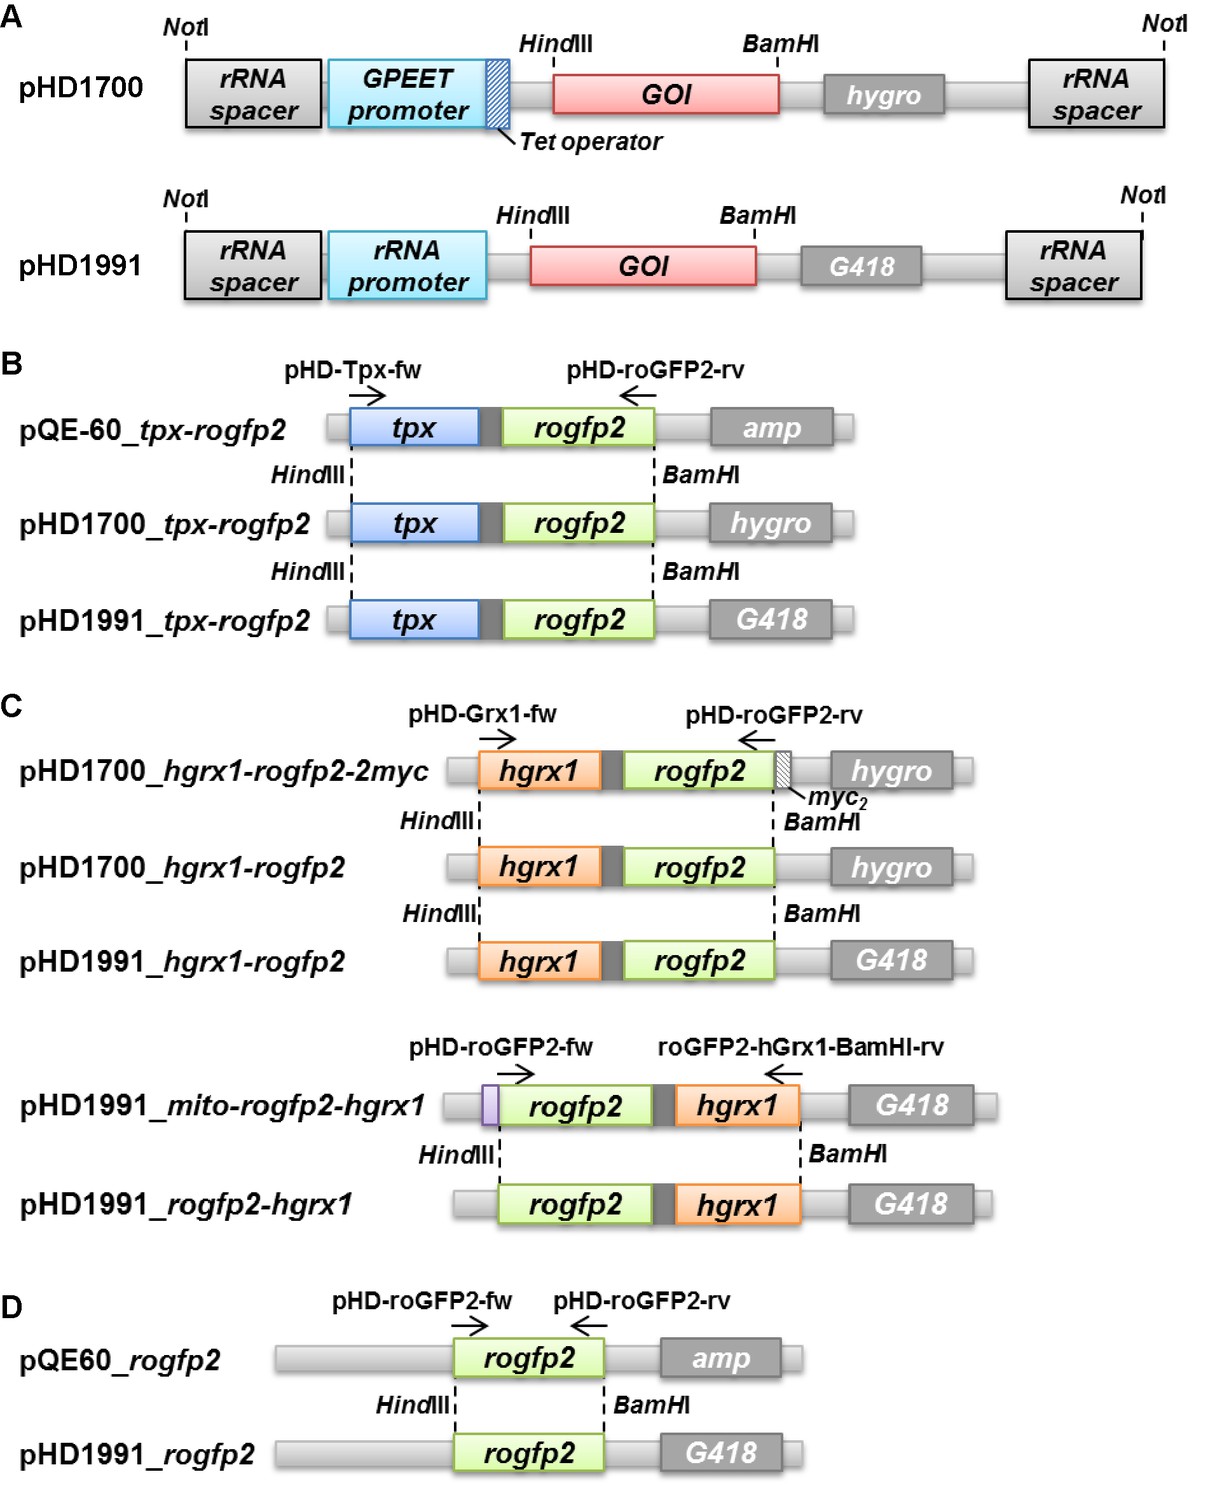
Generation of PC T. brucei cell lines that express tag-free roGFP2 sensors in the cytosol.
(A) pHD1700 and pHD1991 vectors allow the Tet-inducible and constitutive expression of a gene in T. brucei, respectively. After linearization with NotI, the plasmids integrate in the genomic rRNA locus. GPEET promoter, procyclin promoter. Tet operator, tetracycline operator. rRNA promoter, polymerase I promoter. GOI, gene of interest. (B, D) The tpx-rogfp2 and rogfp2 sequences were obtained from the respective pQE-60 plasmid. (C) hgrx1-rogfp2 without the C-terminal myc2-tag was amplified from the pHD1700_hgrx1-rogfp2-2myc vector. The rogfp2-hgrx1 sequence with inverted domain order was amplified with the pHD1991_mito-rogfp2-hgrx1 plasmid as template (see Figure 7—figure supplement 1). All amplicons were ligated into the pHD1991 vector yielding pHD1991_tpx-rogfp2, pHD1991_hgrx1-rogfp2, pHD1991_rogfp2-hgrx1, and pHD1991_rogfp2. Hygro, G418, and amp are hygromycin B, geneticin disulfate, and ampicillin resistance genes, respectively. The arrows indicate the binding sites of the primers used for PCR amplification (Supplementary file 2). Restriction sites used for ligation of the sequences into the different plasmids are marked by dashed lines. For details, see Materials and methods.
Figure 3—figure supplement 2
Unprocessed fluorescence intensity curves for cells expressing (A) Tpx-roGFP2, (B) roGFP2-hGrx1 and (C) roGFP2 that were exposed twice to 10 µM H2O2 (arrows).
The fluorescence was excited at 400 nm (blue) and 485 nm (red) and the emitted light detected at 520 nm.
-
Figure 3—figure supplement 2—source data 1
Original data for Figure 3—figure supplement 2.
- https://cdn.elifesciences.org/articles/53227/elife-53227-fig3-figsupp2-data1-v2.xlsx
Figure 3—figure supplement 3
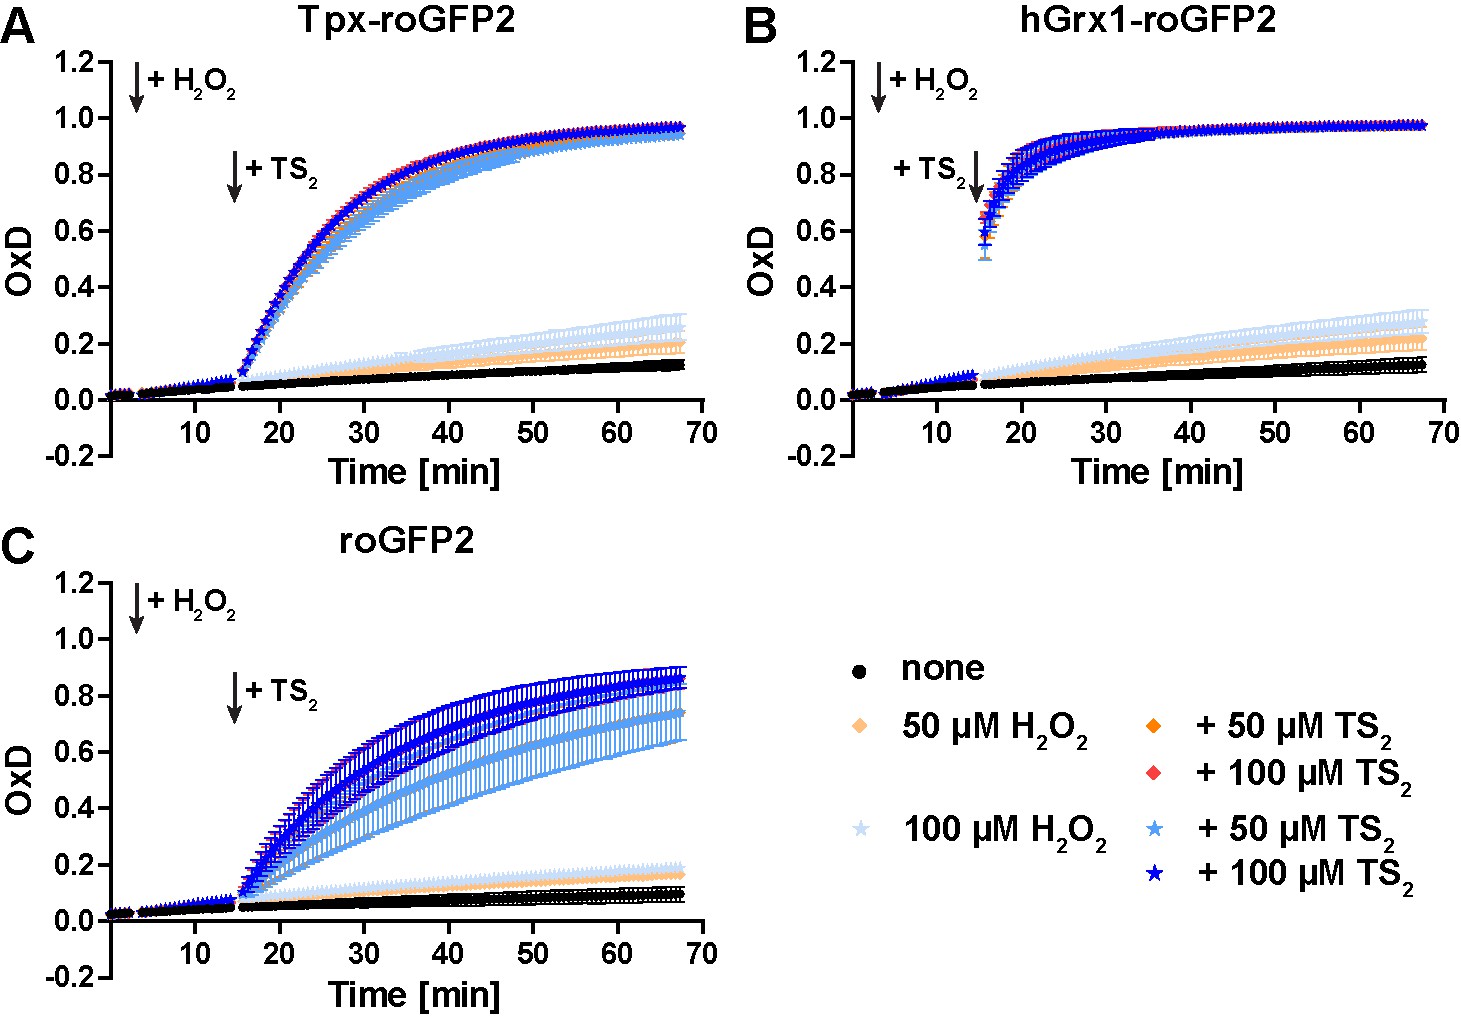
Treatment of recombinant roGFP2 sensors with hydrogen peroxide followed by TS2.
Pre-reduced recombinant (A) Tpx-roGFP2, (B) hGrx1-roGFP2 and (C) roGFP2 were subjected to plate-reader based fluorescence measurements. After 3 min, H2O2 was added and after another 11 min, TS2 was added (arrows). The data are the mean ± SD of three independent experiments.
Figure 3—figure supplement 4
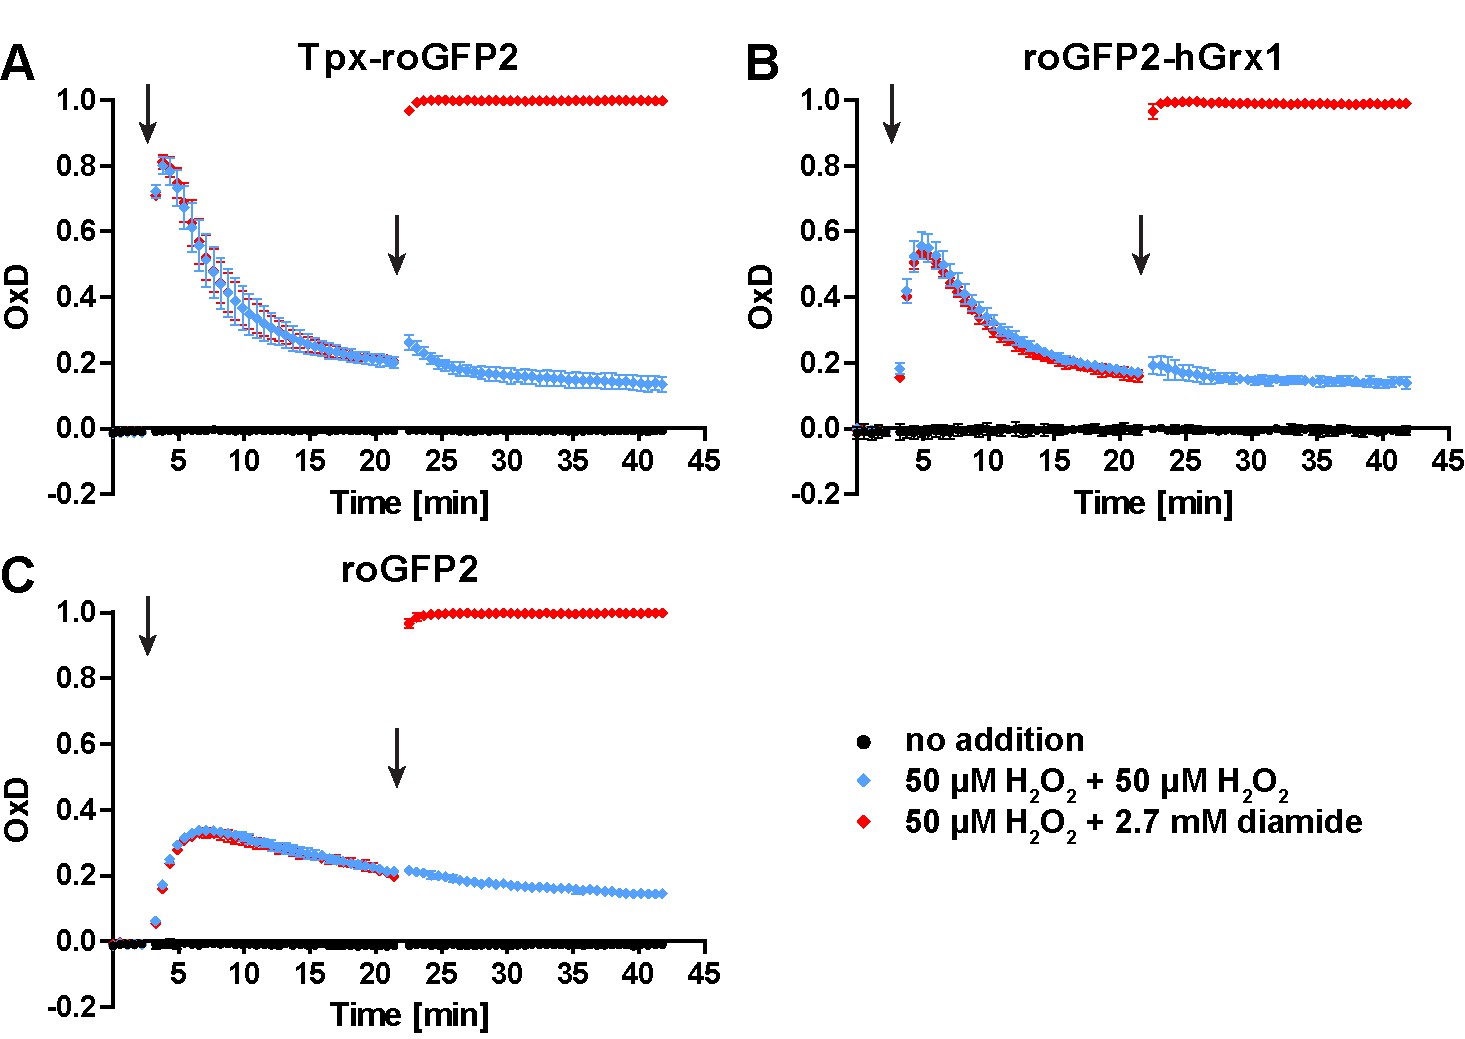
In PC T. brucei treated with 50 μM H2O2, the sensors still respond to a diamide stress.
Parasites expressing cytosolic (A) Tpx-roGFP2, (B) roGFP2-hGrx1, or (C) roGFP2 were subjected to plate reader-based fluorescence measurements. After 3 min, the cells were challenged with H2O2 followed by a second pulse of either H2O2 or diamide after 22 min (arrows). The time-dependent oxidation and re-reduction was followed. Data represent the mean ± SD of three independent experiments.
Figure 4 with 1 supplement
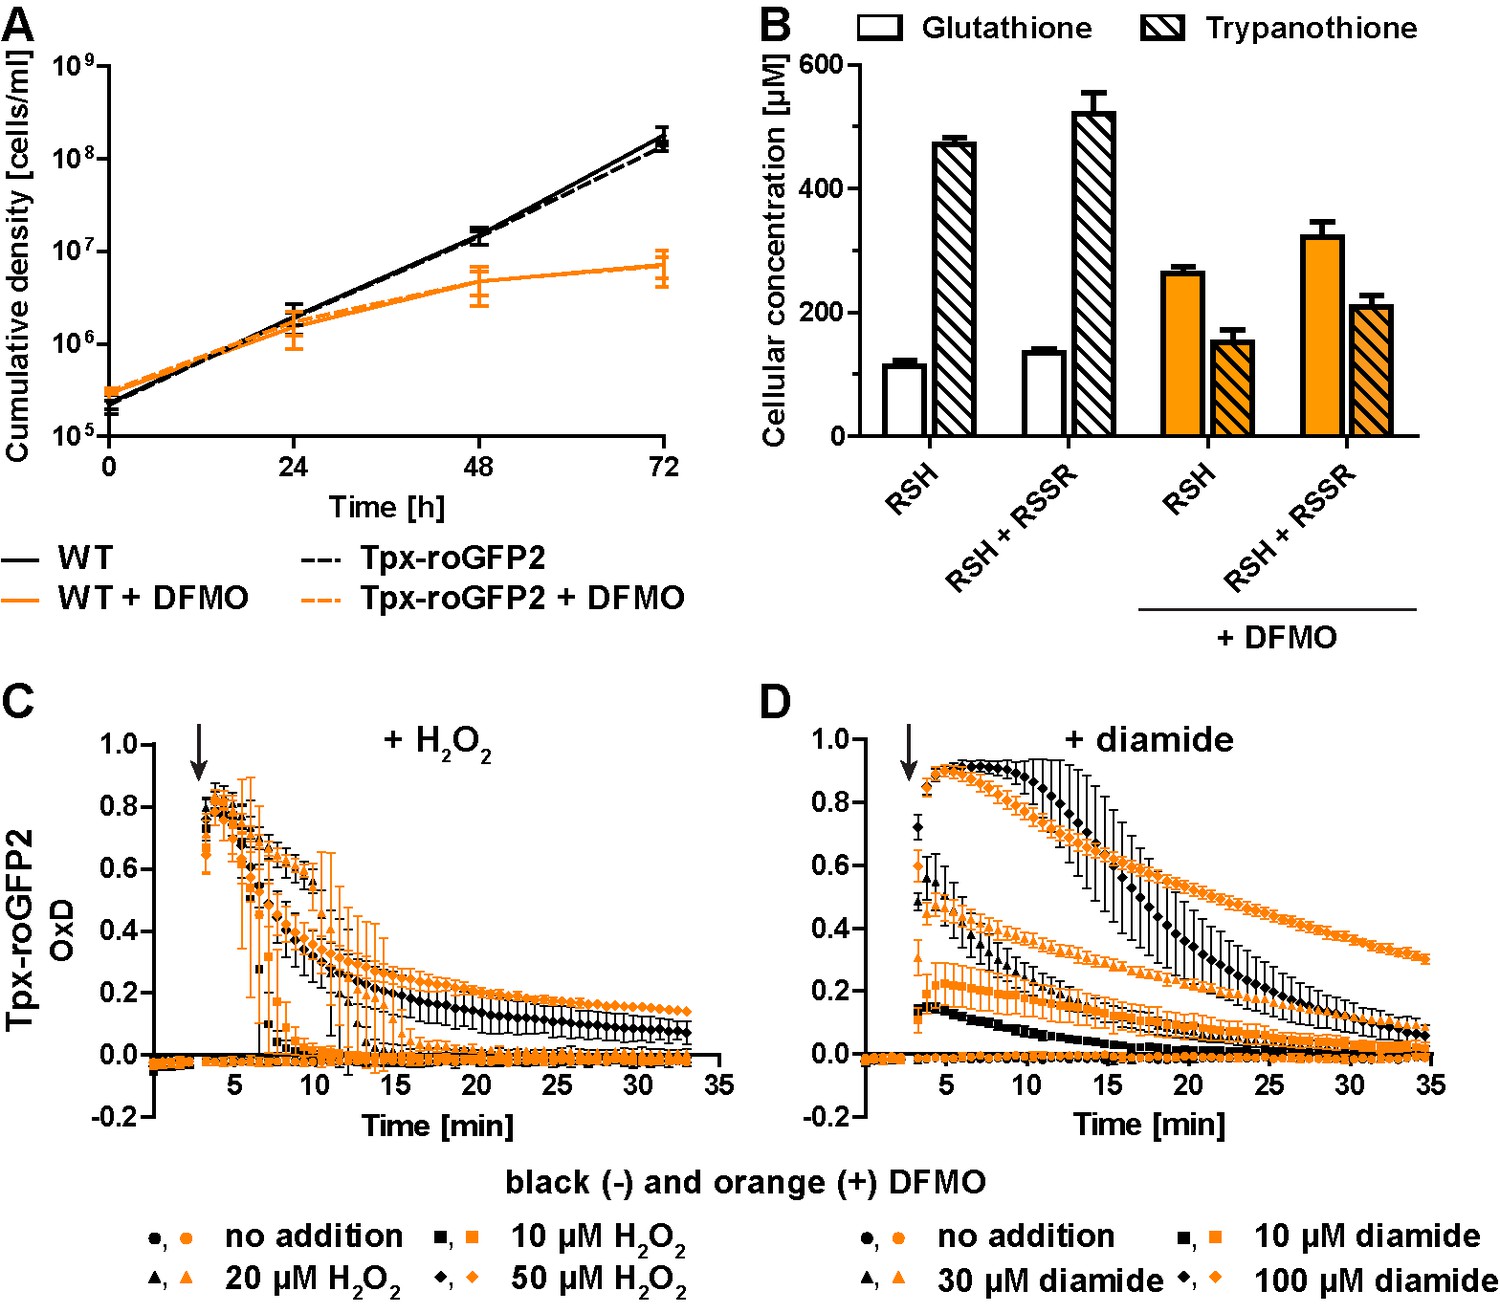
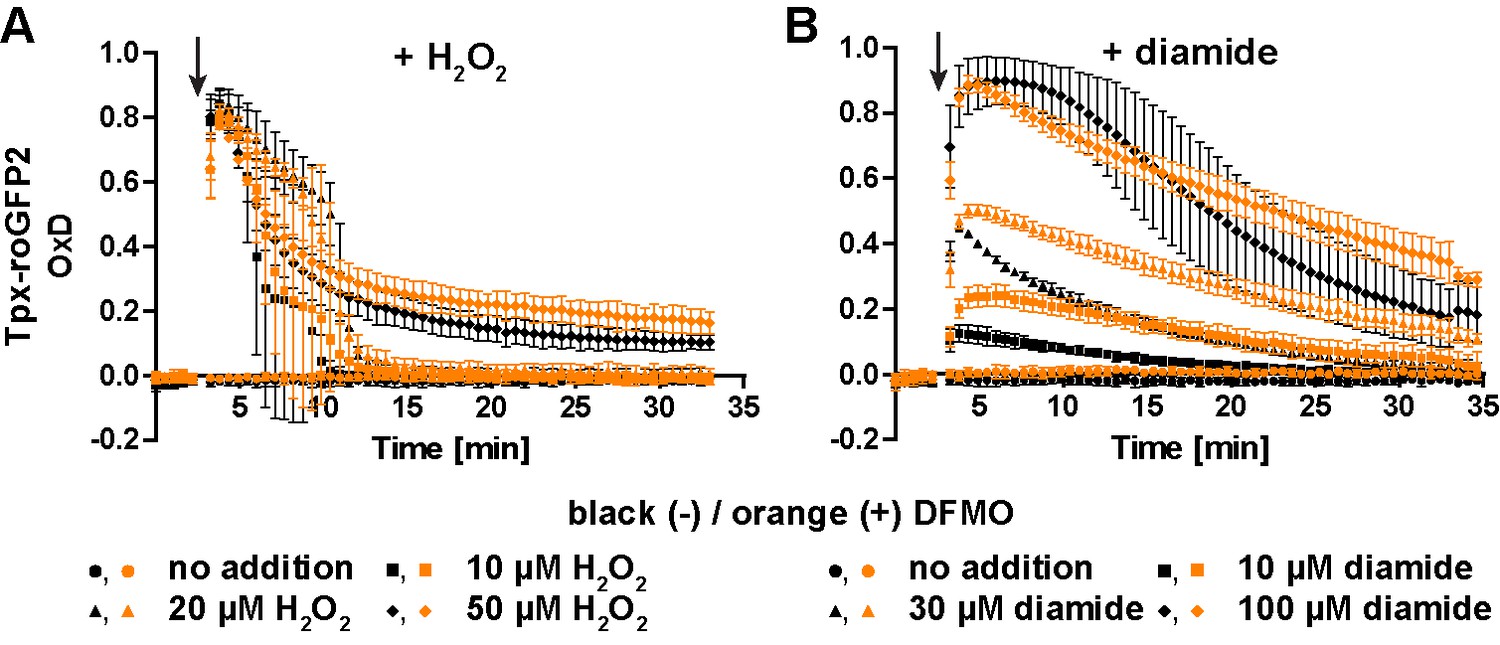
Inhibition of T(SH)2 synthesis slows down re-reduction of the oxidized sensor.
(A) Proliferation of PC WT and Tpx-roGFP2-expressing cells in the absence (black) or presence (orange) of 5 mM DFMO. (B) WT parasites grown for 48 hr in medium ±DFMO were lysed by TCA precipitation. The concentration of free thiols was determined either directly (RSH) or after treatment with TCEP yielding the sum of free thiols and disulfides (RSH + RSSR). The values are the mean ± SD of at least three independent analyses. (C and D) Tpx-roGFP2-expressing cells that were grown ±DFMO for 48 hr were subjected to fluorescence measurements. After 3 min (arrow), the indicated concentration of (C) H2O2 or (D) diamide was injected and the sensor response followed over time. Data show the mean ± SD of three independent experiments.
Figure 4—figure supplement 1
Prolonged cultivation with DFMO for 72 hr does not augment the sensitivity of PC cells towards oxidative stresses.
PC cells expressing cytosolic Tpx-roGFP2 were cultured for 72 hr in the absence (black) or presence (orange) of 5 mM DFMO and subjected to fluorescence measurements. After 3 min (arrow), cells were treated with different concentrations of (A) H2O2 or (B) diamide and sensor oxidation and re-reduction were followed. Data are the mean ± SD of three independent experiments.
Figure 5 with 1 supplement

Depletion of Tpx abolishes the cytosolic sensor response to exogenous H2O2.
PC cells constitutively expressing (A, C) roGFP2-hGrx1 or (B, D) roGFP2 and harboring a construct for Tet-inducible RNAi against Tpx were cultured for 24 hr in the absence (-) or presence (+) of Tet. (A, B) Western blot analysis of non-induced (-) and induced (+) cells, using antibodies against Tpx, and mPrx as loading control. (C, D) Plate reader-based fluorescence measurements. A single pulse of different H2O2 concentrations was given after 3 min (arrow). The values are the mean ± SD of three individual experiments with one clone. A second cell line showed identical results.
Figure 5—figure supplement 1
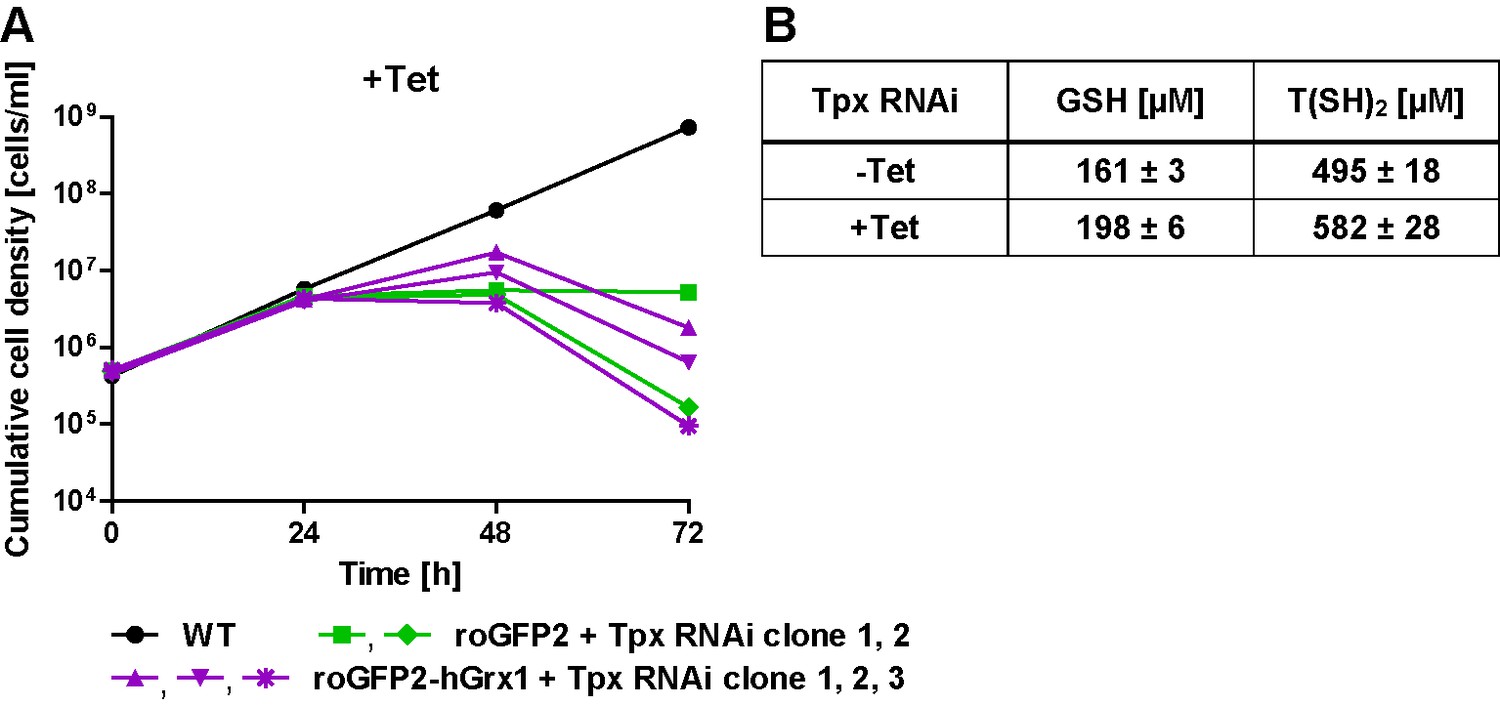
Growth phenotype and thiol content of Tpx-depleted PC T. brucei.
(A) WT parasites as well as roGFP2-hGrx1- (three clones) and roGFP2-expressing (two clones) Tpx RNAi cell lines were cultured in the presence of Tet. Every 24 hr, living cells were counted and the culture diluted back to the initial density of 5 × 10⁵ cells/ml. The graph shows the cumulative cell densities of the individual clones. (B) Tpx RNAi cells were grown in medium ±Tet for 24 hr and lysed by TCA precipitation. The supernatant was treated with TCEP, and the thiols were derivatized with mBBr and quantified by HPLC. The values represent the mean ± SD of three independent analyses.
Figure 6
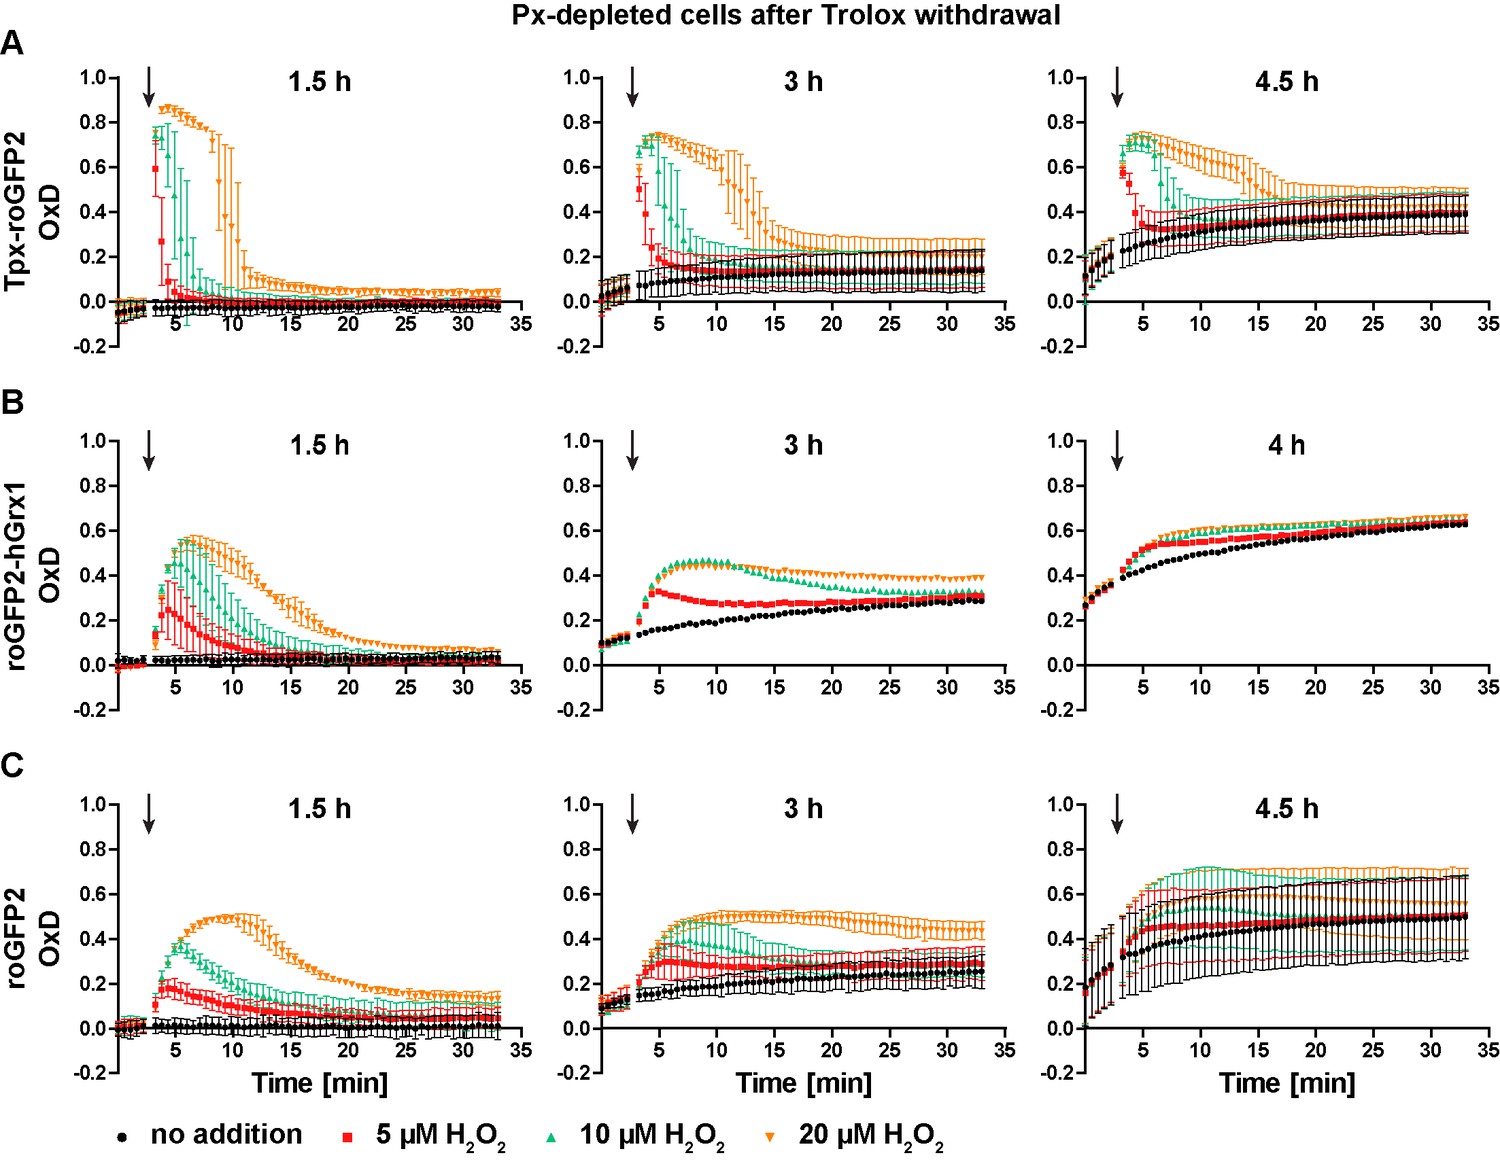
Px-depleted parasites show an increased basal sensor OxD.
Parasites expressing either (A) Tpx-roGFP2, (B) roGFP2-hGrx1, or (C) roGFP2 were transfected with a construct that allowed the Tet-inducible depletion of the Px-type enzymes. RNAi was induced in the presence of Trolox. Subsequently the cells were transferred into Trolox-free medium and subjected to fluorescence measurements. The indicated concentrations of H2O2 were injected after 3 min (arrow). The data are the mean ± SD of three independent experiments except for the 3 hr and 4 hr measurements with the roGFP2-hGrx1 cells which were done only in duplicate and show the mean.
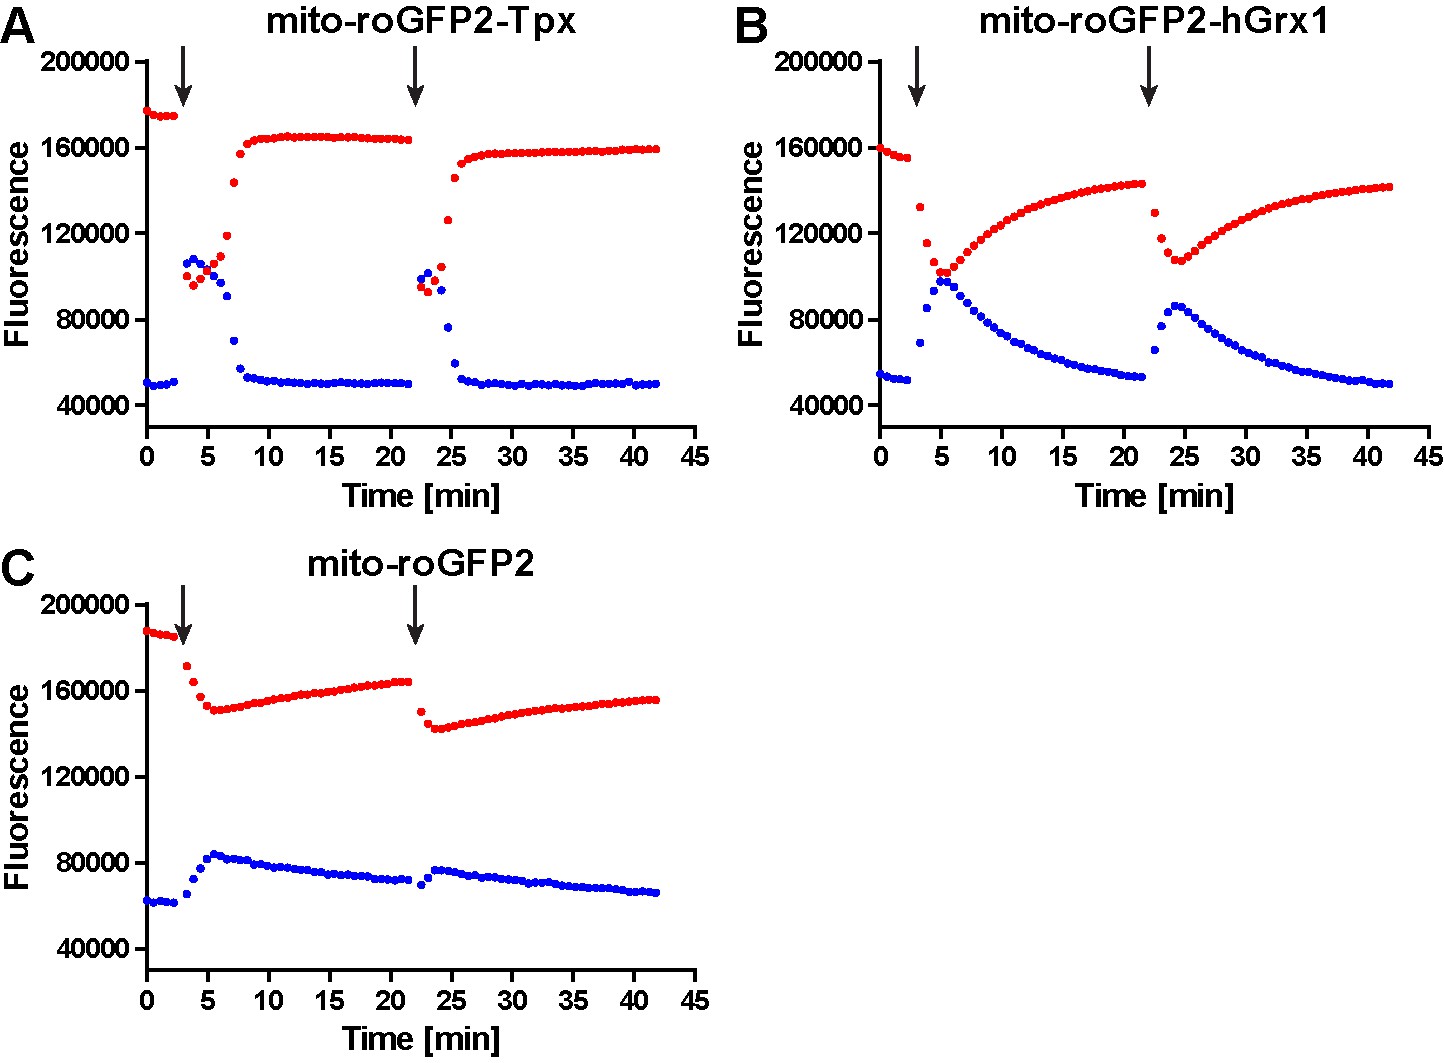
Figure 7 with 5 supplements
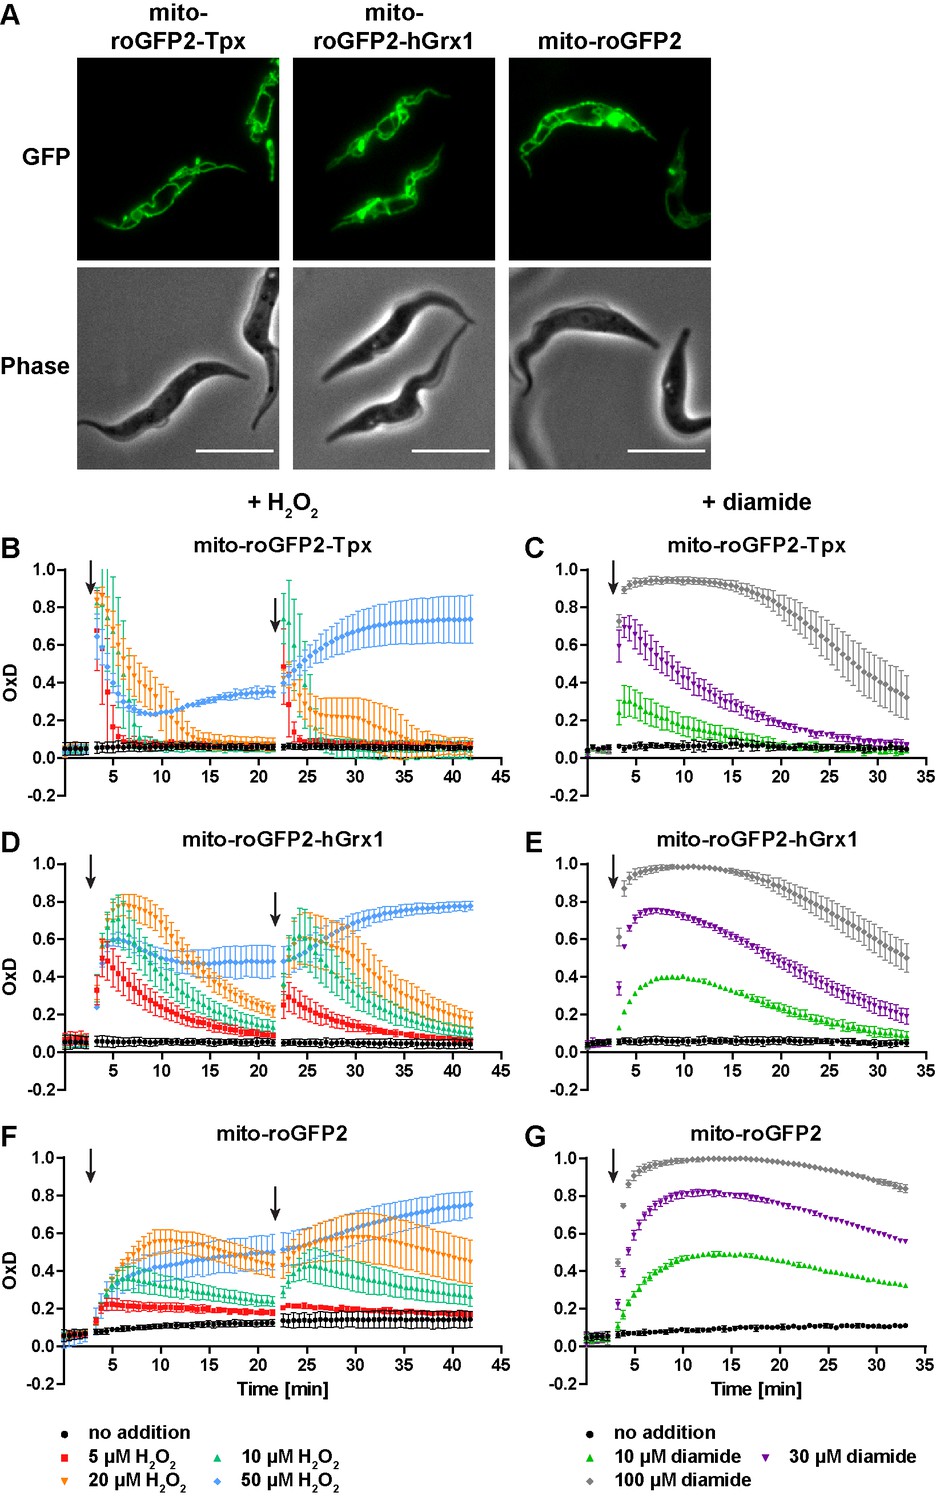
The mitochondrion has a lower reducing capacity than the cytosol.
(A) Live cell fluorescence microscopy of PC T. brucei constitutively expressing mito-roGFP2-Tpx, mito-roGFP2-hGrx1, and mito-roGFP2. The GFP signal shows the mitochondrial localization of the respective sensor. Phase: phase contrast image. Scale bar: 10 µm. Cells expressing (B, C) mito-roGFP2-Tpx, (D, E) mito-roGFP2-hGrx1, or (F, G) mito-roGFP2 were treated with (B, D, F) H2O2 and (C, E, G) diamide and subjected to fluorescence measurements. The data represent the mean ± SD of at least three independent experiments.
Figure 7—figure supplement 1
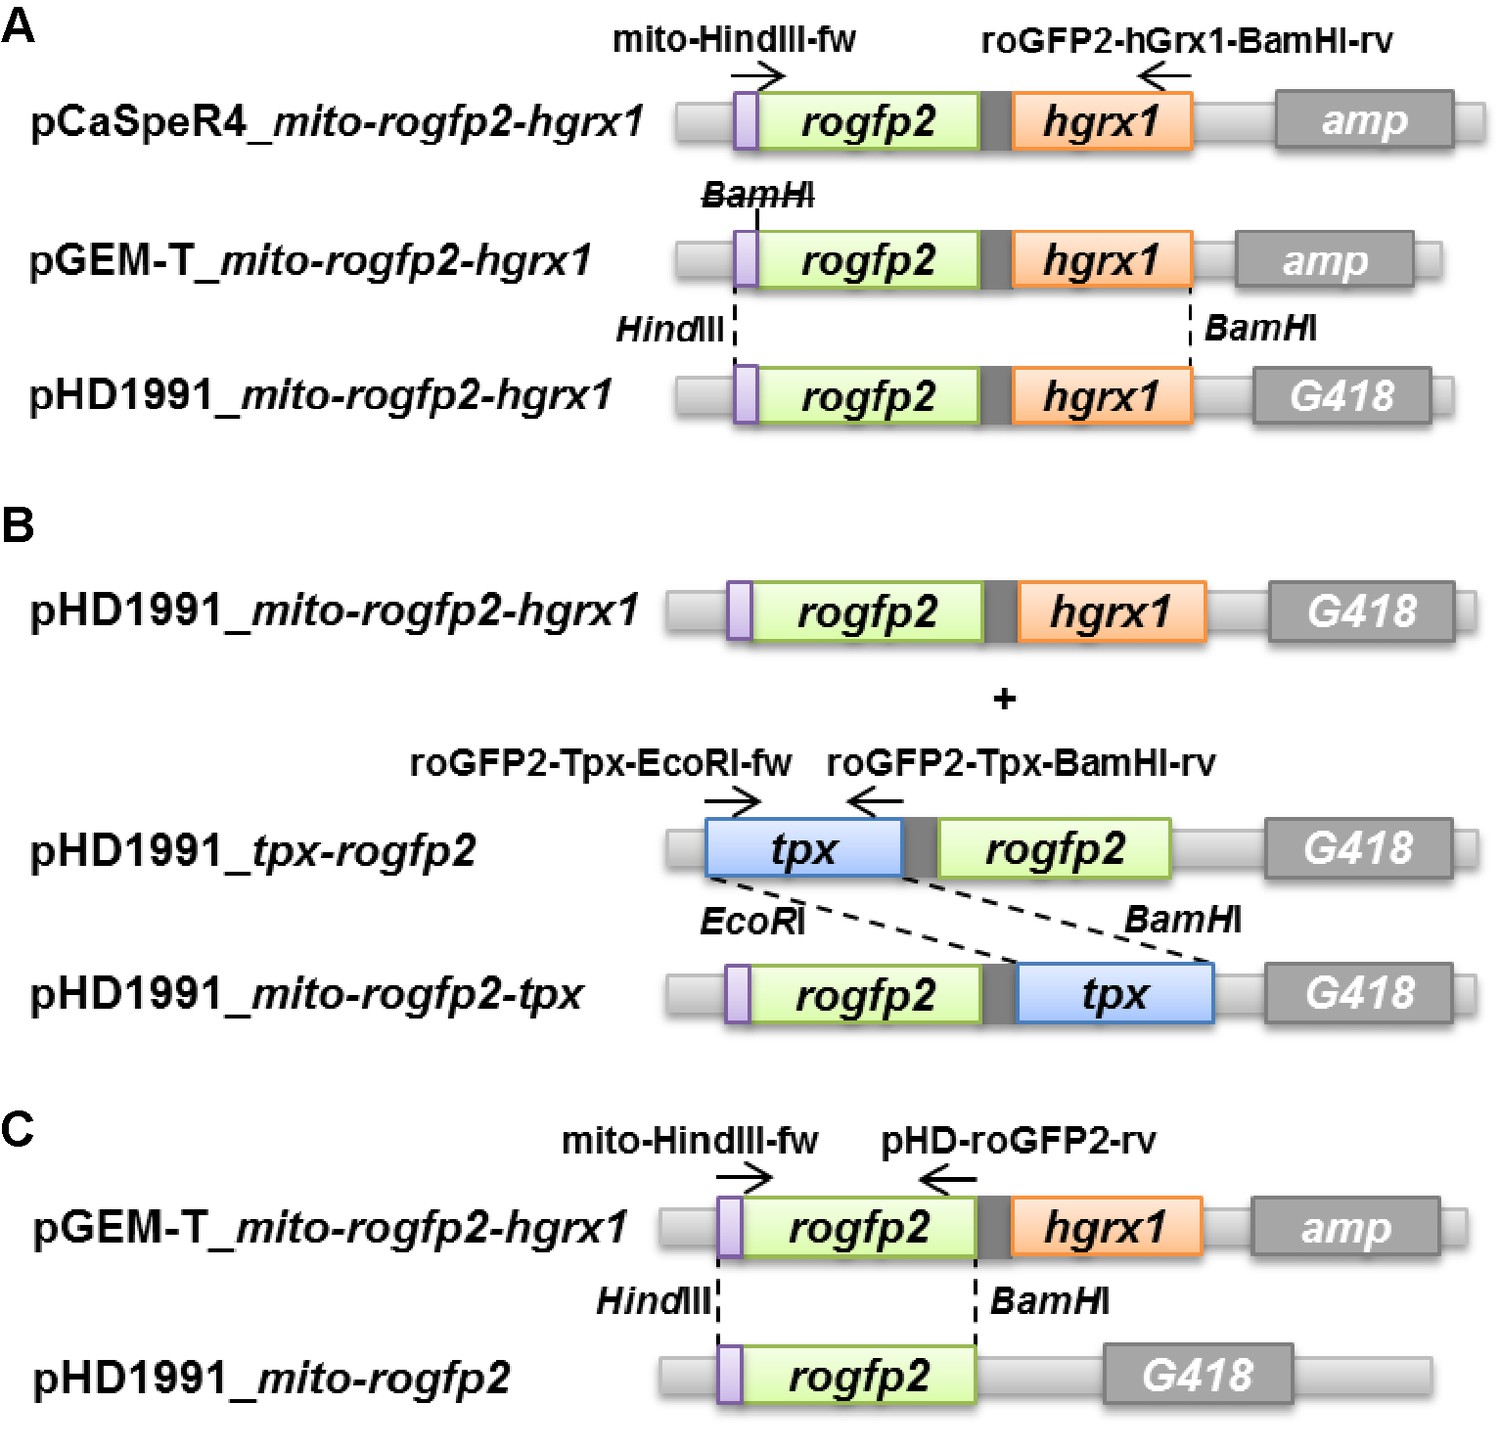
Cloning of constructs to express the redox sensors in the mitochondrial matrix of PC T. brucei.
(A) The pCaSpeR4_mito-rogfp2-hgrx1 vector served as starting construct. It contains the mitochondrial targeting sequence of human cytochrome c oxidase (violet box). Mito-rogfp2-hgrx1 was amplified from the pCaSpeR4 plasmid and ligated into the pGEM-T vector, and a BamHI site between the targeting signal and the rogfp2 sequence was mutated. Subsequent ligation into the pHD1991 vector yielded pHD1991_mito-rogfp2-hgrx1. (B) The pHD1991_mito-rogfp2-hgrx1 plasmid was then used to exchange hgrx1 by tpx which was amplified from pHD1991_tpx-rogfp2 (Figure 3—figure supplement 1) resulting in pHD1991_mito-rogfp2-tpx. (C) For pHD1991_mito-rogfp2, the mito-rogfp2 sequence was obtained from the pGEM-T_mito-rogfp2-hgrx1 plasmid and ligated into the pHD1991 vector. G418 and amp, geneticin disulfate and ampicillin resistance genes. The arrows show the binding sites of the primers used for amplification of the respective sequence by PCR. The primer sequences are given in the Supplementary file 2. Dashed lines indicate the used restriction sites. Details are described in Materials and methods.
Figure 7—figure supplement 2
Unprocessed fluorescence intensity curves for cells expressing (A) mito-roGFP2-Tpx, (B) mito-roGFP2-hGrx1 and (C) mito-roGFP2 that were challenged twice with 10 µM H2O2 (arrows).
The fluorescence was excited at 400 nm (blue) and 485 nm (red) and the emitted light detected at 520 nm.
-
Figure 7—figure supplement 2—source data 1
Original data for Figure 7—figure supplement 2.
- https://cdn.elifesciences.org/articles/53227/elife-53227-fig7-figsupp2-data1-v2.xlsx
Figure 7—figure supplement 3
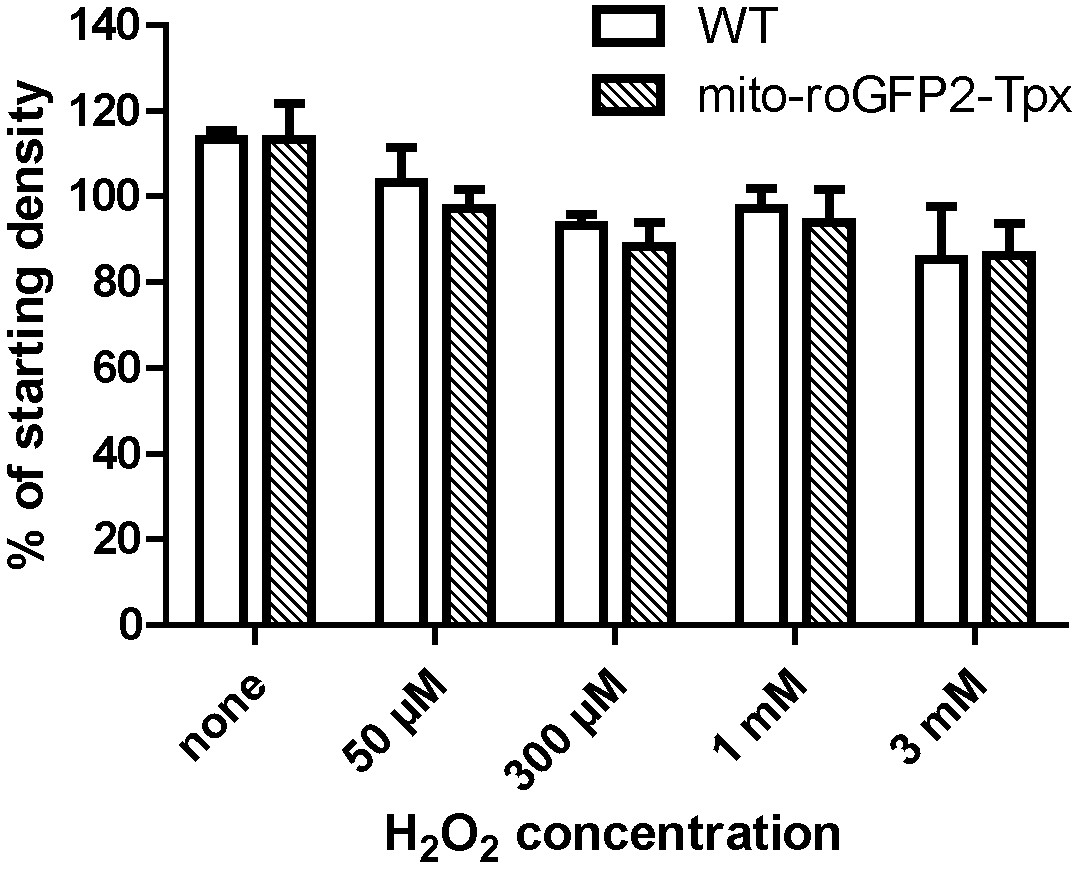
Sensitivity of mito-roGFP2-Tpx expressing PC T. brucei towards H2O2.
At a starting density of 5 × 10⁵ cells/ml, WT and mito-roGFP2-Tpx expressing cells were incubated in the presence of different concentrations of H2O2. After two hours, viable cells were counted. At 50 µM, the lowest concentration applied, H2O2 affected motility and abrogated proliferation of the cells. In the presence of 3 mM H2O2, the cultures contained already dead cells. No difference was observed between the two cell types. The data are the mean ± SD of four independent experiments.
Figure 7—figure supplement 4
Heat stress does not affect the thiol redox status in the cytosol or mitochondrion of PC T. brucei.
Parasites constitutively expressing the different (A, C, E) cytosolic or (B, D, F) mitochondrial roGFP2-sensors were grown for 24 hr at 37°C and subjected to fluorescence measurements at 27°C. After 3 min (arrow), different concentrations of H2O2 were injected. The mean ± SD of at least three individual experiments is depicted.
Figure 7—figure supplement 5
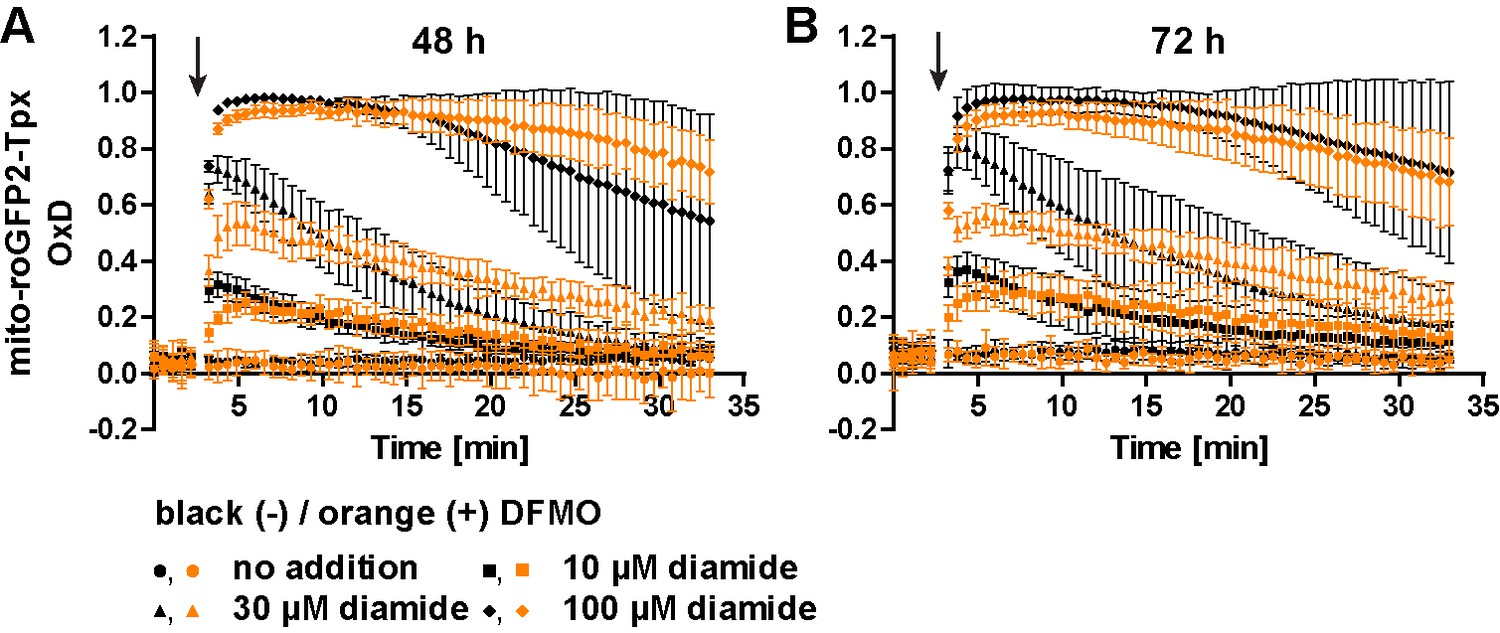
Cultivation with DFMO decelerates the reduction rate of mito-roGFP2-Tpx.
PC cells expressing mito-roGFP2-Tpx were cultured for (A) 48 hr and (B) 72 hr in the absence (black) or presence (orange) of 5 mM DFMO and subjected to fluorescence measurements. After 3 min (arrow), cells were treated with different concentrations of diamide and the sensor response was followed. Data represent the mean ± SD of four independent experiments.
Figure 8
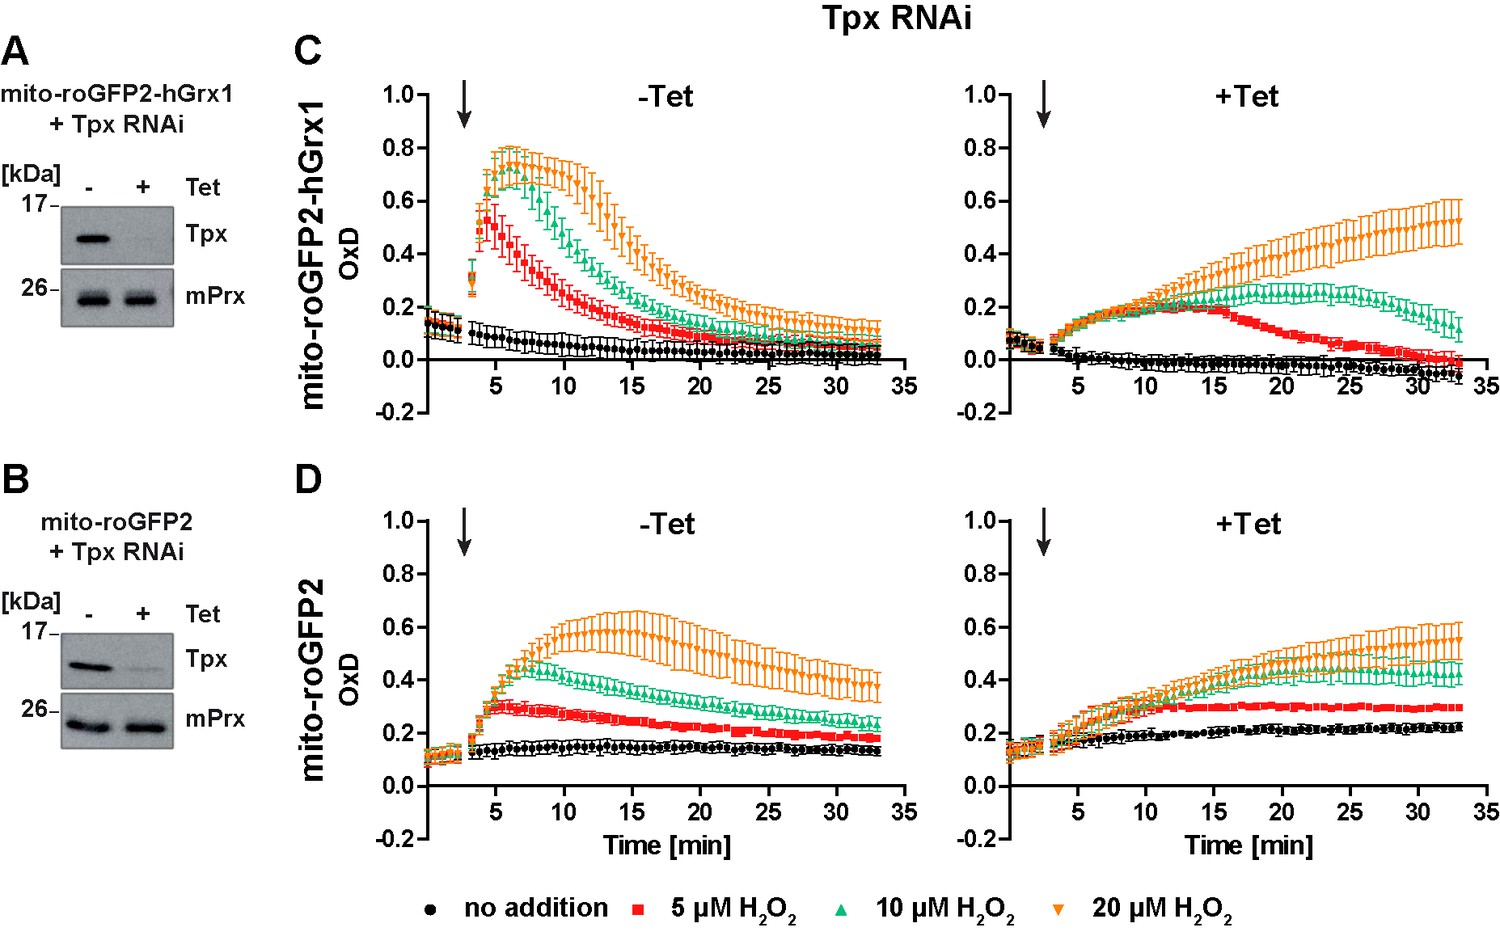
In Tpx-depleted cells the mitochondrial sensors are still able to respond to exogenous H2O2 stress.
(A, C) Mito-roGFP2-hGrx1- and (B, D) mito-roGFP2-expressing Tpx RNAi cell lines were cultured for 24 hr in the absence (-) or presence (+) of Tet. (A, B) Total lysates of 2 × 10⁶ of non-induced (-) and induced (+) cells were subjected to Western blot analysis using antibodies against Tpx and mPrx as loading control. (C, D) The cells were subjected to plate reader-based fluorescence measurements. After 3 min, a single pulse of different H2O2 concentrations was injected (arrow). (C) The values are the mean ± SD of at least two individual experiments using three different clones. (D) The data represent the mean ± SD of three independent experiments with one clone. A second cell line gave identical results.
Figure 9
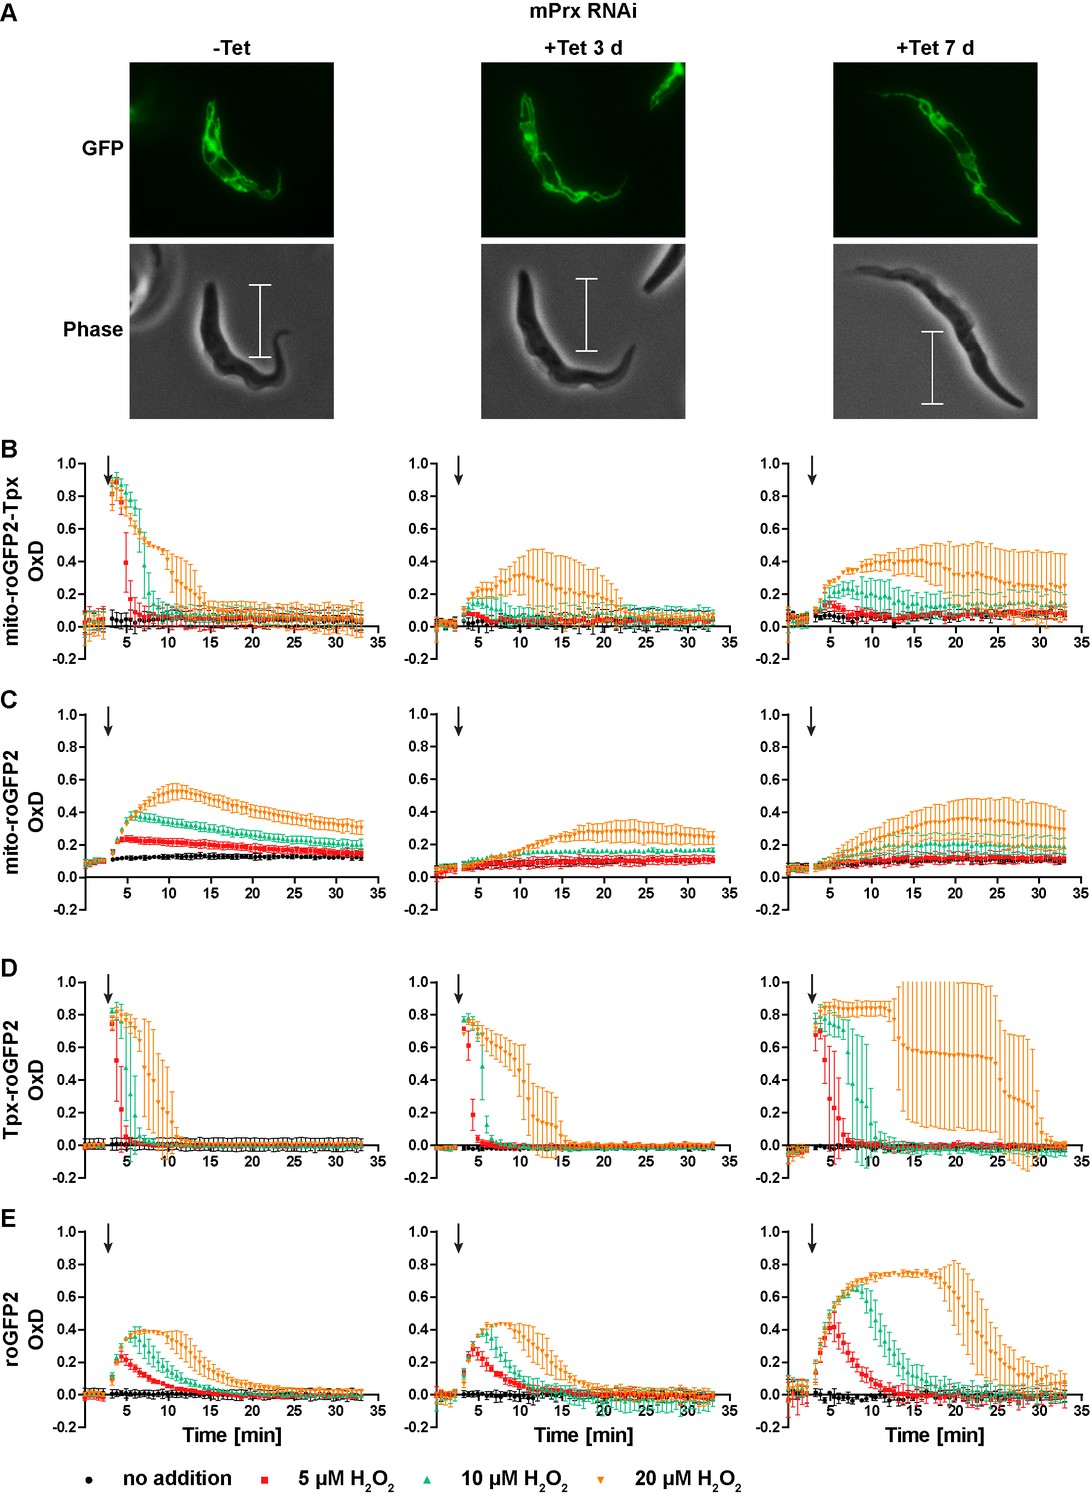
Depletion of mPrx influences both mitochondrial and cytosolic sensor responses.
(A) Live cell imaging of mito-roGFP2-Tpx expressing PC T. brucei that harbor a construct for Tet-inducible RNAi against mPrx. The GFP signal confirmed the mitochondrial localization of the sensor under all conditions and for all time points. The phase contrast images show the highly elongated shape the cells adapt upon mPrx depletion. Scale bar: 10 µm. mPrx RNAi cells expressing the (B, D) Tpx-coupled or (C, E) unfused sensor in the (B–C) mitochondrial matrix or in the (D–E) cytosol were cultured for seven days in the absence (left) and for three (middle) and seven days (right) in the presence of Tet. Cells were subjected to fluorescence plate reader-based measurements. A single pulse of different H2O2 concentrations was injected after 3 min (arrow). The values are the mean ± SD of three individual experiments with one clone. A second cell line showed identical results.
Additional files
-
Supplementary file 1
Key resources table.
- https://cdn.elifesciences.org/articles/53227/elife-53227-supp1-v2.docx
-
Supplementary file 2
The primers used in this work.
- https://cdn.elifesciences.org/articles/53227/elife-53227-supp2-v2.docx
-
Transparent reporting form
- https://cdn.elifesciences.org/articles/53227/elife-53227-transrepform-v2.docx
Download links
A two-part list of links to download the article, or parts of the article, in various formats.
Downloads (link to download the article as PDF)
Open citations (links to open the citations from this article in various online reference manager services)
Cite this article (links to download the citations from this article in formats compatible with various reference manager tools)
A tryparedoxin-coupled biosensor reveals a mitochondrial trypanothione metabolism in trypanosomes
eLife 9:e53227.
https://doi.org/10.7554/eLife.53227


