Cross-species cortical alignment identifies different types of anatomical reorganization in the primate temporal lobe
- Wellcome Centre for Integrative Neuroimaging, Centre for Functional MRI of the Brain (FMRIB), Nuffield Department of Clinical Neurosciences, John Radcliffe Hospital, University of Oxford, United Kingdom
- Biomedical Engineering Department, King’s College London, United Kingdom
- Donders Institute for Brain, Cognition and Behaviour, Radboud University Nijmegen, Netherlands
- Marcus Autism Center, Children's Healthcare of Atlanta, Emory University, United States
- Department of Physiology, Anatomy and Genetics, University of Oxford, United Kingdom
- Institute of Biology, Otto-von-Guericke-Universität Magdeburg, Germany
- Leibniz-Insitute for Neurobiology, Germany
- Wellcome Centre for Integrative Neuroimaging, Department of Experimental Psychology, University of Oxford, United Kingdom
Figures
Figure 1
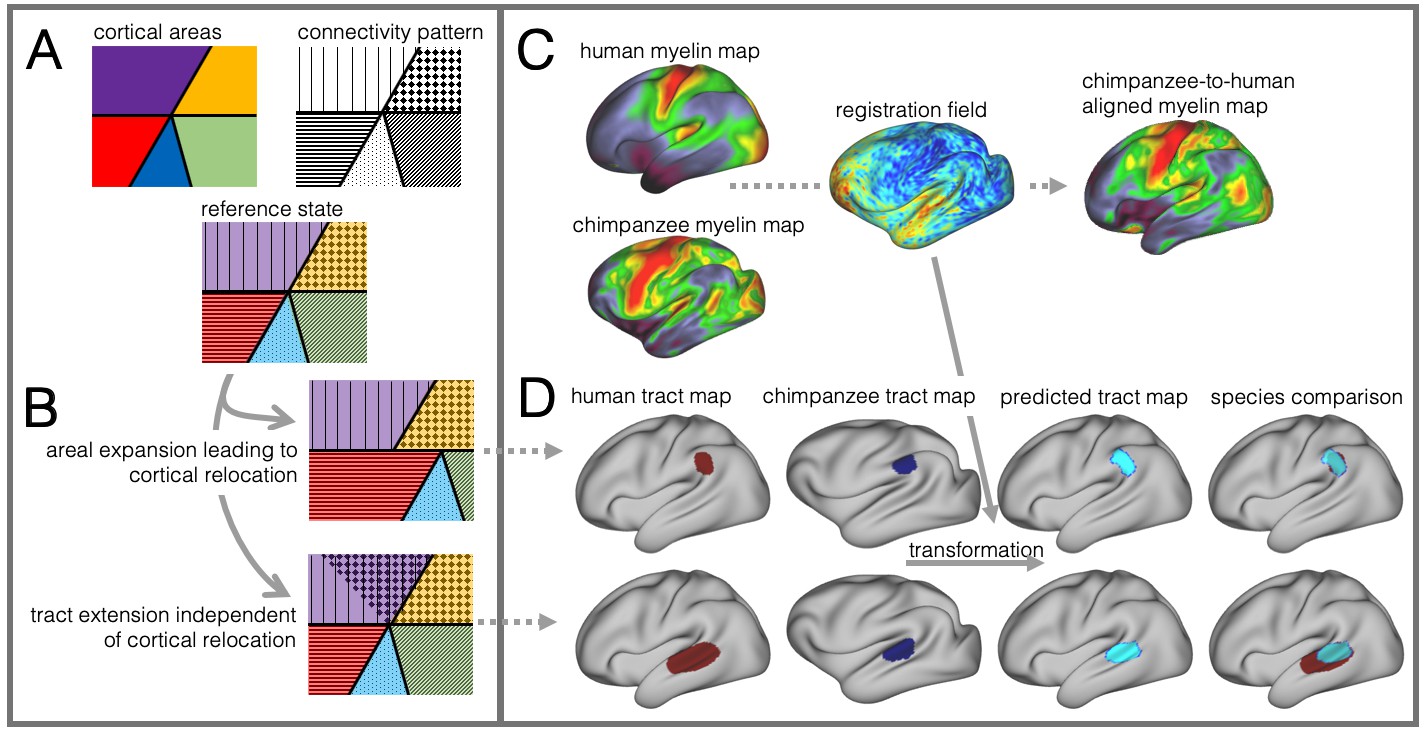
Cortical specializations.
(A) Cortical brain organization can be described using different modalities such as brain areas defined by myelin content (top left) or the pattern of brain connections (top right). (B) Anatomical changes can affect both modalities differentially. Top and bottom panels show different evolutionary scenarios. (C) Alignment of homologous brain areas derived from myelin maps can model cortical expansion across species, here shown for human and chimpanzee. (D) Applying the cross-species registration field to surface tract maps allows us to distinguish evolutionary scenarios. Here shown are toy example maps of one tract that extended due to areal expansion alone (top panel) and one tract that additionally extended into new brain areas (bottom panel). Red: human tract map; dark blue: chimpanzee tract map; light blue: transformed chimpanzee tract map.
Figure 2
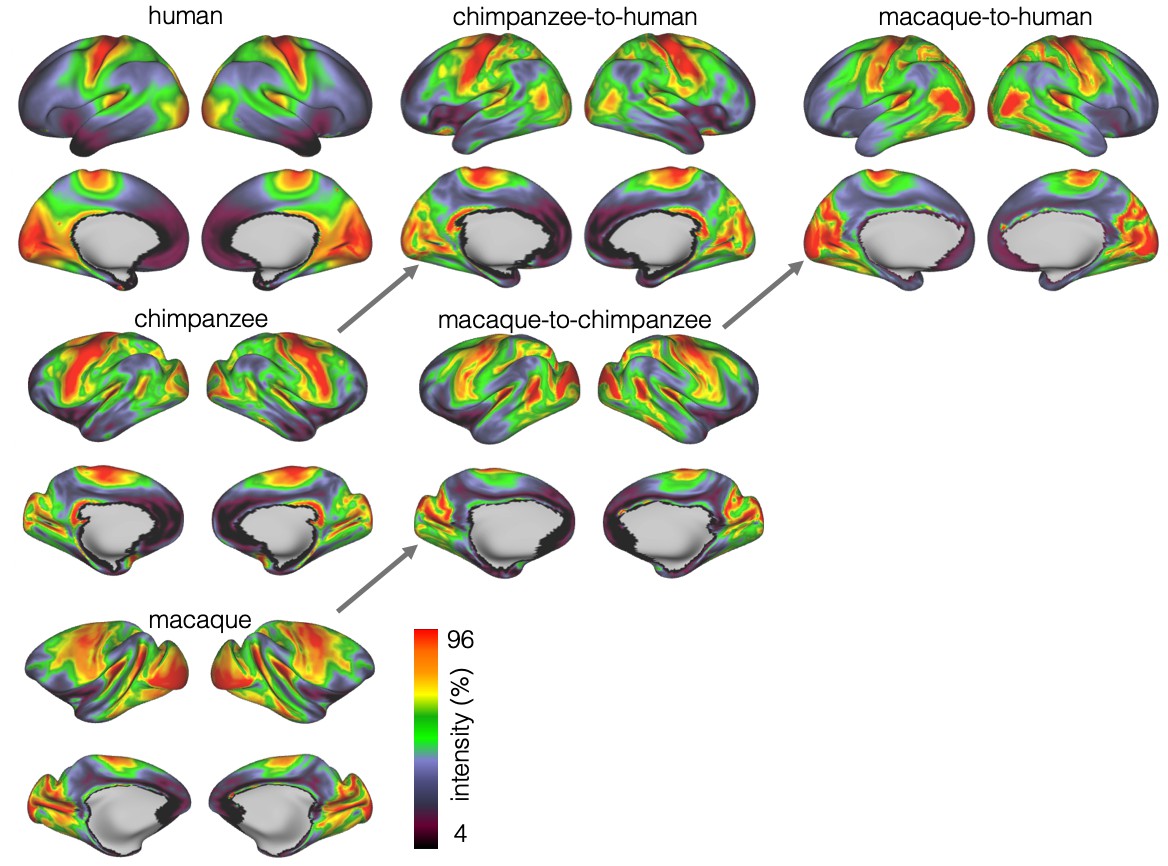
Myelin registration.
Species average myelin maps (left panel) and myelin maps resampled across species after applying the MSM-derived registration.
Figure 3
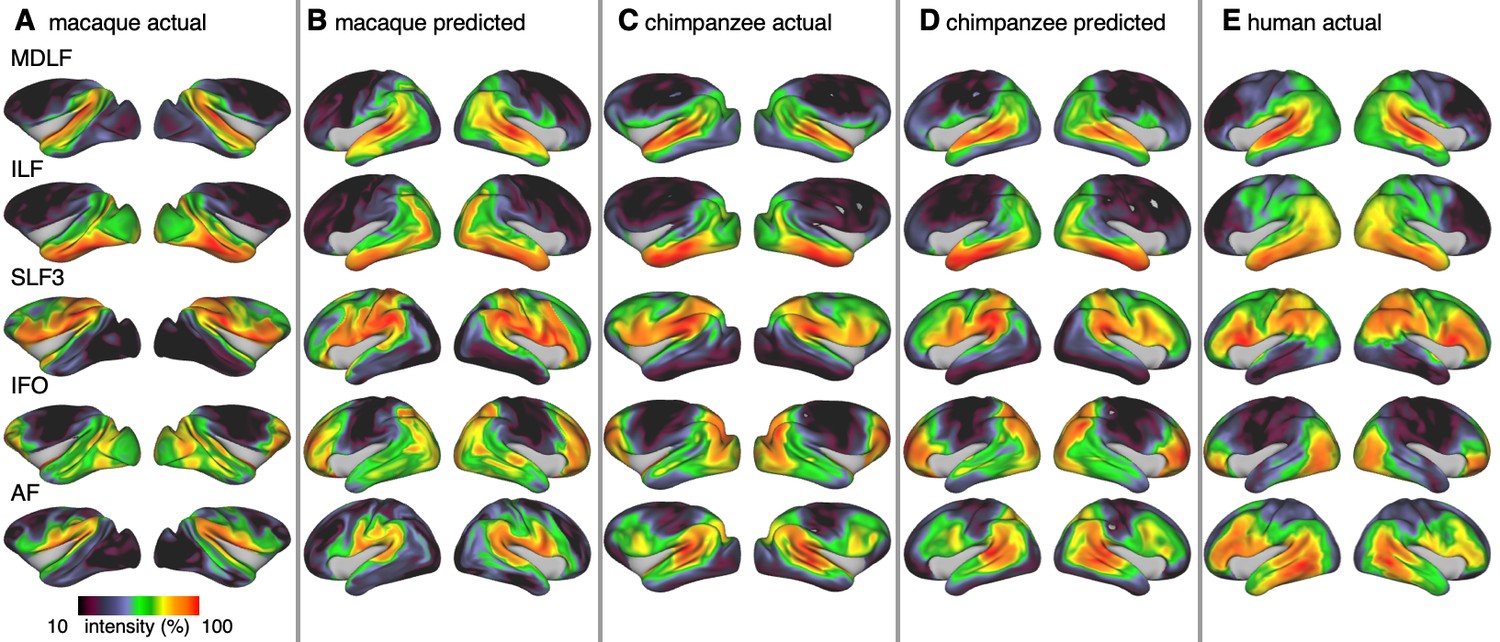
Actual and predicted tract maps.
The intensity in the tract maps reflects the probability of a tract’s termination on the cortical surface as derived from tractography. Actual tract maps of macaque (A), chimpanzee (C) and human (E). B and D show the tract maps in human space, predicted by the myelin-based registration for macaque and chimpanzee.
Figure 4

Cross-species comparison results.
(A) Thresholded actual human tract maps (red) and tract maps predicted by the myelin-based registration for chimpanzee (blue) and macaque (green) (thresholds (t): MDLF: t = 0.7, ILF: t = 0.7, SLF3: t = 0.85, IFO: t = 0.75, AF: t = 0.75). (B), (C) Weighted correlation maps of actual human map and predicted chimpanzee and macaque map.
Figure 5
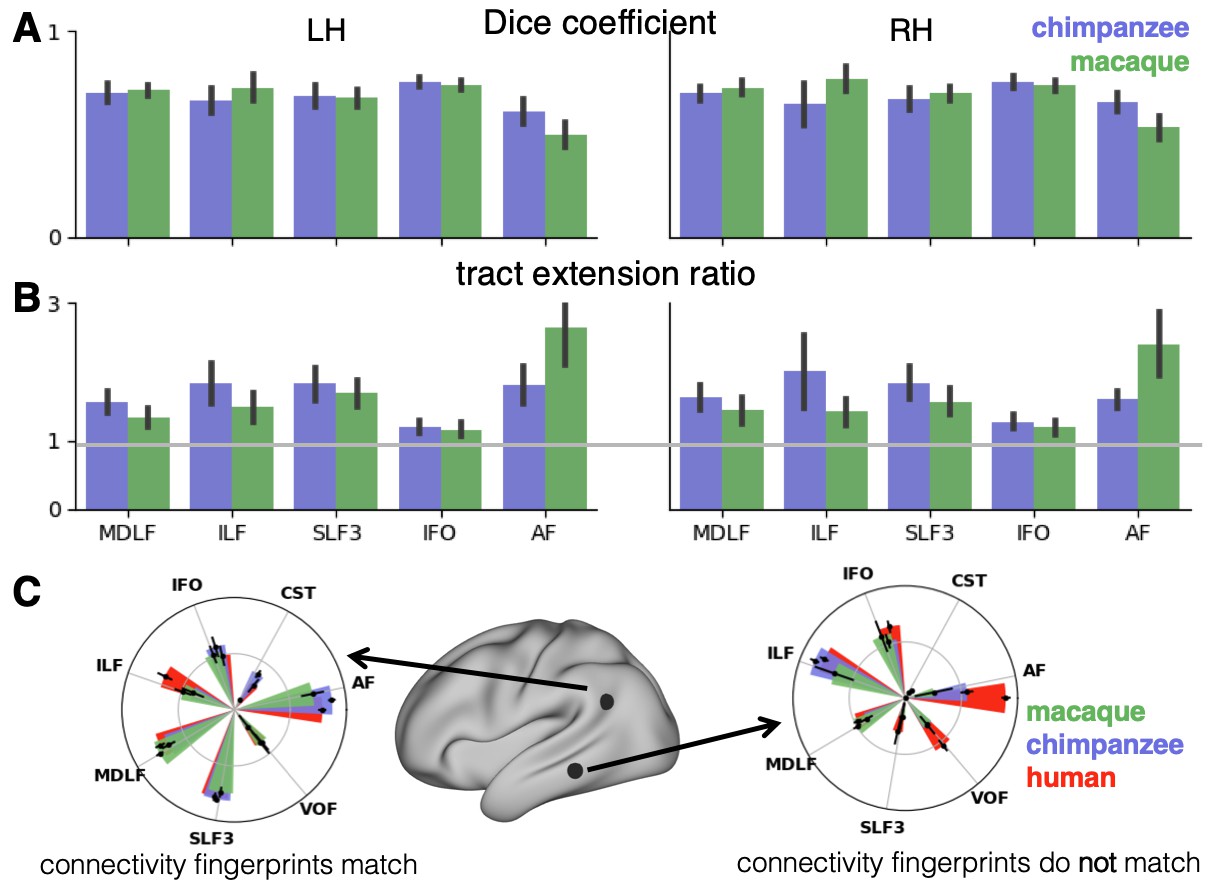
Quantification of cross-species comparisons.
Dice coefficients of overlap (A) and tract extension ratios (B) computed from actual thresholded human tract maps and tract maps predicted by the other species. Shown are mean and standard deviation derived from all pairs of human (n = 20) and macaque or chimpanzee (n = 5) subjects in left (LH) and right (RH) hemisphere. (C) Connectivity fingerprints at two vertices in inferior parietal and in temporal lobe derived from the intensity values of an extended set of tract maps. Shown are mean and standard deviation (human: n = 20, chimpanzee and macaque: n = 5).
-
Figure 5—source data 1
Numerical data underlying the connectivity fingerprint shown in Figure 5C.
The values are organized as data array that stores the individual tract map intensities. The dimensions of the array are 3 × 1 × 7 × 2 × 20 for n_species, n_hemispheres (only left hemisphere), n_tracts, n_vertices, n_subjects.
- https://cdn.elifesciences.org/articles/53232/elife-53232-fig5-data1-v2.mat
Appendix 1—figure 1
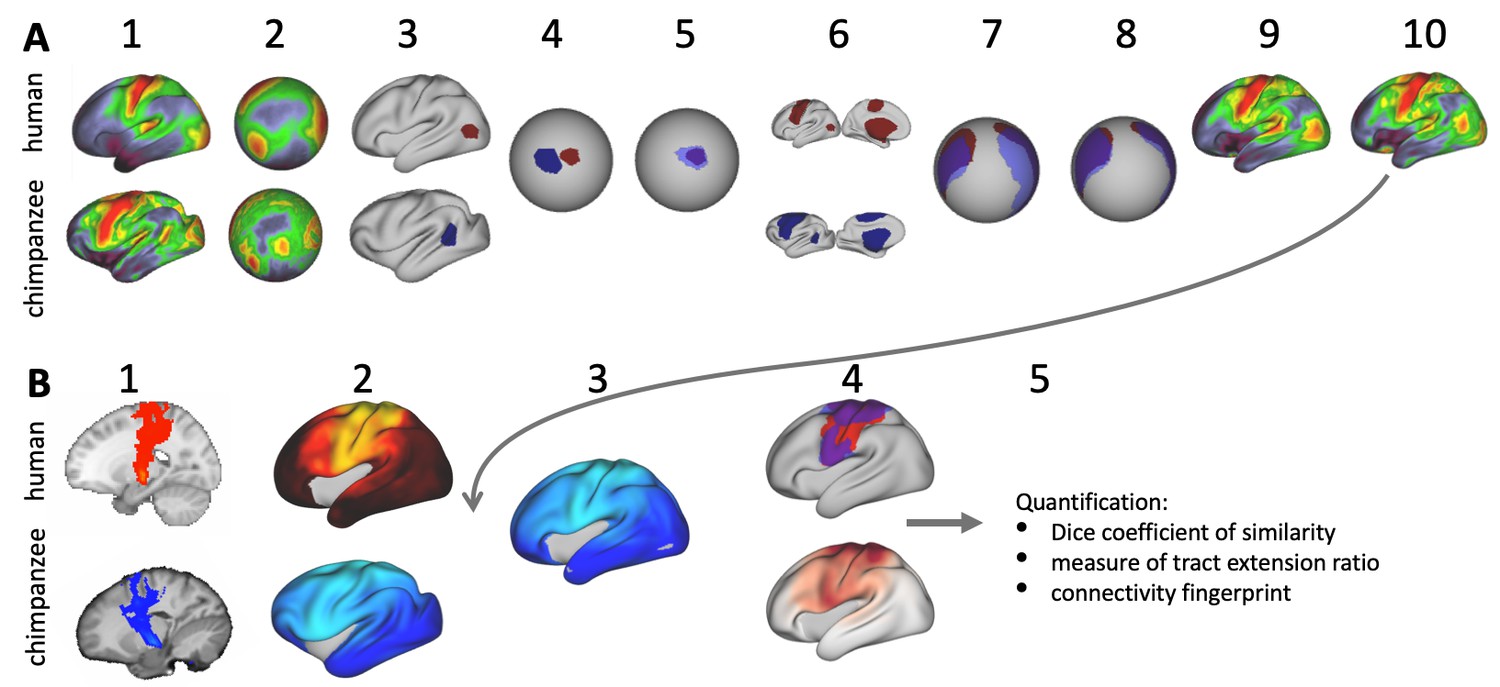
Related to Methods.
(A) MSM registration between chimpanzee and human myelin maps. (1) average species myelin maps. (2) myelin maps displayed on common sphere. (3) ROI for MT+ complex drawn on native surface. (4) MT+ ROI displayed on common sphere. (5) chimpanzee MT+ ROI (blue) registered to human (red) using MSM. (6) Set of three ROIs (MC, MT+, MW). (7) Effect of MT+ ROI-derived initialization on the set of ROIs (only MW and MC visible). (8) Registration of chimpanzee set of ROIs to human ROIs using MSM. (9) Effect of ROI-derived registration on whole hemisphere chimpanzee myelin map. (10) Registration of whole brain myelin maps initialized by set of ROIs using MSM. (B) Tract surface analysis. (1) Tractography result for an example tract (CST). (2) Tract map obtained by matrix multiplication. (3) The myelin-derived cross-species registration (A(10)) is applied to transform the actual chimpanzee tract map to human space. (4) Having both tract maps in the same space allows a direct species comparison and quantification of the differences (5).
Appendix 2—figure 1
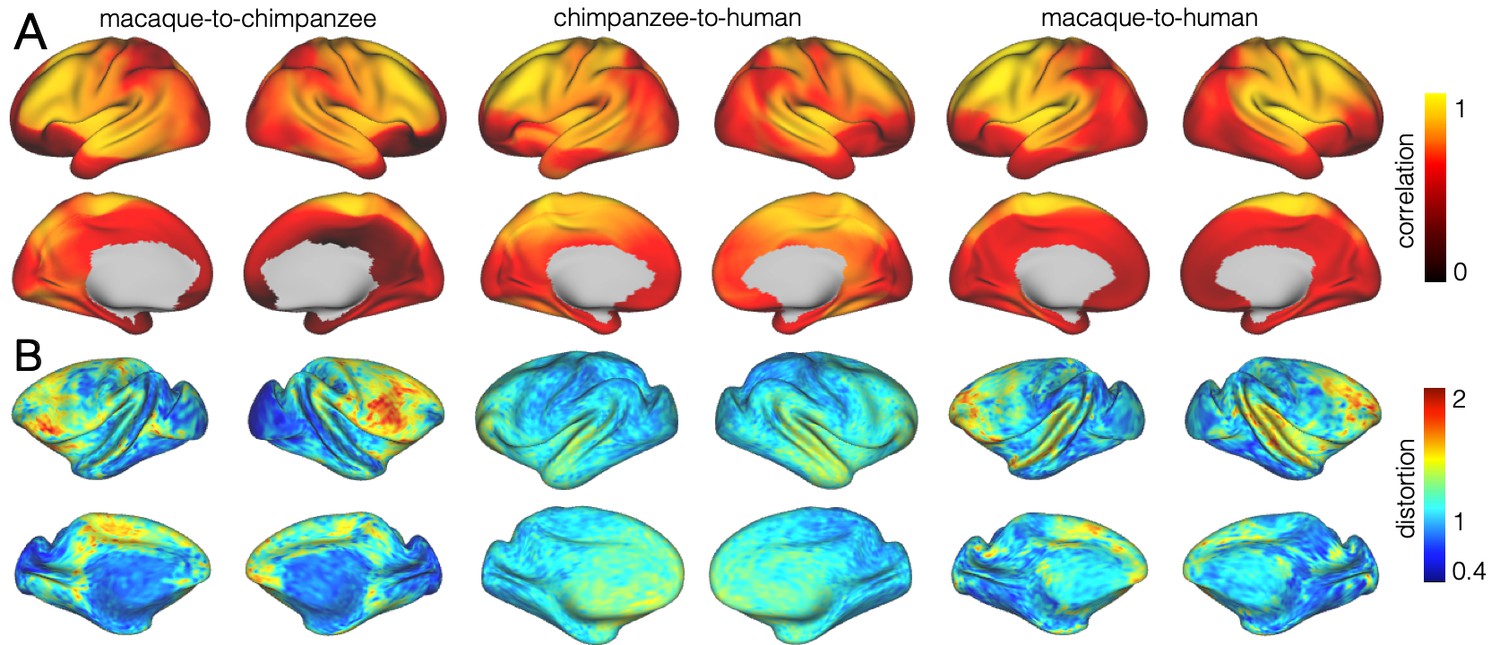
Related to Figure 2.
Myelin correlation and mesh distortion. (A) Local correlation of myelin maps after applying the MSM-derived registration. (B) Relative distortion of the mesh underlying the registrations. The values indicate a relative expansion (>1) or contraction (<1) of the mesh.
Appendix 3—figure 1
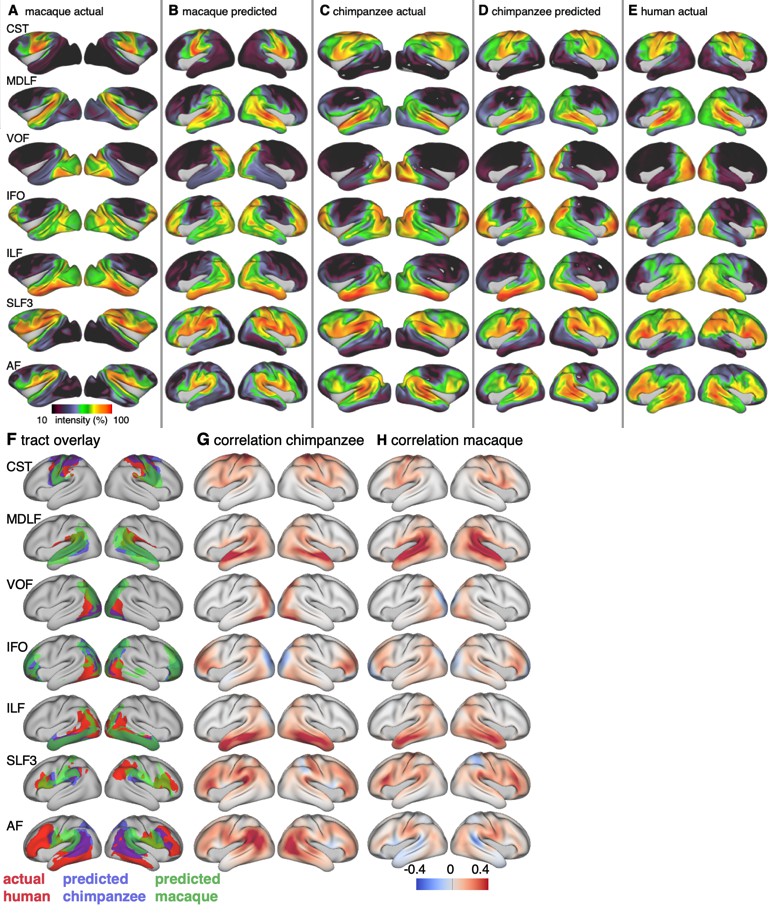
Related to Figure 3 and Figure 4.
Actual and predicted tract maps and species comparison for the complete set of tracts investigated. Actual tract maps of macaque (A), chimpanzee (C) and human (E). B and (D) show the transformed tract maps in human space, predicted by the myelin-based registration for macaque and chimpanzee. (F): Thresholded actual human tract maps (red) and tract maps predicted by the myelin-based registration for chimpanzee (blue) and macaque (green) (thresholds (t): CST: t = 0.6, MDLF: t = 0.7, VOF: t = 0.6, IFO: t = 0.75, ILF: t = 0.7, SLF3: t = 0.85, AF: t = 0.75). (G), (H): Weighted correlation maps of actual human map and predicted chimpanzee and macaque map.
Appendix 3—figure 2
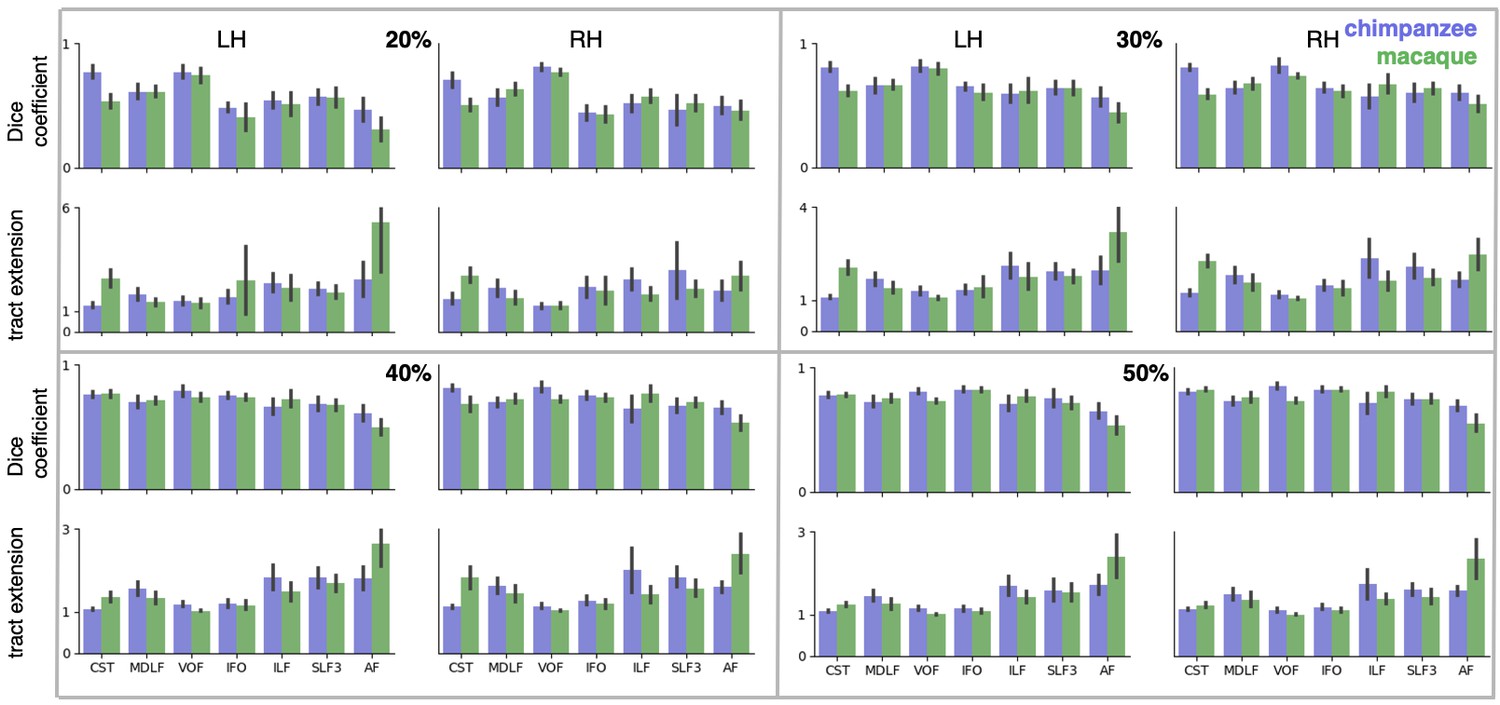
Related to Figure 5.
Dice coefficients and tract extension ratios for different percentages of surface coverage. Shown are mean ± 95% confidence interval derived from all pairs of human (n = 20) and macaque or chimpanzee (n = 5) subjects in left (LH) and right (RH) hemisphere. The low dice coefficient and high extension ratio for AF in macaque and – to a lesser degree – in chimpanzee, is present for all percentages of surface coverage.
-
Appendix 3—figure 2—source data 1
Numerical data underlying the quantifications shown in Figure 5A,B and in Appendix 3—figure 2.
The values are organized as a table that stores dice coefficients and tract extension ratios for each individual comparison of human vs. macaque or chimpanzee subjects.
- https://cdn.elifesciences.org/articles/53232/elife-53232-app3-fig2-data1-v2.csv
Appendix 4—figure 1
Related to Figure 5 and Appendix 3—figure 2.
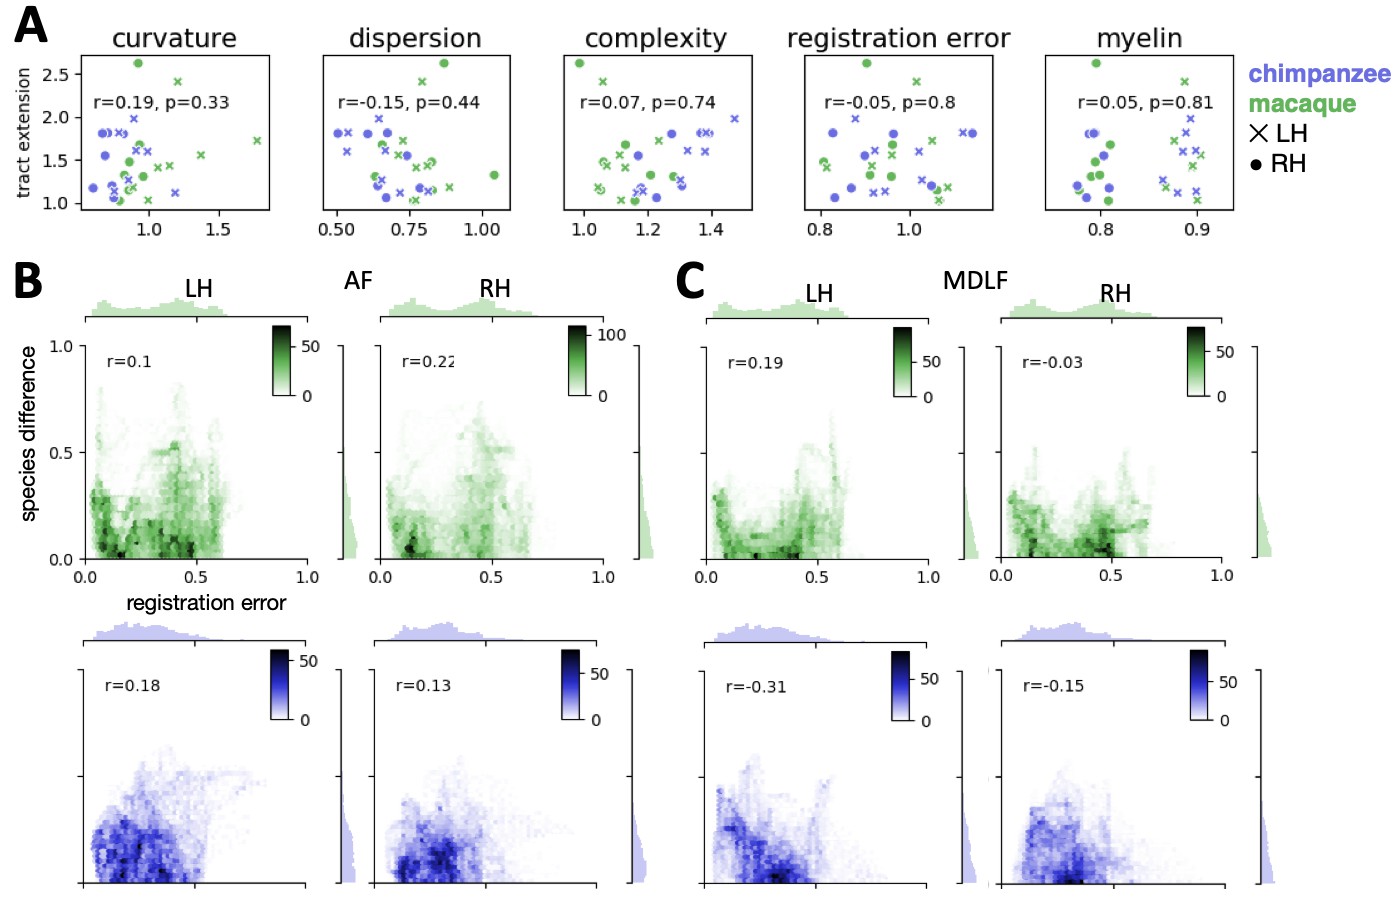
(A) Tract-wise correlation of tract extension ratio and potentially confounding factors (n = 28). Labels for tracts are not provided for readability, but can be inferred from Appendix 3—figure 2. For details refer to the text. (B, C) Whole-brain vertex-wise correlation of absolute species difference in actual and predicted tract map (B: AF; C: MDLF) and the registration error map (i.e. one minus the myelin correlation map in Appendix 2—figure 1). Marginal histograms show the distribution of vertices across 50 regular bins. The inset scale shows the number of vertices within the bins of the joint distribution scatterplot (color mapping as in A), n = 20252 vertices, p<0.001 for all correlations in B and C.
Tables
Key resources table
| Reagent type (species) or resource | Designation | Source or reference | Identifiers | Additional information |
|---|---|---|---|---|
| Software, algorithm | FSL | http://fsl.fmrib.ox.ac.uk/fsl/ | RRID:SCR_002823 | |
| Software, algorithm | FreeSurfer | http://surfer.nmr. mgh.harvard.edu/ | RRID:SCR_001847 | |
| Software, algorithm | MSM | https://fsl.fmrib.ox.ac. uk/fsl/fslwiki/MSM | RRID:SCR_002823 | MSM is available as part of FSL. Code for MSM using higher-order smoothness constrains is available online at https://www.doc.ic.ac.uk/~ ecr05/MSM_HOCR_v2/ |
| Software, algorithm | Connectome Workbench | http://www.nitrc.org/projects/workbench | RRID:SCR_008750 |
Additional files
-
Supplementary file 1
Supplementary table related to methods.
MSM configuration parameters for the registration of individual subject myelin maps prior to averaging to create a species myelin map. The parameters were kept constant for the three species and for both hemispheres.
- https://cdn.elifesciences.org/articles/53232/elife-53232-supp1-v2.docx
-
Supplementary file 2
Supplementary table related to methods ‘myelin-based surface registration’.
MSM configuration parameters. Settings for the MSM command for registrations using the macaque data as input (left panel) and chimpanzee data as input (right panel). The described ‘step’ refers to the numbering in Appendix 1—figure 1A. Parameters were identical for the left and right hemisphere.
- https://cdn.elifesciences.org/articles/53232/elife-53232-supp2-v2.docx
-
Transparent reporting form
- https://cdn.elifesciences.org/articles/53232/elife-53232-transrepform-v2.docx
-
Appendix 3—figure 2—source data 1
Numerical data underlying the quantifications shown in Figure 5A,B and in Appendix 3—figure 2.
The values are organized as a table that stores dice coefficients and tract extension ratios for each individual comparison of human vs. macaque or chimpanzee subjects.
- https://cdn.elifesciences.org/articles/53232/elife-53232-app3-fig2-data1-v2.csv
Download links
A two-part list of links to download the article, or parts of the article, in various formats.
Downloads (link to download the article as PDF)
Open citations (links to open the citations from this article in various online reference manager services)
Cite this article (links to download the citations from this article in formats compatible with various reference manager tools)
Cross-species cortical alignment identifies different types of anatomical reorganization in the primate temporal lobe
eLife 9:e53232.
https://doi.org/10.7554/eLife.53232


