Rapid sex-specific adaptation to high temperature in Drosophila
- Institut für Populationsgenetik, Vetmeduni Vienna, Austria
- Vienna Graduate School of Population Genetics, Vetmeduni Vienna, Austria
- Department of Biological and Experimental Psychology, Queen Mary University of London, United Kingdom
Figures
Figure 1 with 2 supplements
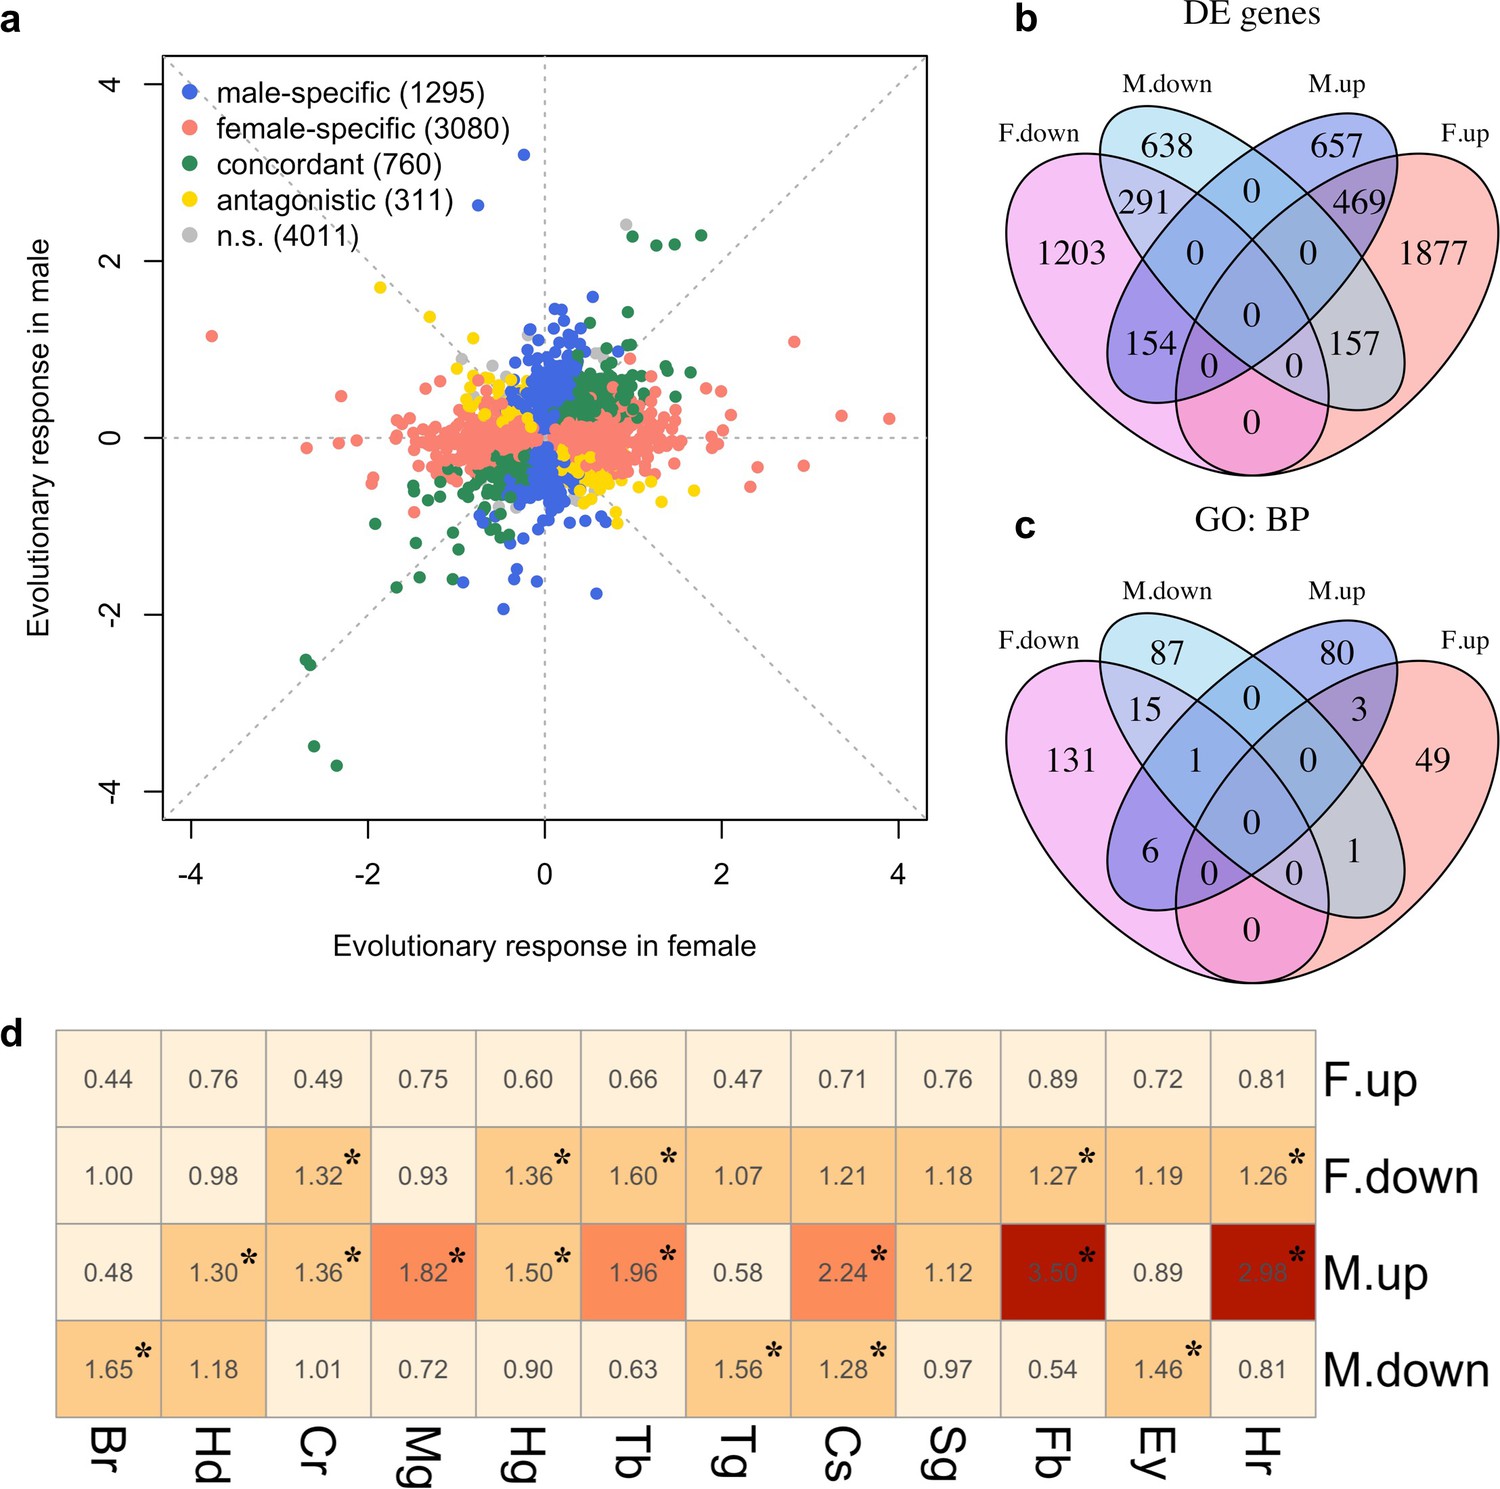
Sex-specific gene expression evolution adapting to a high temperature.
(a) Evolution of gene expression in females (x axis) and males (y axis). The evolutionary changes of all expressed genes are shown on log2 scale. Genes showing different patterns of evolution are highlighted in different colors. (b) The majority of the genes with significant expression changes is sex-specific. Venn diagram showing the number of genes with significantly different gene expression patterns (DE: Differential Expression; M.up/F.up: males/females evolved higher gene expression, M.down/F.down: males/females evolved lower gene expression). (c) Genes with evolved expression changes in males and females are involved in nearly mutually exclusive sets of biological processes. Venn diagram of sets of GO (Gene ontology: biological processes) terms enriched by the genes changing their expression for each direction in each sex (i.e. four sets of candidate genes: up/down-regulation in males/females). For instance, there are only three biological processes repeatedly found among the 90 and 53 processes involving up-regulated genes in males and females respectively. (d) The tissue enrichment of genes significantly evolving for either direction in males and females (Br-brain, Hd-head, Cr-crop, Mg-midgut, Hg-hindgut, Tb-malpighian tubule, Tg-thoracoabdominal ganglion, Cs-carcass, Sg-salivary gland, Fb-fat body, Ey-eye and Hr-heart). Each cell represents the result of a Fisher’s exact test. The colors and numbers denote the magnitude of odds ratio and statistical significance (FDR < 0.05) is indicated with *. Consistent with GO enrichment results, gene expression evolution in males and females may occur in different tissues.
Figure 1—figure supplement 1
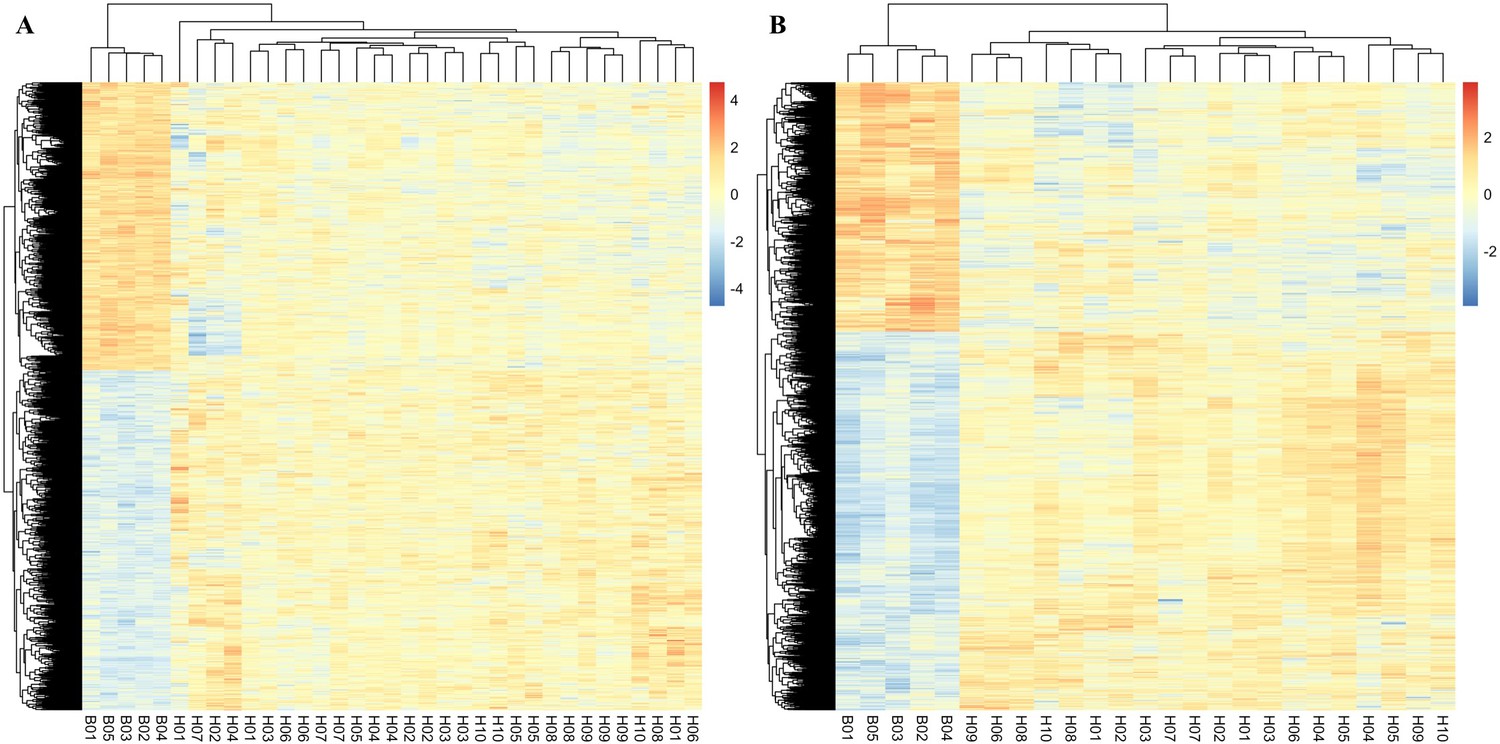
Parallel responses of adaptive genes across replicates.
Normalized expression of significant genes identified in males (A) and females (B). The heat color indicates the expression of each gene in each sample. Comparing ancestral samples (B01–B05) to each of the evolved samples (H01–H10), 91% and 87% of the candidate genes in males and females change their expression to the same direction in all replicates, respectively.
Figure 1—figure supplement 2
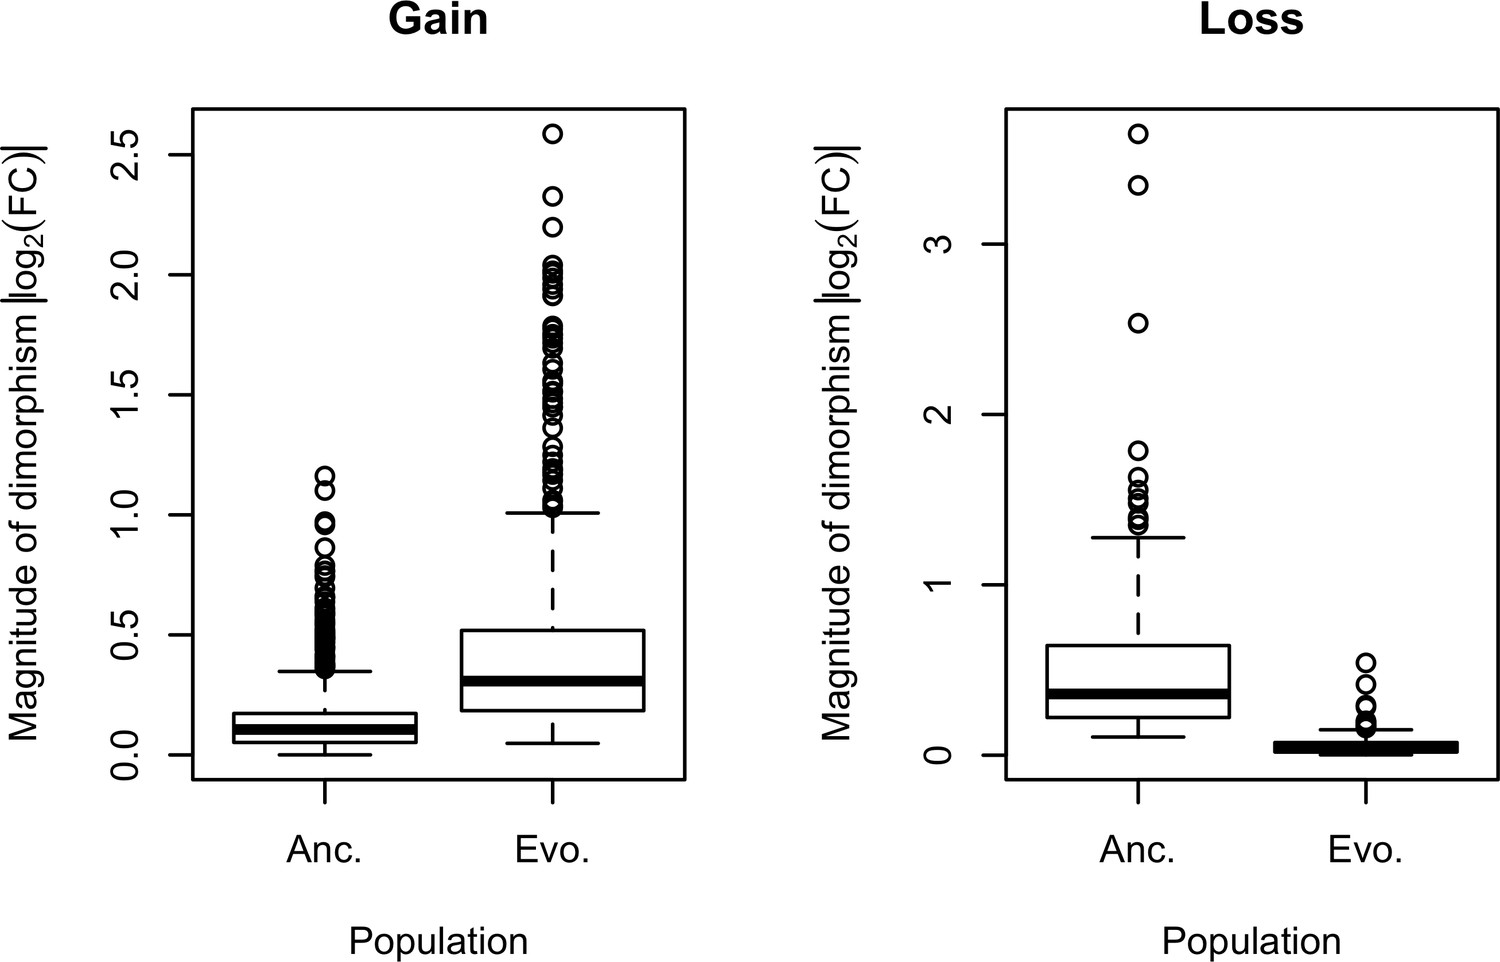
Evolution of sexual dimorphism.
During the adaptation to the hot laboratory environment, 673 ancestrally unbiased genes evolved to exhibit significant expression dimorphism after 100 generations. Meanwhile, 136 genes evolved for a reduction in their sexual dimorphism. Sexual dimorphism can be dynamic when the underlying sex-specific fitness landscapes change over time. Selection on the standing genetic variation in the sex-biased regulatory architecture would tune the gain and loss of sexual dimorphism.
Figure 2 with 2 supplements
Sex-specific phenotypic evolution.
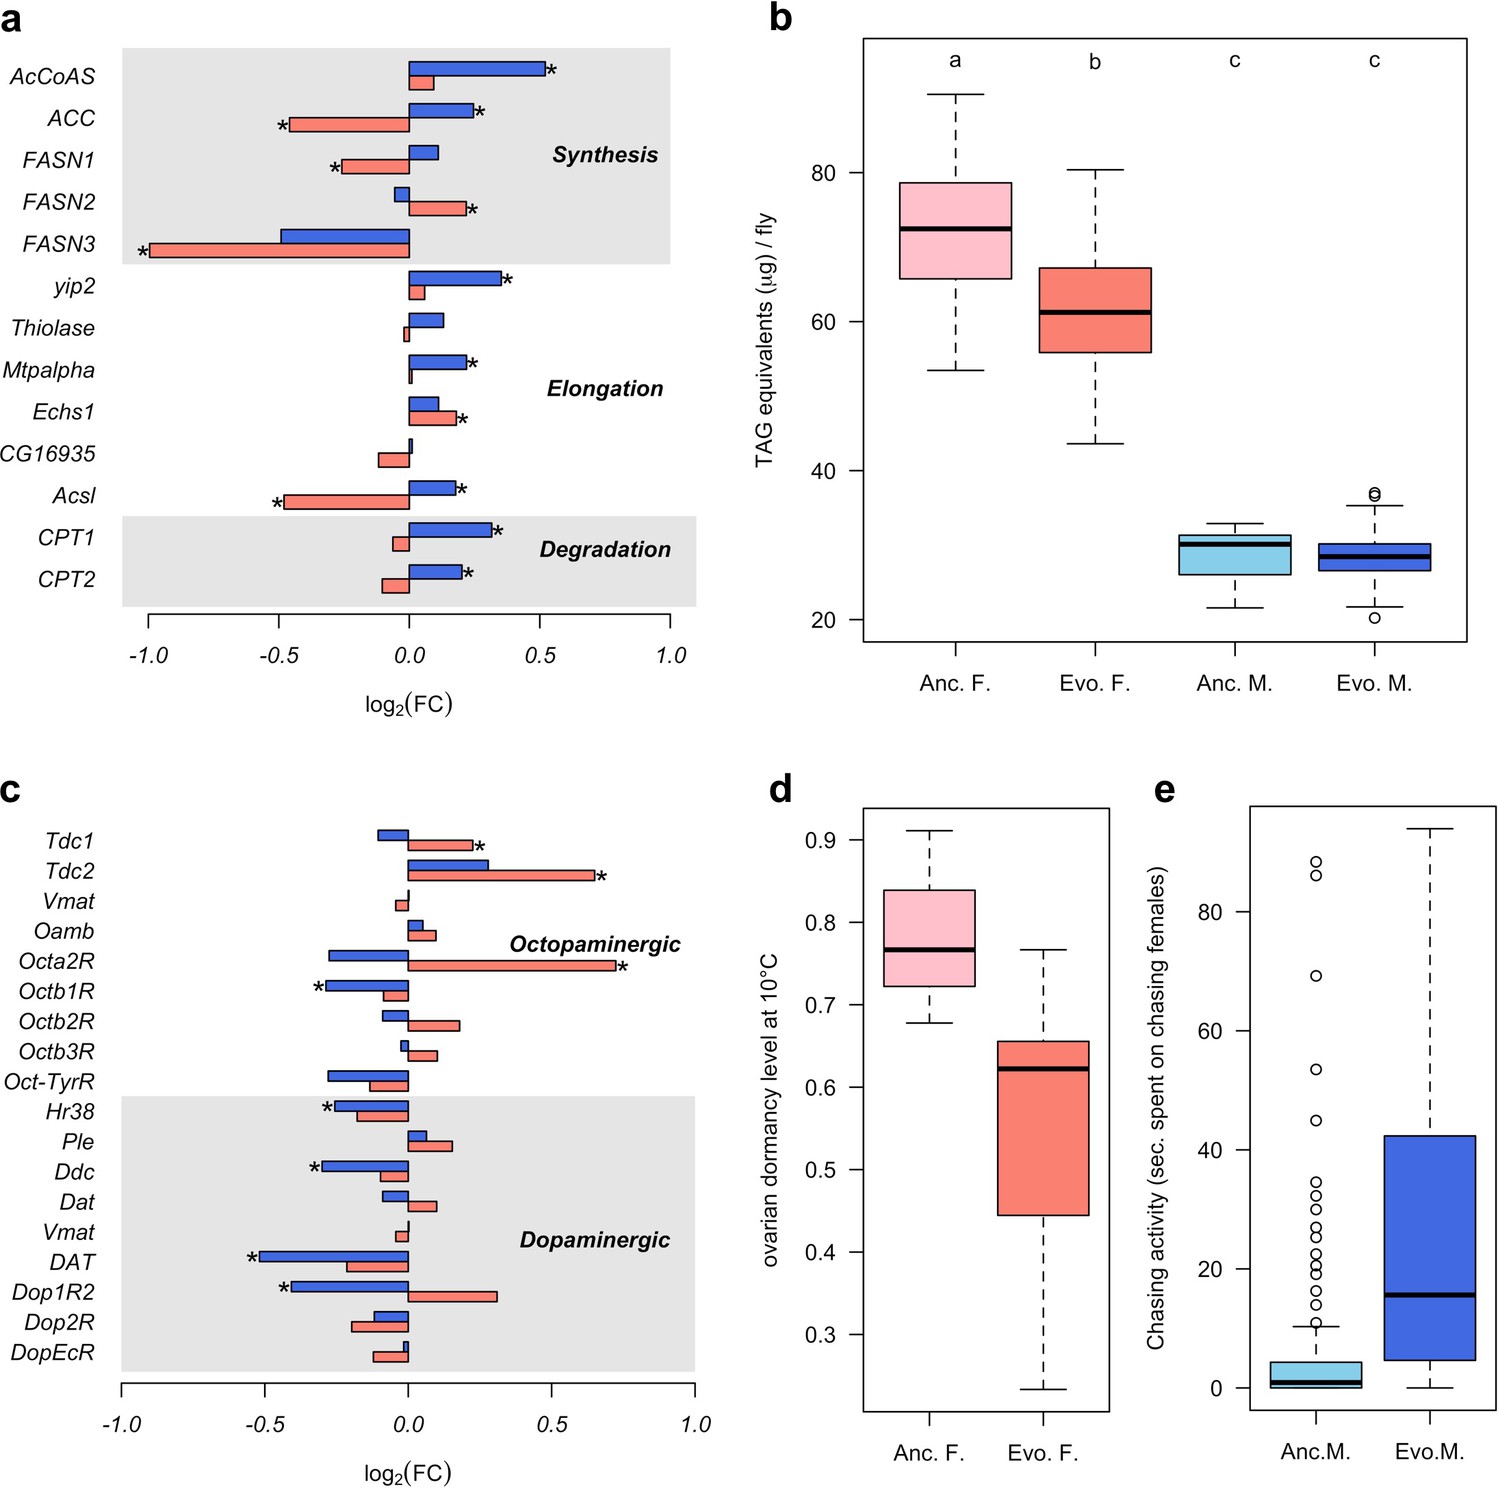
(a and c) Genes involved in fatty acid metabolism and monoaminergic neural signaling evolve in response to high temperature. The evolutionary changes in males (blue bar) and females (red bar) are shown on log2 scale. Statistical significance (FDR < 0.05) is indicated with *. For both set of genes, the evolution is largely sex-specific or even sexually discordant. (b) Level of triglycerides, the main constituent of body fat data from Barghi et al. (2019). Evolved females have significantly lower fat content than the ancestral ones. No significant difference is found in males. Two-way ANOVA and Tuckey’s HSD test. (d) Ovarian dormancy incidence at 10°C in ancestral and evolved females. Evolved females have a lower dormancy incidence than ancestral ones (Wilcoxon’s test, W = 1.5, p=0.028). (e) Time males chasing females. Evolved males spent significantly more time chasing females (Wilcoxon’s test, W = 1323.5, p<0.001).
Figure 2—figure supplement 1
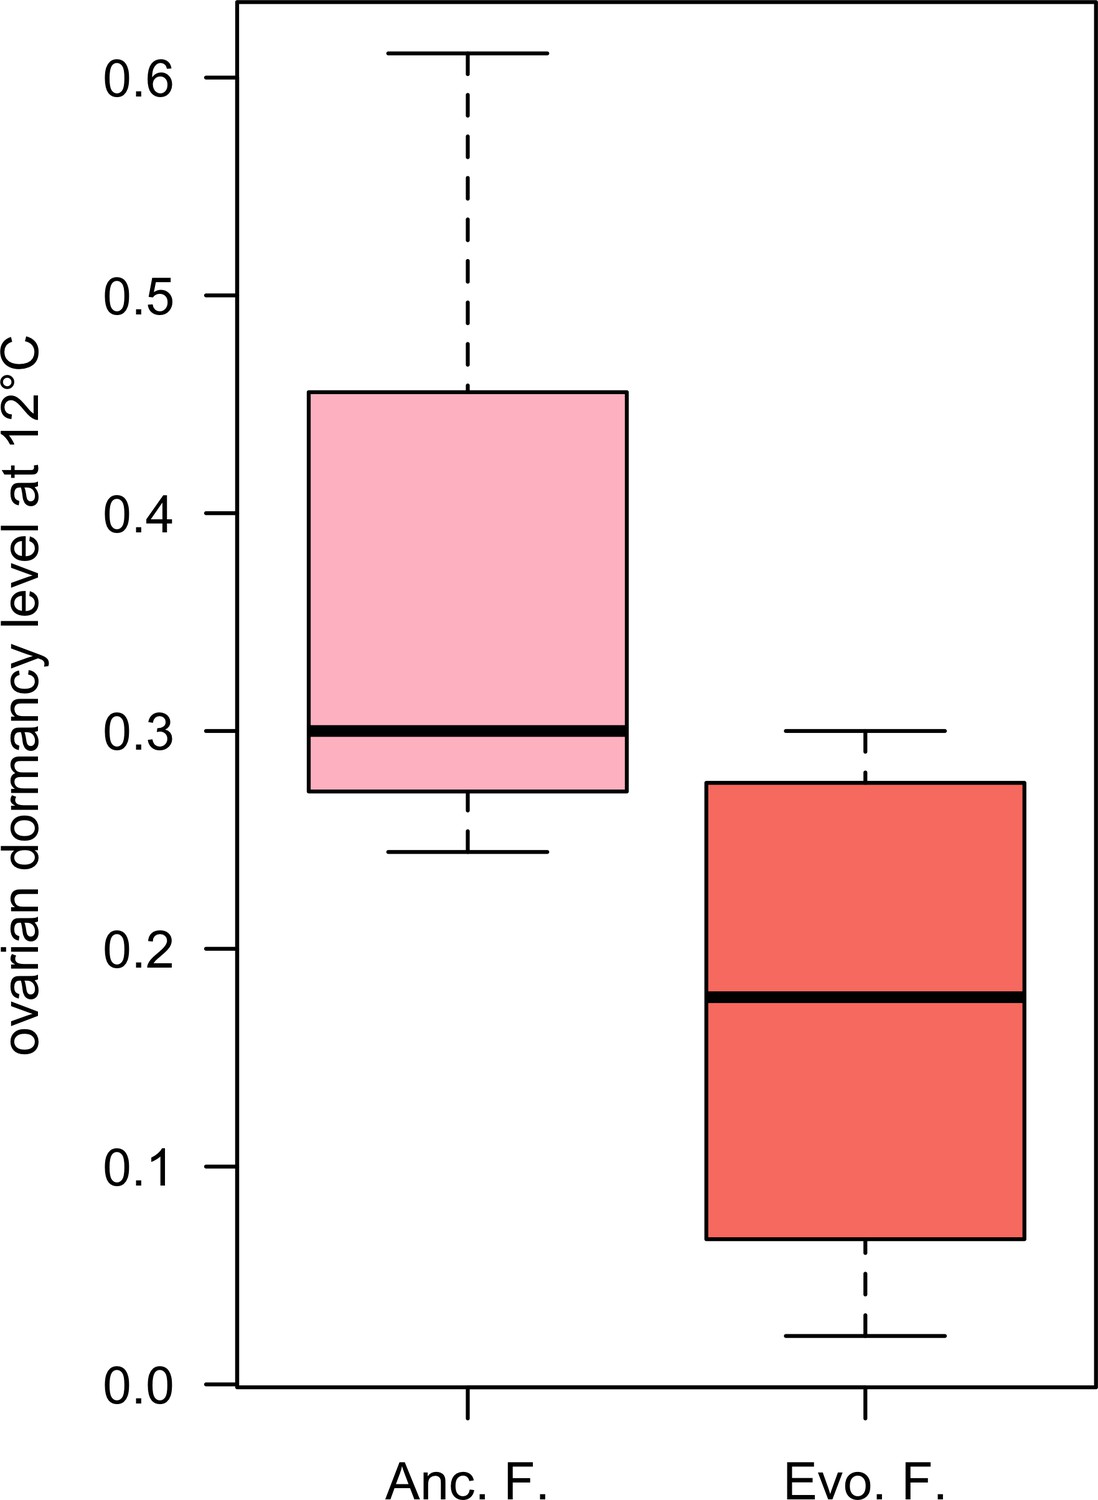
Ovarian dormancy incidence at 12°C.
Evolved females have a lower dormancy incidence than ancestral ones (Wilcoxon’s test, W = 3.5, p=0.061).
Figure 2—figure supplement 2
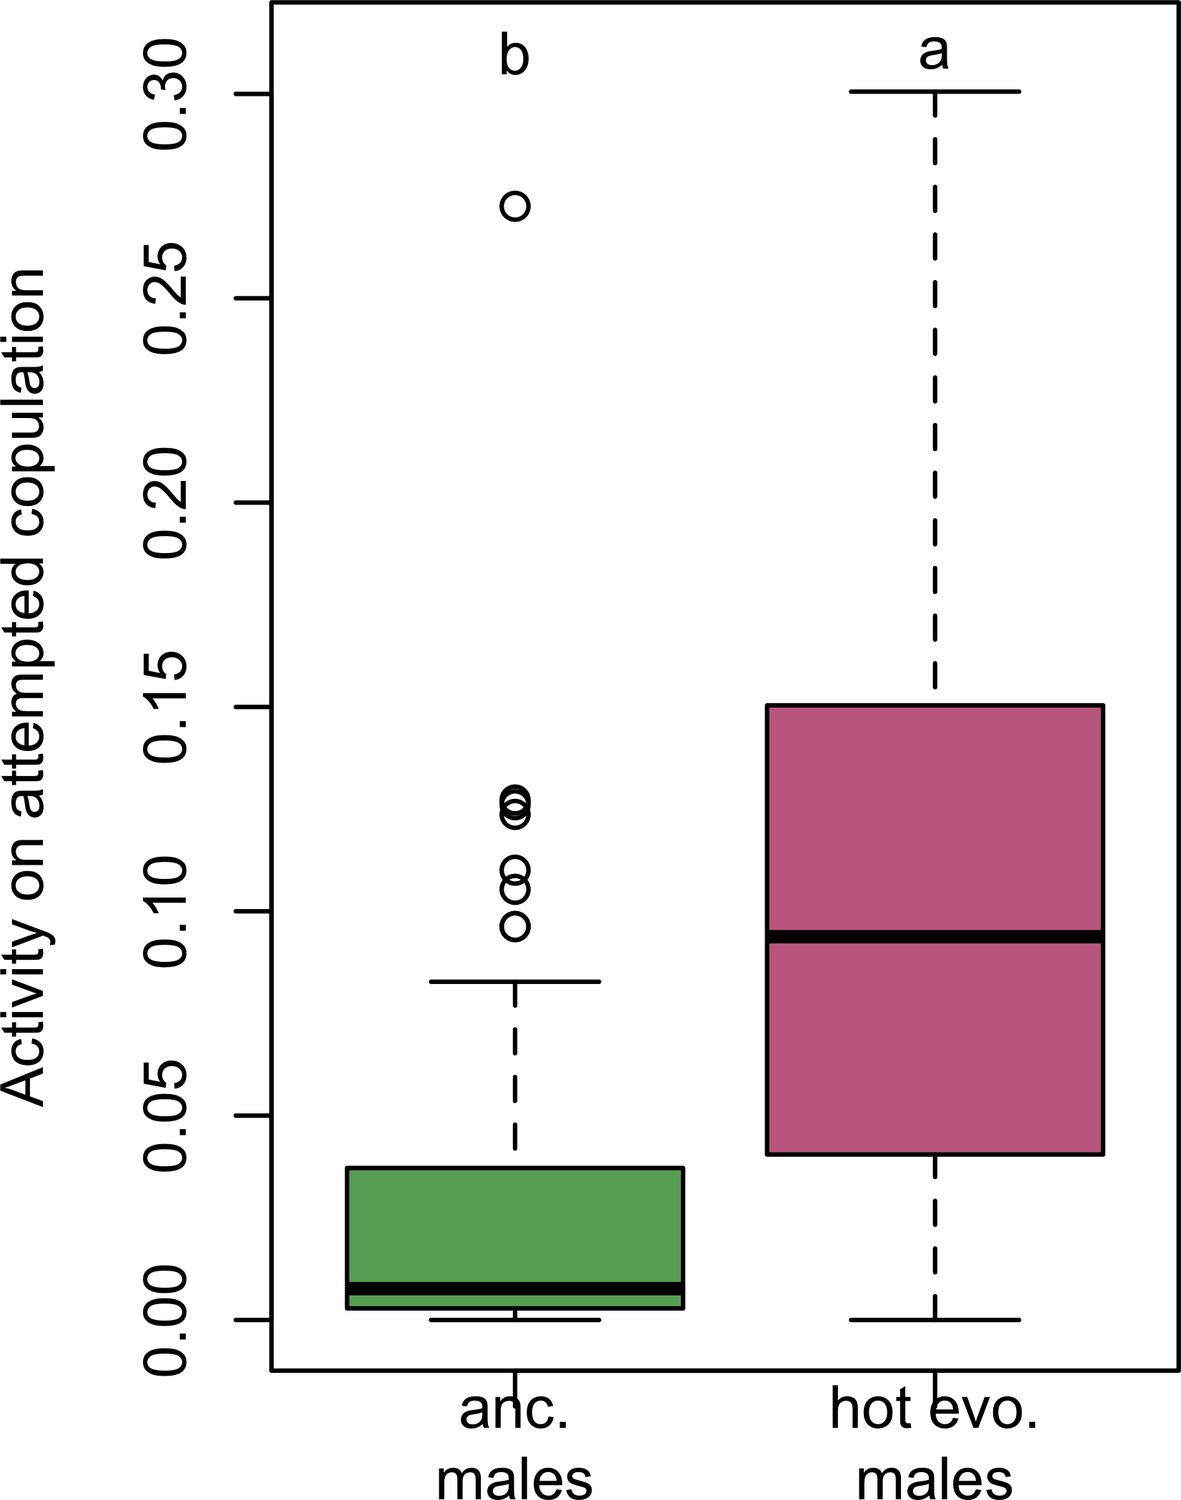
Time male flies attempting to copulate.
Evolved males spent significantly more time chasing females (Wilcoxon’s test, W = 1174, p<0.001).
Figure 3
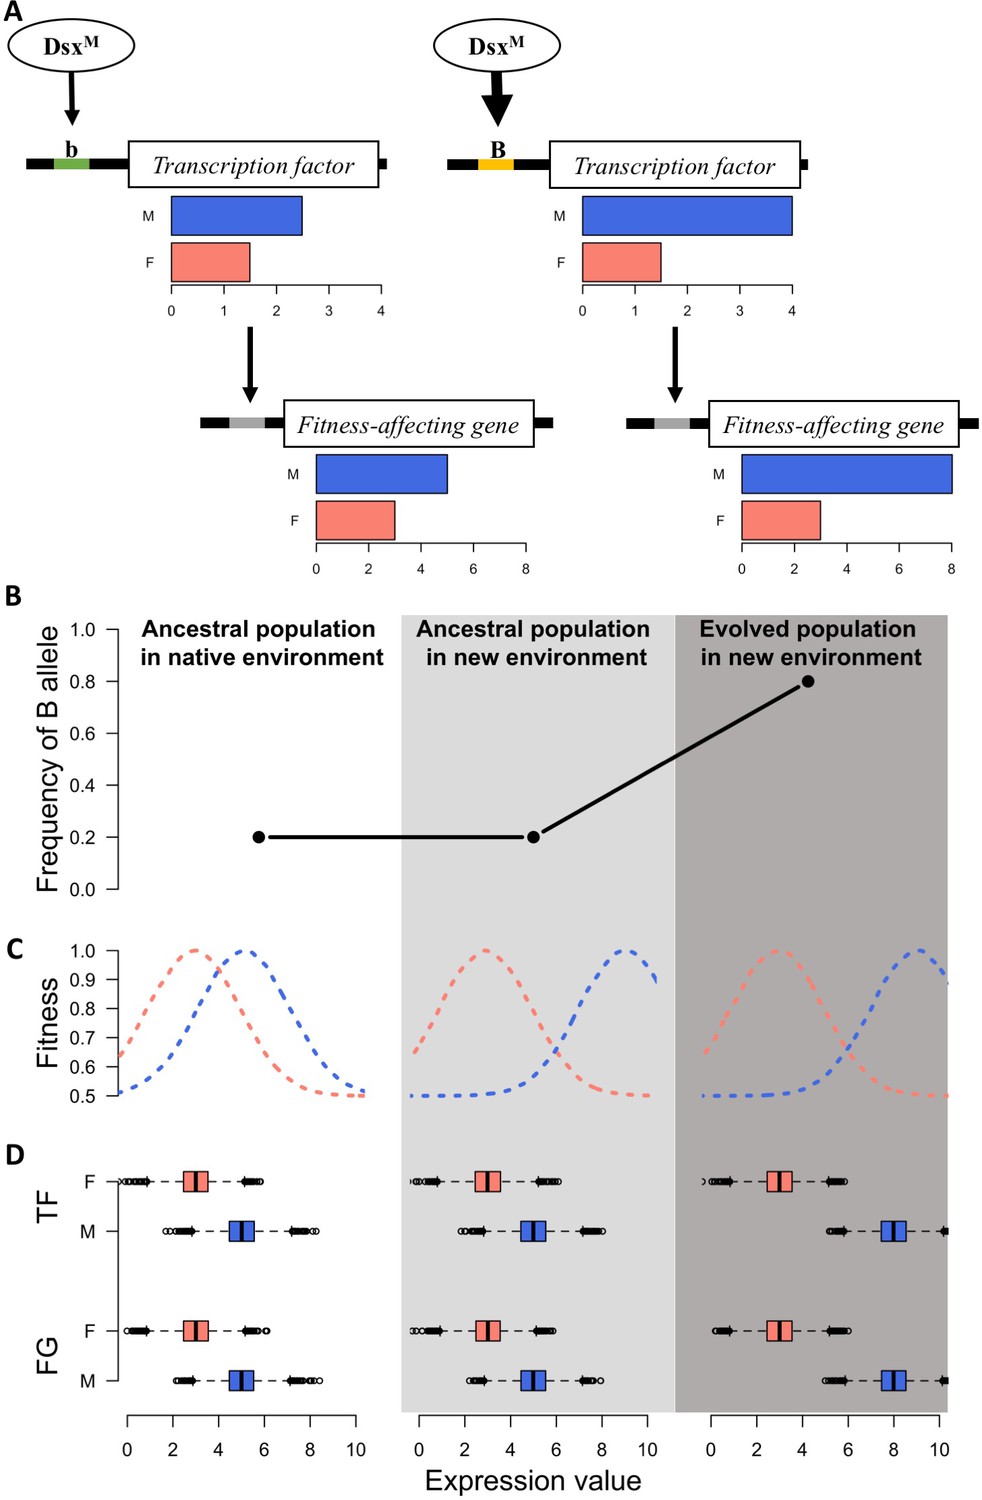
A simple model for rapid evolution of sex-specific adaptation.
Regulatory variation segregating at a transcription factor is selected for a more pronounced difference in gene expression between sexes. This also causes more pronounced expression differences in a downstream gene satisfying the altered requirements of the two sexes in the new environment. (A) Regulatory cascade of a transcription factor (TF) controlled by sex-specific isoforms of Dsx. Two alleles with different binding affinity (B > b) with DsxM but not with DsxF are regulating downstream genes affecting fitness (FG). (B) Frequency of the allele increasing sex bias (B allele) at three different stages: in the native (natural) environment, in the new hot environment at the start of the experiment, in the new hot environment at the end of the experiment. (C) Fitness landscape at the three different stages. (D) Expression of TF and FG in males and females at the different stages. After 100 generations, the frequency increase of the allele increasing sex-biased expression of the TF results in a resolved intra-locus conflict.
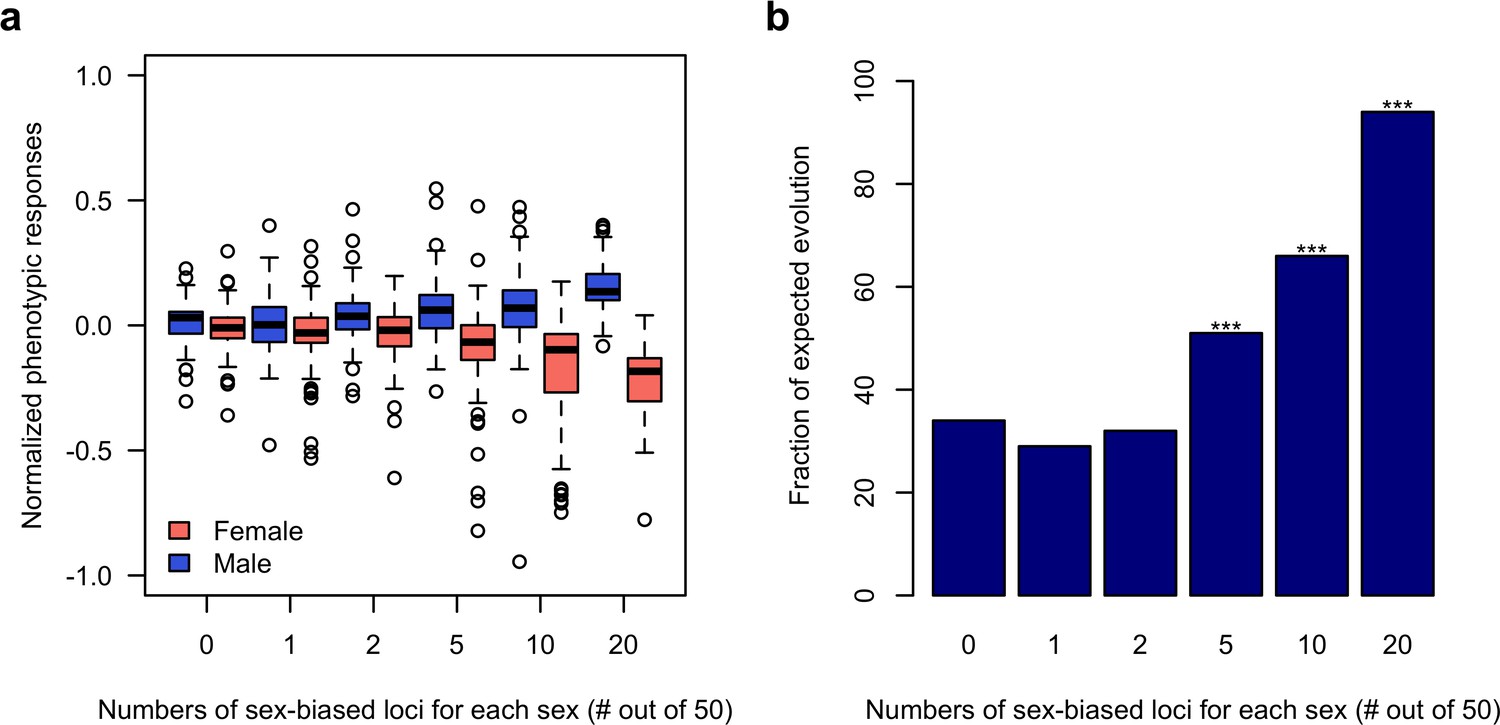
Figure 4 with 1 supplement
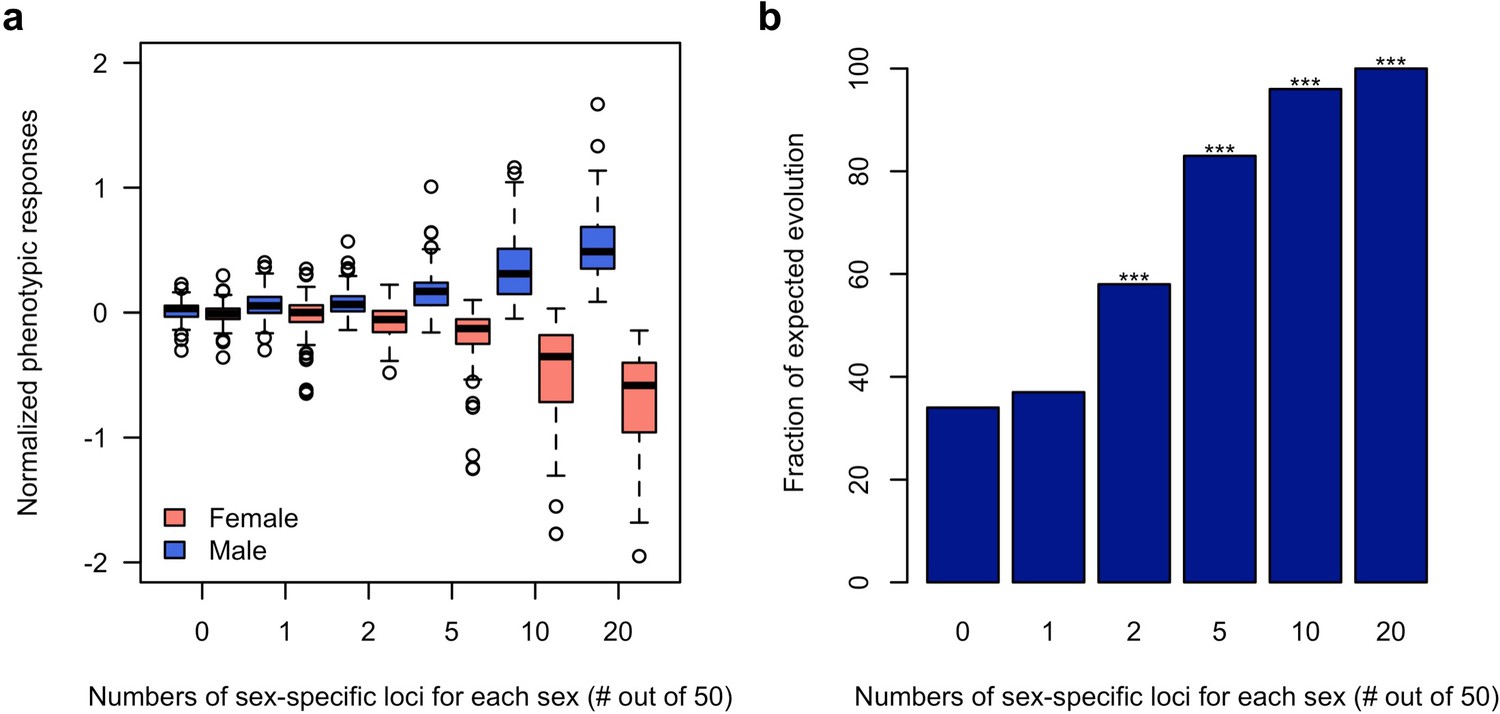
Rapid decoupling of the phenotypic response to sexually discordant trait optima by a few sex-specific loci.
(a) The phenotypic response of a trait controlled by 50 loci after 100 generations of sexually discordant selection. Different numbers of sex-specific loci in each sex are shown. For each scenario, 100 independent computer simulations were performed. The normalized phenotypic change is calculated as the ratio between phenotypic change and phenotypic variance of the ancestral population. (b) Fraction of simulations for which the focal trait increases in males but decreases in females. The statistical significance denoted by an asterisk is based on one-sample proportion test comparing to the control simulation without any sex-specific locus. Bonferroni’s correction is applied. Already two sex-specific loci in each sex significantly decouples the phenotypic responses to the discordant selection. With increasing numbers of sex-specific loci, the difference between the sex-specific phenotypic responses becomes more pronounced.
Figure 4—figure supplement 1
Sex-specific responses to discordant selection via sex-biased loci.
(a) The phenotypic response of a trait controlled by 50 loci after 100 generations of sexually discordant selection. Different numbers of sex-biased loci in each sex are shown. For each scenario, 100 independent computer simulations were performed. The normalized phenotypic change is calculated as the ratio between phenotypic change and phenotypic variance of the ancestral population. (b) Fraction of simulations in which there’s a simultaneous increase in male but decrease in females of the focal trait. The statistical significance denoted by ‘*” is based on one-sample proportion test comparing to the control simulation without any sex-biased locus. Bonferroni’s correction is applied.
Additional files
-
Supplementary file 1
Likelihood ratio test for different contrasts.
The file records the design matrix and results of likelihood ratio test for three different contrasts between (1) evolved and ancestral samples in males, (2) evolved and ancestral samples in females and (3) male and female samples.
- https://cdn.elifesciences.org/articles/53237/elife-53237-supp1-v1.xlsx
-
Supplementary file 2
Gene ontology (GO) enrichment analysis on genes of interest.
Results of gene ontology enrichment analysis using topGO among different sets of genes showing distinct expression changes were shown.
- https://cdn.elifesciences.org/articles/53237/elife-53237-supp2-v1.xlsx
-
Supplementary file 3
Enrichment analysis of genes highly expressed in each tissue among the genes of interest.
In this file, we reported the results of Fisher’s exact test for enrichment of genes highly expressed in each tissue among the genes of interest and the list of genes that are highly expressed in each tissue.
- https://cdn.elifesciences.org/articles/53237/elife-53237-supp3-v1.xlsx
-
Supplementary file 4
All expressed TFs annotated by RcisTarget and their evolutionary patterns.
The genomic position, sex-specific evolutionary pattern and gene description of all expressed transcription factors (TFs) annotated by RcisTarget are shown.
- https://cdn.elifesciences.org/articles/53237/elife-53237-supp4-v1.xlsx
-
Supplementary file 5
Enrichment of cis-regulatory elements and identification of putative TFs among genes of interest.
The outputs of RcisTarget that test for enrichment of cis-regulatory elements among each set of genes of interest are shown. The identities, expression patterns, and functional descriptions of the TFs that putatively regulates genes of interest are summarized.
- https://cdn.elifesciences.org/articles/53237/elife-53237-supp5-v1.xlsx
-
Supplementary file 6
TFs that regulate sex-biased expression, expression evolution and showed significant evolution in their expression.
A list of candidate TFs that satisfy the three criteria supporting the hypothesis that selection on sex-biased transcription factors may facilitate rapid sex-specific evolution in gene expression.
- https://cdn.elifesciences.org/articles/53237/elife-53237-supp6-v1.xlsx
-
Supplementary file 7
Mapping statistics.
Mapping statistics of all the samples involved in the tests in this study are reported.
- https://cdn.elifesciences.org/articles/53237/elife-53237-supp7-v1.xlsx
-
Supplementary file 8
Robustness of the estimation of allometric coefficients (α).
The Robustness of the estimation was evaluated with Jackknife sampling. The correlation of the estimates between each pair of Jackknife samples are reported.
- https://cdn.elifesciences.org/articles/53237/elife-53237-supp8-v1.xlsx
-
Supplementary file 9
Prediction accuracy of the whole body expression using the estimated allometric coefficients (α) and the expression profiles in dissected samples.
For each Jackknife sampling, the estimated allometric coefficients (α) were applied to predict the whole body expression of the left-out sample based on its expression profiles in gonad and carcass. Pearson’s correlation between the true and predicted values were reported.
- https://cdn.elifesciences.org/articles/53237/elife-53237-supp9-v1.xlsx
-
Supplementary file 10
Numeric example for the allometric estimation.
An allometric estimate (αi) measures the abundance of a gene in gonads relative to the overall (mean) abundance in the whole body, reflecting the relative size of gonad in whole body. It may differ between populations. Genes with different expression levels in each tissue (gene1 in the figure) would be affected and thus are informative for the estimation. However, for genes with similar expression in different tissues (gene2 in the figure), they would be affected and the estimation of would be meaningless.
- https://cdn.elifesciences.org/articles/53237/elife-53237-supp10-v1.zip
-
Supplementary file 11
Allometric estimate of gonadal tissues in whole bodies of each gene.
An allmoetric estimate (αi) is the coefficient measuring the abundance of a gene in gonad relative to the overall abundance in the whole body. The distributions of the estimates differ significantly between evolved and ancestral populations in both sexes (Kolmogorov-Smirnov test, D = 0.18 and 0.12 for females and males, respectively; p<0.001 in both tests).
- https://cdn.elifesciences.org/articles/53237/elife-53237-supp11-v1.zip
-
Transparent reporting form
- https://cdn.elifesciences.org/articles/53237/elife-53237-transrepform-v1.docx
Download links
A two-part list of links to download the article, or parts of the article, in various formats.
Downloads (link to download the article as PDF)
Open citations (links to open the citations from this article in various online reference manager services)
Cite this article (links to download the citations from this article in formats compatible with various reference manager tools)
Rapid sex-specific adaptation to high temperature in Drosophila
eLife 9:e53237.
https://doi.org/10.7554/eLife.53237


