Landscape mapping of shared antigenic epitopes and their cognate TCRs of tumor-infiltrating T lymphocytes in melanoma
- Tumor Immunotherapy Program, Campbell Family Institute for Breast Cancer Research, Princess Margaret Cancer Centre, University Health Network, Canada
- Princess Margaret Cancer Centre, University Health Network, Canada
- Department of Immunology, University of Toronto, Canada
- Department of Surgical Oncology, University Health Network, Canada
- Department of Medical Biophysics, University of Toronto, Canada
- Campbell Family Institute for Breast Cancer Research, Princess Margaret Cancer Centre, University Health Network, Canada
- Department of Laboratory Medicine and Pathobiology, University Health Network, Canada
- Ontario Institute for Cancer Research, Canada
- Department of Medicine, University of Toronto, Canada
Figures
Figure 1 with 1 supplement
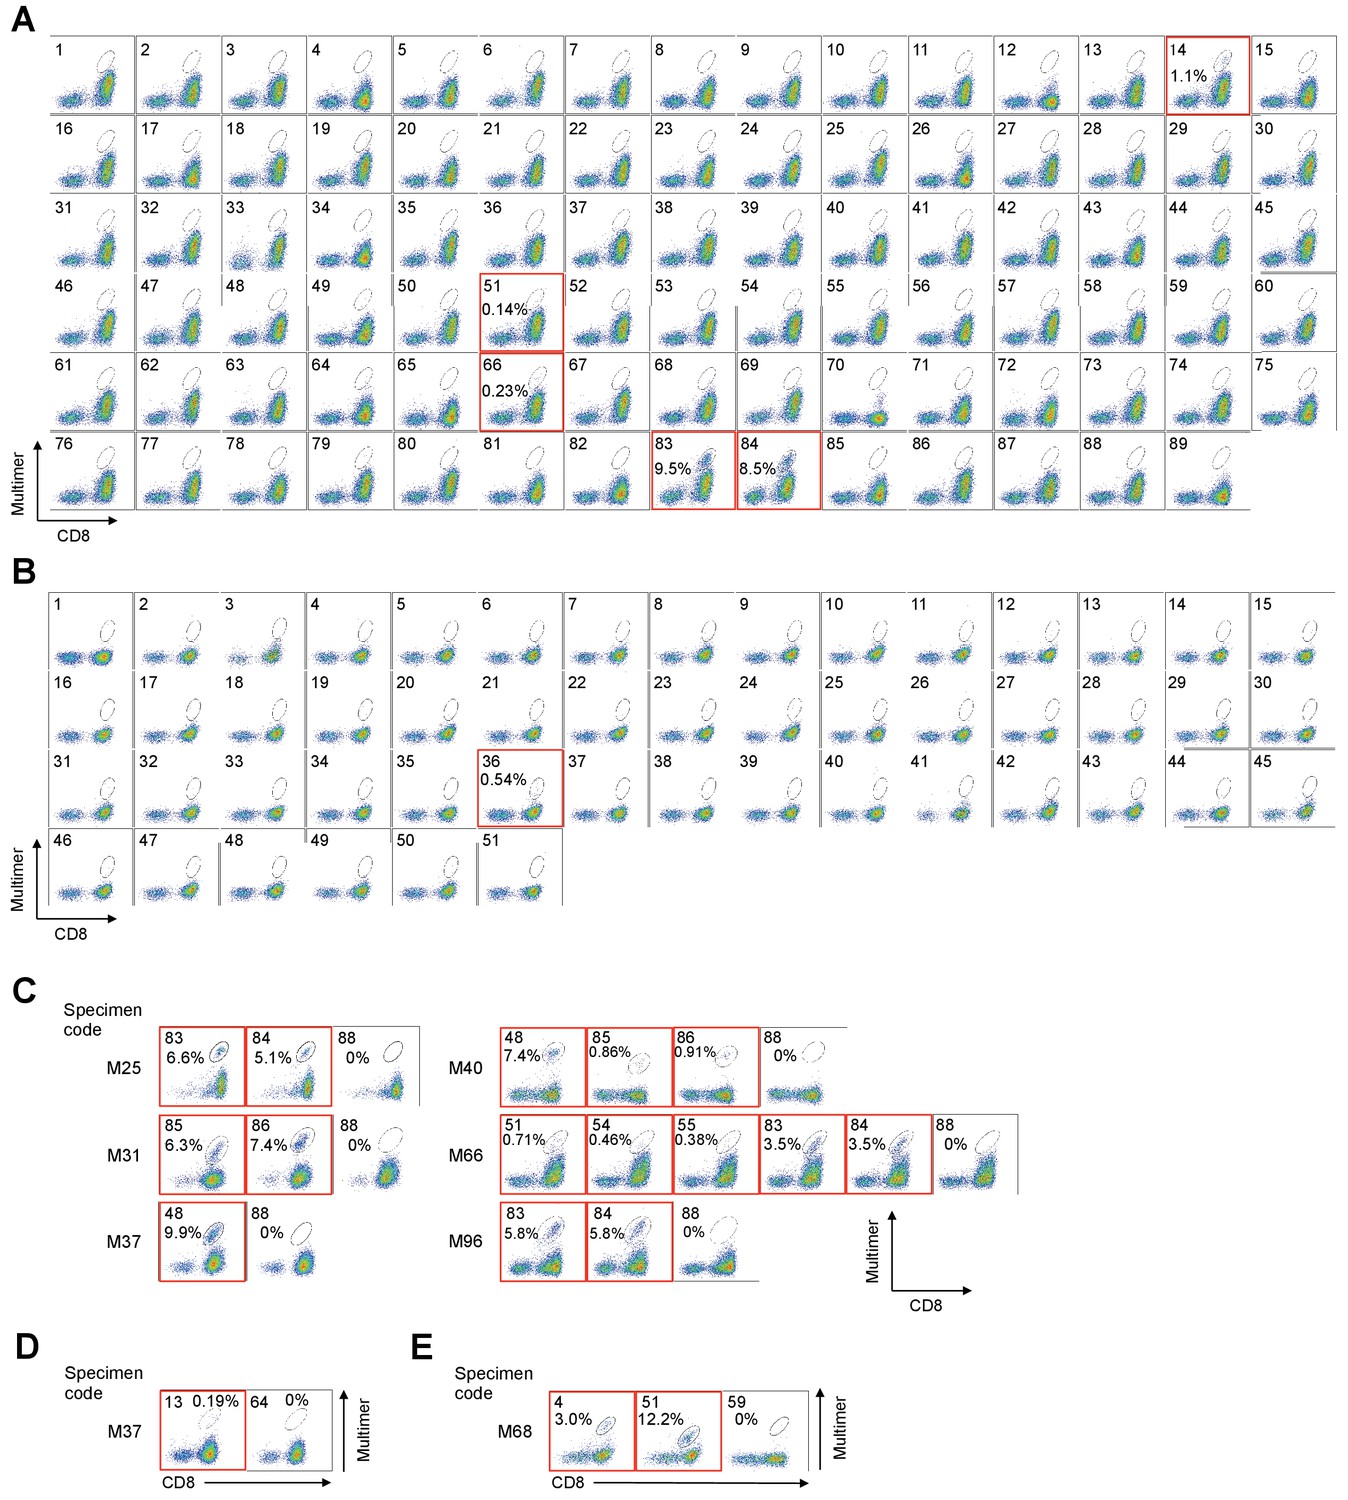
High−throughput staining of polyclonally expanded TILs with a panel of pHLA multimers.
(A, B) Staining of HLA-A*02:01+ (A) and C*05:01+ (B) M87 TILs with pHLA multimers whose peptides were previously known or predicted by publicly available algorithms. The peptides employed for the A*02:01 and C*05:01 multimers are shown in Supplementary files 1b and f, respectively. (A) The TILs showed positivity to the A*02:01/ABCB5700-708 (No. 14), A*02:01/gp100154-162 (No. 51), A*02:01/tyrosinase369-377 (No. 66), A*02:01/wild-type MART127-35 (No. 83), and A*02:01/heteroclitic MART126-35 (No. 84) multimers. (B) The TILs showed positivity to the C*05:01/tyrosinase460-468 (No. 36) multimer. The A*02:01/HIV pol476-484 (No. 87 in A), A*02:01/HTLV-1 tax11-19 (No. 88 in A), A*02:01/unexchanged (No. 89 in A), C*05:01/HIV rev67-75 (No. 50 in B), and C*05:01/unexchanged (No. 51 in B) multimers were used as negative controls. (C–E) Positive staining of TILs with a panel of pHLA multimers for HLA-A*02:01+ M25, M31, M37, M40, M66, and M96 TILs (C), HLA-A*24:02+ M37 TILs (D), and HLA-B*07:02+ M68 TILs (E). All the high-throughput staining data are shown in Figure 1—figure supplement 1. (C) M25 and M96 TILs showed positivity to the A*02:01/wild-type MART127-35 (No. 83) and A*02:01/heteroclitic MART126-35 (No. 84) multimers. M31 TILs showed positivity to the A*02:01/wild-type NY-ESO-1157-165 (No. 85) and A*02:01/heteroclitic NY-ESO-1157-165 (No. 86) multimers. M37 TILs showed positivity to the A*02:01/SSX241-49 (No. 48) multimer. M40 TILs showed positivity to the A*02:01/SSX241-49 (No. 48), A*02:01/wild-type NY-ESO-1157-165 (No. 85), and A*02:01/heteroclitic NY-ESO-1157-165 (No. 86) multimers. M66 TILs showed positivity to the A*02:01/gp100154-162 (No. 51), A*02:01/gp100209-217 (No. 54), A*02:01/gp100280-288 (No. 55), A*02:01/wild-type MART127-35 (No. 83), and A*02:01/heteroclitic MART126-35 (No. 84) multimers. (D) M37 TILs showed positivity to the A*24:02/gp100-intron4 (No. 13) multimer. (E) M68 TILs showed positivity to the B*07:02/NY-ESO-160-72 (No. 4) and B*07:02/MAGE-A1289-297 (No. 51) multimers. The A*02:01/HTLV-1 tax11-19 (No. 88 in C), A*24:02/HTLV-1 tax301-309 (No. 64 in D), and B*07:02/HIV nef128-137 (No. 59 in E) multimers were used as negative controls. The red squares highlight positive TIL staining with pHLA multimers. The percentage of multimer+ cells in CD8+ T cells is shown. The data shown are representative of two independent experiments.
Figure 1—figure supplement 1
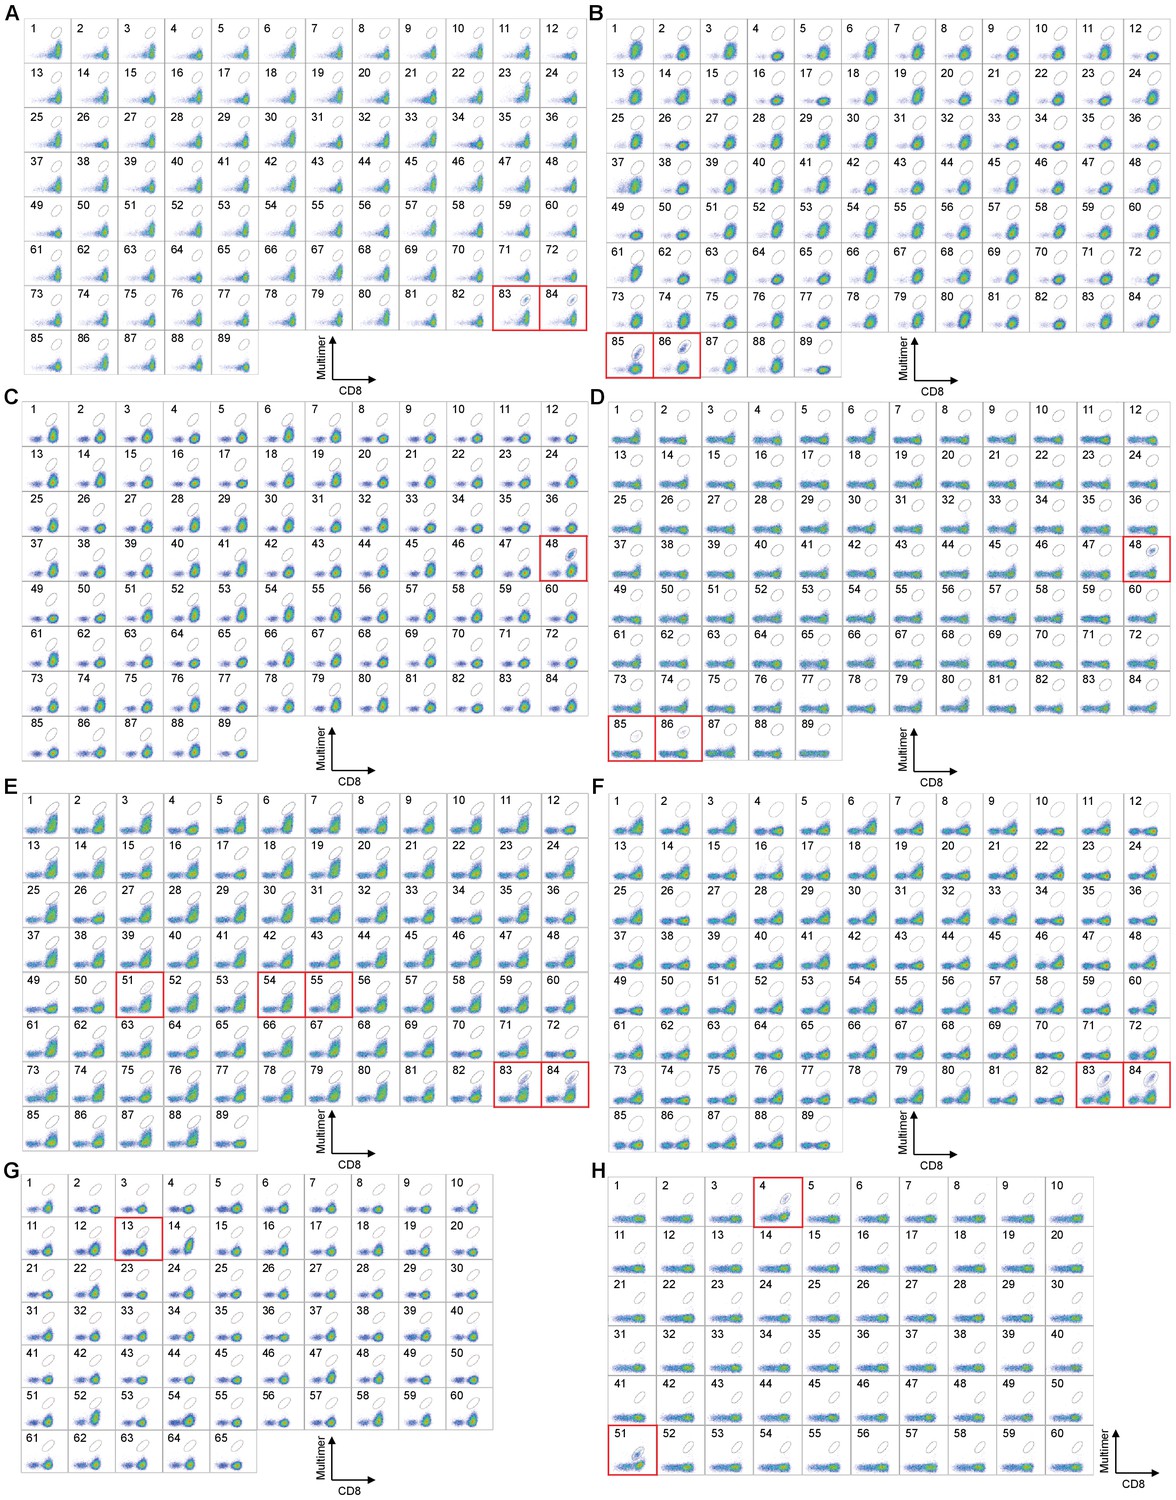
High-throughput staining of polyclonally expanded TILs with a panel of HLA-A*02:01, A*24:02, and B*07:02 multimers.
Staining of melanoma TILs with pHLA multimers whose peptides were previously known or predicted by publicly available algorithms for HLA-A*02:01+ M25 (A), M31 (B), M37 (C), M40 (D), M66 (E), and M96 (F), A*24:02+ M37 (G), and B*07:02+ M68 (H). The peptides employed for A*02:01, A*24:02, and B*07:02 multimers are shown in Supplementary files 1b-d, respectively. The red squares highlight positive staining with pHLA multimers. (A) HLA-A*02:01+ M25 TILs showed positivity to A*02:01/wild-type MART127-35 (No. 83) and A*02:01/heteroclitic MART126-35 (No. 84) multimers. (B) HLA-A*02:01+ M31 TILs showed positivity to A*02:01/wild-type NY-ESO-1157-165 (No. 85) and A*02:01/heteroclitic NY-ESO-1157-165 (No. 86) multimers. (C) HLA-A*02:01+ M37 TILs showed positivity to the A*02:01/SSX241-49 multimer (No. 48). (D) HLA-A*02:01+ M40 TILs showed positivity to A*02:01/SSX241-49 (No. 48), A*02:01/wild-type NY-ESO-1157-165 (No. 85), and A*02:01/heteroclitic NY-ESO-1157-165 (No. 86) multimers. (E) HLA-A*02:01+ M66 TILs showed positivity to A*02:01/gp100154-162 (No. 51), A*02:01/gp100209-217 (No. 54), A*02:01/gp100280-288 (No. 55), A*02:01/wild-type MART127-35 (No. 83), and A*02:01/heteroclitic MART126-35 (No. 84) multimers. (F) HLA-A*02:01+ M96 TILs showed positivity to A*02:01/wild-type MART127-35 (No. 83) and A*02:01/heteroclitic MART126-35 (No. 84) multimers. (G) HLA-A*24:02+ M37 TILs showed positivity to the A*24:02/gp100-intron4 multimer (No. 13). (H) HLA-B*07:02+ M68 TILs showed positivity to B*07:02/NY-ESO-160-72 (No. 4), B*07:02/MAGE-A1289-297 (No. 51). The A*02:01/HIV pol476-484 (No. 87 in A-F), A*02:01/HTLV-1 tax11-19 (No. 88 in A-F), A*02:01/unexchanged (No. 89 in A-F), A*24:02/HIV env584-592 (No. 63 in G), A*24:02/HTLV-1 tax301-309 (No. 64 in G), A*24:02/unexchanged (No. 65 in G), B*07:02/HIV nef128-137 (No. 59 in H), and B*07:02/unexchanged (No. 60 in H) multimers were used as negative controls. The percentage of multimer+ cells in CD8+ T cells is shown. The data shown are representative of two independent experiments.
Figure 2 with 1 supplement

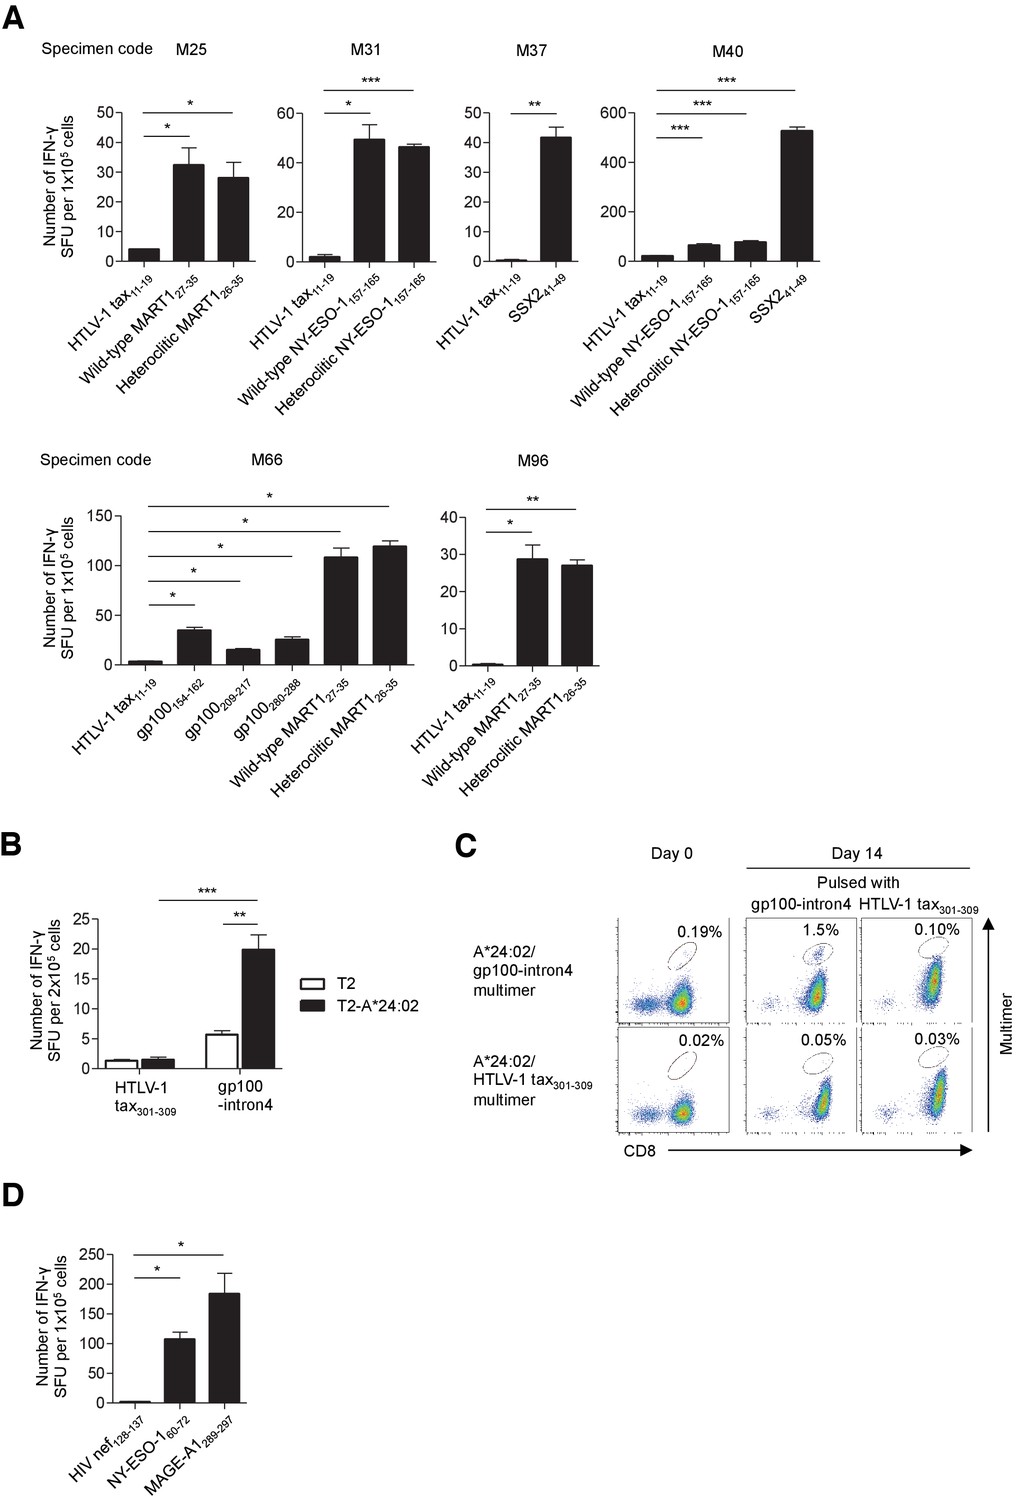
Functional assessment of multimer-positive melanoma TILs.
(A) IFN-γ production by M87 TILs in an HLA-A*02:01-restricted peptide-specific manner. T2 cells pulsed with the indicated peptide were used as stimulator cells. The HTLV-1 tax11-19 peptide was employed as a control. (B) IFN-γ production by C*05:01-positive M87 TILs in a C*05:01/tyrosinase460-468-specific manner. C*05:01-artificial APCs pulsed with tyrosinase460-468 or the HIV rev67-75 (control) peptide were employed as stimulator cells. (C) Expansion of C*05:01/tyrosinase460-468 T cells in M87 TILs in an HLA-restricted peptide-specific manner. The M87 TILs were stimulated with C*05:01-artificial APCs pulsed with the indicated peptide. Data for the C*05:01/tyrosinase460-468 multimer staining prior to stimulation (day 0) and 14 days after stimulation (day 14) are shown. The HIV rev67-75 peptide and C*05:01/HIV rev67-75 multimer were used as controls. (D) Expansion of A*02:01/gp100154-162 and A*02:01/tyrosinase369-377 T cells in M87 TILs in an HLA-restricted peptide-specific manner. The M87 TILs were stimulated with A*02:01-artificial APCs pulsed with the indicated peptide. Data for the A*02:01/gp100154-162 or A*02:01/tyrosinase369-377 multimer staining prior to stimulation (day 0) and 14 days after stimulation (day 14) are shown. The HIV pol476-484 peptide and A*02:01/HIV pol476-484 multimer were employed as controls. (E) IFN-γ production by M87 TILs in an A*02:01/gp100154-162-specific (left) or A*02:01/tyrosinase369-377-specific (right) manner following peptide-specific stimulation. M87 TILs stimulated with A*02:01-artificial APCs pulsed with the gp100154-162 or tyrosinase369-377 peptide were used as responder cells. T2 cells pulsed with the indicated peptide were employed as stimulator cells. The HIV pol476-484 peptide was used as a control. The percentage of multimer+ cells in CD8+ T cells is shown in (C) and (D). In (A), (B), and (E), the data shown represent the mean ± SD of experiments performed in triplicate. All the results are representative of at least two independent experiments. *p<0.05, **p<0.01, ***p<0.001. n.s., not statistically significant (two-tailed Welch’s t tests).
Figure 2—figure supplement 1
Functional assessment of multimer-positive melanoma TILs.
(A) IFN-γ production by A*02:01-positive TILs in an HLA-A*02:01-restricted peptide-specific manner. The indicated TILs were employed as responder cells in ELISPOT analysis. T2 cells pulsed with the indicated peptide were used as stimulator cells. The HTLV-1 tax11-19 peptide was employed as a control. (B) IFN-γ production by M37 TILs in an HLA-A*24:02-restricted peptide-specific manner. T2 cells or T2 cells transduced with HLA-A*24:02 (T2-A*24:02) pulsed with gp100-intron4 or the HTLV-1 tax301-309 (control) peptide were employed as stimulator cells. (C) Expansion of A*24:02/gp100-intron4 T cells in M37 TILs in an HLA-A*24:02-restricted peptide-specific manner. The M37 TILs were stimulated with A*24:02-artificial APCs pulsed with the indicated peptide. Data from staining with the indicated multimers before stimulation (day 0) and 14 days after stimulation (day 14) are shown. The HTLV-1 tax301-309 peptide and A*24:02/HTLV-1 tax301-309 multimer were used as controls. The percentage of multimer+ cells in CD8+ T cells is shown. (D) IFN-γ production by B*07:02-positive M68 TILs in an HLA-B*07:02-restricted peptide-specific manner. B*07:02-artificial APCs pulsed with the indicated peptide were used as stimulator cells. The HIV nef128-137 peptide was employed as a control. In (A), (B), and (D), the data shown represent the mean ± SD of experiments performed in triplicate. All the results are representative of at least two independent experiments. *p<0.05, **p<0.01, ***p<0.001 (two-tailed Welch’s t tests).
Figure 3
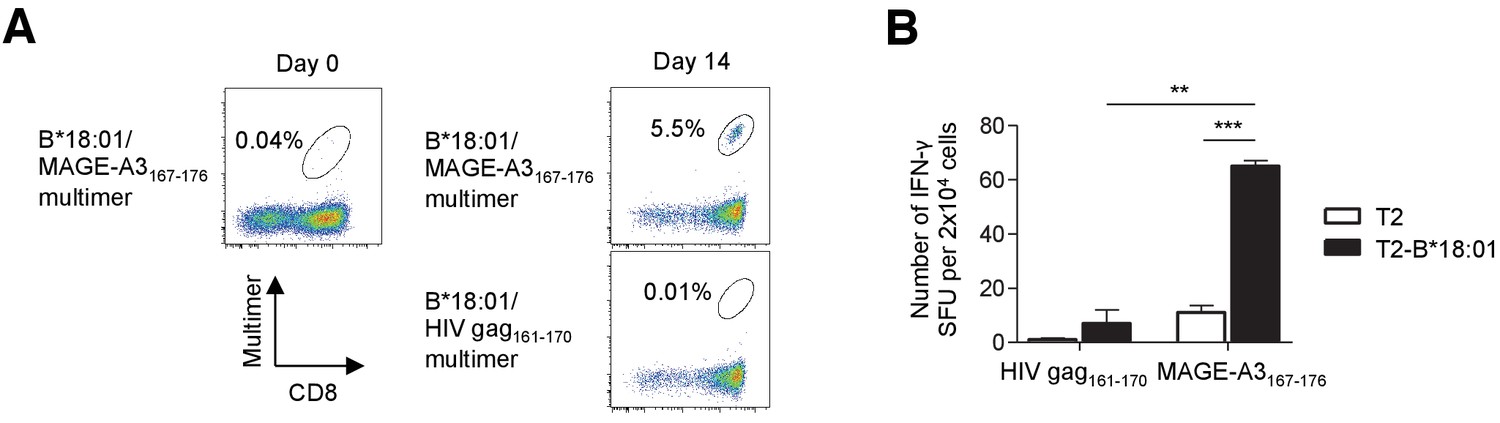
Identification of low-frequency antigen-specific T cells following peptide-specific expansion.
CD8+ T cells isolated from M40 TILs were stimulated with B*18:01-artificial APCs pulsed with 10 μg/ml MAGE-A3167-176 peptide and cultured with 10 IU/ml IL-2, 10 ng/ml IL-15, and 30 ng/ml IL-21 for 14 days. (A) Data from staining with the indicated multimers before stimulation (day 0) and 14 days after stimulation (day 14) are shown. The B*18:01/HIV gag161-170 multimer was used as a control. The percentage of multimer+ cells in CD8+ T cells is shown. (B) IFN-γ production by the M40 TILs in a B*18:01/MAGE-A3167-176-specific manner following peptide-specific stimulation. CD8+ T cells stimulated with B*18:01-artificial APCs pulsed with the MAGE-A3167-176 peptide were employed as responder cells in IFN-γ ELISPOT analysis. T2 cells or T2 cells transduced with HLA-B*18:01 (T2-B*18:01) pulsed with MAGE-A3167-176 or the HIV gag161-170 control peptide were used as stimulator cells. The data shown represent the mean ± SD of experiments performed in triplicate. All the results are representative of at least two independent experiments. **p<0.01, ***p<0.001 (two-tailed Welch’s t tests).
Figure 4 with 1 supplement
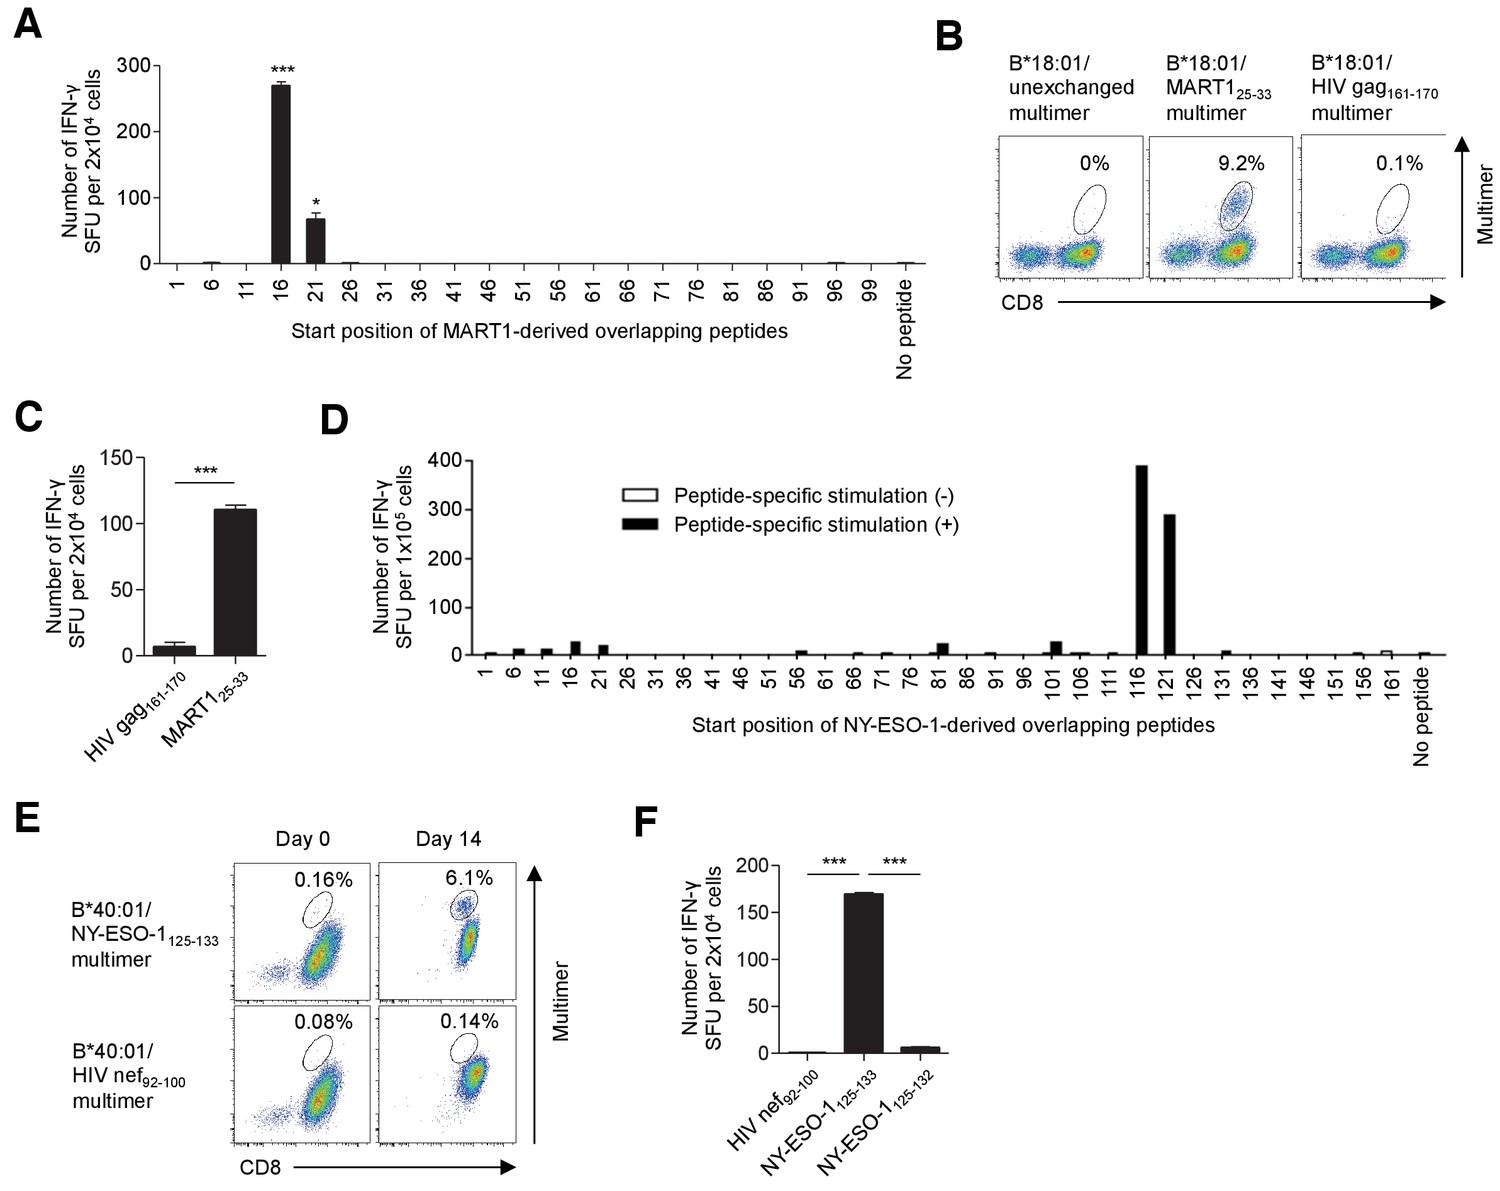
T cell epitope determination following stimulation with artificial APCs pulsed with overlapping peptides.
(A–C) Identification of a new epitope B*18:01/MART125-33 in polyclonally expanded M87 TILs. (A) When stimulated with B*18:01-artificial APCs pulsed with MART1-derived overlapping peptides, the M87 TILs showed positive responses to two adjacent peptides with the shared sequence 21YTTAEEAAGIGILTV35. See also Supplementary file 2a. (B) M87 TILs were stained with the indicated multimers. B*18:01/unexchanged and HIV gag161-170 multimers were employed as controls. (C) IFN-γ production by M87 TILs in a B*18:01/MART125-33-specific manner. B*18:01-artificial APCs pulsed with MART125-33 or HIV gag161-170 control peptide were employed as stimulator cells. (D–F) Identification of a new epitope, B*40:01/NY-ESO-1125-133, recognized by polyclonally expanded M31 TILs. CD8+ T cells isolated from M31 TILs were stimulated with B*40:01-artificial APCs pulsed with 10 μg/ml NY-ESO-1-derived overlapping peptides and cultured with 10 IU/ml IL-2, 10 ng/ml IL-15, and 30 ng/ml IL-21 for 14 days. (D) Following peptide-specific stimulation, the M31 TILs showed positive responses to two adjacent peptides with the shared sequence 121VLLKEFTVSGNILTI135. See also Supplementary file 2b. (E) Data from B*40:01/NY-ESO-1125-133 or control B*40:01/HIV nef92-100 multimer staining before stimulation (day 0) and 14 days after stimulation (day 14) are shown. (F) IFN-γ production by M31 TILs in a B*40:01/NY-ESO-1125-133-specific manner following peptide-specific stimulation. CD8+ T cells stimulated with B*40:01-artificial APCs pulsed with the NY-ESO-1125-133 peptide were employed as responder cells. B*40:01-artificial APCs pulsed with the indicated peptide were used as stimulator cells. The HIV nef92-100 and NY-ESO-1125-132 peptides were employed as controls. The percentage of multimer+ cells in CD8+ T cells is shown in (B) and (E). In (A), (C), and (F), the data shown represent the mean ± SD of experiments performed in triplicate. All the results are representative of at least two independent experiments. *p<0.05, ***p<0.001 (two-tailed Welch’s t tests).
Figure 4—figure supplement 1
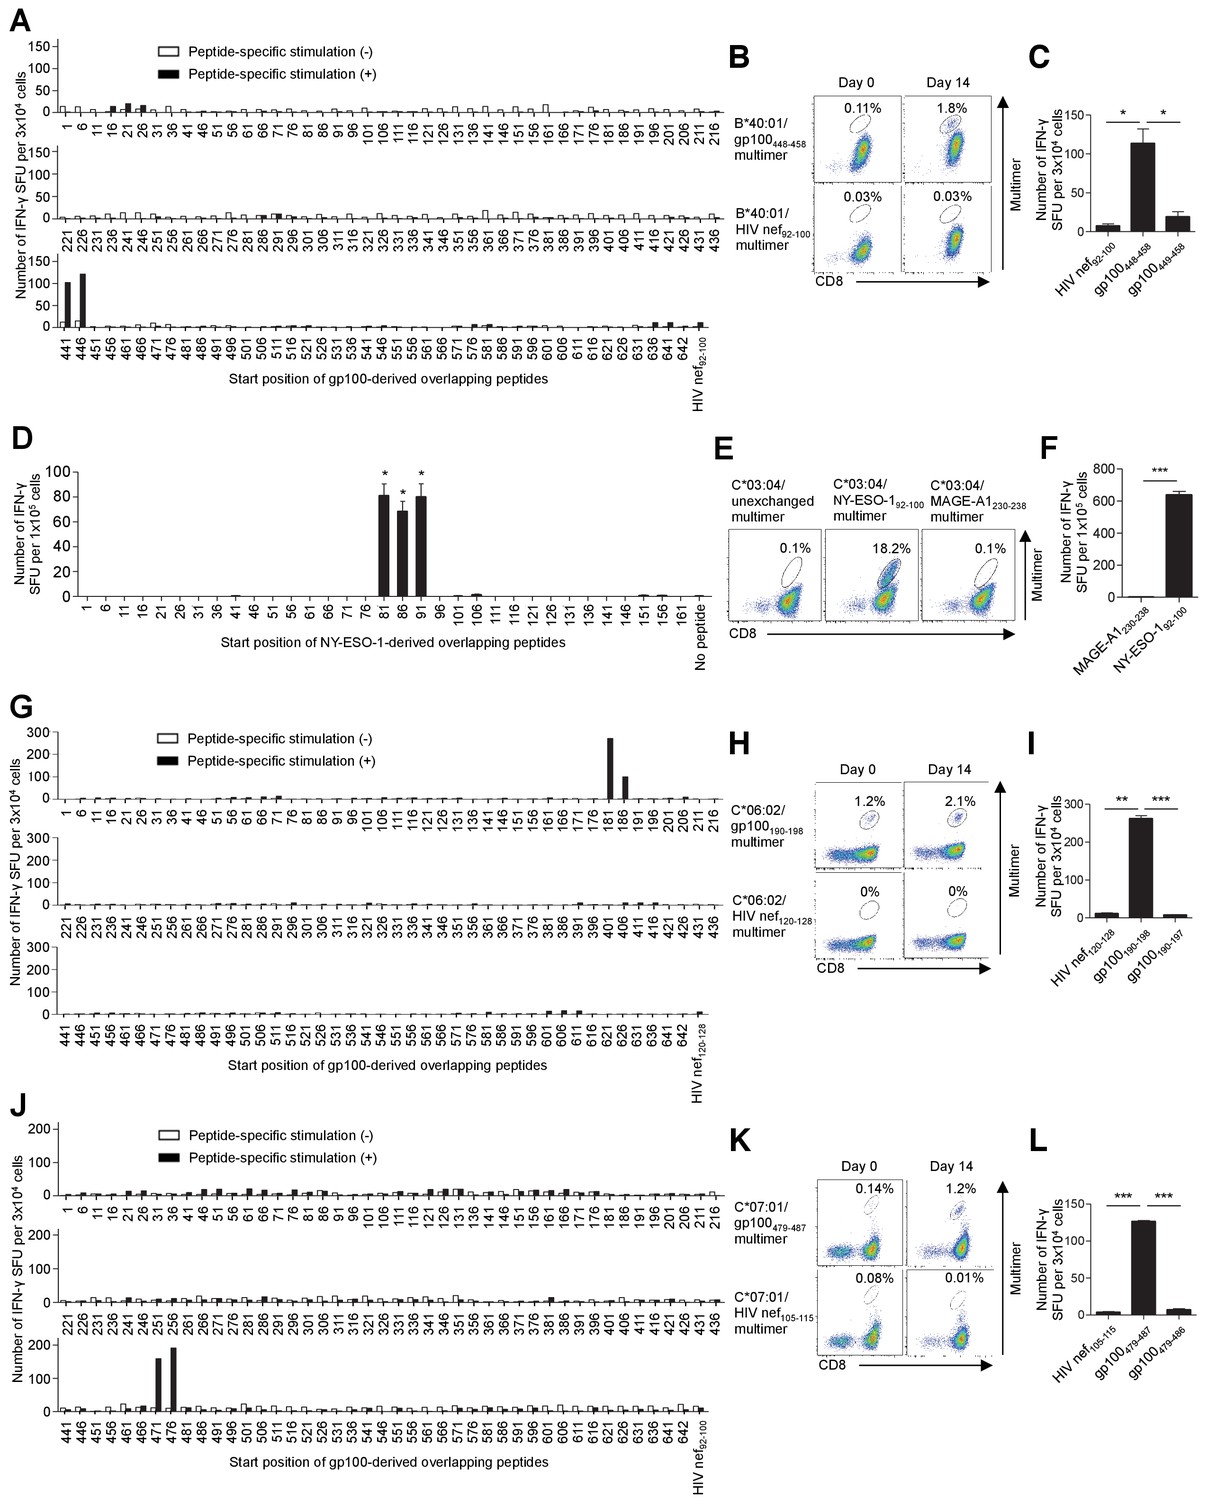
T cell epitope identification of in vitro-expanded TILs using overlapping peptides.
(A–C) Identification of a new epitope, B*40:01/gp100448-458, recognized by polyclonally expanded M31 TILs. Experiments similar to those described in Figure 4D–F were conducted to identify a new gp100 epitope recognized by M31 TILs. (A) The M31 TILs showed positive responses to two adjacent peptides with the shared sequence 446STESITGSLGPLLDG460 in IFN-γ ELISPOT analysis. See also Supplementary file 2d. The B*40:01/HIV nef92-100 multimer (B) and HIV nef92-100 and gp100449-458 peptides (C) were employed as controls. (D–F) Identification of an epitope, C*03:04/NY-ESO-192-100, recognized by polyclonally expanded M31 TILs. Experiments similar to those described in Figure 4A–C were conducted to determine a NY-ESO-1 epitope recognized by M31 TILs. (D) The M31 TILs showed positive responses to three adjacent peptides with the shared sequence 91YLAMPFATPM100 in IFN-γ ELISPOT analysis. See also Supplementary file 2b. C*03:04/unexchanged and MAGE-A1230-238 multimers (E) and the MAGE-A1230-238 peptide (F) were used as controls. (G–I) Identification of a new epitope, C*06:02/gp100190-198, recognized by polyclonally expanded M40 TILs. Experiments similar to those described in Figure 4D–F were conducted to identify a new gp100 epitope recognized by M40 TILs. (G) The M40 TILs showed positive responses to two adjacent peptides with the shared sequence 186VTVYHRRGSRSYVPL200 in IFN-γ ELISPOT analysis. See also Supplementary file 2d. The C*06:02/HIV nef120-128 multimer (H) and HIV nef120-128 and gp100190-197 peptides (I) were employed as controls. (J–L) Identification of a new epitope, C*07:01/gp100479-487, recognized by polyclonally expanded M87 TILs. Experiments similar to those described in Figure 4D–F were conducted to identify a new gp100 epitope recognized by M87 TILs. (J) The M87 TILs showed positive responses to two adjacent peptides with the shared sequence 476VLYRYGSFSVTLDIV490 in IFN-γ ELISPOT analysis. See also Supplementary file 2d. The C*07:01/HIV nef105-115 multimer (K) and HIV nef105-115 and gp100479-486 peptides (L) were used as controls. The percentage of multimer+ cells in CD8+ T cells is shown in (B), (E), (H), and (K). In (C), (D), (F), (I), and (L), the data shown represent the mean ± SD of experiments performed in triplicate. All the results are representative of at least two independent experiments. *p<0.05, **p<0.01, ***p<0.001 (two-tailed Welch’s t tests).
Figure 5 with 7 supplements
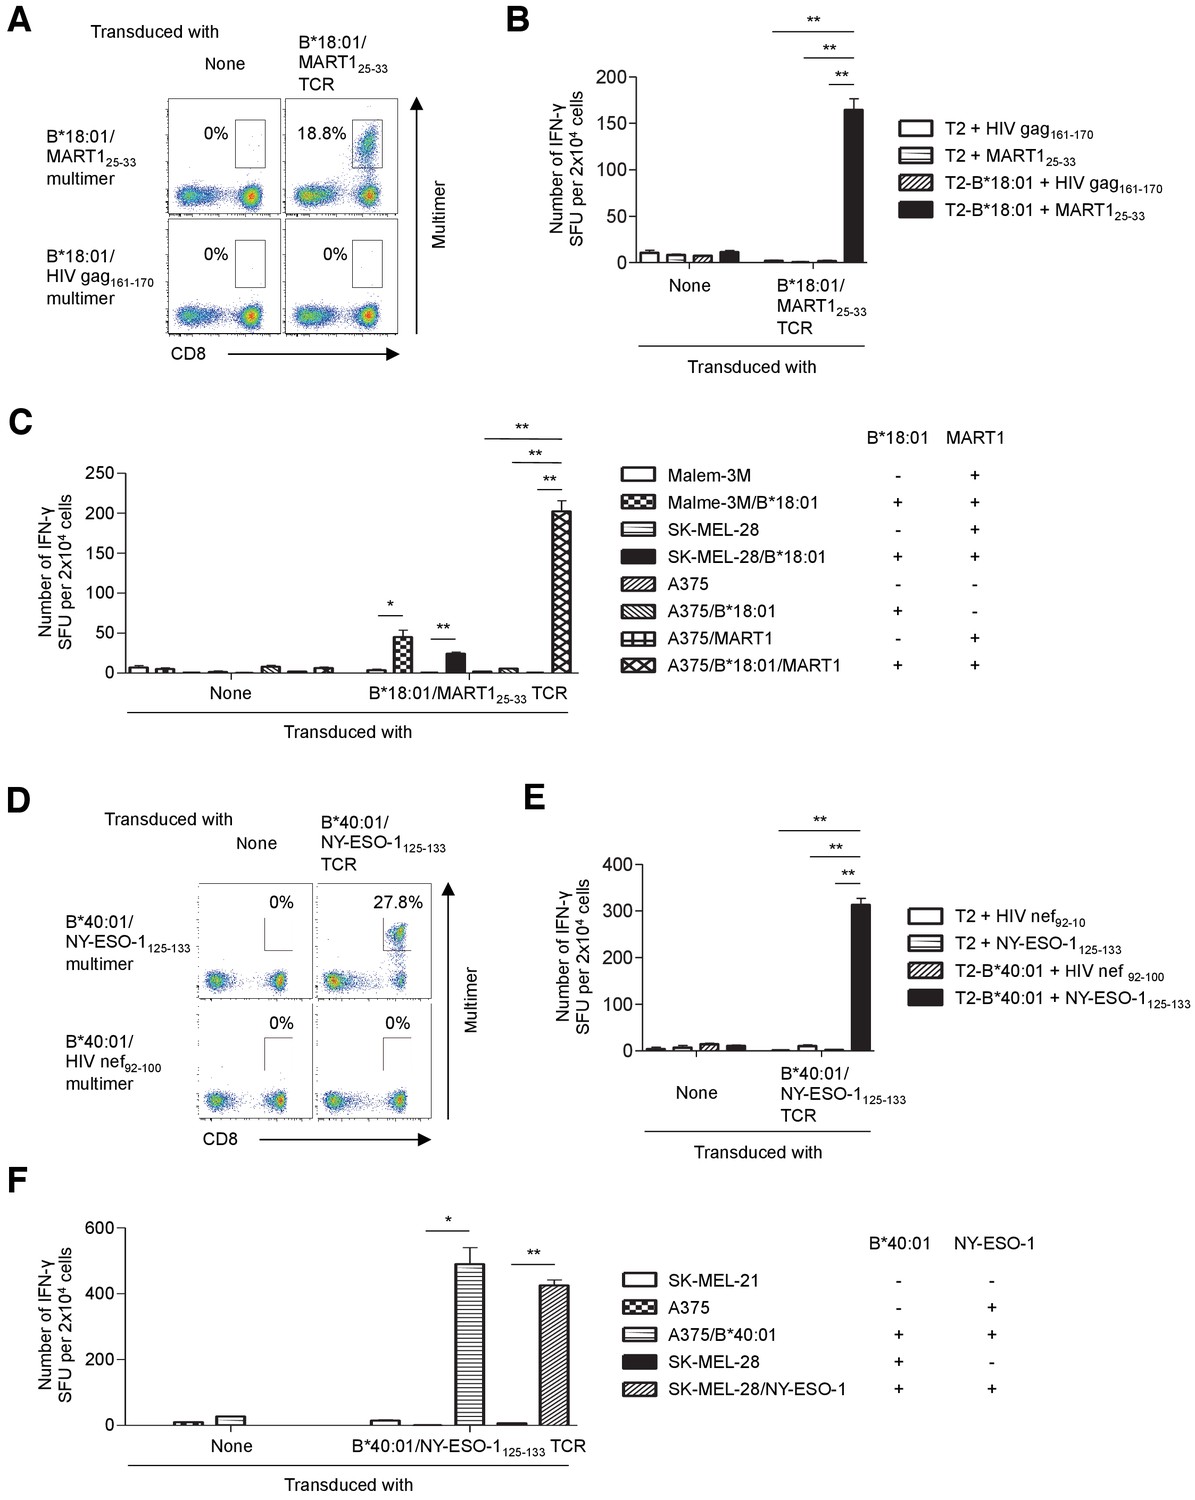
Tumor recognition by TIL-derived TCR genes.
(A–C) Primary T cells transduced with the B*18:01/MART125-33 TCR recognized tumor cells. (A) B*18:01/MART125-33 TCR-transduced or untransduced T cells were stained with the B*18:01/MART125-33 or B*18:01/HIV gag161-170 control multimer. (B, C) B*18:01/MART125-33 TCR-transduced or untransduced T cells were used as responder cells. (B) T2 or T2 cells transduced with HLA-B*18:01 (T2-B*18:01) pulsed with MART125-33 or HIV gag161-170 control peptide were employed as stimulator cells. (C) Malme-3M, SK-MEL-28, and A375 cells that were either untransduced or transduced with HLA-B*18:01 and/or MART1 were used as stimulator cells. (D–F) Primary T cells transduced with the B*40:01/NY-ESO-1125-133 TCR recognized tumor cells. (D) B*40:01/NY-ESO-1125-133 TCR-transduced or untransduced T cells were stained with the B*40:01/NY-ESO-1125-133 or B*40:01/HIV nef92-100 control multimer. (E, F) B*40:01/NY-ESO-1125-133 TCR-transduced or untransduced T cells were used as responder cells. (E) T2 or T2 cells transduced with HLA-B*40:01 (T2-B*40:01) pulsed with NY-ESO-1125-133 or HIV nef92-100 control peptide were employed as stimulator cells. (F) SK-MEL-21, A375, and SK-MEL-28 cells that were either untransduced or transduced with HLA-B*40:01 or NY-ESO-1 were used as stimulator cells. The percentage of multimer+ CD8+ T cells is shown in (A) and (D). In (B), (C), (E), and (F), the data shown represent the mean ± SD of experiments performed in triplicate. All the results are representative of at least two independent experiments. *p<0.05, **p<0.01 (two-tailed Welch’s t tests).
Figure 5—figure supplement 1
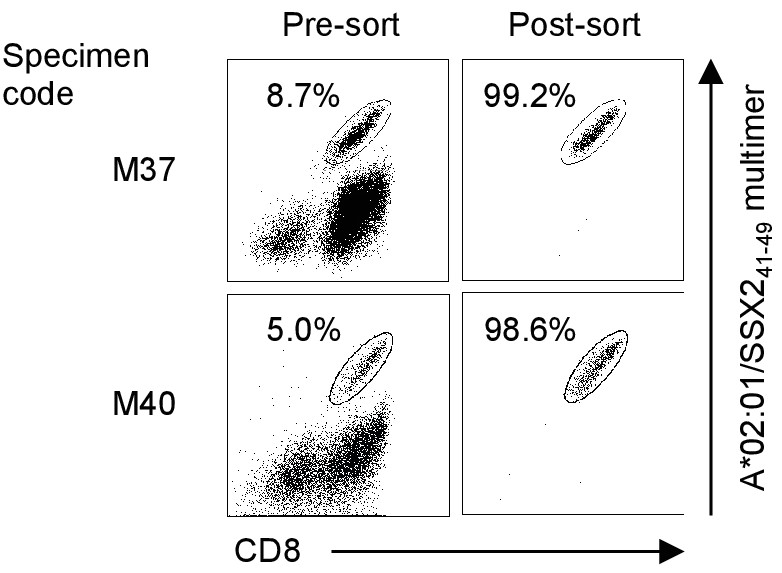
Enrichment of A*02:01/SSX241-49 multimer-positive T cells.
Enrichment of A*02:01/SSX241-49-specific T cells using a pHLA multimer. Two TIL samples (M37 and M40) were stained with the A*02:01/SSX241-49 multimer, and A*02:01/SSX241-49-specific T cells were purified using flow cytometry-guided sorting. The percentage of multimer+ CD8+ T cells is shown. The data shown are representative of two independent experiments. All other multimer-positive T cells were similarly purified, and their TCR genes were cloned.
Figure 5—figure supplement 2
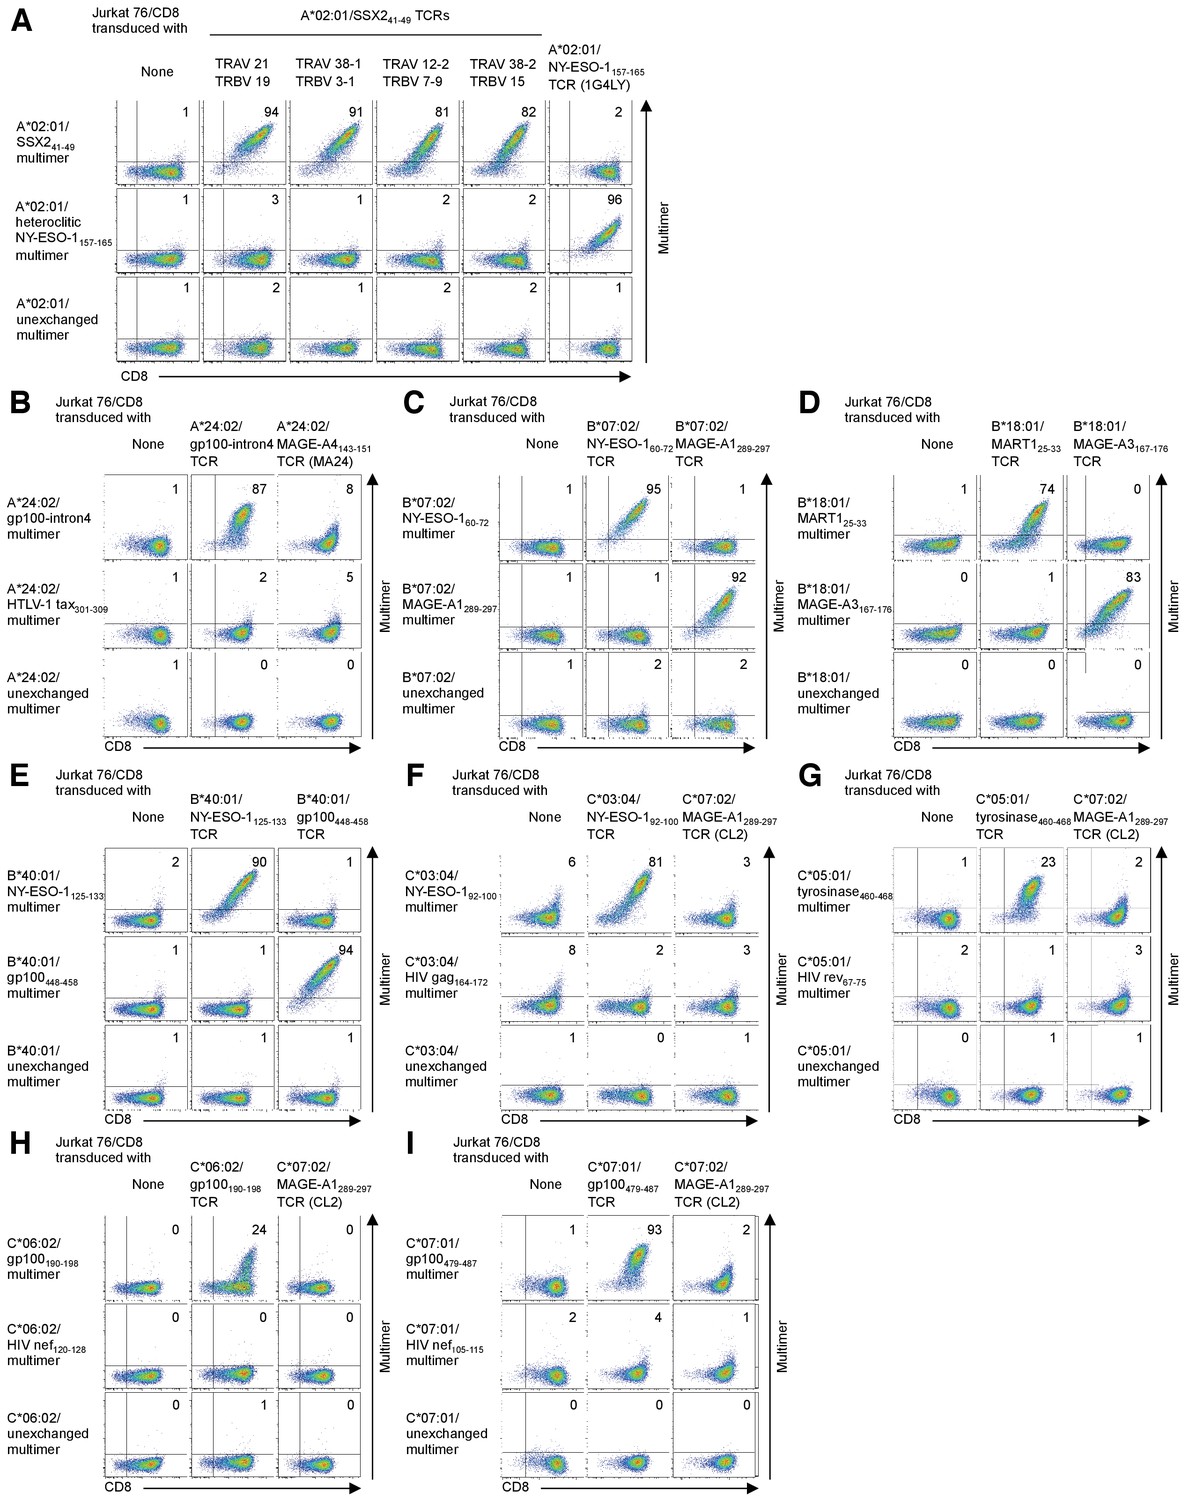
Confirmation of TCR specificity by reconstitution of TIL-derived TCR genes with a cognate multimer.
(A) Jurkat 76/CD8 cells transduced with the indicated A*02:01/SSX241-49 TCR genes were stained with the A*02:01/SSX241-49 multimer. The A*02:01/heteroclitic NY-ESO-1157-165 multimer and A*02:01/NY-ESO-1157-165 TCR (clone 1G4LY) were used as controls. (B) Jurkat 76/CD8 cells transduced with the A*24:02/gp100-intron4 TCR were stained with the A*24:02/gp100-intron4 multimer. The A*24:02/HTLV-1 tax301-309 multimer and A*24:02/MAGE-A4143-151 TCR (clone MA24) were used as controls. (C) Jurkat 76/CD8 cells transduced with the B*07:02/NY-ESO-160-72 or B*07:02/MAGE-A1289-297 TCR were stained with the B*07:02/NY-ESO-160-72 or B*07:02/MAGE-A1289-297 multimer. (D) Jurkat 76/CD8 cells transduced with the B*18:01/MART125-33 or B*18:01/MAGE-A3167-176 TCR were stained with the B*18:01/MART125-33 or B*18:01/MAGE-A3167-176 multimer. (E) Jurkat 76/CD8 cells transduced with the B*40:01/NY-ESO-1125-133 or B*40:01/gp100448-458 TCR were stained with the B*40:01/NY-ESO-1125-133 or B*40:01/gp100448-458 multimer. (F) Jurkat 76/CD8 cells transduced with the C*03:04/NY-ESO-192-100 TCR were stained with the C*03:04/NY-ESO-192-100 multimer. The C*03:04/HIV gag164-172 multimer and C*07:02/MAGE-A1289-297 TCR (clone CL2) were employed as controls. (G) Jurkat 76/CD8 cells transduced with the C*05:01/tyrosinase460-468 TCR were stained with the C*05:01/tyrosinase460-468 multimer. The C*05:01/HIV rev67-75 multimer and C*07:02/MAGE-A1289-297 TCR (clone CL2) were used as controls. (H) Jurkat 76/CD8 cells transduced with the C*06:02/gp100190-198 TCR were stained with the C*06:02/gp100190-198 multimer. The C*06:02/HIV nef120-128 multimer and C*07:02/MAGE-A1289-297 TCR (clone CL2) were employed as controls. (I) Jurkat 76/CD8 cells transduced with the C*07:01/gp100479-487 TCR were stained with the C*07:01/gp100479-487 multimer. The C*07:01/HIV nef105-115 multimer and C*07:02/MAGE-A1289-297 TCR (clone CL2) were used as controls. HLA class I-matched, peptide-unexchanged multimers were used as controls. The percentage of multimer+ CD8+ cells is shown. The data shown are representative of at least two independent experiments.
Figure 5—figure supplement 3
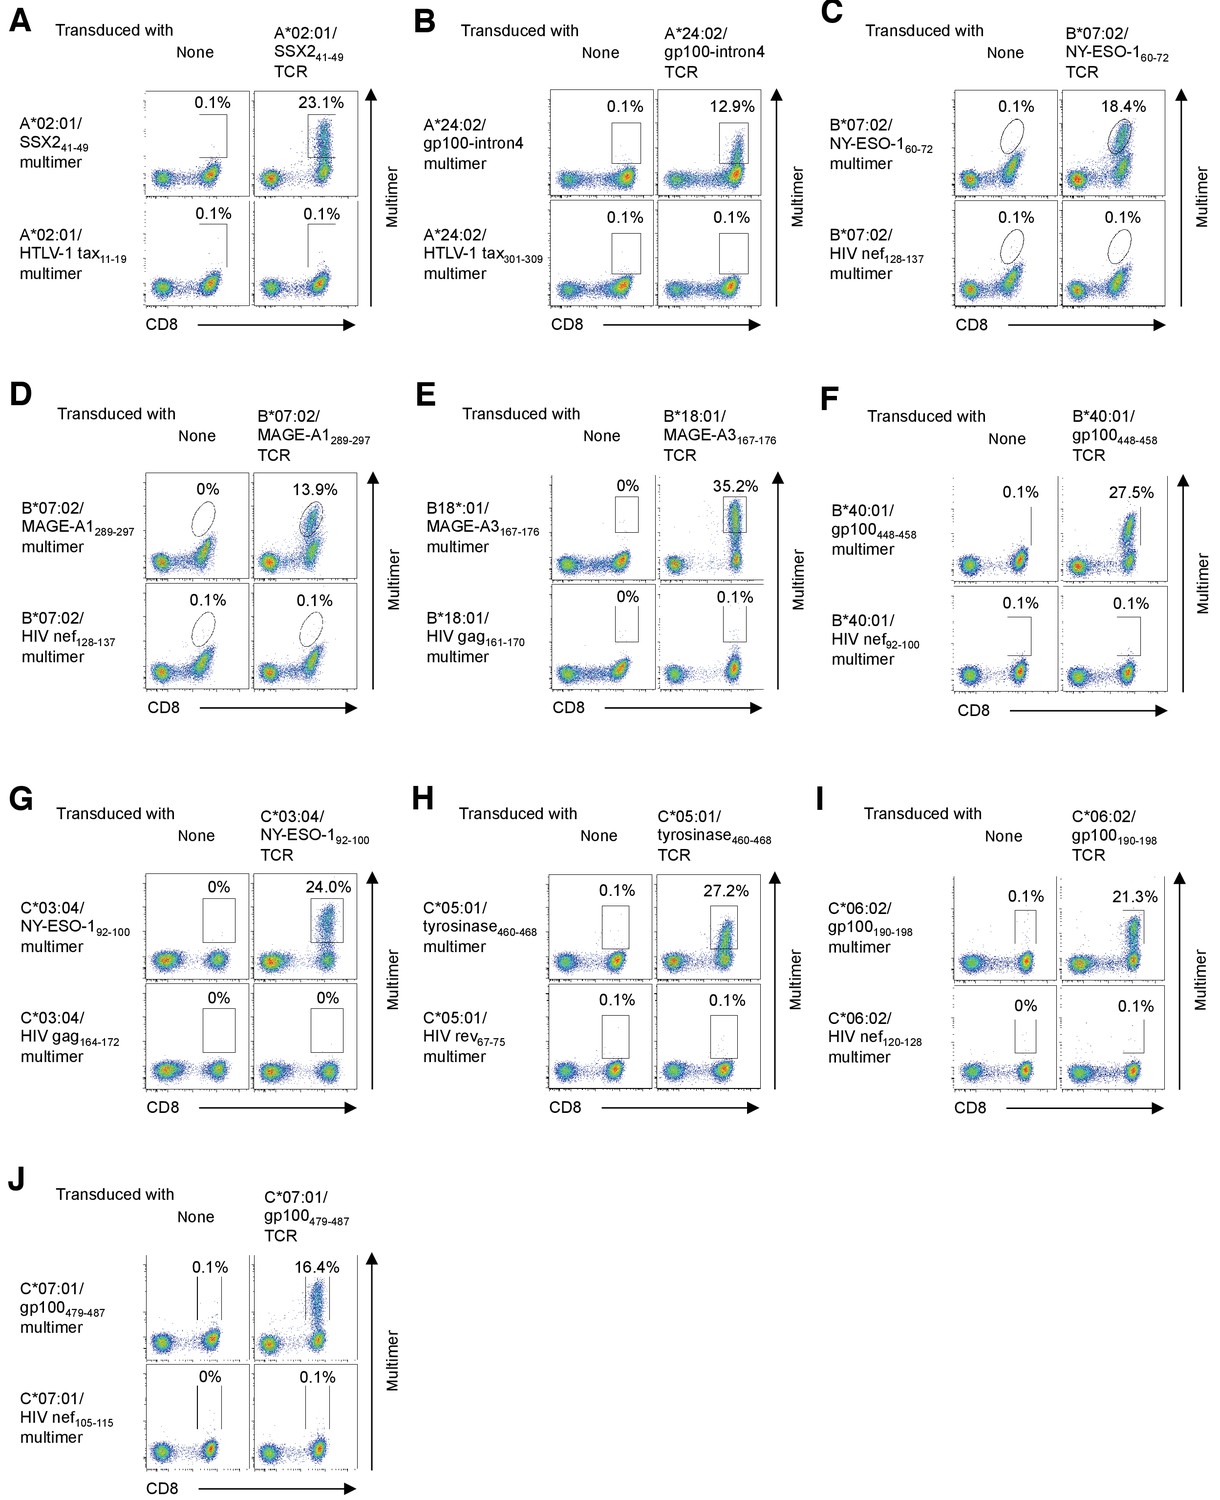
Positive staining of human primary T cells transduced with TIL-derived TCR genes with a cognate multimer.
(A) Primary T cells transduced with the A*02:01/SSX241-49 TCR encoding TRAV21 and TRBV19 (Supplementary file 3) were stained with the A*02:01/SSX241-49 or A*02:01/HTLV-1 tax11-19 control multimer. (B) Primary T cells transduced with the A*24:02/gp100-intron4 TCR were stained with the A*24:02/gp100-intron4 or A*24:02/HTLV-1 tax301-309 control multimer. (C) Primary T cells transduced with the B*07:02/NY-ESO-160-72 TCR were stained with the B*07:02/NY-ESO-160-72 or B*07:02/HIV nef128-137 control multimer. (D) Primary T cells transduced with the B*07:02/MAGE-A1289-297 TCR were stained with the B*07:02/MAGE-A1289-297 or B*07:02/HIV nef128-137 control multimer. (E) Primary T cells transduced with the B*18:01/MAGE-A3167-176 TCR were stained with B*18:01/MAGE-A3167-176 or B*18:01/HIV gag161-170 control multimer. (F) Primary T cells transduced with the B*40:01/gp100448-458 TCR were stained with the B*40:01/gp100448-458 or B*40:01/HIV nef92-100 control multimer. (G) Primary T cells transduced with the C*03:04/NY-ESO-192-100 TCR were stained with the C*03:04/NY-ESO-192-100 or C*03:04/HIV gag164-172 control multimer. (H) Primary T cells transduced with the C*05:01/tyrosinase460-468 TCR were stained with the C*05:01/tyrosinase460-468 or C*05:01/HIV rev67-75 control multimer. (I) Primary T cells transduced with the C*06:02/gp100190-198 TCR were stained with the C*06:02/gp100190-198 or C*06:02/HIV nef120-128 control multimer. (J) Primary T cells transduced with the C*07:01/gp100479-487 TCR were stained with the C*07:01/gp100479-487 or C*07:01/HIV nef105-115 control multimer. Untransduced primary T cells were employed as negative controls. The percentage of multimer+ CD8+ T cells is shown. The data shown are representative of at least two independent experiments.
Figure 5—figure supplement 4
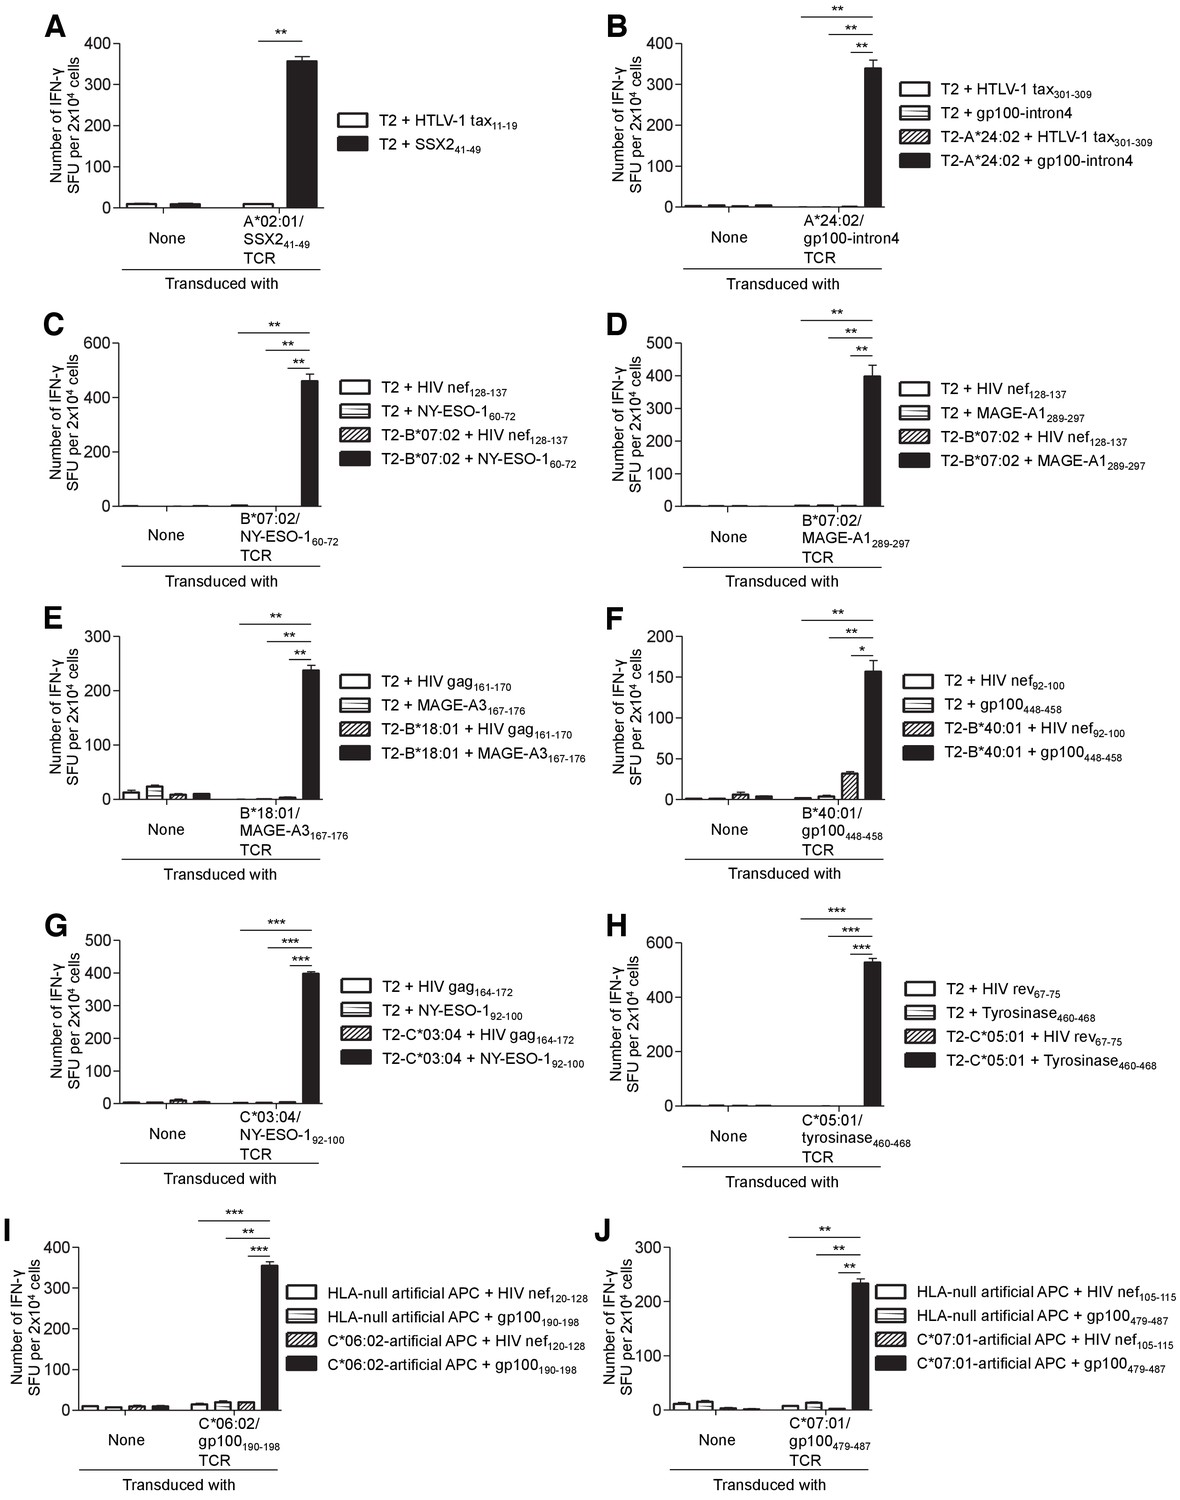
Human primary T cells transduced with the TIL-derived TCR genes react strongly with the cognate peptide presented by the target class I molecule.
Primary T cells transduced with the indicated TCR genes or untransduced were used as responder cells in IFN-γ ELISPOT analysis. HLA class I-transduced T2 cells were generated for HLA-A*24:02 (T2-A*24:02), B*07:02 (T2-B*07:02), B*18:01 (T2-B*18:01), B*40:01 (T2-B*40:01), C*03:04 (T2-C*03:04), and C*05:01 (T2-C*05:01), respectively. (A) A*02:01/SSX241-49 TCR encoding TRAV21 and TRBV19 was employed (Supplementary file 3). T2 cells pulsed with SSX241-49 or the HTLV-1 tax11-19 control peptide were used as stimulator cells. (B) T2 or T2-A*24:02 cells pulsed with the gp100-intron4 or HTLV-1 tax301-309 control peptide were employed as stimulator cells. (C) T2 or T2-B*07:02 cells pulsed with the NY-ESO-160-72 or HIV nef128-137 peptide (control) were used as stimulator cells. (D) T2 or T2-B*07:02 cells pulsed with the MAGE-A1289-297 or HIV nef128-137 peptide (control) were employed as stimulator cells. (E) T2 or T2-B*18:01 cells pulsed with the MAGE-A3167-176 or HIV gag161-170 peptide (control) were used as stimulator cells. (F) T2 or T2-B*40:01 cells pulsed with the gp100448-458 or HIV nef92-100 peptide (control) were used as stimulator cells. (G) T2 or T2-C*03:04 cells pulsed with the NY-ESO-192-100 or HIV gag164-172 peptide (control) were employed as stimulator cells. (H) T2 or T2-C*05:01 cells pulsed with the tyrosinase460-468 or HIV rev67-75 peptide (control) were used as stimulator cells. (I) HLA-null artificial APCs or C*06:02-artificial APCs pulsed with the gp100190-198 or HIV nef120-128 peptide (control) were employed as stimulator cells. (J) HLA-null artificial APCs or C*07:01-artificial APCs pulsed with the gp100479-487 or HIV nef105-115 peptide (control) were used as stimulator cells. The data shown represent the mean ± SD of experiments performed in triplicate. All the results are representative of at least two independent experiments. *p<0.05, **p<0.01, ***p<0.001 (two-tailed Welch’s t tests).
Figure 5—figure supplement 5

Primary T cells transduced with TIL-derived TCR genes recognize tumor cells.
Primary T cells transduced with the indicated TCR genes or untransduced were employed as responder cells in IFN-γ ELISPOT analysis. (A) A*02:01/SSX241-49 TCR encoding TRAV21 and TRBV19 was employed (Supplementary file 3). SK-MEL-21, 37, and 28 cells untransduced or transduced with HLA-A*02:01 and/or SSX2 were used as stimulator cells. (B) Malme-3M, SK-MEL-28, and A375 cells either untransduced or transduced with HLA-A*24:02 and/or gp100-intron4 were used as stimulator cells. (C) A375, SK-MEL-37, and SK-MEL-21 cells untransduced or transduced with HLA-B*07:02 or NY-ESO-1 were employed as stimulator cells. (D) Me275, SK-MEL-37, and SK-MEL-21 cells either untransduced or transduced with HLA-B*07:02 or MAGE-A1 were used as stimulator cells. (E) SK-MEL-28 and HEK293T cells untransduced or transduced with HLA-B*18:01 and/or MAGE-A3, as indicated, were employed as stimulator cells. (F) SK-MEL-28 and SK-MEL-37 cells untransduced or transduced with HLA-B*40:01 and/or gp100 were employed as stimulator cells following treatment with 100 ng/ml IFN-γ (Peprotech) for 48 hr. (G) A375, SK-MEL-37, LM-MEL-53, and SK-MEL-21 cells untransduced or transduced with HLA-C*03:04 or NY-ESO-1 were used as stimulator cells following treatment with 100 ng/ml IFN-γ for 48 hr. (H) Malme-3M, Me275, and MCF7 cells either untransduced or transduced with HLA-C*05:01 or tyrosinase, as indicated, were employed as stimulator cells following treatment with 100 ng/ml IFN-γ for 48 hr. (I) Malme-3M, SK-MEL-28, and A375 cells untransduced or transduced HLA-C*06:02 or gp100 were used as stimulator cells. (J) ACHN and A375 cells untransduced or transduced HLA-C*07:01 and/or gp100, as indicated, were used as stimulator cells. The data shown represent the mean ± SD of experiments performed in triplicate. All the results are representative of at least two independent experiments. *p<0.05, **p<0.01, ***p<0.001 (two-tailed Welch’s t tests).
Figure 5—figure supplement 6
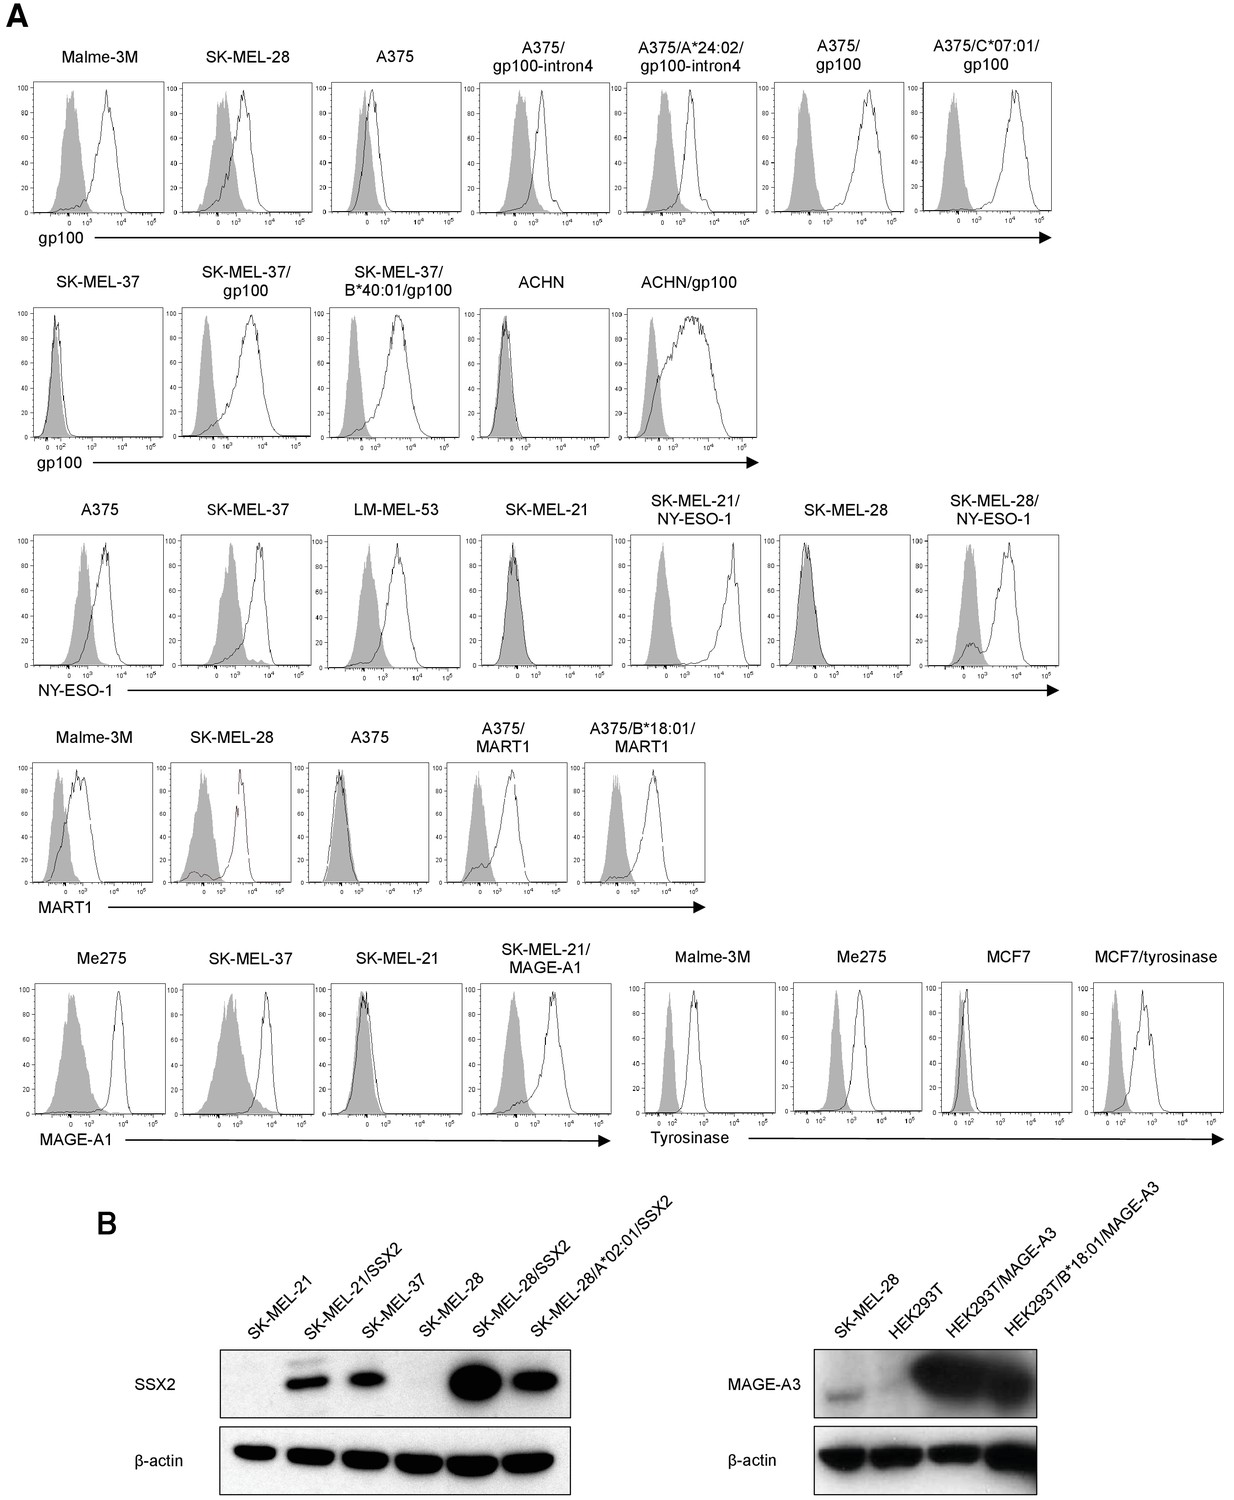
Expression of target antigens derived from endogenous or transduced full-length genes.
(A) The expression of gp100, NY-ESO-1, MART1, MAGE-A1, and tyrosinase derived from endogenous or transduced full-length genes in target cells was analyzed via intracellular flow cytometry following staining with anti-gp100, NY-ESO-1, MART1, MAGE-A1, and tyrosinase mAb (open curve) and an isotype control (filled curve). (B) Western blot analysis was performed with an anti-SSX2 pAb to detect the expression of SSX2 derived from endogenous or transduced full-length gene in target cells (left panel) and an anti-MAGE-A3 pAb to detect the expression of MAGE-A3 derived from endogenous or transduced full-length gene in target cells (right panel). β-actin expression was employed as a positive control. The data shown are representative of at least two independent experiments.
Figure 5—figure supplement 7
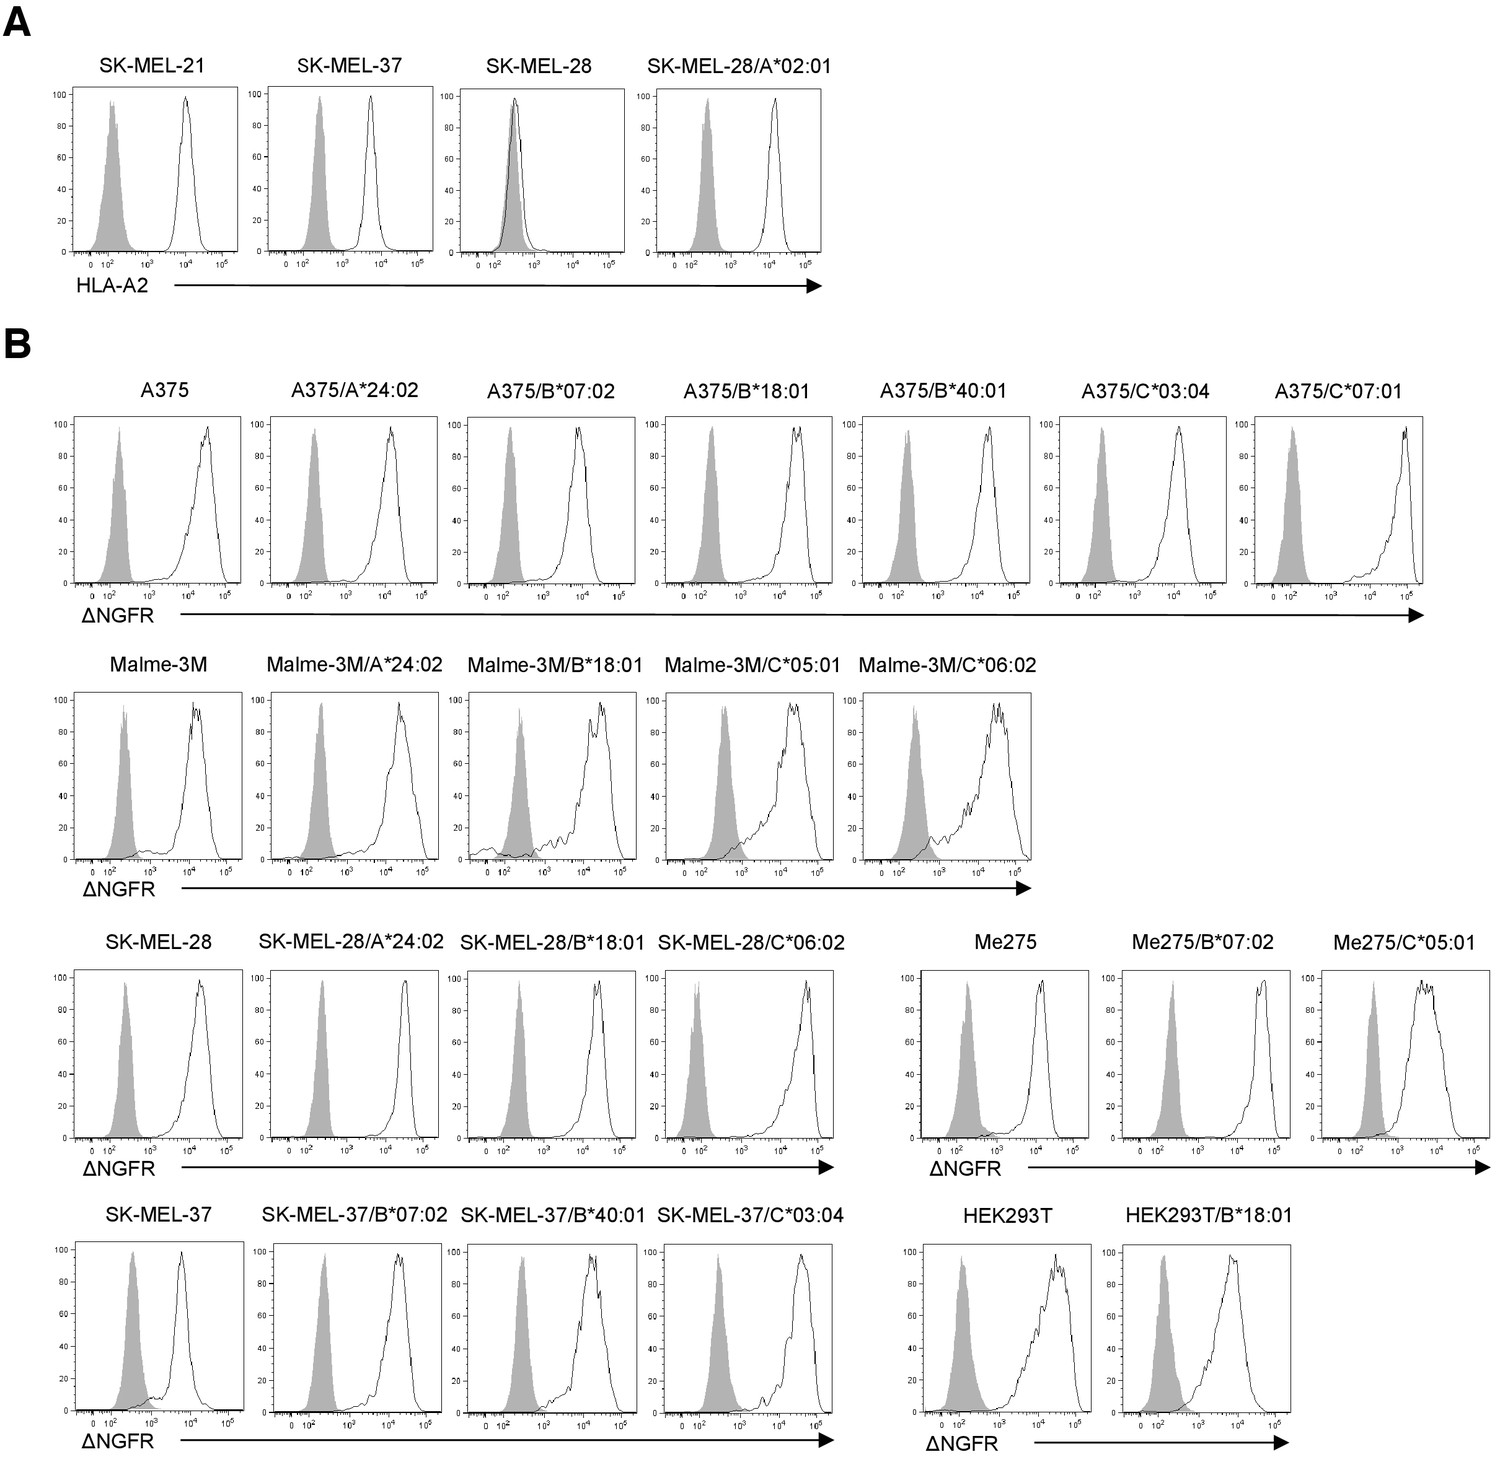
Expression of HLA class I derived from endogenous or transduced full-length genes.
(A) Surface expression of HLA-A*02:01 derived from endogenous or transduced full-length HLA-A*02:01 in target cells was analyzed via flow cytometry following staining with an anti-HLA-A2 mAb (open curve) and an isotype control (filled curve). (B) Surface expression of ΔNGFR in target cells transduced with the full-length class I gene tagged with ΔNGFR was analyzed by flow cytometry following staining with an anti-NGFR mAb (open curve) and an isotype control (filled curve). ΔNGFR alone was used as a control. The data shown are representative of at least two independent experiments.
Figure 6 with 3 supplements
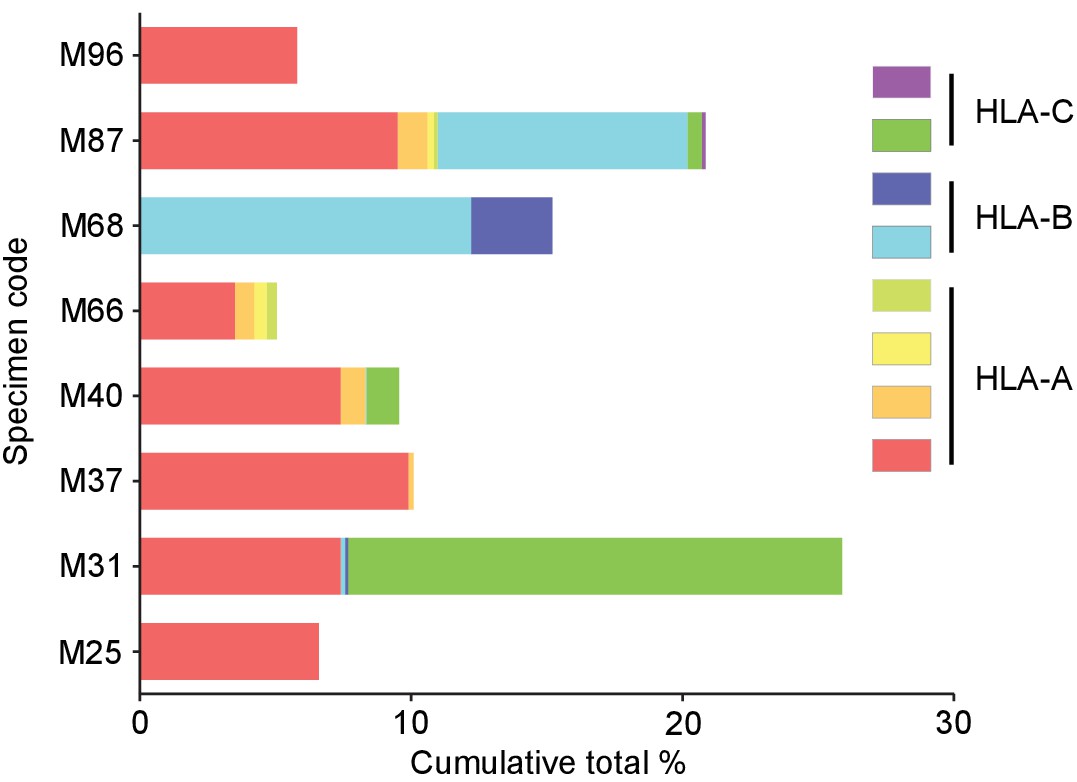
Cumulative percentages of antigen-specific T cells detected by multimer staining in polyclonally expanded TILs.
The specificity of 12.2 ± 7.3% (mean ± SD, max 25.9%, min 4.6%) of CD8+ T cells toward 3.1 ± 2.0 (mean ± SD, max 7, min 1) peptides derived from shared antigens was determined. The same colors do not represent the same alleles or antigens.
Figure 6—figure supplement 1

The efficiency of peptide exchange in soluble monomeric HLA class IQ115E-Kb monomers.
The efficiencies of peptide exchange in soluble HLA class IQ115E-Kb monomers for A*02:01 (A), B*07:02 (B), and C*07:02 (C) were measured by peptide competition binding assay and ELISA. The biotinylated peptides used were HLA-A*02:01-restricted telomerase540-548 ILAK(-biotin)FLHWL, B*07:02-restricted MiHAg SMCY1041-1051 SPSVDK(-biotin)ARAEL, and C*07:02-restricted adenovirus B585-593 FRK(-biotin)DVNMVL. The class I-restricted peptides employed are shown in Supplementary files 1b, d, and h. The peptide exchange efficiencies in the A*02:01, B*07:02, and C*07:02 monomers were 62.0 ± 14.9% (mean ± SD), 94.2 ± 12.0%, and 80.5 ± 22.1%, respectively. The A*01:01-restricted N-ras55-64 (A, C), A*01:01-restricted MART2446-456 (C), A*02:01-restricted gp100177-186 (C), A*02:01-restricted TRP-2360-368 (B), A*03:01-restricted myosin class I911-919 (A, B), B*44:02-restricted MAGE-C2307-315 (A), and C*06:02-restricted MUM-1126-134 (B) peptides were used as irrelevant controls (Supplementary files 1a,b,i). The data shown represent the mean ± SD of experiments performed in triplicate. All the results are representative of at least two independent experiments.
Figure 6—figure supplement 2

Stability of the reagents after peptide loading and multimerization.
Jurkat 76/CD8 cells transduced with the A*02:01/MART127-35 TCR (clone DMF5), B*07:02/NY-ESO-160-72 TCR, or C*03:04/NY-ESO-192-100 TCR were stained with the cognate multimer at the indicated time points after loading with peptides (A) or multimerization with anti-His mAb (B). The A*02:01/NY-ESO-1157-165 TCR (clone 1G4LY) was used as a control. The percentages of multimer+ CD8+ T cells are shown. The data shown are representative of two independent experiments.
Figure 6—figure supplement 3

Multiplex pHLA mutimer staining.
Multiplex staining of TILs with PE-conjugated and APC-conjugated multimers, as indicated, in a single tube (right panels) for M31 (A), M68 (B), and M87 (C, D). Single multimer staining in individual tubes is shown in left panels. A*02:01/HTLV-1 tax11-19 (A, C, D), C*03:04/HIV gag164-172 (A), B*07:02/HIV nef128-137 (B), and B*18:01/HIV gag161-170 (D) multimers were used as negative controls. The percentages of multimer+ cells in CD8+ T cells are shown (left panels). The data shown are representative of two independent experiments. Legends for Supplementary files.
Author response image 1
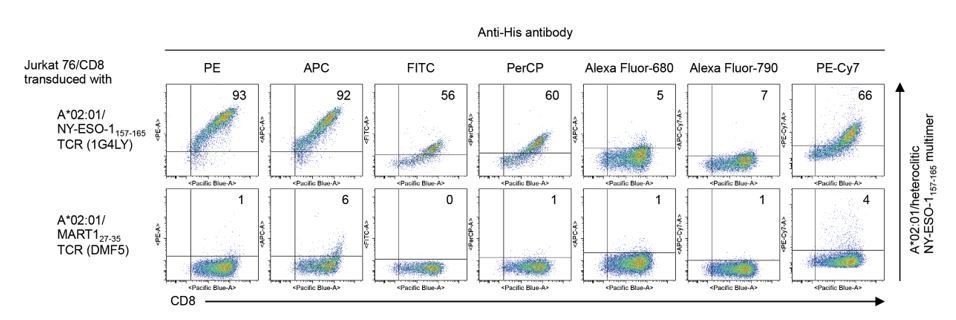
T cell staining using pHLA multimers with various fluorochrome-conjugated anti-His antibodies.
A*02:01 monomer loaded with the heteroclitic NY-ESO-1157-165 peptide was multimelized with PE (Abcam), APC (Abcam), FITC (Abcam), PerCP (Abcam), Alexa Fluor 680 (Santa Cruz Biotechnology), Alexa Fluor 790 (Santa Cruz Biotechnology), or PE-Cy7 (Santa Cruz Biotechnology)-conjugated anti-His mAb (clone AD1.1.10), respectively, and Jurkat 76/CD8 cells transduced with A*02:01/NY-ESO-1157-165 TCR (clone 1G4LY) were stained with their pHLA multimers. The A*02:01/MART127-35 TCR (clone DMF5) was used as a control. The percentages of multimer+ CD8+ T cells are shown.
Author response image 2
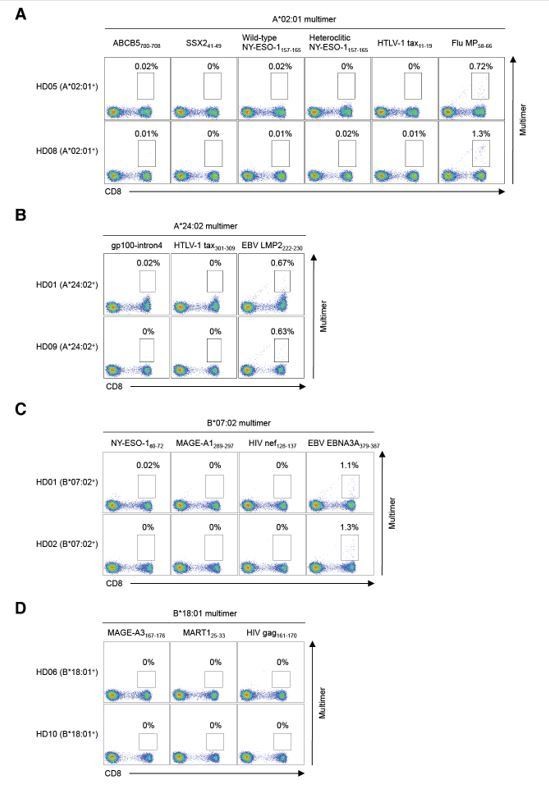
Staining of peripheral T cells from healthy donors with pHLA multimers.
Peripheral T cells from HLA-matched healthy donors were stained with pHLA multimers that positively stained TILs for HLA-A*02:01+ (A), A*24:02+ (B), B*07:02+ (C), B*18:01+ (D), B*40:02+ (E), B*41:01+ (E), C*03:04+ (F), C*05:01+ (G), C*06:02+ (H), and C*07:01+ (I) healthy donors. The A*02:01/Flu MP58-66 (A), A*24:02/EBV LMP2222-230 (B), and B*07:02/EBV EBNA3A379-387 (C) multimers were employed as positive controls. The A*02:01/HTLV-1 tax11-19 (A), A*24:02/HTLV-1 tax301-309 (B), B*07:02/HIV nef128-137 (C), B*18:01/HIV gag161-170 (D), B*40:01/HIV nef92-100 (E), C*03:04/HIV gag164-172 (F), C*05:01/HIV rev67-75 (G), C*06:02/HIV nef120-128 (H), and C*07:01/HIV nef105-115 (I) multimers were used as negative controls. The percentage of multimer+ cells in CD8+ T cells is shown.
Tables
Table 1
Summary of shared antigenic epitopes recognized by melanoma TILs and their cloned TCRs.
| Specimen code | HLA-A | HLA-B | HLA-C | Shared antigenic epitopes | % of multimer-positive CD8+ TILs | IFN-γ ELISPOT analysis | Number of cloned TCRs | Tumor reactivity |
|---|---|---|---|---|---|---|---|---|
| M25 | 01:01/02:01 | 07:02/08:01 | 07:01/07:02 | A*02:01/MART127-35/26-35 (wild-type/heteroclitic) | 6.6/5.1 | +/+ | ND | ND |
| M31 | 02:01/24:02 | 40:01/44:02 | 03:04/05:01 | A*02:01/NY-ESO-1157-165 (wild-type/heteroclitic) | 6.3/7.4 | +/+ | ND | ND |
| B*40:01/NY-ESO-1125-133 | 0.16 | + | 1 | + | ||||
| B*40:01/gp100448-458 | 0.11 | + | 1 | + | ||||
| C*03:04/NY-ESO-192-100 | 18.2 | + | 1 | + | ||||
| M37 | 02:01/24:02 | 14:02/48:01 | 08:02/08:03 | A*02:01/SSX241-49 | 9.9 | + | 2 | + |
| A*24:02/gp100-intron4 | 0.19 | + | 1 | + | ||||
| M40 | 02:01/30:02 | 18:01/45:01 | 05:01/06:02 | A*02:01/SSX241-49 | 7.4 | + | 2 | ND |
| A*02:01/NY-ESO-1157-165 (wild-type/heteroclitic) | 0.86/0.91 | +/+ | ND | ND | ||||
| B*18:01/MAGE-A3167-176 | 0.04 | + | 1 | + | ||||
| C*06:02/gp100190-198 | 1.2 | + | 1 | + | ||||
| M66 | 02:01/32:01 | 07:02/27:05 | 02:02/07:02 | A*02:01/gp100154-162 | 0.71 | + | ND | ND |
| A*02:01/gp100209-217 | 0.46 | + | ND | ND | ||||
| A*02:01/gp100280-288 | 0.38 | + | ND | ND | ||||
| A*02:01/MART127-35/26-35 (wild-type/heteroclitic) | 3.5/3.5 | +/+ | ND | ND | ||||
| M68 | 03:01/24:02 | 07:02/- | 07:02/- | B*07:02/NY-ESO-160-72 | 3.0 | + | 1 | + |
| B*07:02/MAGE-A1289-297 | 12.2 | + | 1 | + | ||||
| M87 | 01:01/02:01 | 18:01/- | 05:01/07:01 | A*02:01/ABCB5700-708 | 1.1 | + | 1 | ND |
| A*02:01/gp100154-162 | 0.14 | + | ND | ND | ||||
| A*02:01/tyosinase369-377 | 0.23 | + | ND | ND | ||||
| A*02:01/MART127-35/26-35 (wild-type/heteroclitic) | 9.5/8.5 | +/+ | ND | ND | ||||
| B*18:01/MART125-33 | 9.2 | + | 1 | + | ||||
| C*05:01/tyrosinase460-468 | 0.54 | + | 1 | + | ||||
| C*07:01/gp100479-487 | 0.14 | + | 1 | + | ||||
| M96 | 01:01/02:01 | 08:01/51:01 | 07:01/15:02 | A*02:01/MART127-35/26-35 (wild-type/heteroclitic) | 5.8/5.8 | +/+ | ND | ND |
-
ND; Not determined.
Key resources table
| Reagent type (species) or resource | Designation | Source or reference | Identifiers | Additional information |
|---|---|---|---|---|
| Cell line (Homo-sapiens) | K562 | ATCC | RRID:CVCL_0004 | |
| Cell line (Homo-sapiens) | T2 | ATCC | RRID:CVCL_2211 | |
| Cell line (Homo-sapiens) | A375 | ATCC | RRID:CVCL_0132 | |
| Cell line (Homo-sapiens) | Malme-3M | ATCC | RRID:CVCL_1438 | |
| Cell line (Homo-sapiens) | SK-MEL-28 | ATCC | RRID:CVCL_0526 | |
| Cell line (Homo-sapiens) | LM-MEL-53 | ATCC | RRID:CVCL_UC56 | |
| Cell line (Homo-sapiens) | HEK293T | ATCC | RRIID:CVCL_0063 | |
| Cell line (Homo-sapiens) | MCF7 | ATCC | RRID:CVCL_UC56 | |
| Cell line (Homo-sapiens) | ACHN | ATCC | RRID:CVCL_1067 | |
| Cell line (Homo-sapiens) | SK-MEL-21 | Memorial Sloan Kettering Cancer Center | RRID:CVCL_3877 | |
| Cell line (Homo-sapiens) | SK-MEL-37 | Memorial Sloan Kettering Cancer Center | RRID:CVCL_3878 | |
| Cell line (Homo-sapiens) | Me275 | Ludwig Institute for Cancer Research | RRID:CVCL_S597 | |
| Cell line (Homo-sapiens) | Jurkat 76 | Leiden University Medical Center | Heemskerk et al. (2003) | |
| Antibody | Mouse anti-CD8-PC5 | Beckman Coulter | Cat.#: IM2638U | Clone B9.11 |
| Antibody | Mouse CD8-PB | Beckman Coulter | Cat.#: A82791 | Clone B9.11 |
| Antibody | Mouse anti-NGFR-FITC | Biolegend | Cat.#: MAB5598 | Clone ME20.4 |
| Antibody | Mouse anti-CD3-APC/Cy7 | Biolegend | Cat.#: 300426 | Clone UCHT1 |
| Antibody | Mouse anti-HLA-A2-FITC | Biolegend | Cat.#: 343304 | Clone BB7.2 |
| Antibody | Mouse anti-Melan-A | Santa Cruz Biotechnology | Cat.#: sc-20032 | Clone A103 |
| Antibody | Rabbit anti-NY-ESO-1-PE | Cell Signaling Technology | Cat.#: 65699 | Clone D1Q2U |
| Antibody | Mouse anti-PMEL | LifeSpan Biosciences | Cat.#: LS-C114528 | Clone 7E3 |
| Antibody | Mouse anti-MAGE-A1 | LifeSpan Biosciences | Cat.#: LS-C391567 | Clone MA454 |
| Antibody | Rabbit anti-Tyrosinase | Abcam | Cat.#: ab61294 | Clone ERP10141 |
| Antibody | Rabbit anti-SSX2 | Thermo Fisher Scientific | Cat.#: PA5-80074 | Polyclonal |
| Antibody | Rabbit anti-MAGE-A3 | LifeSpan Biosciences | Cat.#: LS-C99934 | Polyclonal |
| Antibody | Mouse anti-β-actin | Santa Cruz Biotechnology | Cat.#: sc-47778 | Clone C4 |
| Antibody | Mouse anti-His tag-PE | Abcam | Cat.#: ab72467 | Clone AD1.1.10 |
| Antibody | Mouse anti-His tag-APC | Abcam | Cat.#: ab72579 | Clone AD1.1.10 |
| Commercial assay or kit | LIVE/DEAD Fixable Aqua Dead Cell Stain kit | Thermo Fisher Scientific | at.#: L34957 | |
| Commercial assay or kit | PureLink Genomic DNA Mini Kit | Thermo Fisher Scientific | Cat.#: K182000 | |
| Commercial assay or kit | Cytofix/Cytoperm kit | BD Biosciences | Cat.#: BD 554714 | |
| Commercial assay or kit | CD8+ T Cell Isolation Kit | Miltenyi Biotec | Cat.#: 130-096-495 | |
| Commercial assay or kit | Pan T Cell Isolation Kit | Miltenyi Biotec | Cat.#: 130-096-535 | |
| Software, algorithm | Cancer Antigenic Peptide Database | Cancer Research Institute | https://caped.icp.ucl.ac.be | |
| Software, algorithm | NetMHC 4.0 | Andreatta and Nielsen (2016) | http://www.cbs.dtu.dk/services/NetMHC/ |
Additional files
-
Supplementary file 1
List of previously known and newly predicted HLA-bound peptides.
(a) Peptides used for initial A*01:01 multimer staining. (b) Peptides used for initial A*02:01 multimer staining and measurement of peptide exchange efficiency. (c) Peptides used for initial A*24:02 multimer staining. (d) Peptides used for initial B*07:02 multimer staining and measurement of peptide exchange efficiency. (e) Peptides used for initial B*08:01 multimer staining. (f) Peptides used for initial C*05:01 multimer staining. (g) Peptides used for initial C*07:01 multimer staining. (h) Peptides used for initial C*07:02 multimer staining and measurement of peptide exchange efficiency. (i) Other peptides used for initial pHLA multimer staining.
- https://cdn.elifesciences.org/articles/53244/elife-53244-supp1-v2.xlsx
-
Supplementary file 2
List of overlapping peptides covering whole proteins.
(a) MART1-derived overlapping peptides. (b) NY-ESO-1-derived overlapping peptides. (c) SSX2-derived overlapping peptides. (d) gp100-derived overlapping peptides. (e) MAGE-A1-derived overlapping peptides. (f) Survivin-derived overlapping peptides.
- https://cdn.elifesciences.org/articles/53244/elife-53244-supp2-v2.xlsx
-
Supplementary file 3
CDR3 sequences of TCR genes isolated from multimer-positive TILs.
- https://cdn.elifesciences.org/articles/53244/elife-53244-supp3-v2.xlsx
-
Supplementary file 4
Twenty-five class I alleles for which paired multimers and artificial APCs were generated.
- https://cdn.elifesciences.org/articles/53244/elife-53244-supp4-v2.xlsx
-
Transparent reporting form
- https://cdn.elifesciences.org/articles/53244/elife-53244-transrepform-v2.docx
Download links
A two-part list of links to download the article, or parts of the article, in various formats.
Downloads (link to download the article as PDF)
Open citations (links to open the citations from this article in various online reference manager services)
Cite this article (links to download the citations from this article in formats compatible with various reference manager tools)
Landscape mapping of shared antigenic epitopes and their cognate TCRs of tumor-infiltrating T lymphocytes in melanoma
eLife 9:e53244.
https://doi.org/10.7554/eLife.53244


