Structural basis for pharmacological modulation of the TRPC6 channel
- Department of Molecular Engineering, Amgen Research, Amgen Inc, United States
- Department of Protein Technologies, Amgen Research, Amgen Inc, United States
- Department of Medicinal Chemistry, Amgen Research, Amgen Inc, United States
- Department of Cardiometabolic Disorders, Amgen Research, Amgen Inc, United States
- Department of Discovery Technologies, Amgen Research, Amgen Inc, United States
Figures
Figure 1 with 3 supplements
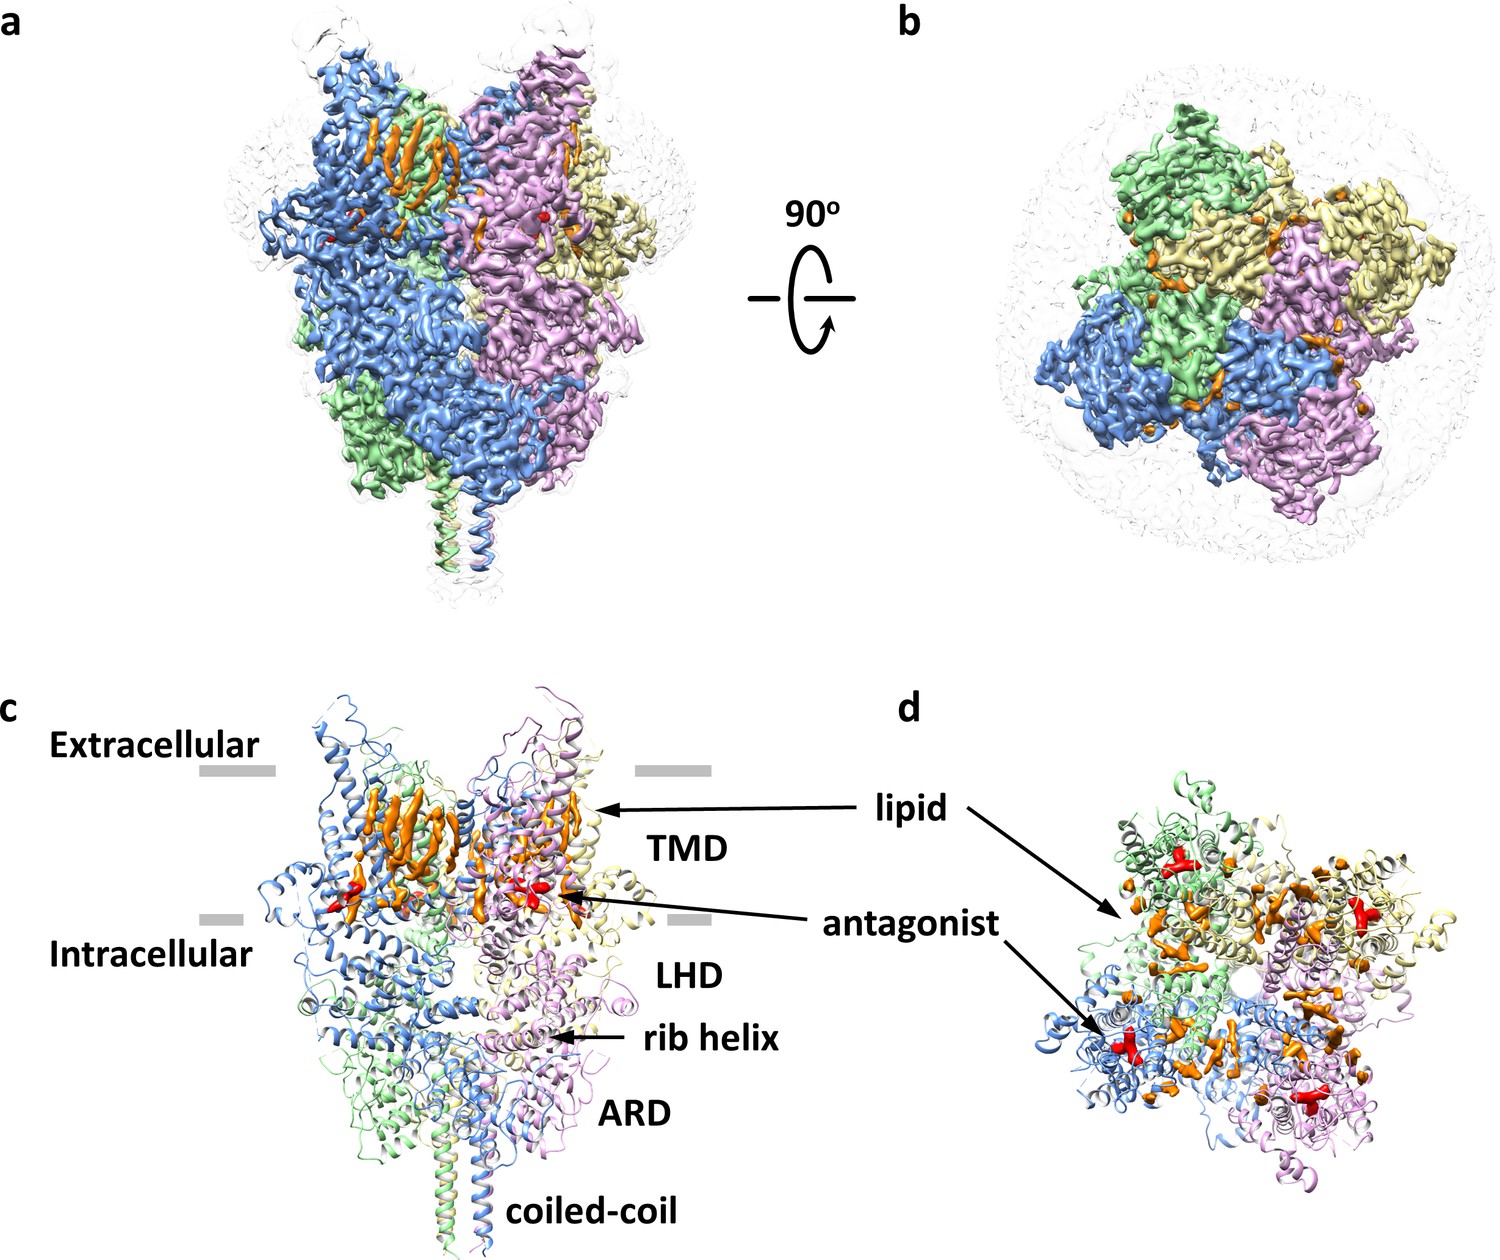
Overall architecture of the antagonist-bound TRPC6.
(a, b) Cryo-EM map of the antagonist-bound TRPC6 viewed from parallel of the membrane (a) and the extracellular surface (b). The unsharpened reconstruction was shown in transparent gray. Lipids are colored in orange, and antagonists in red. (c, d) Structure model shown in corresponding orientations as in (a) and (b). Cryo-EM densities for lipids and antagonists are superimposed over the model and colored as in a and b.
Figure 1—figure supplement 1
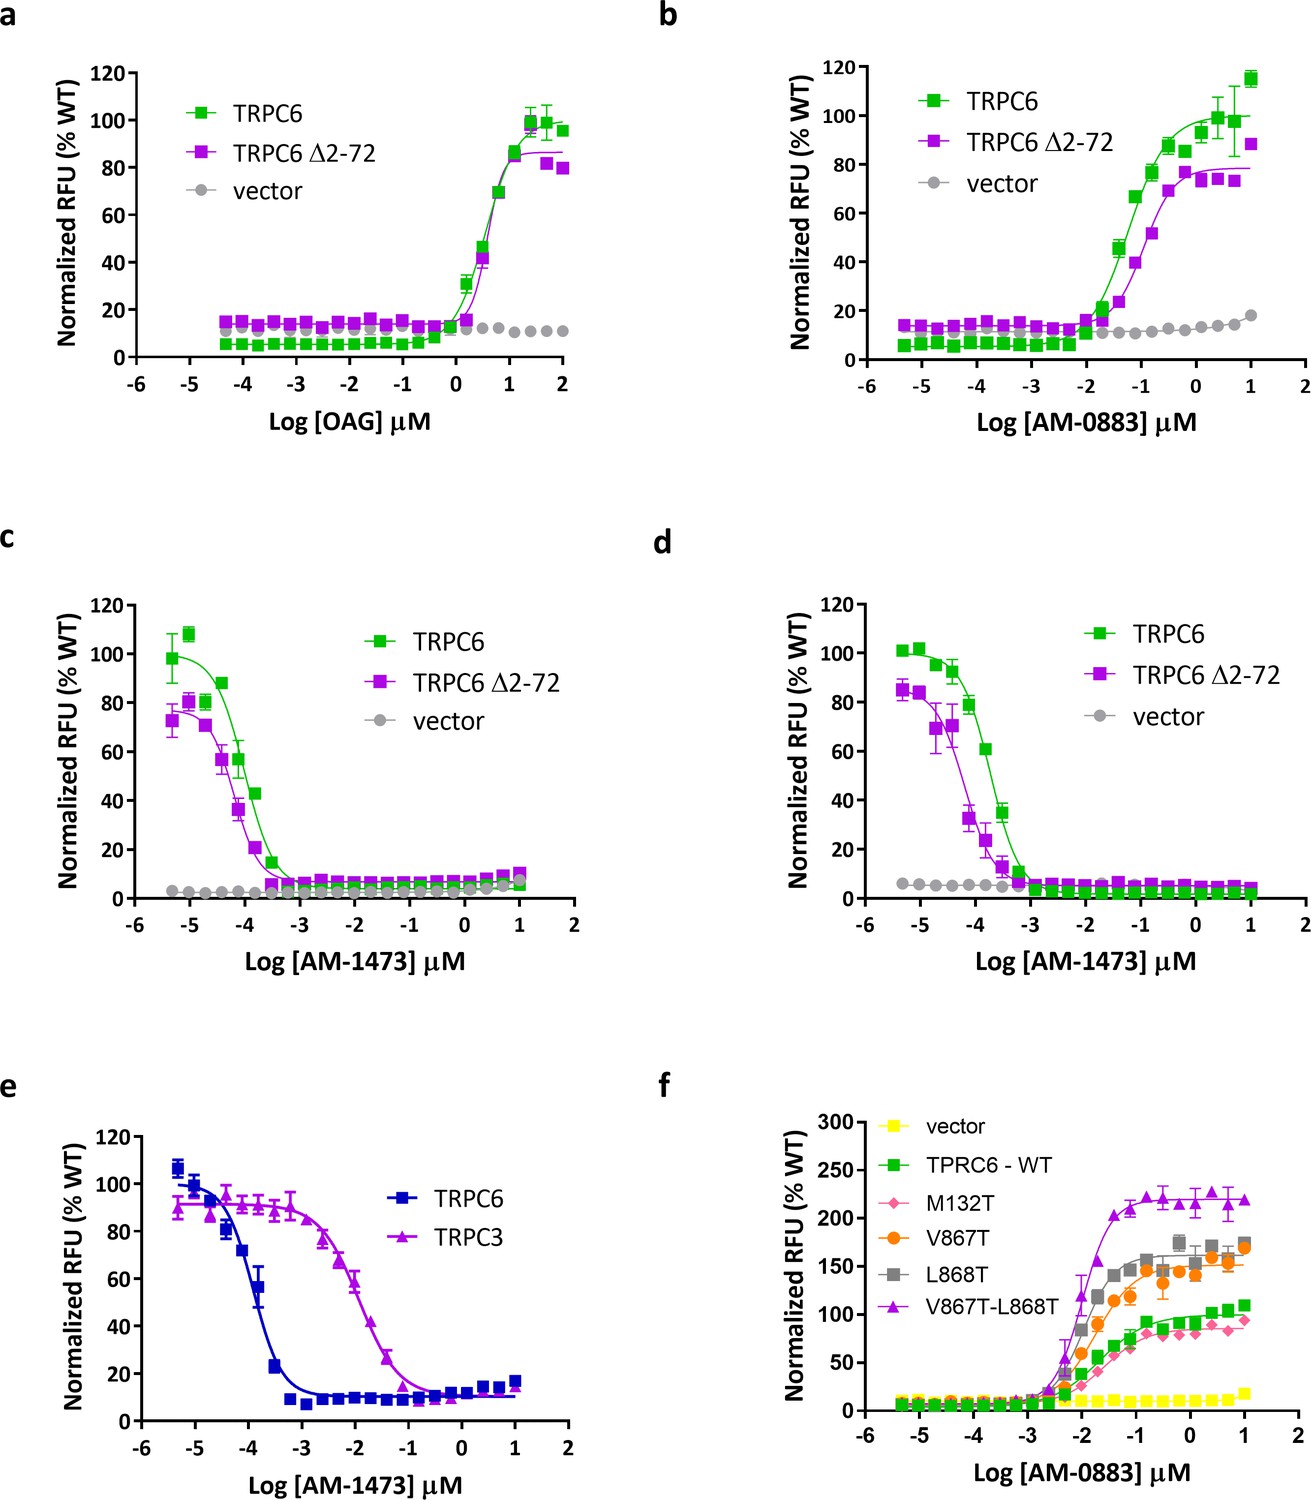
Functional characterization of wild-type and (Δ2–72) TRPC6.
(a, b) Dose-response curves for TRPC6 activation by OAG (a) and agonist AM-0883 (b). (c, d) Dose-response curves for TRPC6 inhibition by antagonist AM-1473 in the presence of OAG (c) and agonist AM-0883 (d). (e) Dose-response curves for activation of WT and mutant TRPC6 channels by agonist AM-0883. (f) Dose-response curves for TRPC3 and TRPC6 inhibition by antagonist AM-1473.
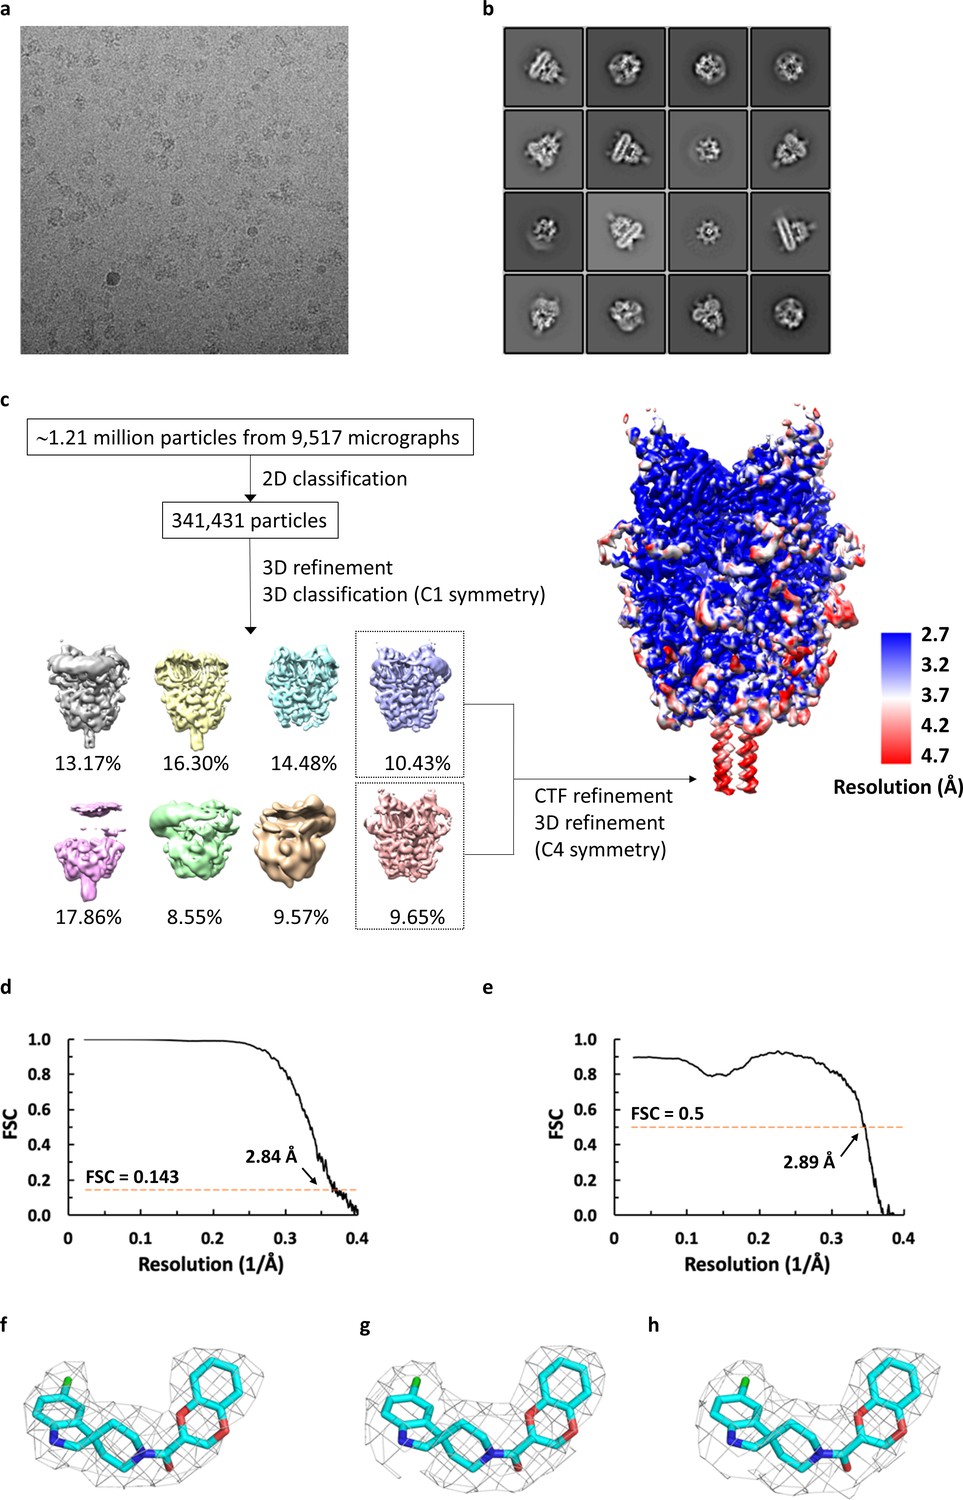
Figure 1—figure supplement 2
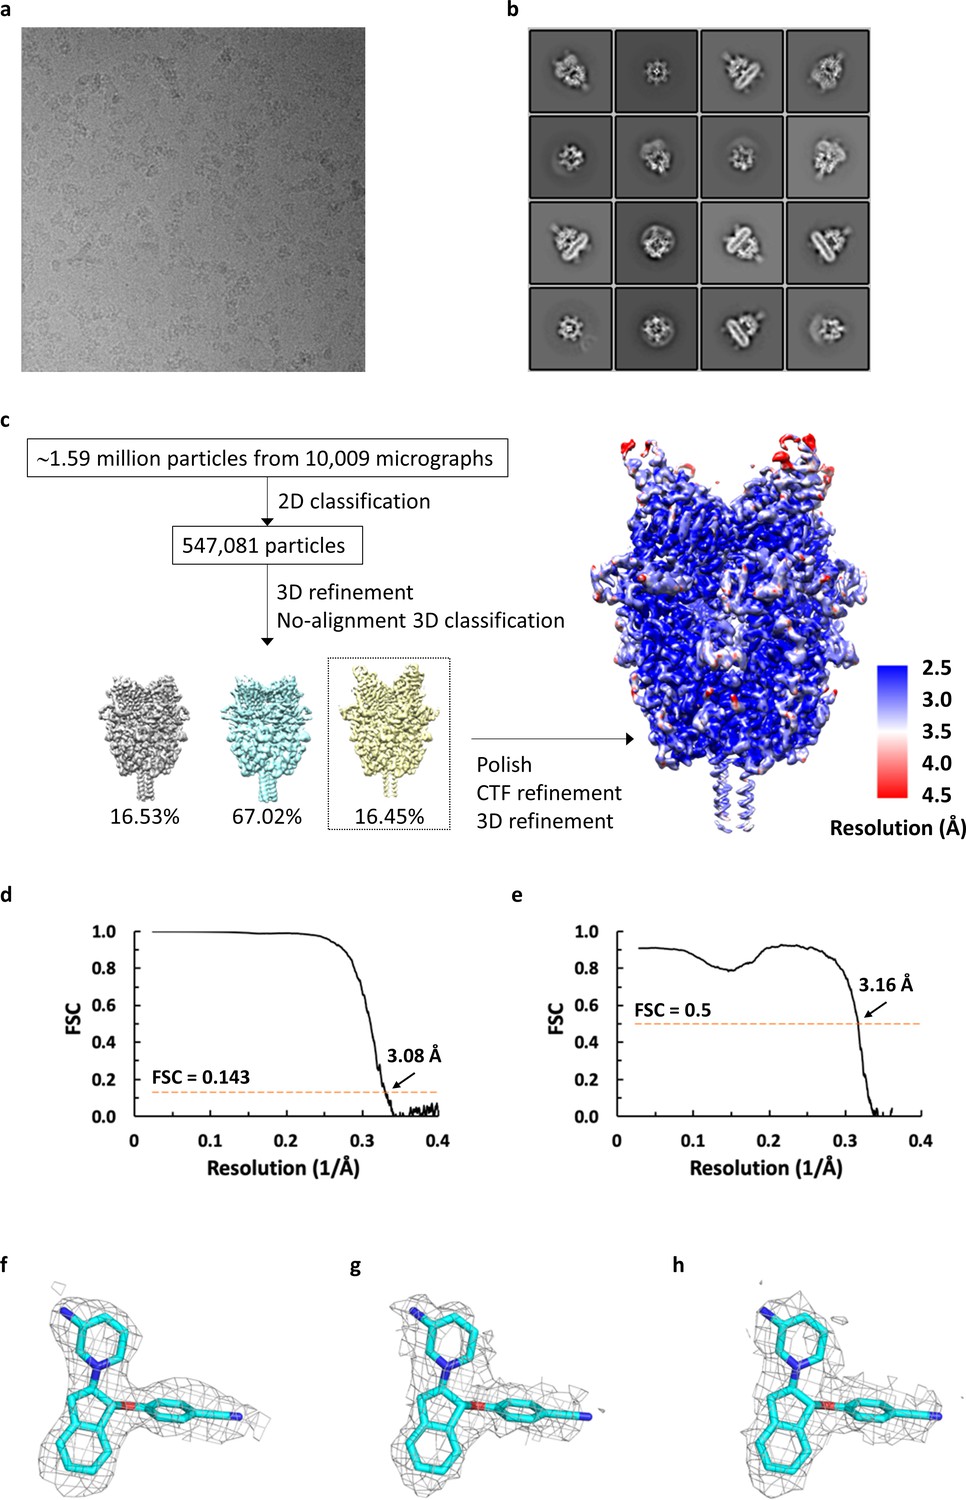
Cryo-EM analysis of antagonist-bound TRPC6.
(a) Representative micrograph for TRPC6 in complex with antagonist reconstituted in nanodiscs. (b) Selected 2D class averages showing well-defined secondary-structural features and different orientations. (c) Workflow of cryo-EM data processing of antagonist-bound TRPC6 and local resolution mapped on final unsharpened map calculated using ResMap. (d) Fourier shell correlation curve for masked half-maps. (e) Fourier shell correlation curve for model versus map. (f-h) Density for the antagonist from final sharpened map (f) and two corresponding half maps (g, h).
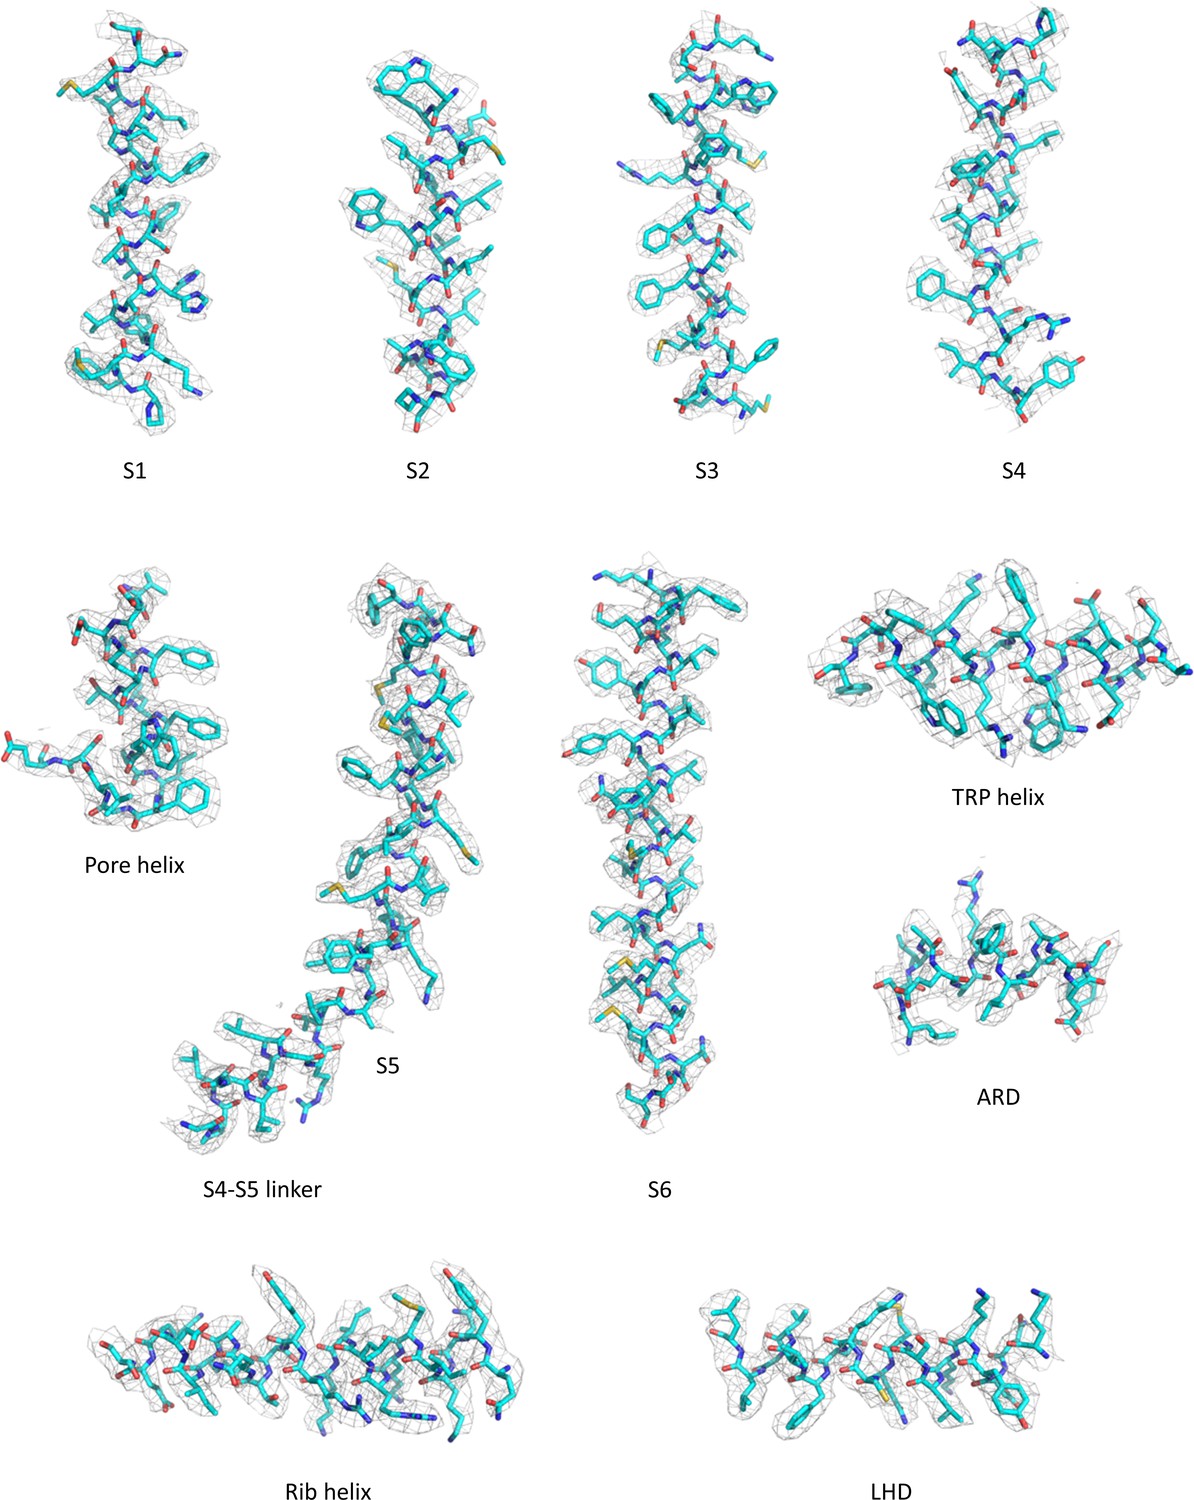
Figure 1—figure supplement 3
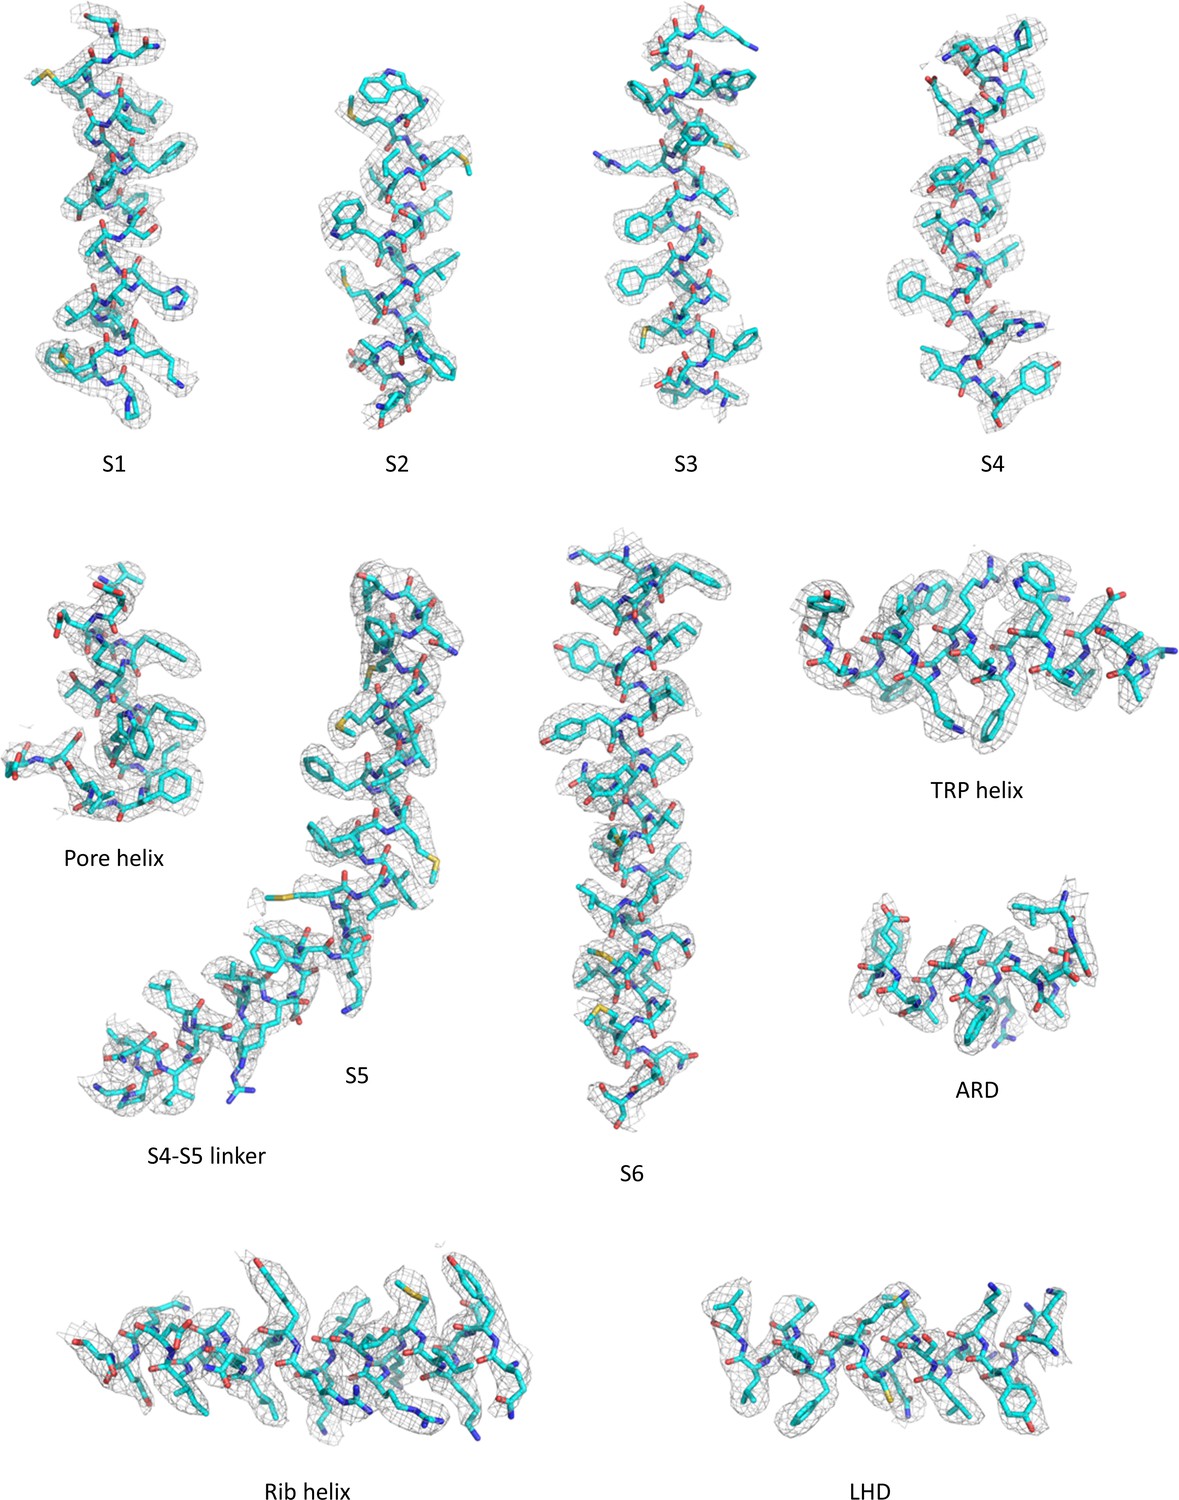
Representative densities for the antagonist-bound TRPC6 reconstruction.
Figure 2 with 4 supplements
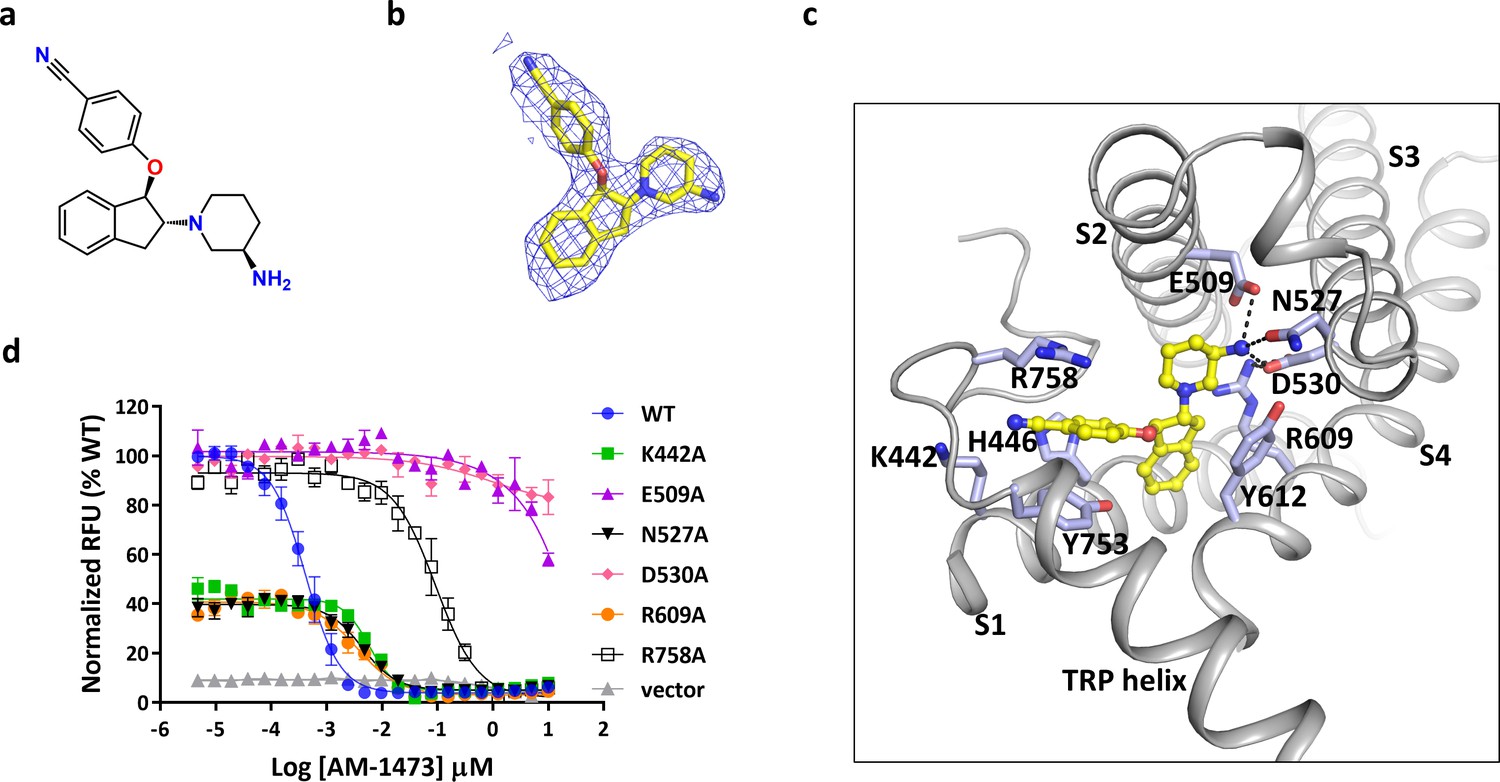
Binding of antagonist to TRPC6.
(a) Chemical structure of the antagonist AM-1473. (b) Stick model of the antagonist model together with EM density depicted in blue mesh. (c) Close-up view of the antagonist-binding site. Residues within van der Waals distances are shown in light blue sticks. Hydrogen bonds are shown in black dashed lines. (d) Dose-response curves for TRPC6 inhibition of wild-type and mutant TRPC6 channels replacing residues that interact with the antagonist.
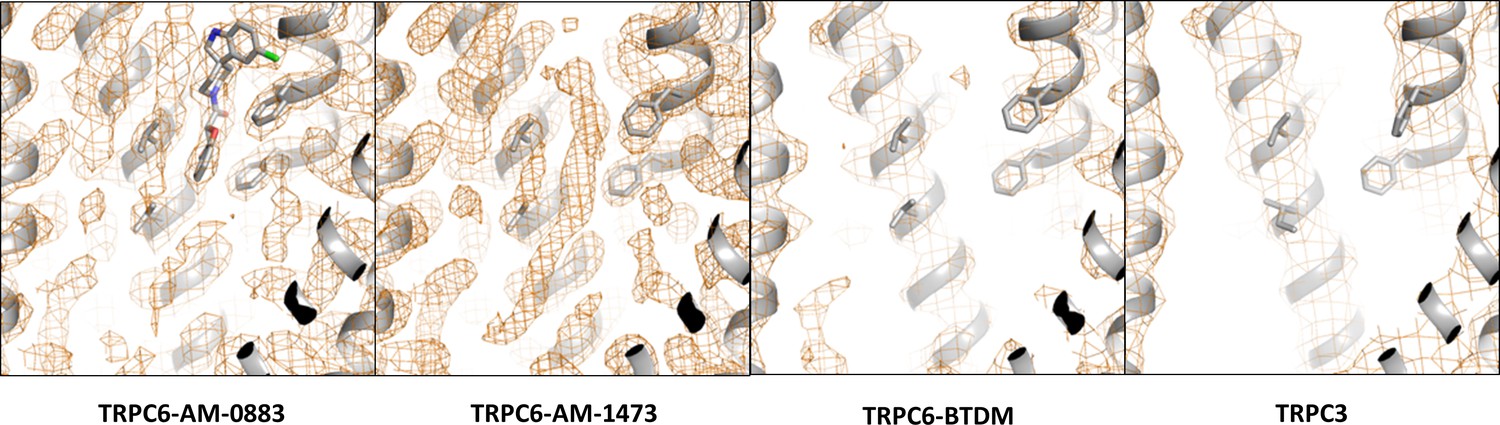
Figure 2—figure supplement 1
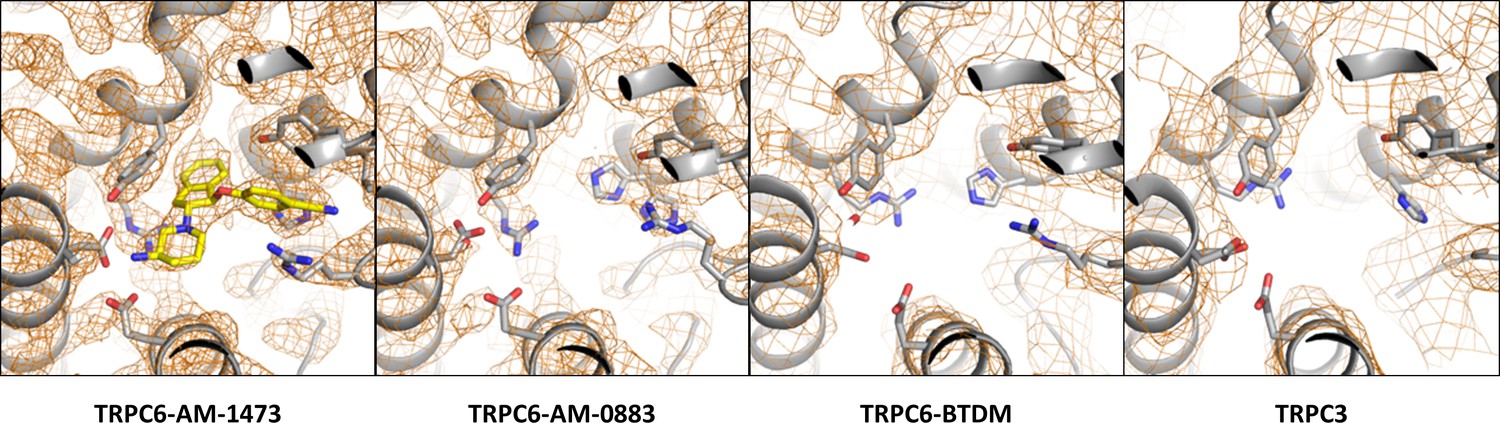
Density around the antagonist-binding site in the antagonist-bound TRPC6, agonist-bound TRPC6, BTDM-bound TRPC6 (PDB 5YX9), and TRPC3 (PDB 5ZBG) reconstructions.
Figure 2—figure supplement 2
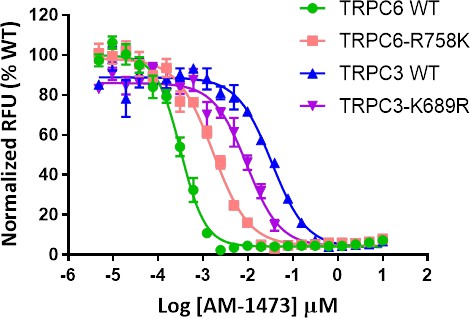
Dose-response curves for inhibition of TRPC6, TRPC6-R758K, TRPC3, and TRPC3-K689R by antagonist AM-1473 in the presence of OAG.
Figure 2—figure supplement 3
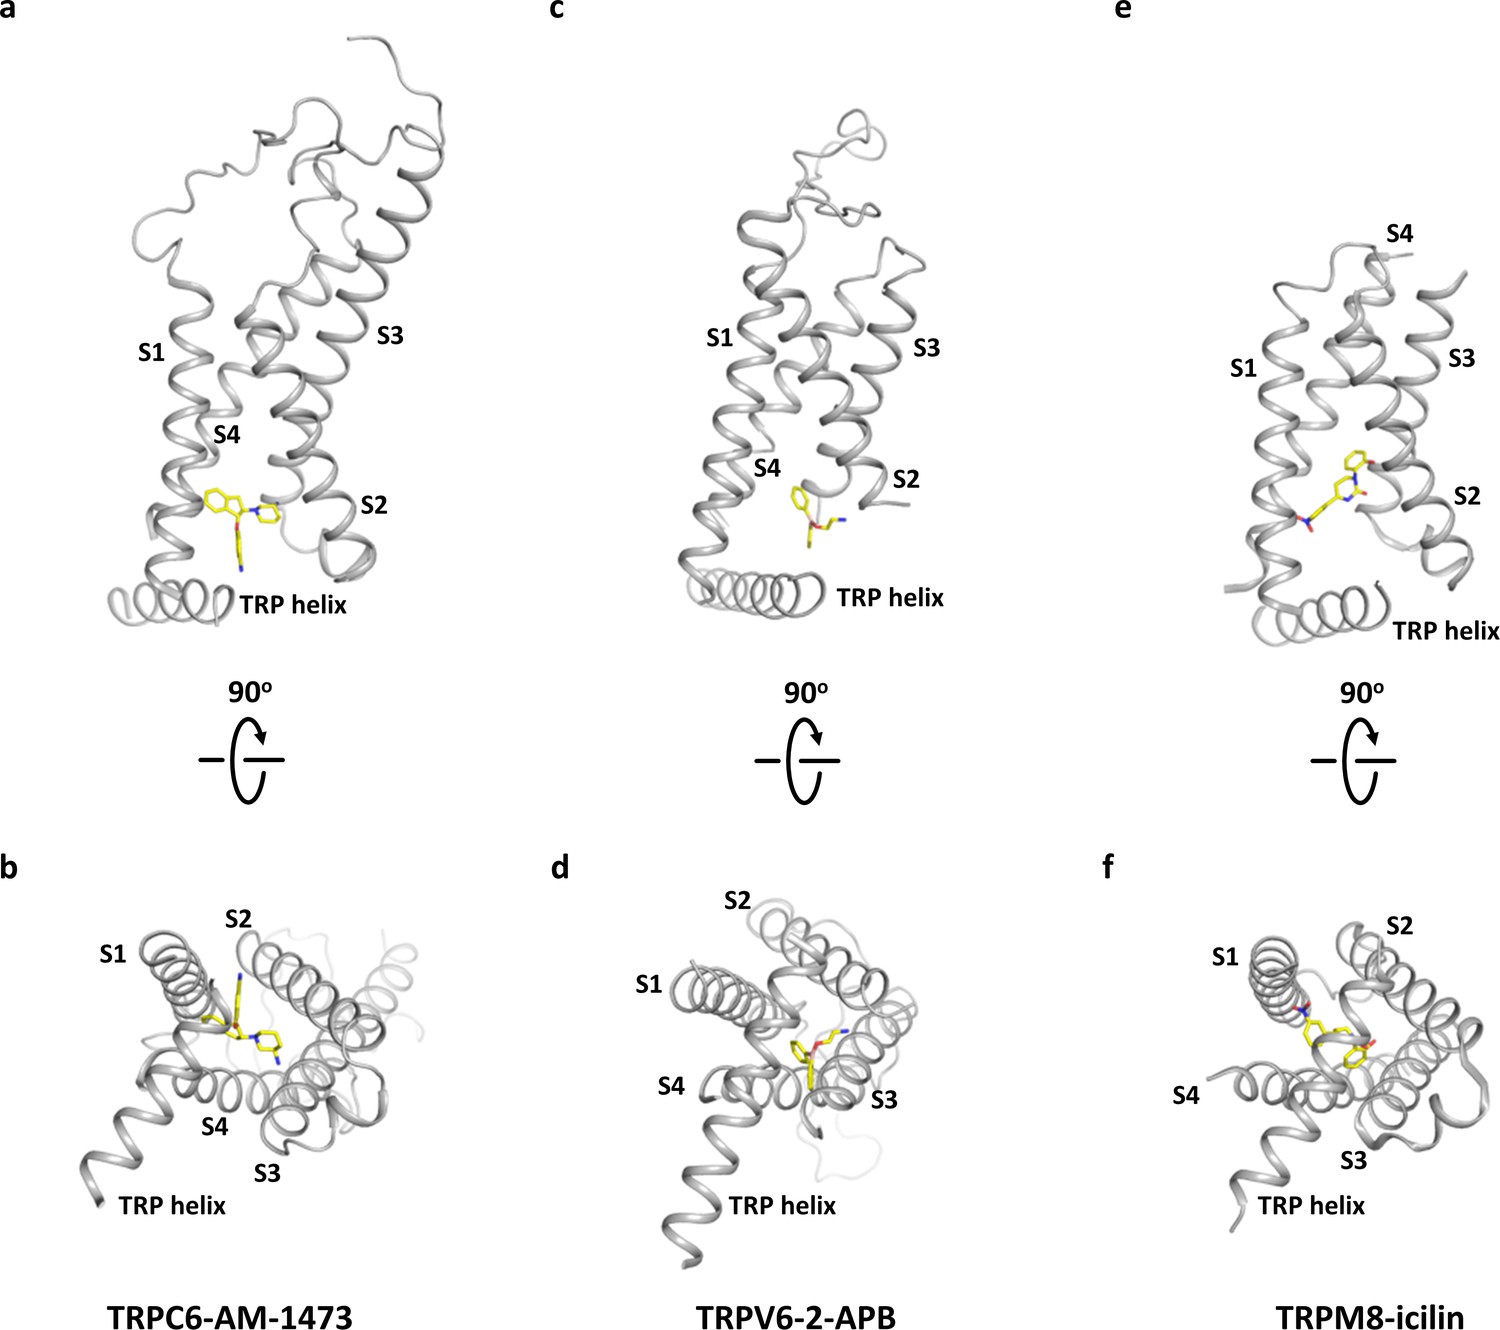
Comparison of the modulation site located in the cytoplasm-facing pocket formed by S1-S4.
(a, b) Binding site of the antagonist AM-1473 in TRPC6 viewed parallel to the membrane (a) and from the intracellular side (b). (c, d) Binding site of the antagonist 2-aminoethoxydiphenyl borate (2-APB) in TRPV6 shown in the same orientation as a and b. (e, f) Binding site of the agonist icilin in TRPM8 shown in the same orientation as a and b.
Figure 2—figure supplement 4
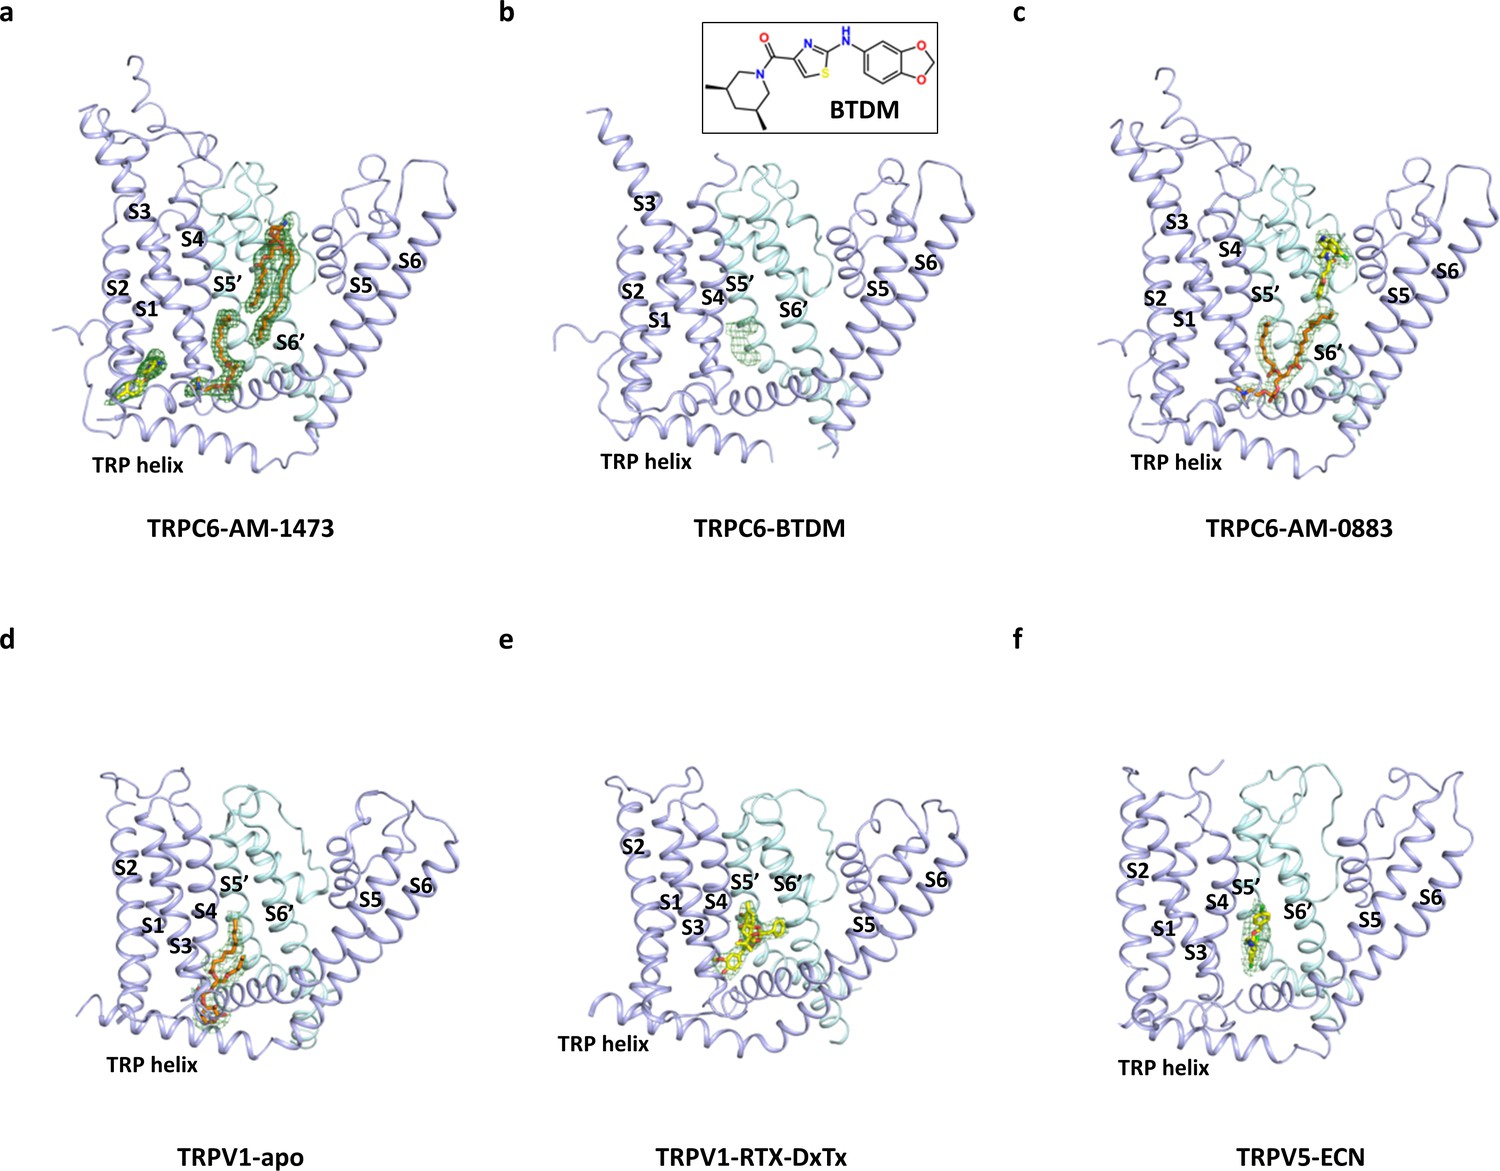
Comparison of the lipid-binding site at the inner leaflet.
(a) Side view of TMD of one subunit and S5-S6 of the adjacent subunit in the antagonist-bound state of TRPC6. Density for two lipid molecules is shown in green meshes. Models for the lipids are shown in orange sticks. (b) Binding site of BTDM in TRPC6 shown in the same orientation as a. Putative density for BTDM is shown in green meshes. Due to limited resolution of the density, the model for BTDM was not built. Inlet shows chemical structure of BTDM. (c) Binding site of the inner leaf lipid and the agonist in the agonist-bound state of TRPC6. Density for the lipid and the agonist is shown in green meshes. Models for the lipid and the agonist are shown in orange and yellow sticks, respectively. (d) Binding site of the phosphatidylinositol lipid in the apo-TRPV1 structure shown in the same orientation as a. Lipid density is shown in green meshes. Lipid model is shown in orange sticks. (e) Binding site of the vanilloid agonist resiniferatoxin (RTX) in the structure of TRPV1 bound to double-knot toxin (DxTX) and RTX shown in the same orientation as a. RTX density is shown in green meshes. RTX model is shown in yellow sticks. (f) Binding site of econazole (ECN) in the TRPV6 structure shown in the same orientation as a. Density for ECN is shown in green meshes. Model for ECN is shown in yellow sticks.
Figure 3 with 1 supplement
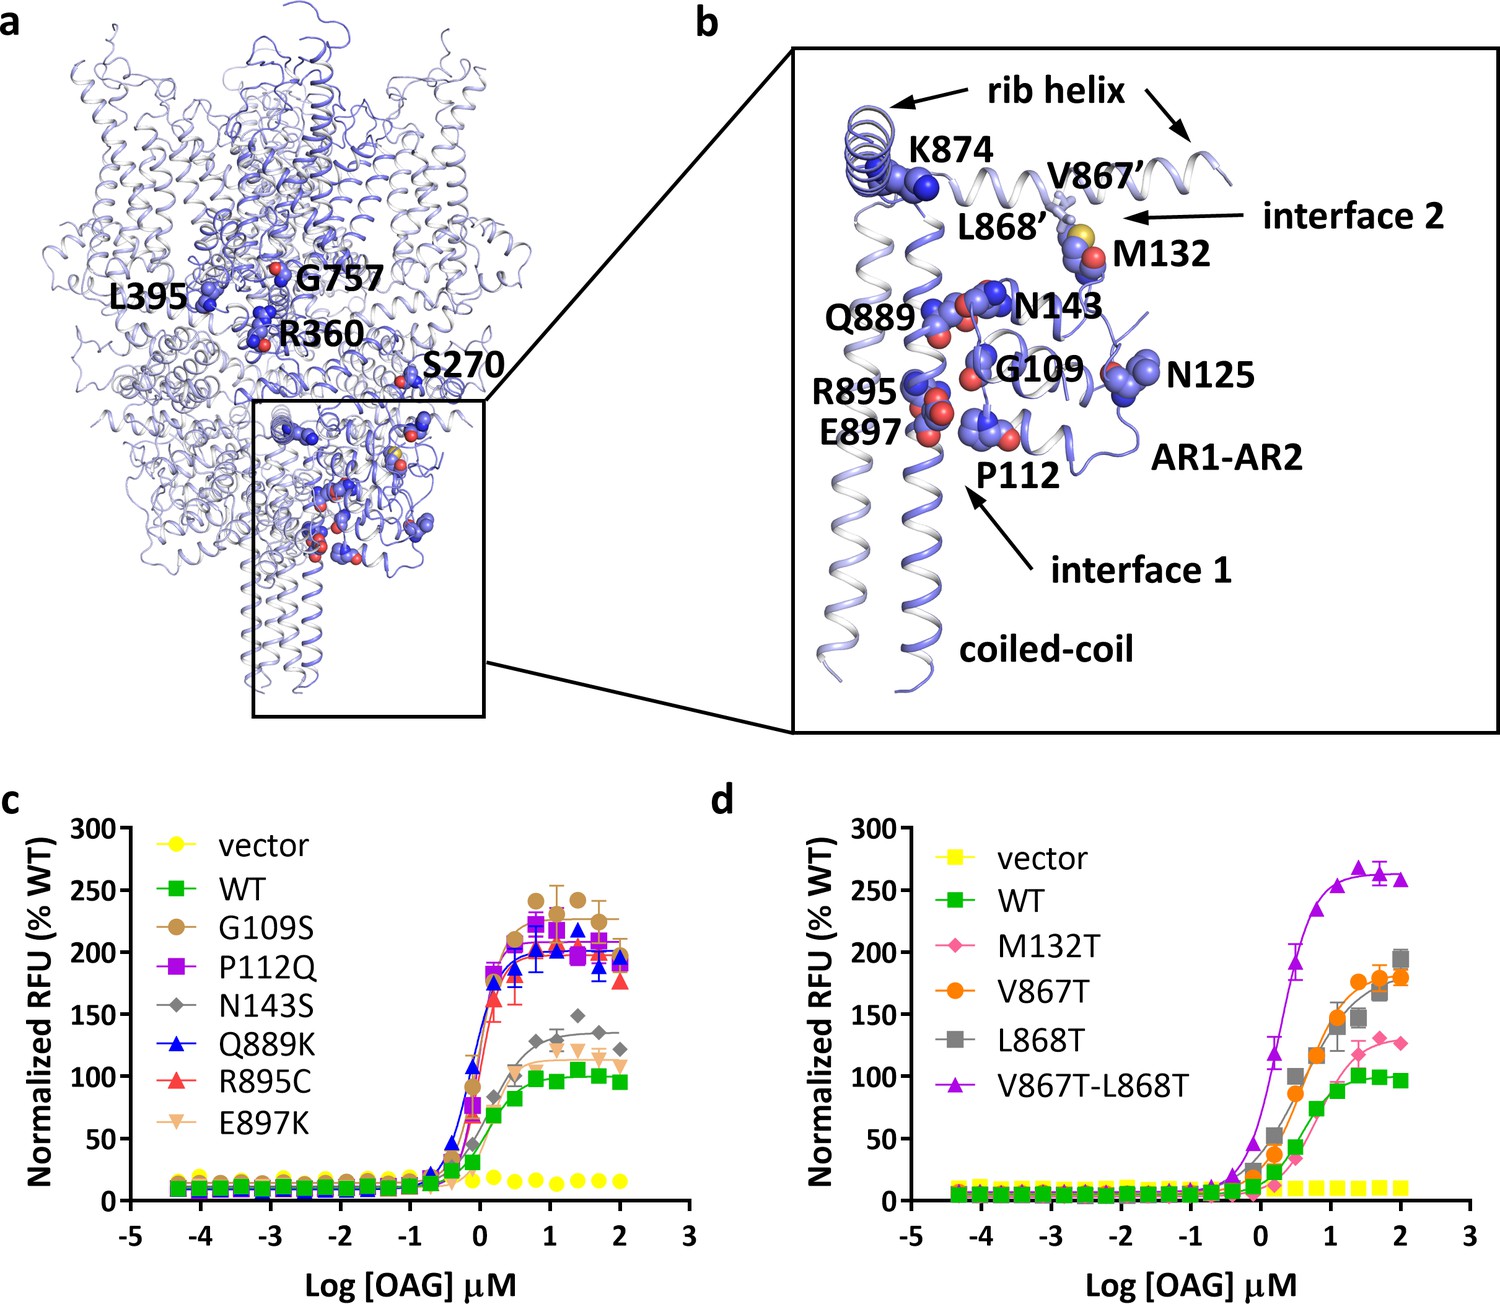
Location of FSGS-related mutations.
(a) Overall structure with one subunit shown in blue and other three subunits in light blue. Residues whose mutations cause FSGS are shown as spheres on one subunit. (b) Close-up view of disease-related residues around the first two ankyrin repeats and C-terminal helices as boxed in (a). Side chains of V867 and L868, which form hydrophobic interactions with M132 in the adjacent subunit, are shown as sticks. (c, d) Dose-response curves for OAG activation of wild-type and mutant TRPC6 channels. Mutations located at interface 1 are shown in c, and mutations located at interface 2 are shown in d.
Figure 3—figure supplement 1
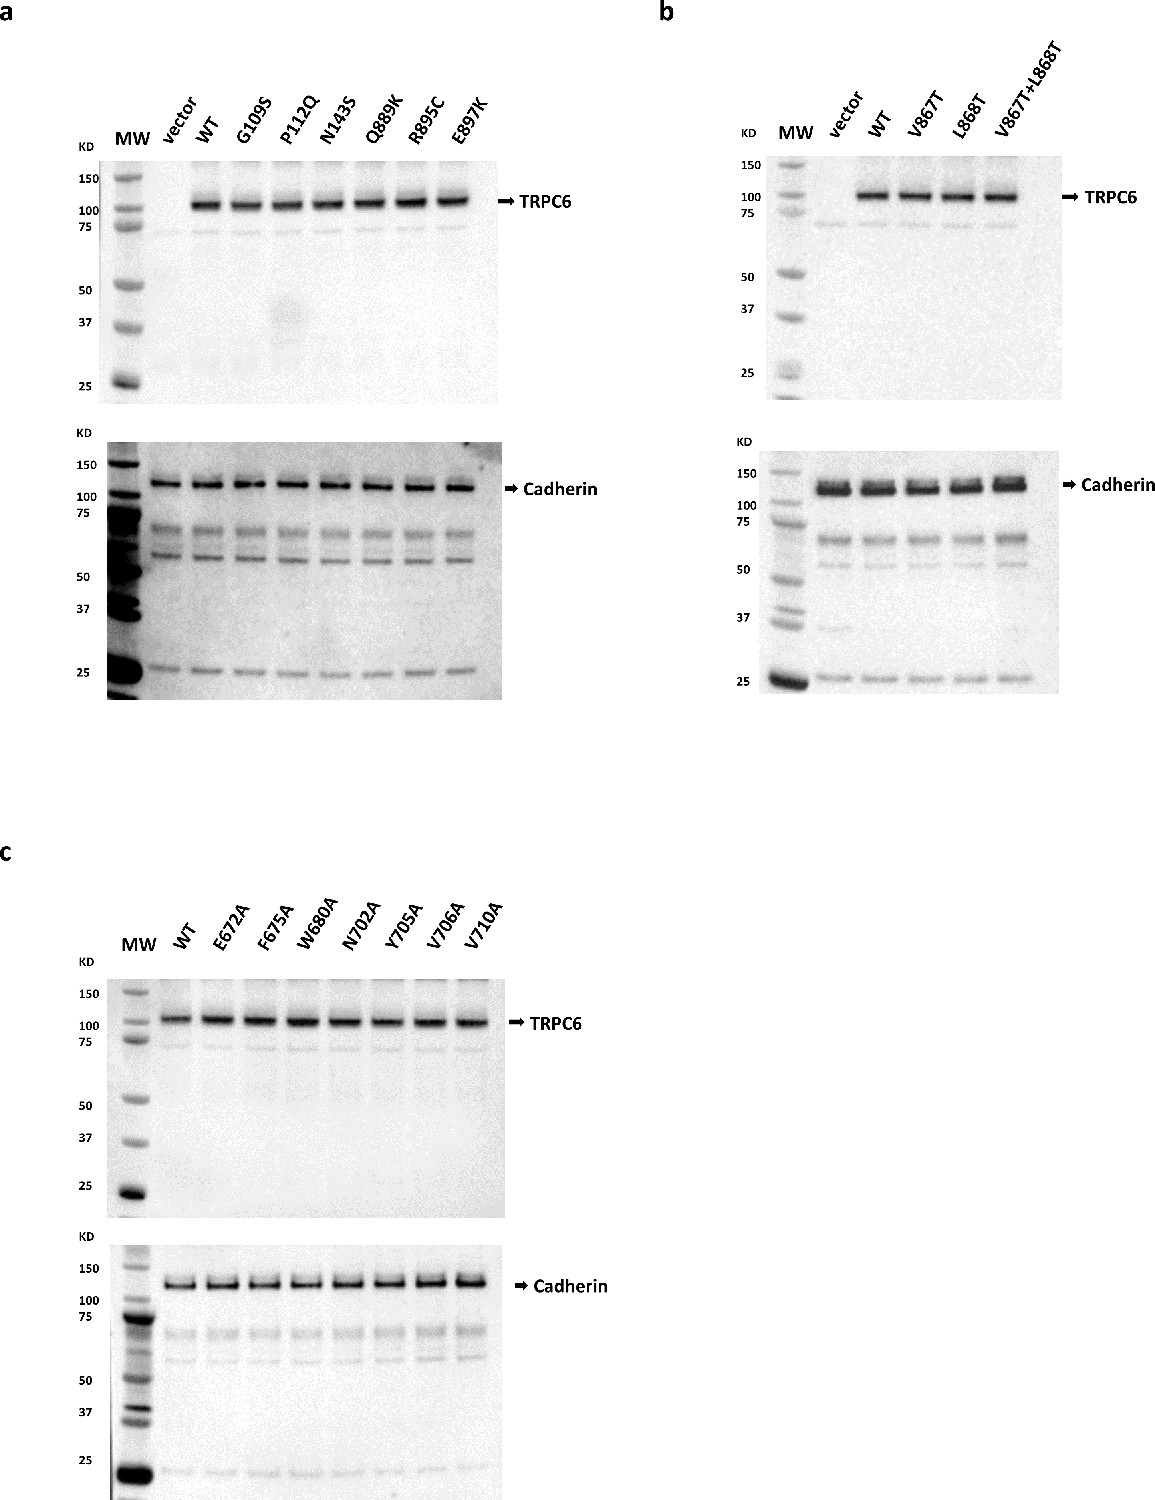
Surface expression level of TRPC6 wild type and mutants.
(a) Surface expression level of TRPC6 wild type and disease-related mutants. (b) Surface expression level of TRPC6 wild type and TRPC6 with single or double mutations at positions 867 and 868. (c) Surface expression level of TRPC6 wild type and TRPC6 with mutations around the agonist-binding site. Top panel, cell surface TRPC6 (MW: 106 kDa) or mutant protein levels from HEK293T cells transiently transfected with various TRPC6 expression plasmids, as indicated. Bottom panel: cell surface Cadherin levels (125–135 kDa) detected using a anti pan-Cadherin antibody. Cell surface proteins were isolated from HEK293T cells 24 hr post-transfection of vector or TRPC6 expression plasmids. Purification of cell surface proteins was accomplished utilizing the Pierce Cell Surface Protein Isolation Kit (Thermo Scientific Catalog #89881) following the manufacturer’s protocol. Briefly, cell surface proteins were biotinylated and subsequently the reaction was quenched. Equal amounts (μg protein) of cell lysates were purified over avidin columns and eluted using SDS sample buffer containing 50 mM DTT. Cell surface protein eluates were separated on an 4–12% gradient SDS-PAGE gel and TRPC6 protein was detected following Western blot with anti-TRPC6 antibodies (Sigma #T6442). As an internal control, cell surface cadherin levels were also determined in a separate Western blot utilizing anti pan-Cadherin antibodies (Abcam #ab6529).
Figure 4 with 2 supplements
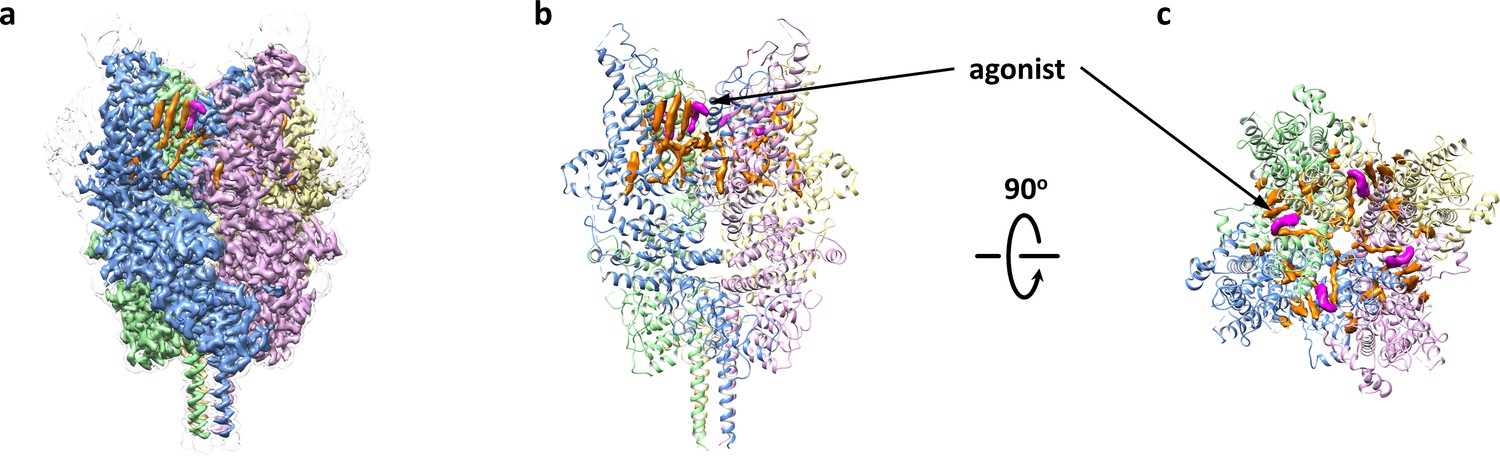
Overall architecture of the agonist-bound TRPC6.
(a) Cryo-EM map of the agonist-bound TRPC6 viewed from parallel of the membrane. The unsharpened reconstruction was shown in transparent gray. Lipids are colored in orange, and agonists in magenta. (b, c) Structure model viewed from parallel of the membrane (b) and the extracellular domain (c). Cryo-EM densities for lipids and antagonists are superimposed over the model and colored as in a.
Figure 4—figure supplement 1
Cryo-EM analysis of agonist-bound TRPC6.
(a) Representative micrograph for TRPC6 in complex with agonist reconstituted in nanodiscs. (b) Selected 2D class averages showing well-defined secondary-structural features and different orientations. (c) Workflow of cryo-EM data processing of antagonist-bound TRPC6 and local resolution mapped on final unsharpened map calculated using ResMap. (d) Fourier shell correlation curve for masked half-maps. (e) Fourier shell correlation curve for model versus map.f-h. Density for the agonist from final sharpened map (f) and two corresponding half maps (g,h).
Figure 4—figure supplement 2
Representative densities for the agonist-bound TRPC6 reconstruction.
Figure 5 with 3 supplements

Binding of agonist to TRPC6.
(a) Chemical structure of the agonist AM-0883. AM-0883 was synthesized as a racemate and then separated into enantiomers with arbitrarily assigned stereochemistry. The two enantiomers showed a 50-fold difference in potency in our bioassay. Since both enantiomers could be fit into the cryo-EM density, furthur work is needed to differentiate them. Here only the R-configuration is described. (b) Stick model of the agonist together with EM density depicted in blue mesh. (c) Close-up view of the agonist-binding site. Residues within van der Waals distances are shown in light blue sticks for one subunit and green sticks for another subunit. Hydrogen bonds are shown in black dashed lines. (d, e) Dose-response curves for TRPC6 activation by agonists AM-0883 (d) and OAG (e) of wild-type and mutant TRPC6 channels replacing residues that interact with the agonist.
Figure 5—figure supplement 1
Density around the agonist-binding site in the agonist-bound TRPC6, antagonist-bound TRPC6, BTDM-bound TRPC6 (PDB 5YX9), and TRPC3 (PDB 5ZBG) reconstructions.
Figure 5—figure supplement 2

Sequence alignment of human TRPCs for the two helices that contribute to the binding-site of agonist.
Residues that appear to interact with the agonist in TRPC6 and conserved in other TRPC variants are highlighted in yellow. Residue numbers for TRPC6 are marked.
Figure 5—figure supplement 3
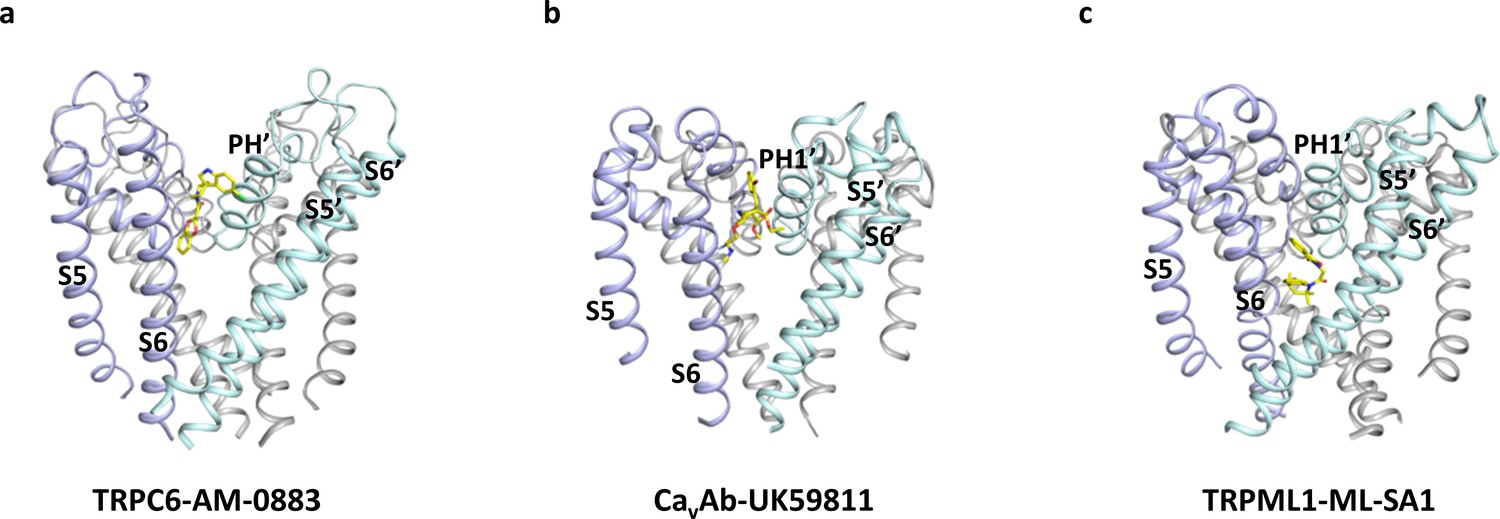
Comparison of the modulation site located at the subunit interface in the TMD.
(a) Binding site of the agonist AM-0883 in TRPC6 viewed parallel to the membrane. (b) Binding site of the antagonist in CavAb shown in the same orientation as a. (c) Binding site of the agonist in TRML1 shown in the same orientation as a. Only S5-S6 are shown. Two subunits are colored in light blue and light cyan, and the other two subunits are colored in gray.
Figure 6
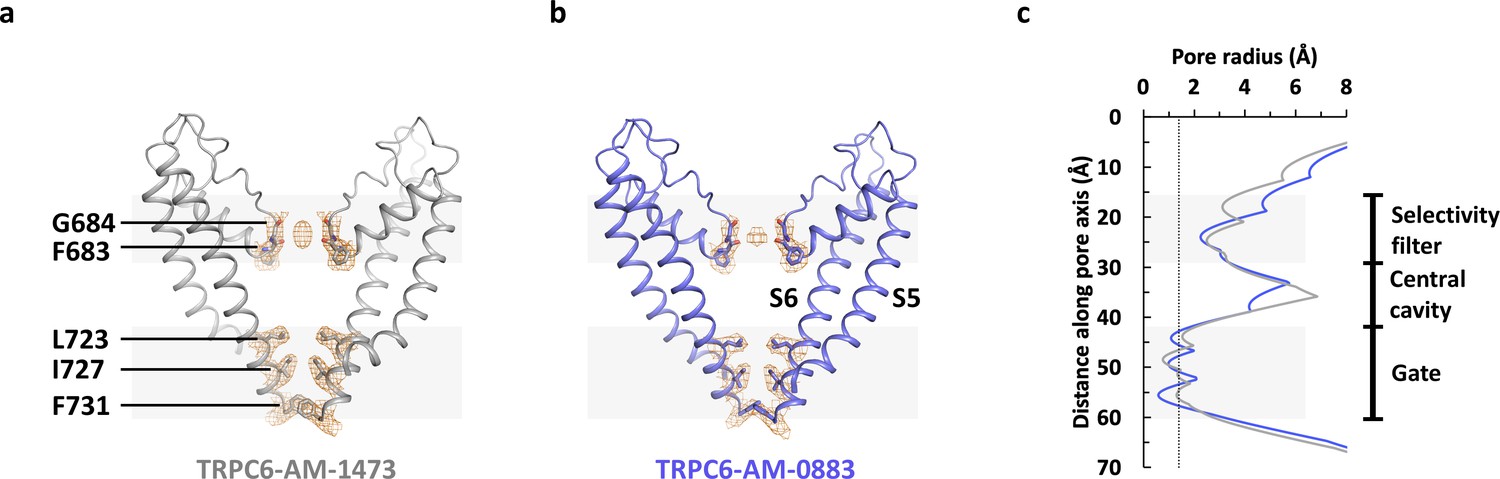
Ion channel pore.
(a, b) Pore domain (S5-S6) of antagonist-bound (a) and agonist-bound (b) TRPC6 with front and rear subunits removed for clarity. Residues that form the selectivity filter and the intracellular gate are shown as sticks. Cryo-EM densities for these residues are shown as orange mesh. (c) Calculated pore radius along the central axis corresponding to a and b.
Figure 7 with 2 supplements
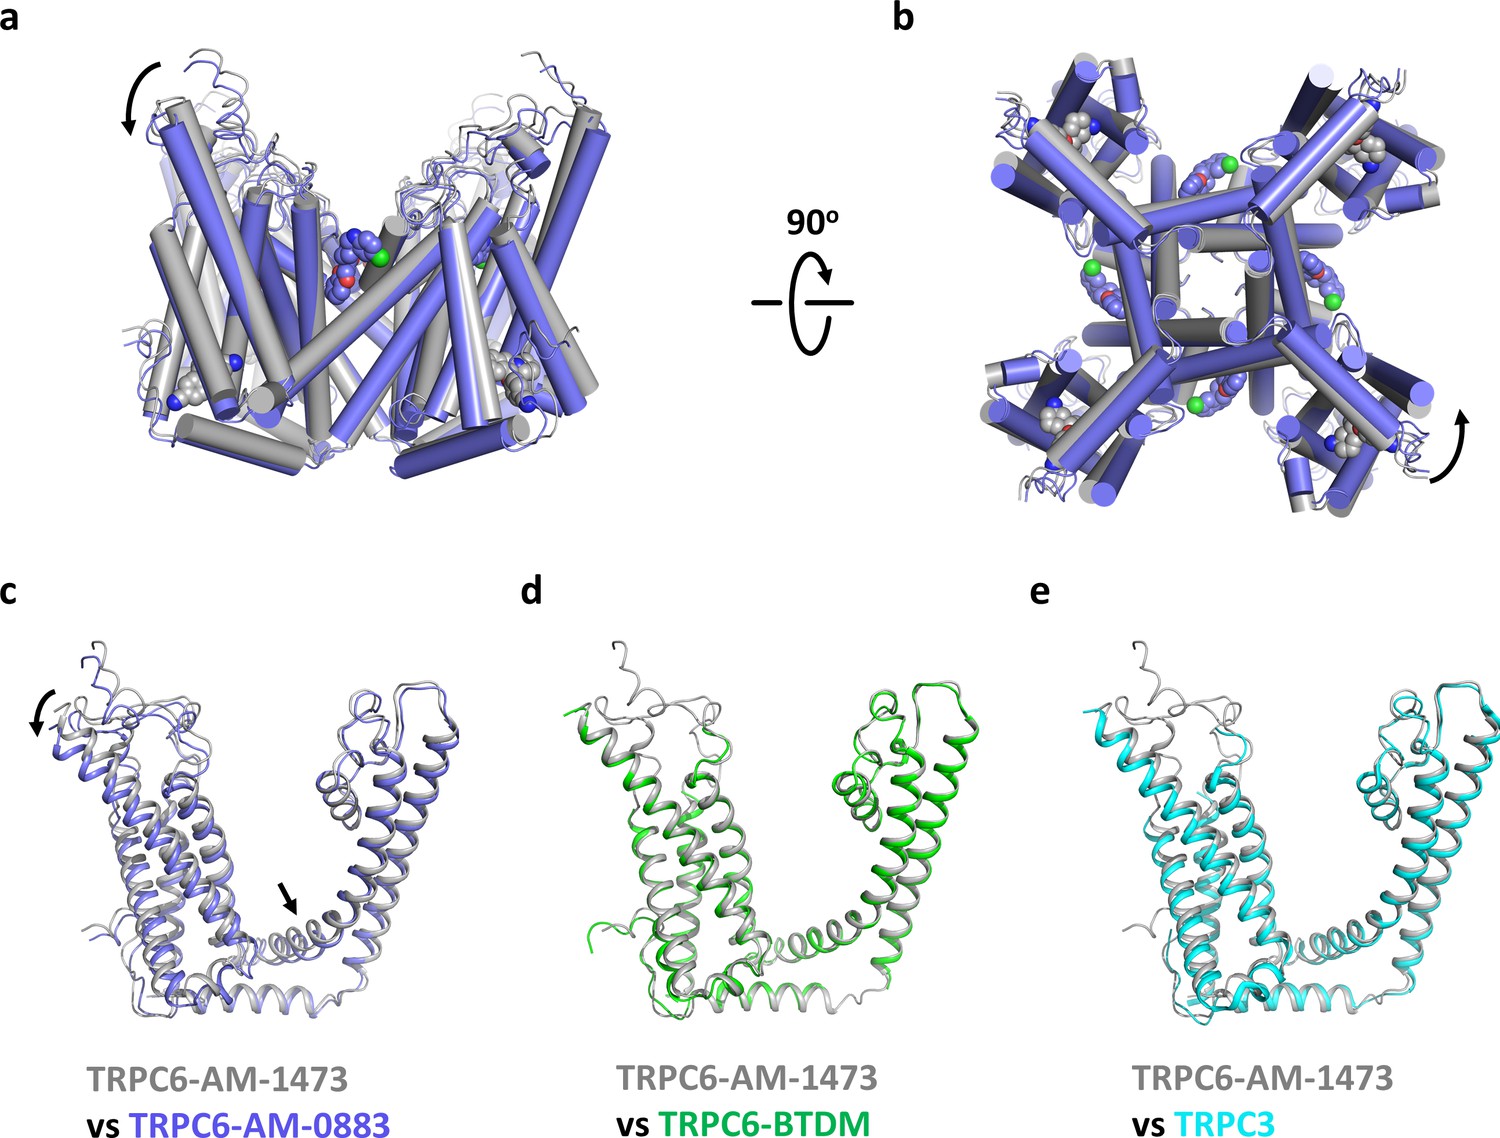
Conformational changes upon ligand binding.
(a, b) Structural superposition of the transmembrane domain of antagonist-bound and agonist-bound TRPC6 viewed from parallel of the membrane (a) and intracellular side (b). (c-e) Structure of one subunit of the transmembrane domain in AM-1473-bound TRPC6 superposed with that of AM-0883-bound TRPC6 (c), BTDM-bound TRPC6 (d, PDB 5YX9), and TRPC3 (e, PDB 5ZBG). The structures are aligned with the pore helices. Black arrows indicate conformational changes from antagonist-bound state to agonist-bound state. Antagonists and agonists are shown as spheres.
Figure 7—figure supplement 1
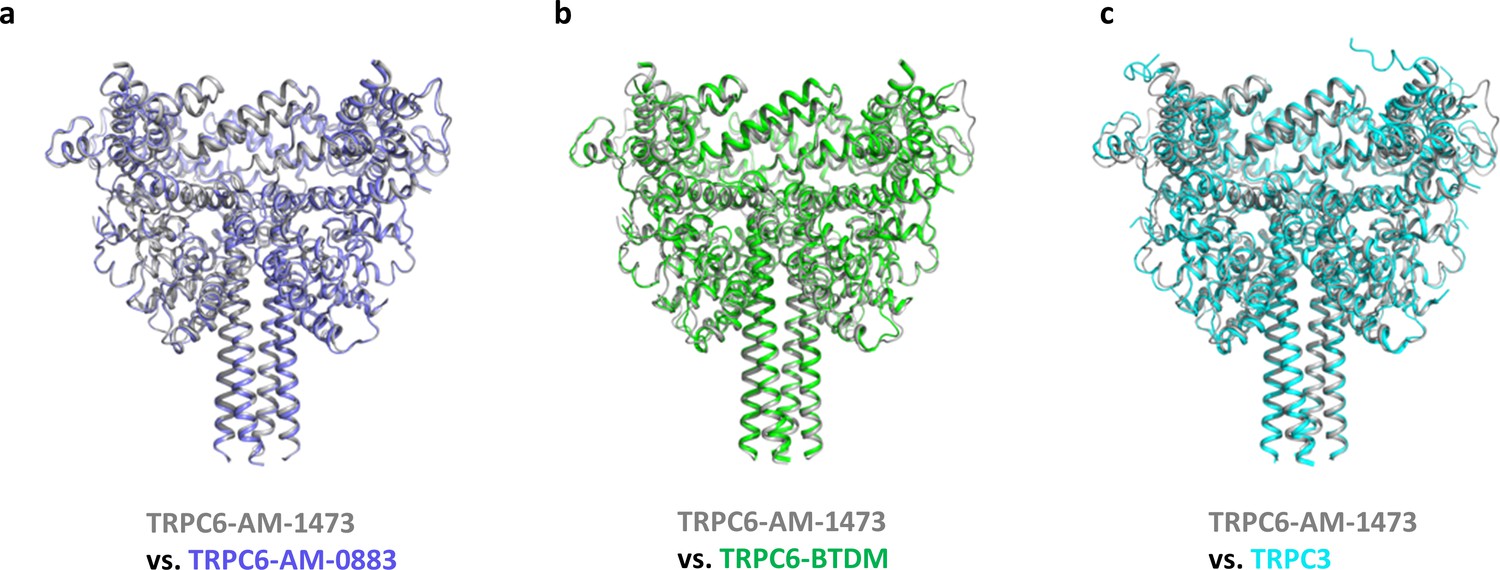
Superposition of the intracellular domain between TRPC6-AM-1473 and TRPC6-AM-0883 (a), TRPC6-BTDM (b, PDB 5YX9) and TRPC3 (c, PDB 5ZBG).
Figure 7—figure supplement 2
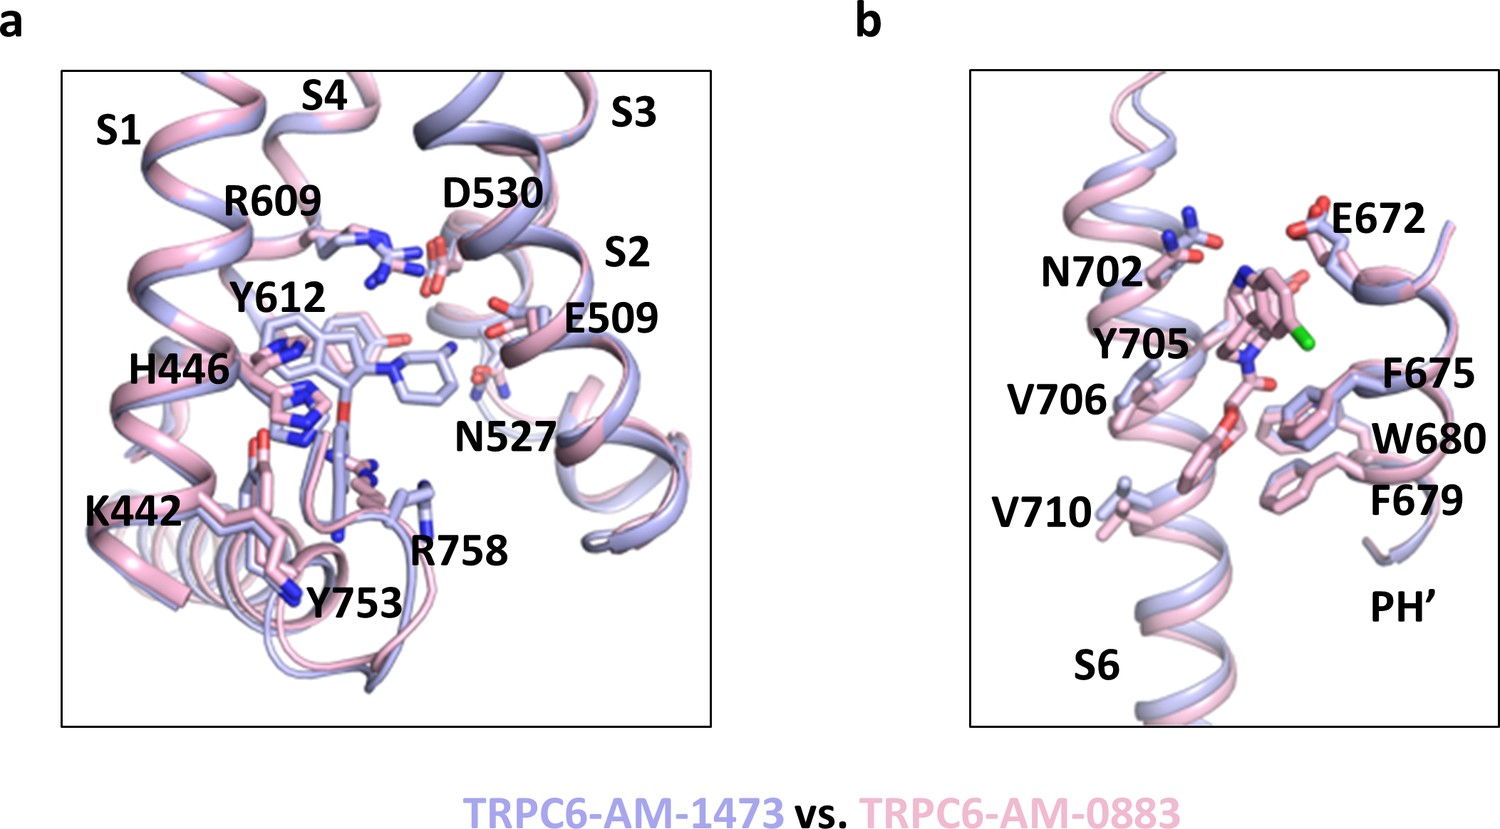
Structural comparison around the antagonist- and agonist- binding sites.
(a, b) Close-up views of the antagonist-binding site (a) and the agonist-binding site (b). Structures in (a) are aligned with S1-S4, whereas structures in (b) are aligned with the pore helix (PH). Antagonists and agonists are shown as sticks.
Videos
Video 1
Ligand-induced conformational changes.
The video shows a morph of the TMD of TRPC6 from the antagonist-bound state to the agonist-bound state. S1-S4 and the TRP helix are colored in light blue, whereas S5-S6 are colored in light cyan. The video starts with the side view of the antagonist-bound TRPC6. The morph viewed at this orientation highlights the slight outward and downward movement of S1-S4. Next, the camera rotates to the intracellular view. The morph viewed at this orientation highlights the counterclockwise rotation of the S6 helices.
Tables
Table 1
Cryo-EM data collection, refinement and validation statistics.
| TRPC6-AM-1473 EMD-20954 PDB 6UZA | TRPC6-AM-0883 EMD-20953 PDB 6UZ8 | |
|---|---|---|
| Data Collection/processing Microscope Voltage (kV) Defocus range (mM) Exposure length (s) Electron exposure (e-/Å) Number of frames Pixel size (Å) Initial particles images (no.) Final particles images (no.) Resolution (Å) FSC threshold Symmetry imposed | Titan Krios (FEI) 300 −2.3 to −0.8 6 50 30 0.832 1,590,640 90,014 3.08 0.143 C4 | Titan Krios (FEI) 300 −2.3 to −0.8 6.2 50 31 1.248 1,209,330 68,553 2.84 0.143 C4 |
| Refinement Model composition Protein residues Ligands R.m.s. deviations Bond length (Å) Bond angle (°) Ramachandran plot Favored (%) Allowed (%) Disallowed (%) Validation MolProbity score Clashscore Poor rotamers (%) CaBLAM outliers (%) EMRinger score | 2936 20 0.005 0.813 95.97 4.03 0 1.29 2.30 0 3.48 3.55 | 2936 16 0.005 0.823 95.56 4.44 0 1.28 1.99 0 2.51 3.29 |
Additional files
Download links
A two-part list of links to download the article, or parts of the article, in various formats.
Downloads (link to download the article as PDF)
Open citations (links to open the citations from this article in various online reference manager services)
Cite this article (links to download the citations from this article in formats compatible with various reference manager tools)
Structural basis for pharmacological modulation of the TRPC6 channel
eLife 9:e53311.
https://doi.org/10.7554/eLife.53311


