Tailless/TLX reverts intermediate neural progenitors to stem cells driving tumourigenesis via repression of asense/ASCL1
- The Gurdon Institute and Department of Physiology, Development and Neuroscience, University of Cambridge, United Kingdom
Figures
Figure 1 with 1 supplement
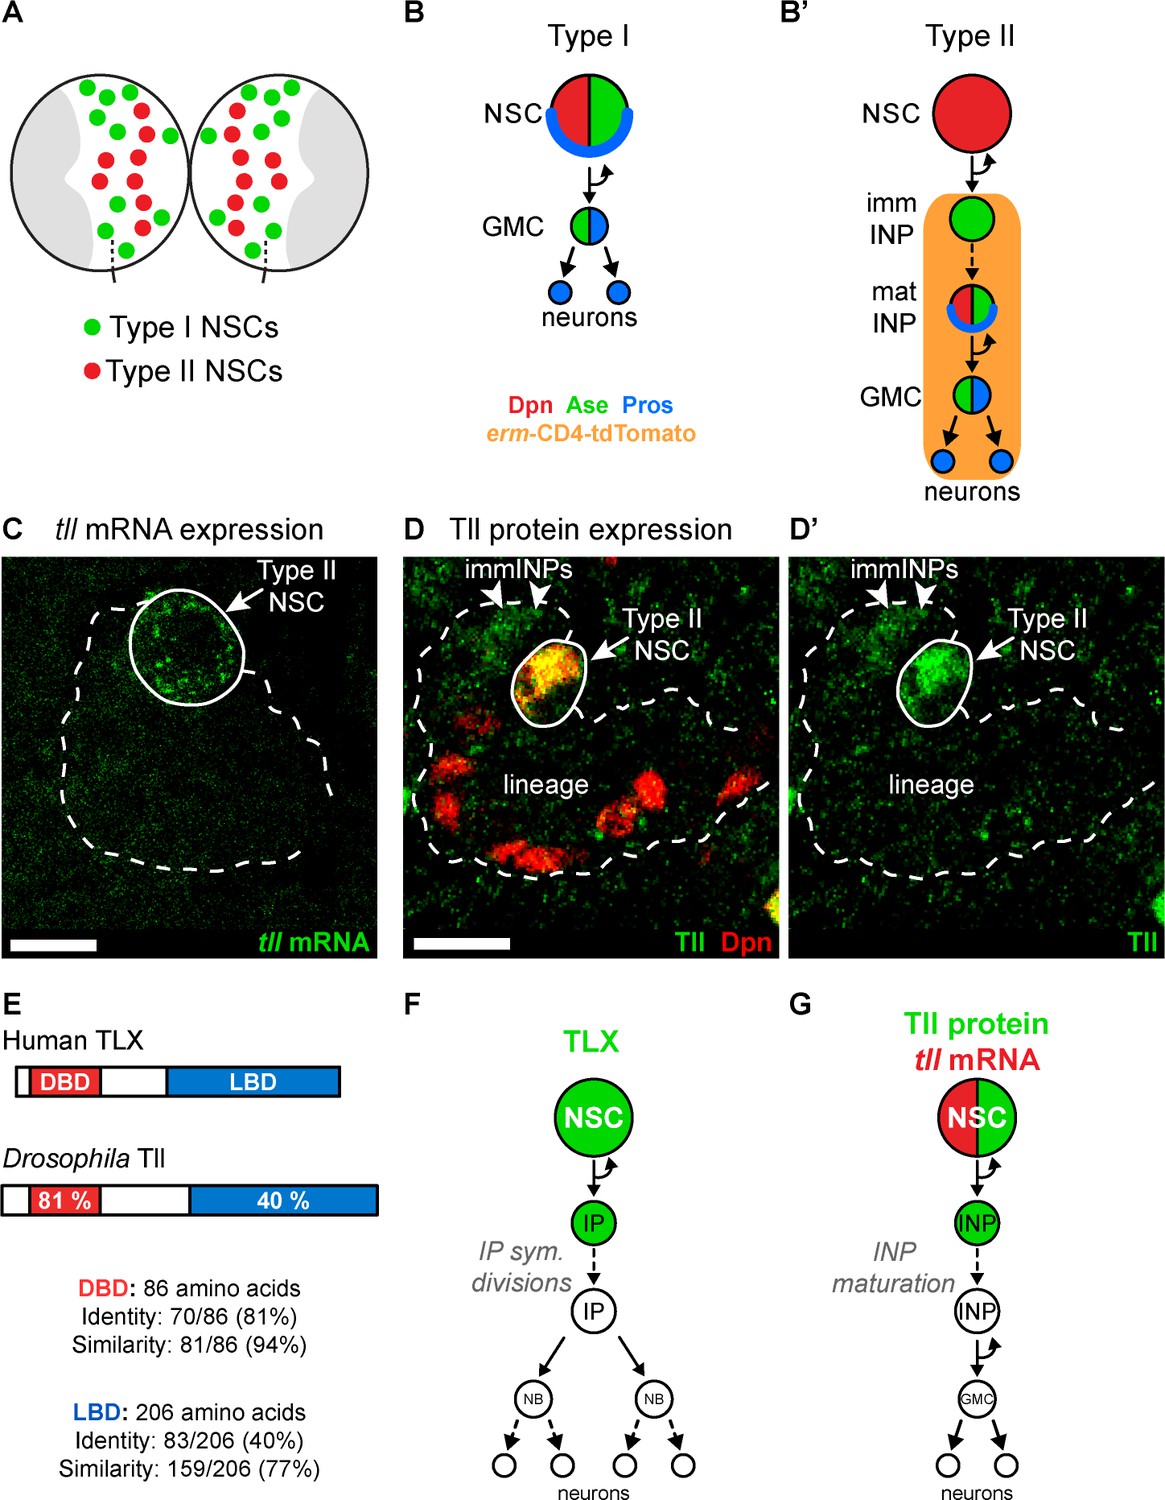
Tll is expressed in Drosophila Type II NSCs.
(A) Schematic showing the position of the eight Type II NSCs (red) in each brain lobe. The majority of stem cells in the Drosophila brain are Type I NSCs (green). The optic lobes, which generate the adult visual processing centre, are shown in grey. (B–B’) Schematics showing the expression of cell fate markers in (B) Type I and (B’) Type II lineages. NSC: neural stem cell; imm INP: immature intermediate neural progenitor; mat INP: mature intermediate neural progenitor; GMC: ganglion mother cell. (C) RNA FISH shows tll mRNA (green) expression in Type II NSCs (solid outline) but not in their lineages (dotted outline). Type II lineages were identified by pntP1-GAL4 > mCD8-GFP expression in the central brain at wandering third instar larval stage. (D–D’) Immunostaining for Tll (green) shows strong expression in Type II NSCs (Dpn+ (red), solid outline) and weak expression in Dpn- immature INPs (immINPs, arrow heads). Mature INPs (small Dpn+ cells in the lineage) do not express Tll. Type II lineages were identified by pntP1-GAL4 > mCD8-GFP expression in the central brain at wandering third instar larval stage. (E) Amino acid conservation between human TLX and Drosophila Tll. (F) Schematic showing that TLX (green) is expressed in NSCs and intermediate progenitors (IPs) in SVZ of the adult mouse brain (Li et al., 2012; Obernier et al., 2011). (G) Schematic showing tll mRNA (red) and Tll protein (green) expression in Drosophila Type II NSC lineages. Single section confocal images. Scale bars represent 10 µm.
Figure 1—figure supplement 1
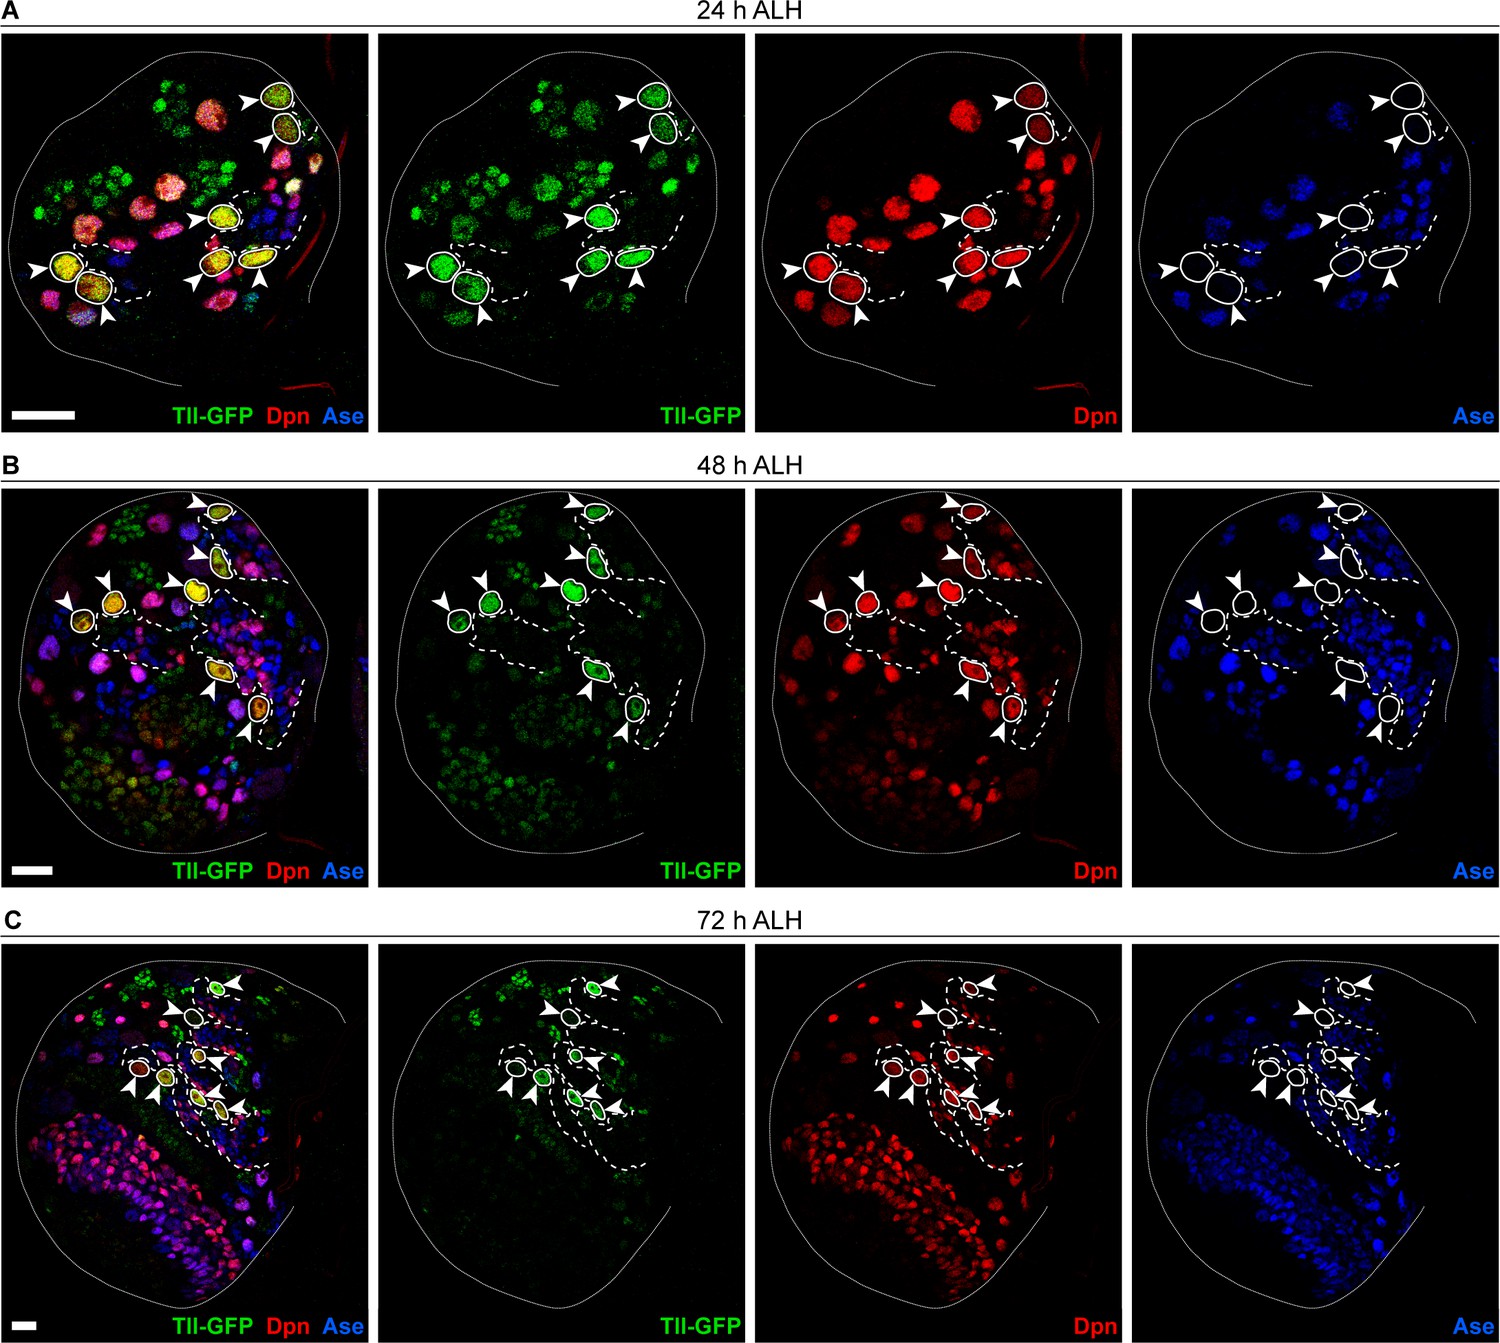
Tll is expressed in Drosophila Type II NSCs.
(A–C) Tll-GFP (green) is expressed in Type II NSCs (Dpn+ (red) and Ase- (blue)) (arrowheads and outlined with solid white lines) and downregulated in differentiating lineages (dotted white lines) during larval development. (A) 24, (B) 48, or (C) 72 hours (h) after larval hatching (ALH). Seven of eight Type II lineages per brain lobe are shown in each panel. pntP1-GAL4 > myr-RFP expression was used to identify Type II lineages. Single section confocal images. Scale bars represent 15 μm.
Figure 2 with 2 supplements
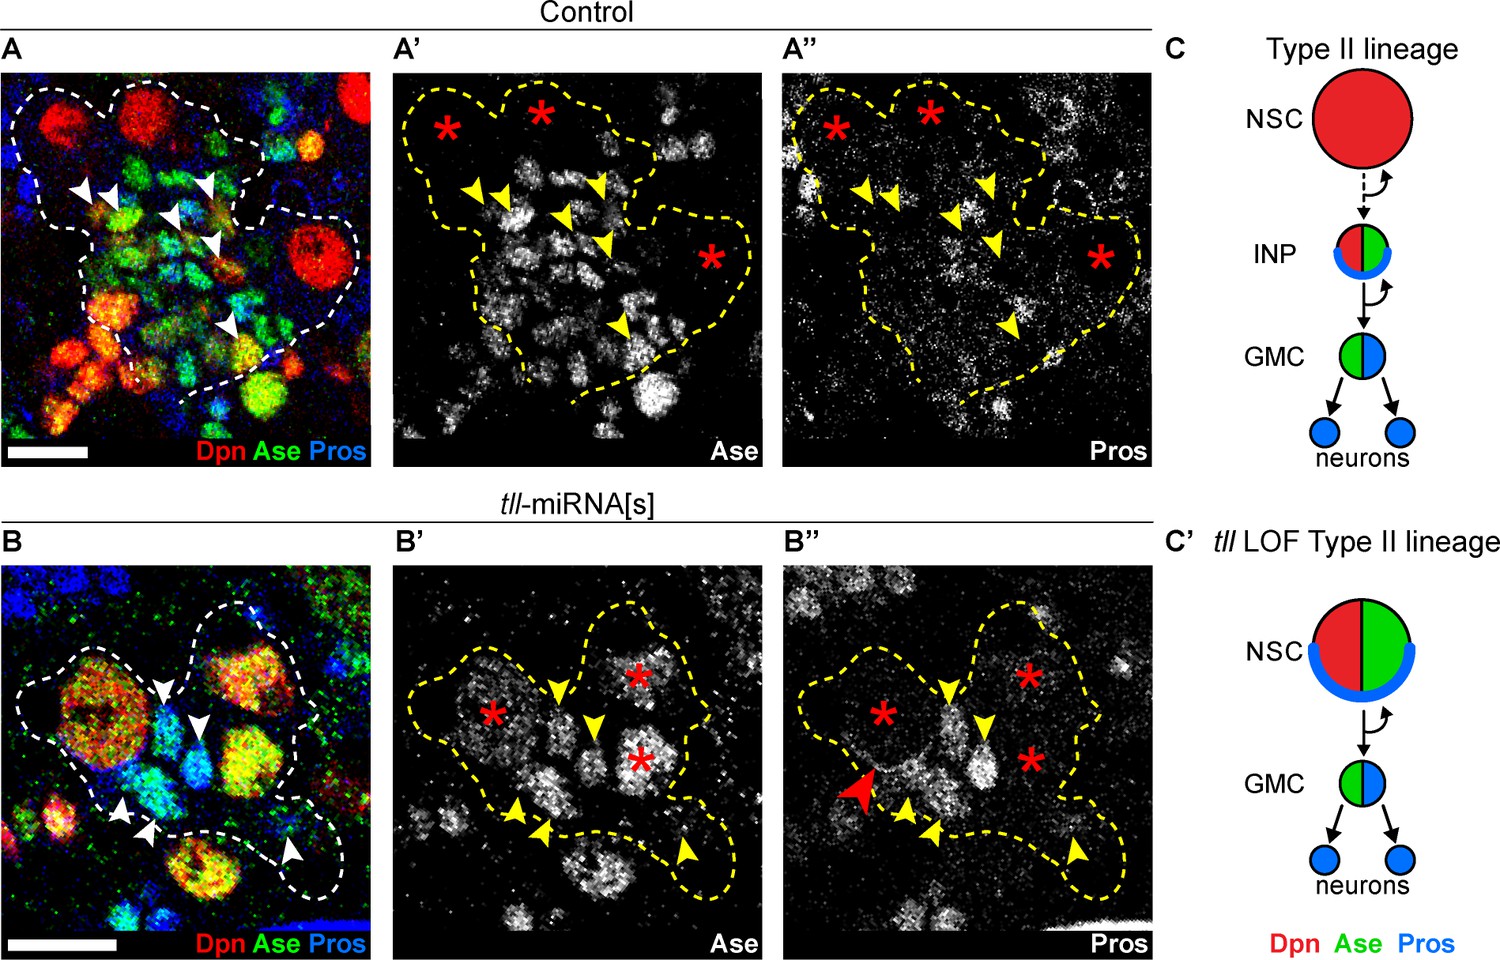
Tll is required for Type II NSC fate and lineage progression.
(A–A’’) Control Type II NSCs (Dpn+ (red) and Ase- (green)) generate INPs (arrowheads, Dpn+, Ase+ and Pros- (blue)). Dotted lines outline three Type II lineages. Red asterisks (*) indicate Type II NSCs. n = 10 brains, dissected at the end of second larval instar stage. (B–B’’) Upon tll knockdown using pntP1 >act-GAL4 to drive UAS-tll-miRNA[s], Type II NSCs express Ase and generate GMCs directly (arrowheads, Ase+ and Pros+) and exhibit Pros crescents (red arrowhead). Dotted lines outline three Type II lineages identified by pntP1 >act-GAL4 driving UAS-GFP. Red asterisks (*) indicate Type II NSCs. n = 10 brains, dissected at the end of second larval instar stage. (C–C’) Schematic summarising the tll loss of function (LOF) phenotype in Type II NSCs. Single section confocal images. Scale bars represent 10 µm.
Figure 2—figure supplement 1
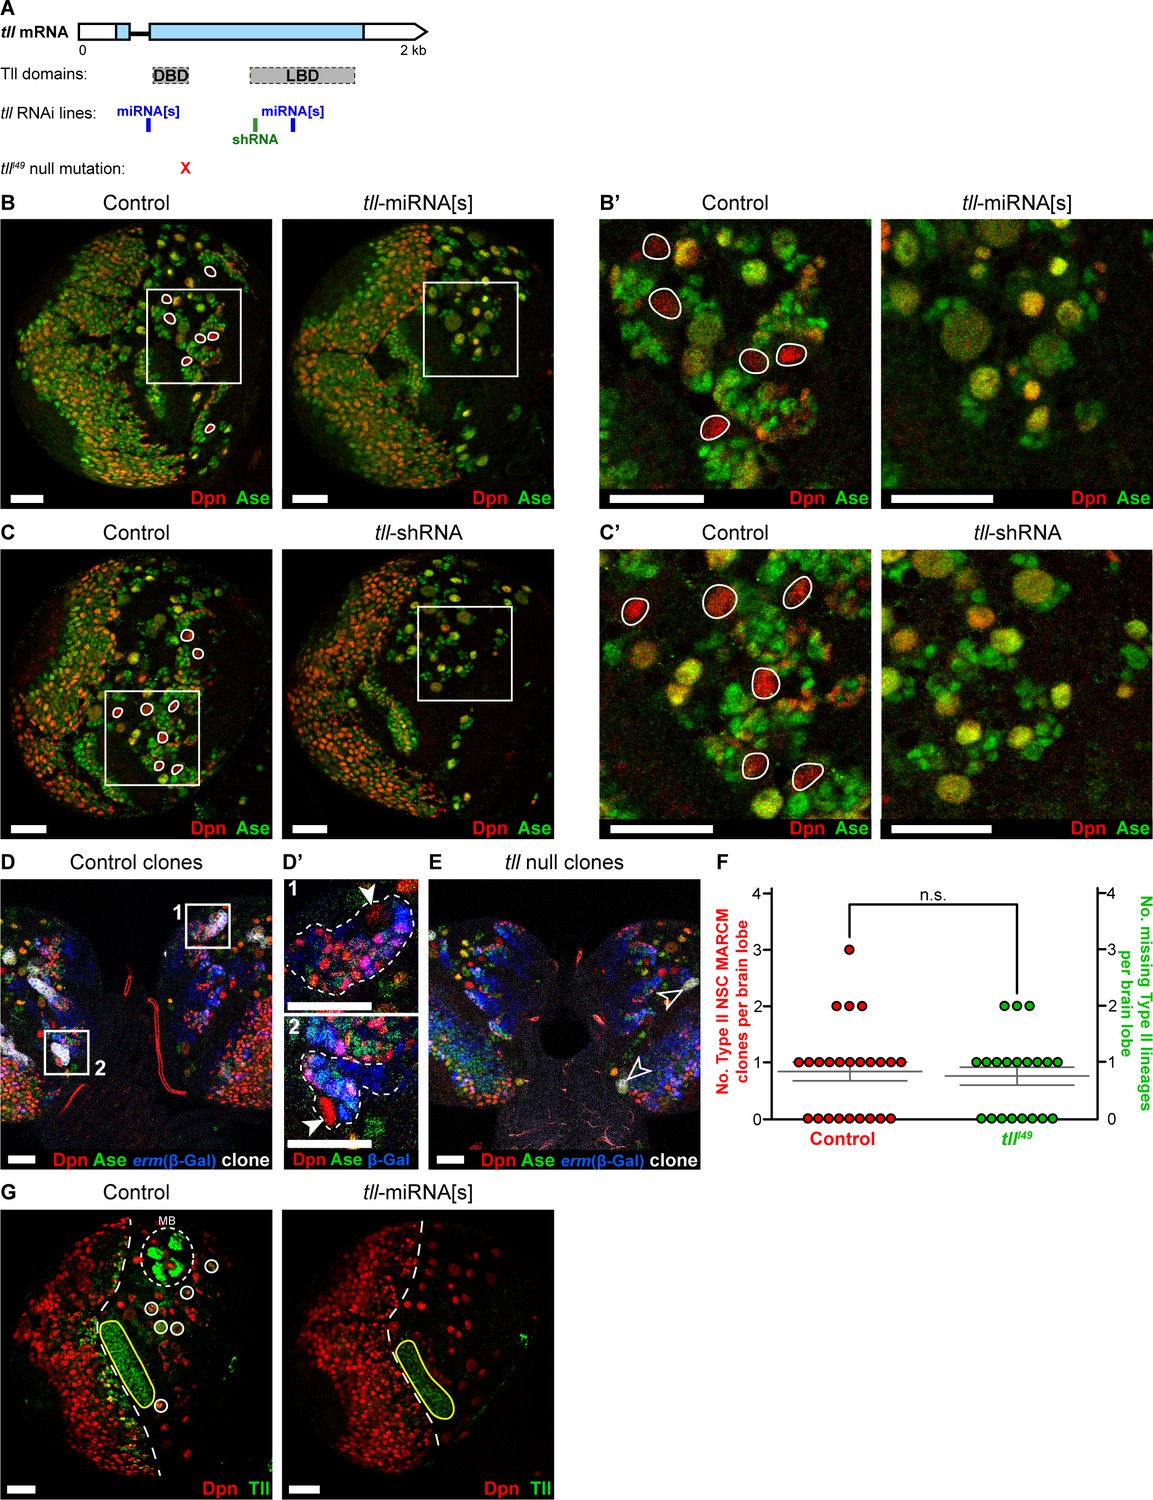
Tll loss of function in Type II NSCs.
(A) The tll coding sequence (blue regions of tll mRNA) codes for two protein domains (grey): DBD and LBD. tll RNAi lines miRNA[s] (Lin et al., 2009) and shRNA (from VDRC) target different regions of tll mRNA. tlll49 contains a point mutation (x) at the 3’ end of the DBD that creates a stop codon, resulting in a null mutant (Diaz et al., 1996; Pignoni et al., 1990). (B–B’) Knockdown of tll during larval stages (wor-GAL4,UAS-mCD8-GFP;tub-GAL80ts>tll-miRNA[s]) resulted in the absence of all Type II NSCs. Control brains contained eight Type II NSCs (Dpn+ (red) and Ase- (green), white outlines; seven visible in the section shown). In tll-miRNA[s] brains, all NSCs expressed Dpn and Ase. Images in (B') are magnifications of the boxed regions in (B). n = 10 brain lobes for Control; n = 11 brain lobes for tll-miRNA[s]. (C–C’) Using wor-GAL4,UAS-mCD8-GFP;tub-GAL80ts to drive tll-shRNA also resulted in the loss of all Type II NSCs (Dpn+ and Ase-, white outlines in Control). Images in (C') are magnifications of the boxed regions in (C). n = 11 brain lobes for Control and tll-shRNA. (D–D’) Type II NSCs (Dpn+ and Ase-) could be encompassed within control MARCM clones at 72 hr after clone induction. wor-GAL4 >mCD8-mCherry (white) identified NSC clones and erm-lacZ (β-Gal (blue)) labelled Type II lineages. (D’) shows magnifications of the boxed regions in (D). Type II NSCs (arrowheads) and their lineages marked by clones are highlighted by dotted white lines. 20 Type II NSC MARCM clones were observed in 24 brain lobes analysed (from 12 brains). (E) Central brain Type I tlll49 NSCs could be visualised (arrowheads), but no tlll49 Type II lineage clones could be recovered at 72 hours after clone induction. n = 20 brain lobes (from 10 brains). (F) Quantifications of the number of Type II lineages labelled by control MARCM clones per brain lobe (20 clones in 24 brain lobes) compared to the number of Type II lineages absent in tlll49 brain lobes (15 absent lineages in 20 brains). Mann-Whitney U test, P = n.s. (P = 0.849). (G) Driving expression of tll-miRNA[s] with insc-GAL4;tub-GAL80ts during larval development effectively knocks down Tll (green) in all NSCs (Dpn+ (red)). In the control panel, Type II NSCs are highlighted by solid circles (6 of 8 are visible in the section shown) and mushroom body (MB) lineages express high levels of Tll (dotted circle) as reported previously (Kurusu et al., 2009). The dotted line in both panels indicates the boundary between the optic lobe (left) and the central brain (right). Note that insc-GAL4 is not expressed in neuroepithelial cells of the optic lobe and so Tll expression is unaffected in these cells (yellow outline highlights the neuroepithelium of the optic lobe inner proliferation centre). Brains dissected at wandering third instar stage.
Figure 2—figure supplement 2
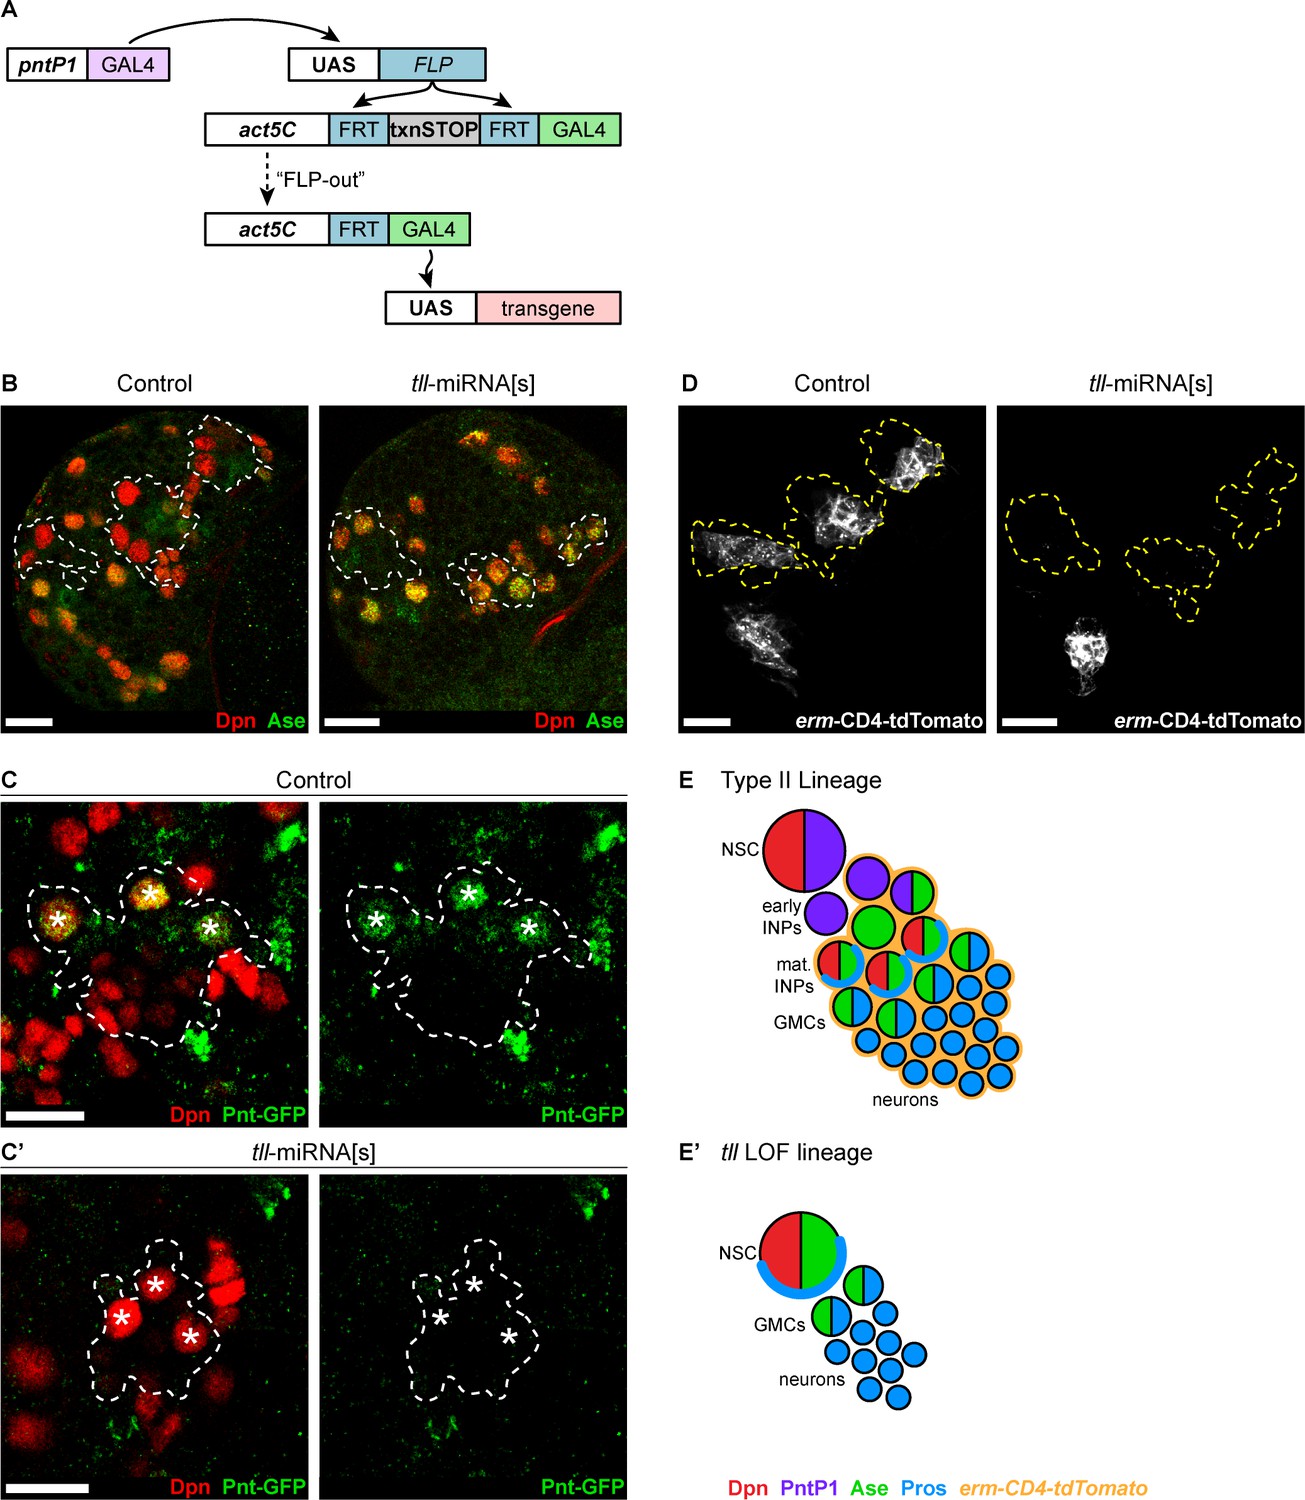
Generating an immortalised Type II NSC driver to assess cell fate changes.
(A) Schematic showing pntP1 >act-GAL4, an immortalised Type II NSC driver. (B) Driving UAS-tll-miRNA[s] with pntP1 >act-GAL4 resulted in the derepression of Ase (green) in all Type II NSCs (Dpn+ (red)) at the end of the first larval instar. n = 14 brains for Control; n = 11 brains for tll-miRNA[s]). Type II lineages identified by pntP1 >act-GAL4 driving UAS-GFP are outlined with dotted white lines. (C-C') Driving UAS-tll-miRNA[s] with pntP1 >act-GAL4 resulted in the loss of Pnt-GFP (green) expression from Type II NSCs (Dpn+ (red)). Pnt-GFP was lost from all Type II NSCs in 11 brains assessed with the exception of 4 dorsal-lateral lineages, which maintained weak Pnt-GFP expression (i.e. 172 Type II NSCs out of 176 total lost Pnt-GFP expression upon tll knockdown). n = 12 brains for Control; n = 11 brains for tll-miRNA[s]. Brains were dissected at the end of second larval instar stage. Dotted lines outline three Type II lineages identified by pntP1 >act-GAL4 driving UAS-lacZ(nls). White asterisks (*) indicate Type II NSCs. (D) erm-CD4-tdTomato (white) is absent in all tll-miRNA[s] Type II lineages at the end of the first larval instar. In control brains, erm-CD4-tdTomato is expressed in INPs and is a Type II lineage marker. n = 14 brains for Control; n = 11 brains for tll-miRNA[s]. Type II lineages identified by pntP1>act-GAL4 driving UAS-GFP are outlined with dotted yellow lines. Images are max projections over 10 µm. (E–E’) Schematic summarising the tll loss of function (LOF) phenotype in Type II NSCs, showing that tll LOF lineages switch to Type I fate. Single section confocal images unless stated otherwise. Scale bars represent 15 µm.
Figure 3 with 1 supplement

Tll overexpression in INPs generates ectopic NSCs.
(A) Schematic showing the expression of erm-GAL4, which begins to be expressed in Type II lineages during the final stages of INP maturation. (B–B’) In Control (zoom), solid white outlines indicate Type II NSCs and erm >act-GAL4 is expressed in their lineages (dotted white lines). Tll OE in INPs with erm >act-GAL4 resulted in a large expansion of Type II NSCs (Dpn+ (red) and Ase- (green)) in Type II lineages. Arrowheads in Tll OE – INP (zoom) highlight ectopic Type II NSCs. Zoom panels are magnifications of boxed regions in Control and Tll overexpression (OE) – INP. n = 10 brain lobes for Control and Tll. UAS-tll expression was restricted to larval stages with tub-GAL80ts and brains were dissected at wandering third instar larval stage. (C) Quantification of the total number of Type II NSCs (Dpn+ Ase-) in Control or Tll OE erm >act-GAL4 brains. Kolmogorov-Smirnov test ***, p<0.001 (p=0.000091). (D–D’) Expressing Tll in GMCs (using GMR71C09-GAL4 > mCD8-GFP (green)) does not result in ectopic NSCs (i.e. no Dpn+ GFP+ cells) nor defects in differentiation, as assessed by Pros (blue) staining. n = 10 brains for Control, n = 12 brains for Tll OE. Brains were dissected at wandering third instar larval stage. (E–E’) Expressing Tll in neurons using OK371-GAL4 > mCD8-GFP (green) does not result in ectopic NSCs (i.e. no Dpn+ GFP+ cells). n = 4 brains for Control and Tll. Brains were dissected at wandering third instar larval stage. Single section confocal images. Scale bars represent 30 μm in (B, B’, E, E’) and 10 µm in (D, D’).
Figure 3—figure supplement 1
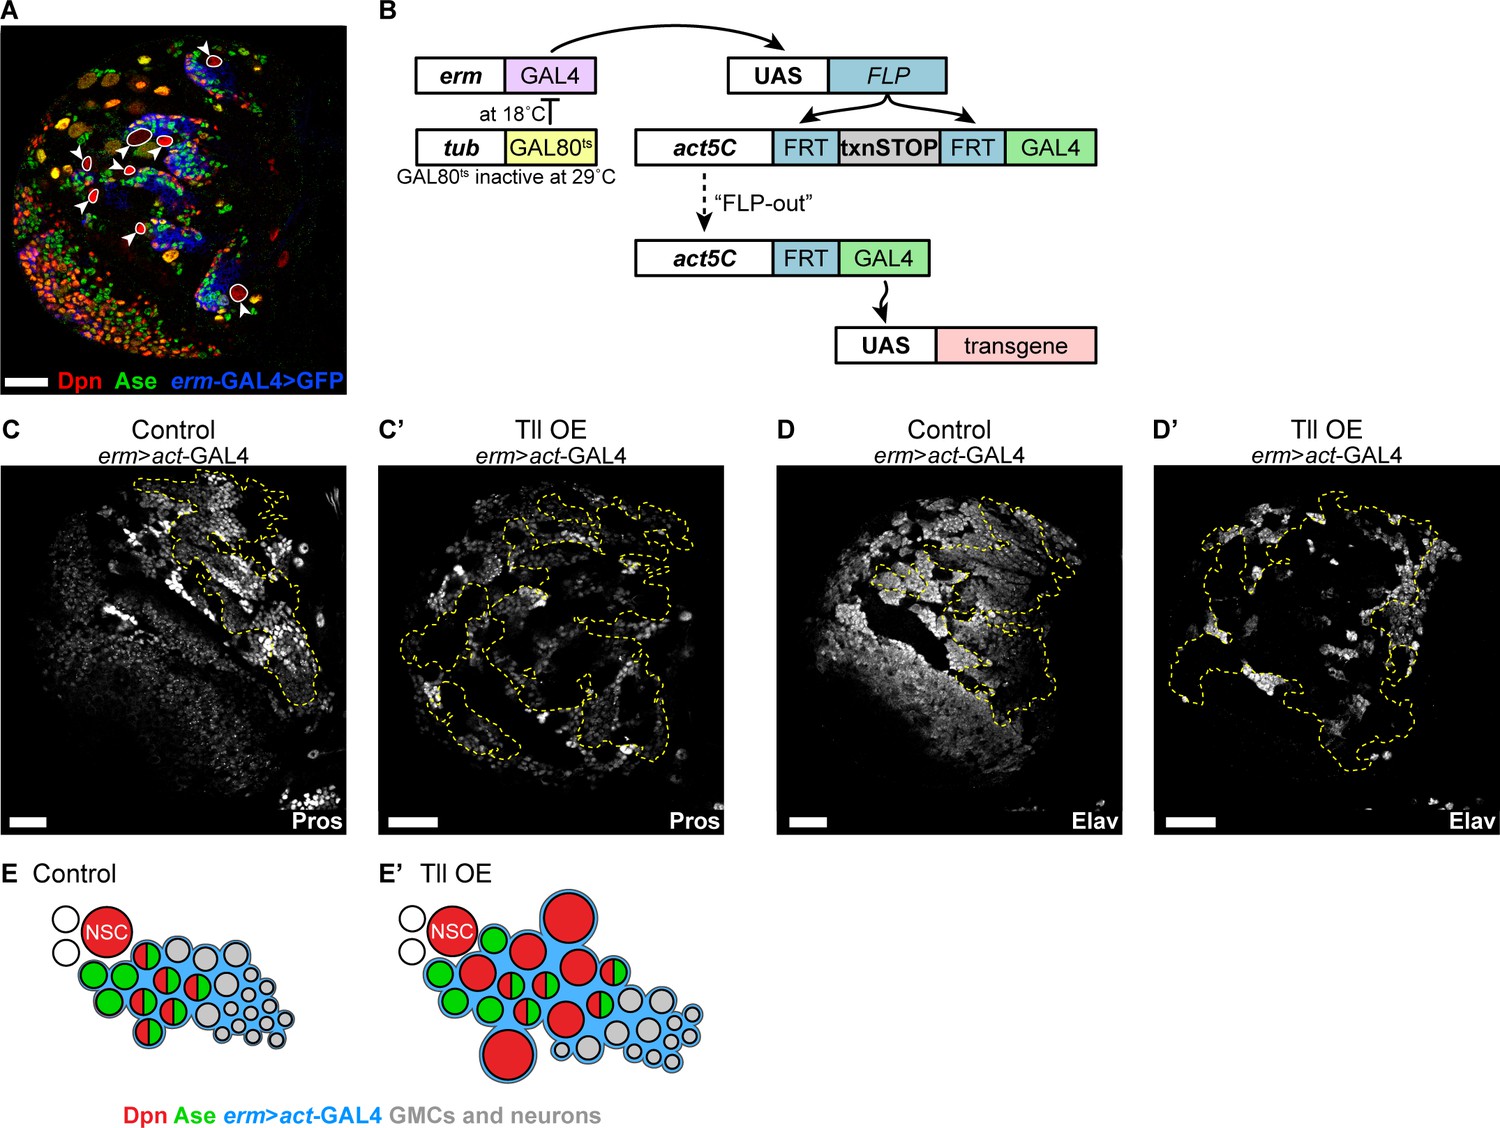
Tll overexpression in INPs results in ectopic Type II NSCs.
(A) erm-GAL4 >mCD8-GFP (blue) is not expressed in Type II NSCs (Dpn+ (red), Ase- (green) arrowheads and white outlines) but is expressed in their lineages. Brains were dissected at wandering third instar larval stage. (B) Schematic showing erm >act-GAL4, an immortalised Type II INP driver, which includes tub-GAL80ts to allow for temporal regulation of GAL4 activity. (C–C’) Expressing high levels of Tll with erm >act-GAL4 during larval development resulted in a decrease in differentiating progeny compared to Control, as assessed by Pros staining (white). n = 10 brain lobes for Control and Tll OE. Brains dissected at wandering third instar larval stage. (D–D’) Expressing high levels of Tll with erm >act-GAL4 during larval development reduced the generation of neurons from INPs, as assessed by staining for Elav (white). n = 13 brain lobes for Control; n = 12 brain lobes for Tll overexpression (Tll OE). Brains dissected at wandering third instar larval stage. (E–E’) Schematic depicting the effect of Tll OE on Type II lineages. Single section confocal images. Scale bars represent 30 μm.
Figure 4 with 1 supplement
Tll can initiate Type II NSC tumours from Type I NSCs.
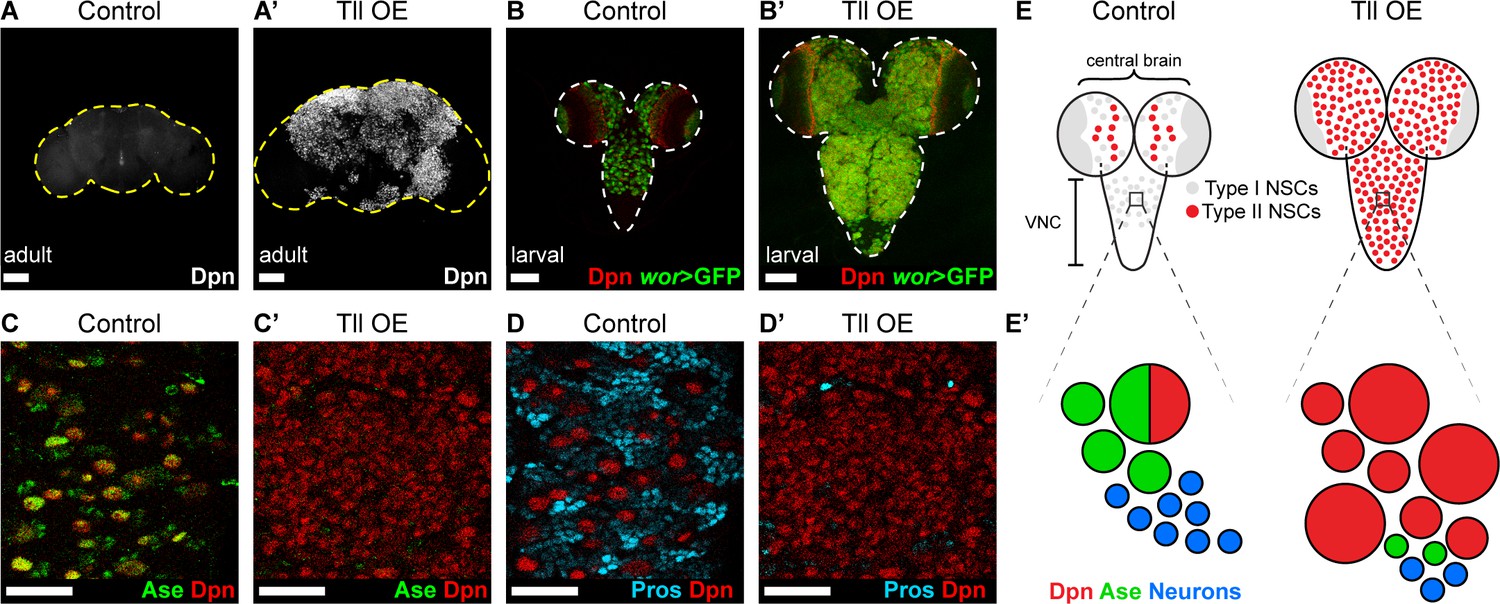
(A–A’) Overexpression of Drosophila Tll in neural lineages using wor-GAL4 resulted in NSC tumours (Dpn+ (white)) in all adult brains assessed. Control adult brains did not contain any NSCs. n = 7 brains for Control and Tll OE. UAS-tll expression was restricted to late larval stages with tub-GAL80ts and brains were dissected from newly-eclosed adult flies. Images are projections over 15 µm (Control) or 17 µm (Tll). (B–B’) Overexpression of Tll during larval development with wor-GAL4 resulted in large tumours consisting of ectopic NSCs (Dpn+ (red) and wor-GAL4 >mCD8-GFP (green)) in the central brain and VNC of all brains assessed. UAS-tll expression was restricted to larval stages with tub-GAL80ts and brains were dissected at wandering third instar larval stage. (C–C’) NSCs in the VNC are Type I (Dpn+ (red) and Ase+ (green)) in Control brains. Tll-induced tumours (ectopic Dpn+ cells) derived from Type I NSCs in the VNC are negative for Ase. UAS-tll expression was restricted to larval stages with tub-GAL80ts and brains were dissected at wandering third instar larval stage. (D–D’) Tll tumours in the VNC occur at the expense of differentiating progeny (Pros (blue)). UAS-tll expression was restricted to larval stages with tub-GAL80ts and brains were dissected at wandering third instar larval stage. (E) Schematic showing the organisation of Type I NSCs (Ase+ (grey)) and Type II NSCs (Ase- (red)) in Control brains and Tll OE brains. Note that in Control brains the VNC contains only Type I NSCs, whereas Tll OE VNCs contain many ectopic Type II NSCs. (E’) Schematic showing transformation of Type I NSC lineages in the VNC to ectopic Type II NSCs when Tll is expressed at high levels. Single section confocal images unless stated otherwise. Scale bars represent 100 µm in (A-B') and 30 µm in (C-D'). n = 10 brains for all conditions unless stated otherwise.
Figure 4—figure supplement 1
Tll is sufficient to induce the generation of INPs from a subset of Type I NSCs.
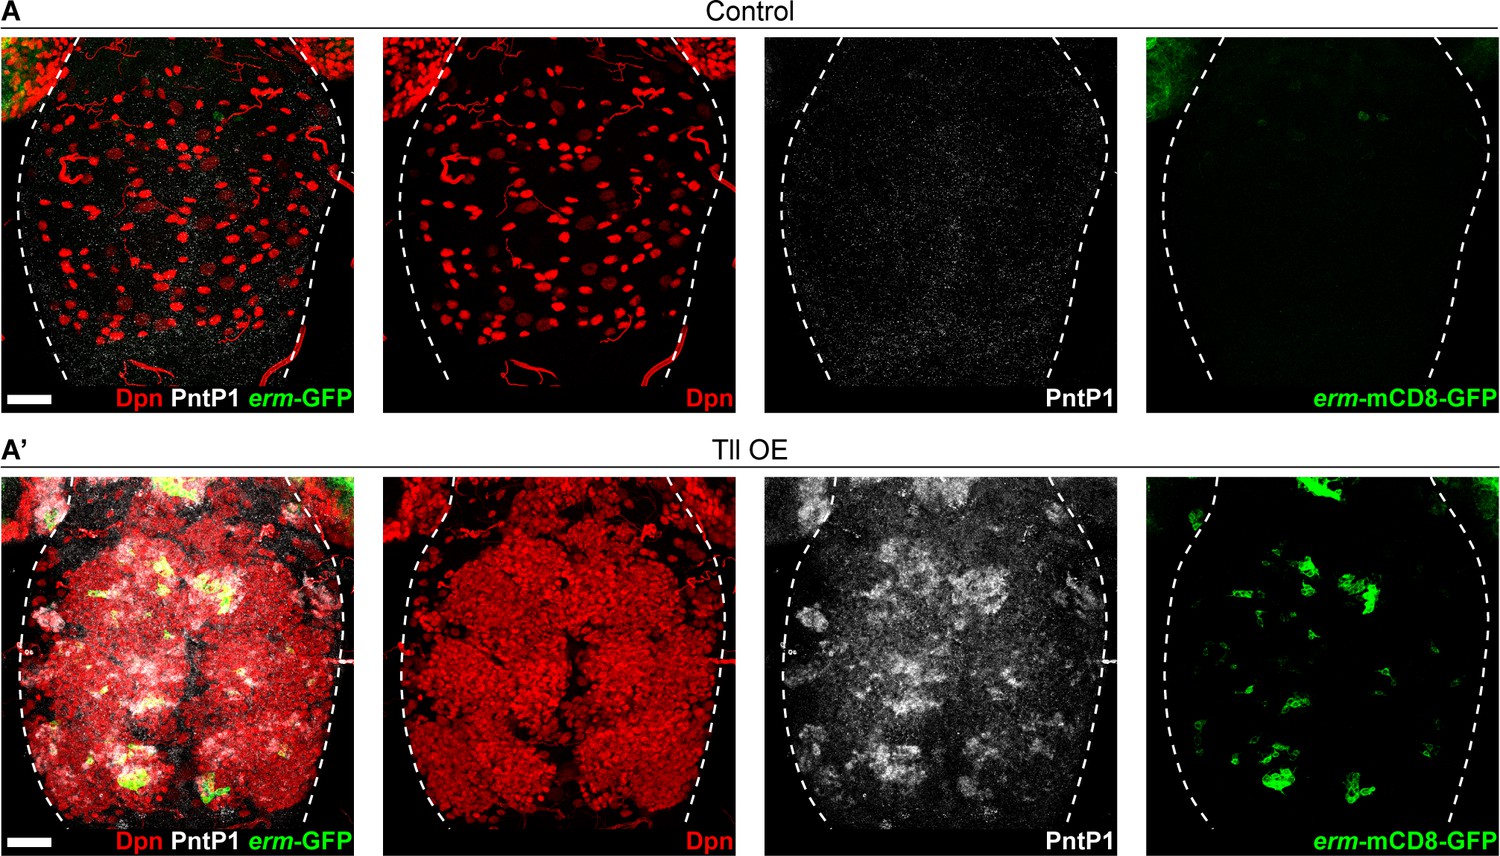
(A) In Control VNCs, all lineages are generated from Type I NSCs (Dpn+ (red)). Type I NSCs do not express PntP1 (white) and do not give rise to INPs (as assessed by erm-mCD8-GFP expression (green)). n = 10 VNCs for Control. Images are a projection over 25 µm. (A’) When Tll is expressed at high levels in VNC NSCs, a subset of the ectopic NSCs (Dpn+) express PntP1 and generate INPs (erm-mCD8-GFP+). UAS-tll expression was restricted to larval stages with tub-GAL80ts. n = 10 VNCs for Tll overexpression (Tll OE). Brains dissected at wandering third instar larval stage. Images are a projection over 58 µm. Scale bars represent 30 µm.
Figure 5 with 2 supplements
Tll/TLX overexpression results in reversion of INPs to NSC fate.
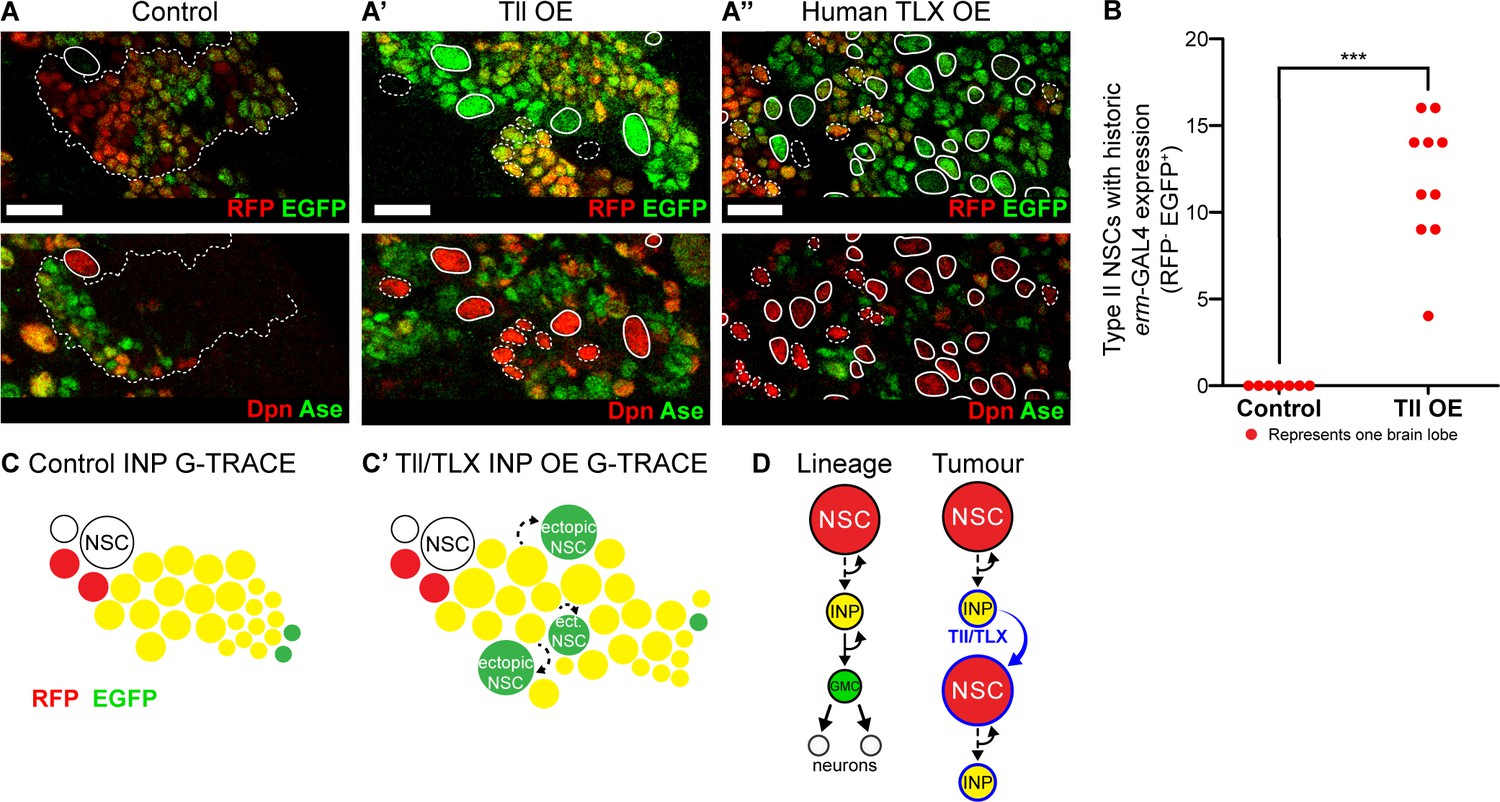
(A–A’’) G-TRACE reveals current (RFP (red)) and historic (EGFP (green)) erm-GAL4 expression (top panels). Dpn (red) and Ase (green) were used to assess the reversion of INPs to Type II NSCs (bottom panels). (A) In Control Type II lineages, NSCs (Dpn+ Ase-, solid outline) are negative for both components of G-TRACE, whereas lineages show transition from RFP to EGFP (dotted outline). Overexpression (OE) of (A’) Tll or (A’’) human TLX in INPs resulted in ectopic Type II NSCs (Dpn+ Ase-, white outlines) that express the EGFP component of the G-TRACE only (solid outline). Dpn+ Ase- NSCs with dotted white outline either express neither G-TRACE component (as in Control) or express both RFP and GFP (indicating current expression of erm-GAL4). n = 8 brain lobes for Control and n = 10 for Tll and human TLX. Brains were dissected at wandering third instar stage. (B) Quantification of Type II NSCs expressing G-TRACE memory only (i.e. Dpn+ Ase- and RFP- EGFP+). Kolmogorov-Smirnov test ***, p<0.001 (p=0.000103). n = 7 brain lobes for Control; n = 10 brain lobes for Tll overexpression (OE). Brains were dissected at wandering third instar larval stage. (C–C’) Schematic showing the expression of G-TRACE with the INP-specific erm-GAL4 in Control brains or with Tll/TLX OE. (D) A model for how Tll/TLX generates ectopic NSCs and, consequently, tumours from INPs. Single section confocal images. Scale bars represent 15 µm.
Figure 5—figure supplement 1
Tll/TLX overexpression induces reversion of INPs to NSC fate.
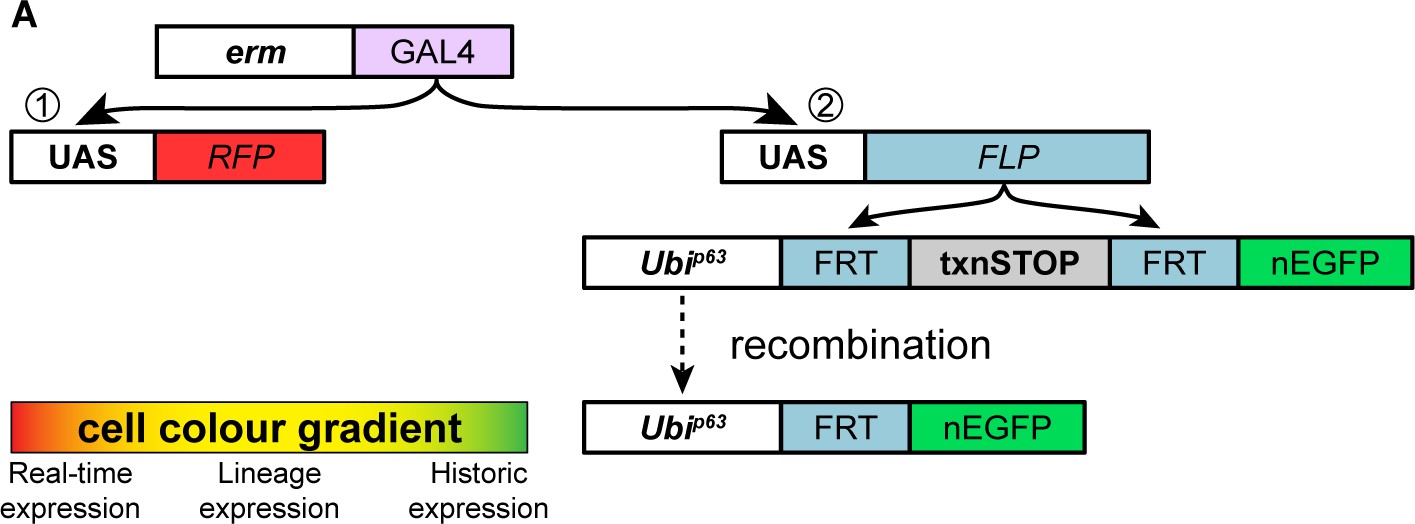
(A) Schematic showing the G-TRACE system. When erm-GAL4 is used to drive the G-TRACE cassette, GAL4 drives the expression of (1) UAS-RFP (real-time expression) and (2) UAS-FLP, which excises a transcriptional stop sequence to allow a Ubi promoter to drive EGFP expression (historic expression). The cell colour gradient shows the transition from current (red) to historic (green) GAL4 expression: RFP-only (real-time), to RFP and EGFP co-expression (lineage), to EGFP-only (historic).
Figure 5—figure supplement 2
Expressing TLX in post-mitotic neurons does not result in ectopic NSCs.
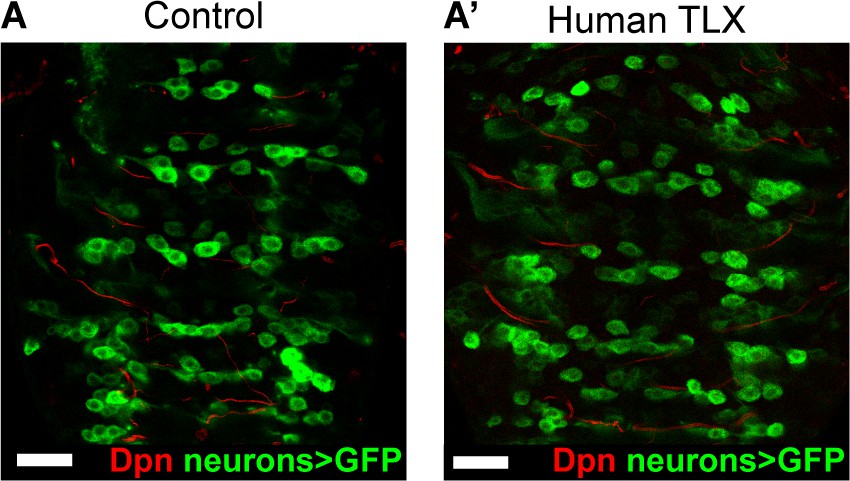
(A–A’) Expressing Human TLX in neurons with OK371-GAL4 > mCD8-GFP (green) does not result in ectopic NSCs (Dpn+ (red)). n = 8 brains for Control and Human TLX overexpression. Brains were dissected at wandering third instar larval stage. Single section confocal images. Scale bars represent 30 µm.
Figure 6 with 2 supplements
Reinstating progenitor identity prevents the formation of Tll tumours.
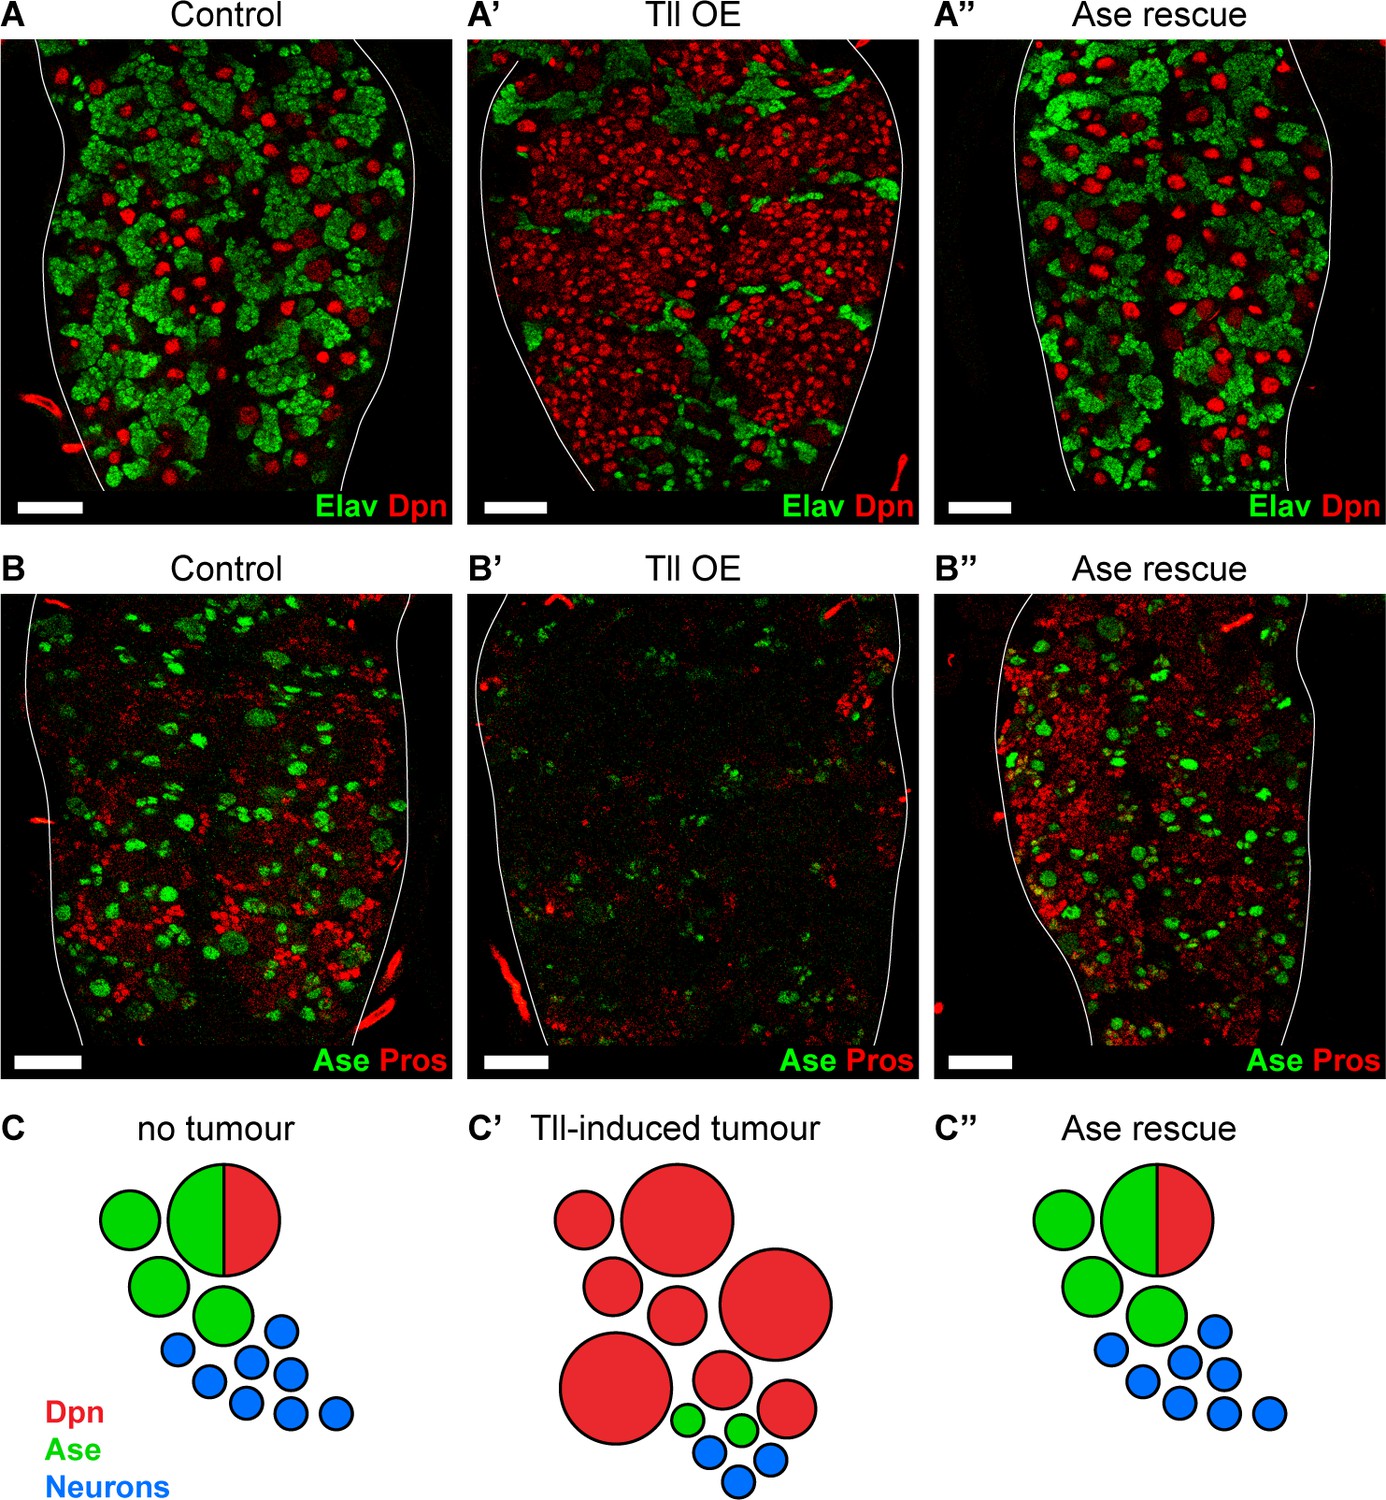
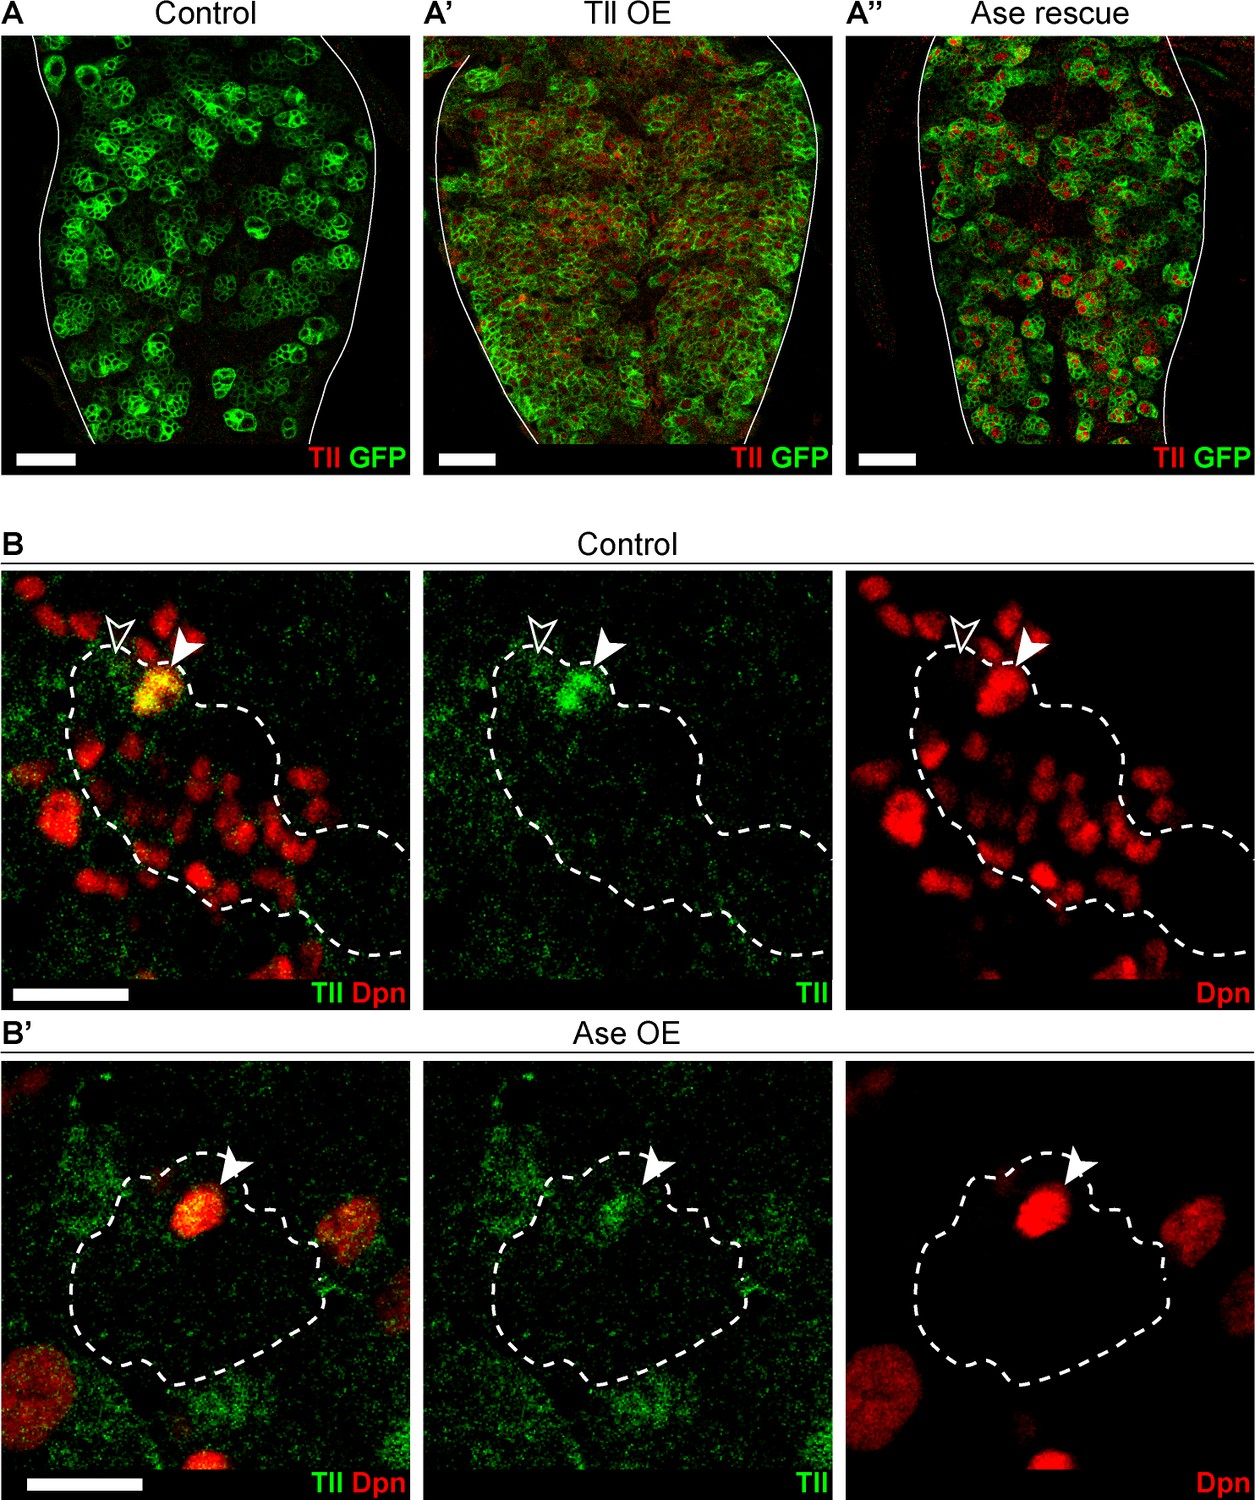
(A–A’’) Expressing Ase in combination with Tll during larval development using wor-GAL4 prevents tumour formation (ectopic Dpn+ cells (red)) and restores neuronal differentiation (Elav (green)) in all brains assessed. n = 10 brains for all conditions. Brains were dissected at wandering third instar stage. (B–B’’) Ase (green) rescues Tll tumours by promoting differentiation (Pros (red)). n = 9 brains for Control; n = 10 brains for Tll overexpression (Tll OE) and Ase rescue. Brains were dissected at wandering third instar larval stage. (C–C’’) Schematic depicting Type NSC I lineages (C) during development, (C’) with Tll-induced tumours and (C’’) with Ase expression in Tll tumours. Single section confocal images. Scale bars represent 30 µm.
Figure 6—figure supplement 1
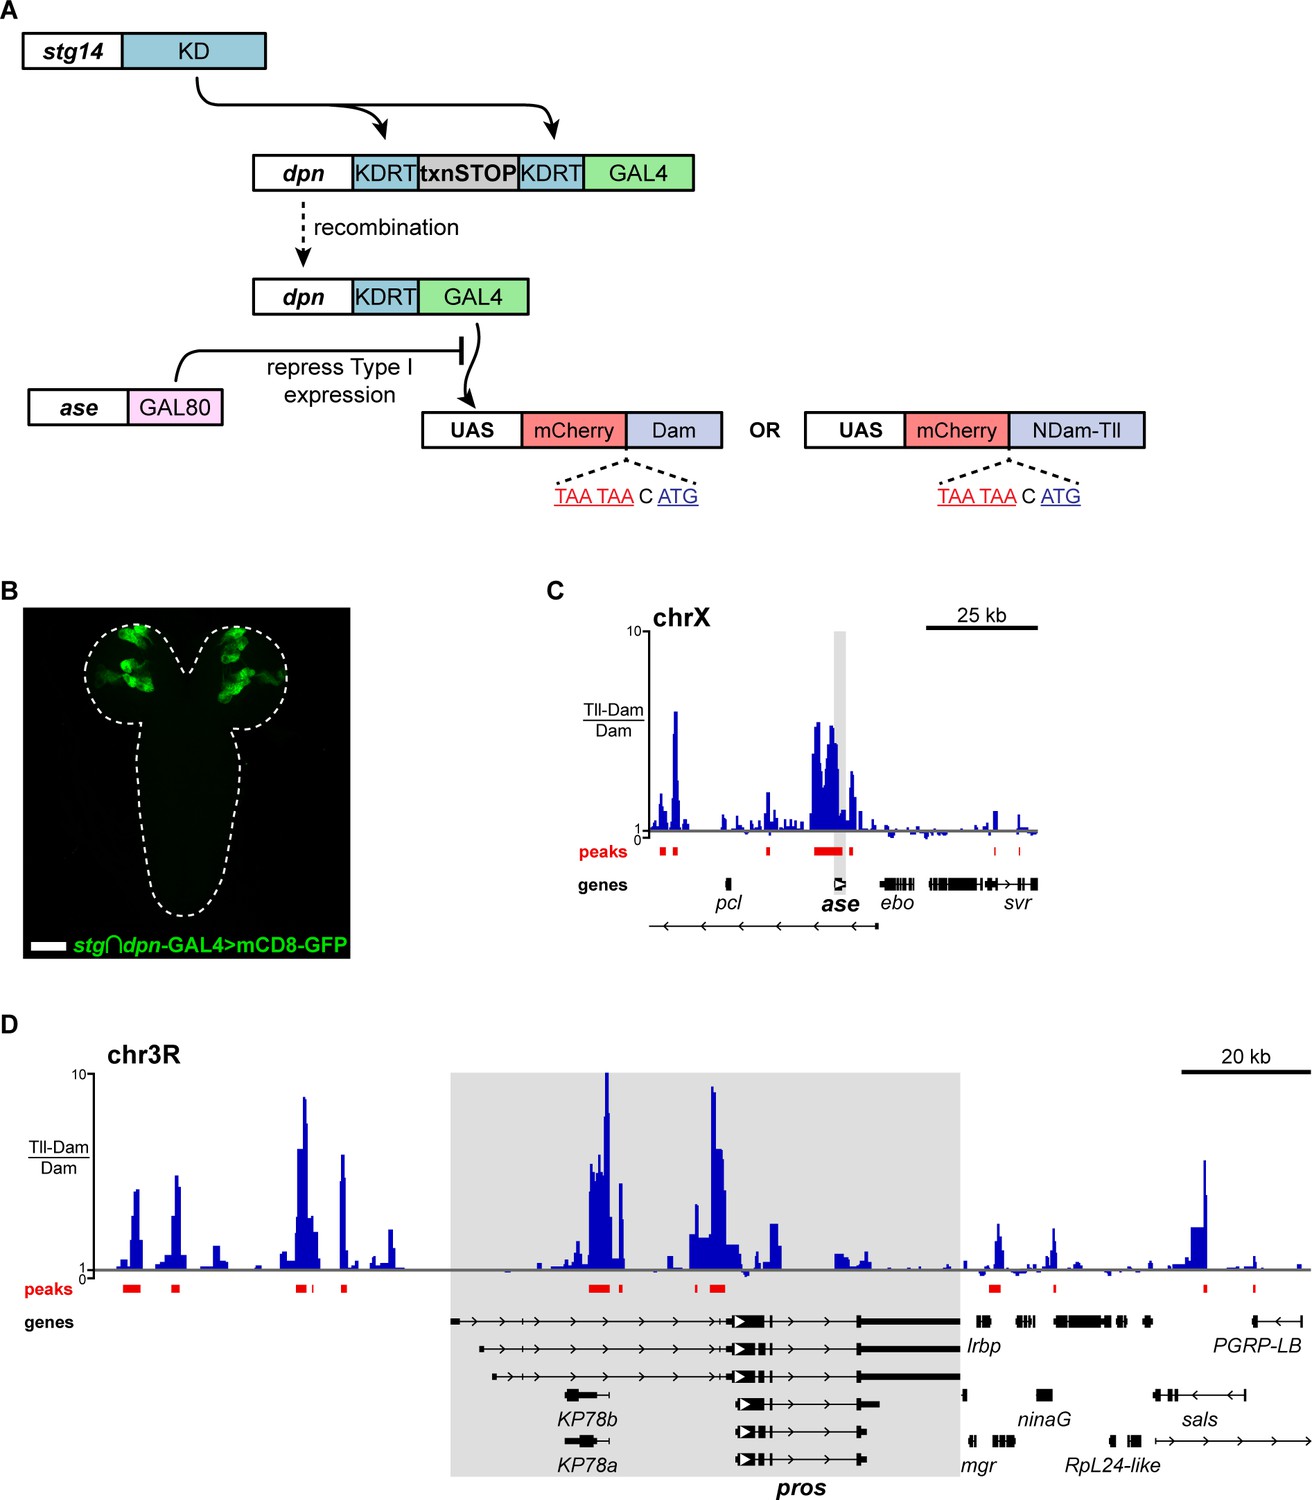
Determining Tll target genes in Type II NSCs using targeted DamID (TaDa).
(A) Schematic showing the recombinase-dependent GAL4 tool used to perform Targeted DamID in Type II NSCs. stg14 drives the expression of KD recombinase in Type II NSCs (and a small number of Type I NSCs), which excises a transcriptional stop (txnSTOP) resulting in the dpnEE promoter driving GAL4. ase-GAL80 was included to prevent GAL4 activity in Type I lineages. This system resulted in the expression of TaDa constructs (under the control of UAS) in Type II NSCs specifically. (B) stg14-patterned dpn-GAL4 (stg ∩ dpn-GAL4) driving UAS-mCD8-GFP (green) with ase-GAL80 is expressed only in Type II NSCs and their lineages. The image is a projection over 75 μm in z. Brains dissected 50 hours ALH at 25 °C. Scale bar represents 50 μm. (C) Tll binding (Tll-Dam/Dam) across the ase locus in Type II NSCs. (D) Tll binding (Tll-Dam/Dam) across the pros locus in Type II NSCs. Tll binding in (C) and (D) is represented as scores in GATC fragments on an untransformed scale (y-axis).
Figure 6—figure supplement 2
Ectopic Ase expression does not repress Tll.
(A–A’’) Tll (red) is not expressed in (A) Control VNCs. (A’) Tll is expressed at high levels in Tll OE tumours. (A’’) Despite rescuing the formation of Tll-induced tumours, expressing Ase does not repress the expression of Tll. wor-GAL4,UAS-mCD8-GFP;tub-GAL80ts (green) was used to express transgenes under the control of UAS during larval stages. n = 10 brains for all conditions. Brains were dissected at wandering third instar stage. Single section confocal images. Scale bars represent 30 µm. (B–B’) Tll (green) is expressed in (B) Control Type II NSCs (Dpn+ (red) filled arrowhead) and at weaker levels in immature INPs (Dpn-, arrowhead outline) but not in other cells in the Type II lineages. (B’) Tll is still expressed in Ase Overexpression (Ase OE) Type II NSCs (arrowhead). Dotted outlines highlight three Type II lineages identified by pntP1 >act-GAL4 driving UAS-GFP. n = 11 brain lobes for Control and Ase OE. Brains were dissected at wandering third instar larval stage. Single section confocal images. Scale bars represent 15 µm.
-
Figure 6—figure supplement 2—source data 1
Tll TaDa binding targets.
- https://cdn.elifesciences.org/articles/53377/elife-53377-fig6-figsupp2-data1-v2.xlsx
Figure 7

Single cell RNA sequencing reveals that TLX and ASCL1 appear to be mutually exclusive in human glioblastoma.
(A) Uniform Manifold Approximation and Projection (UMAP) plot of 7,835 single cells coloured by TLX expression (red). Clusters were annotated based on previously known markers. TLX expression is only detected in the malignant cells. (A’) UMAP plot coloured by ASCL1 expression (green). ASCL1 expression is only detected in the malignant cells. (B) UMAP plot coloured by expression of both TLX (red) and ASCL1 (green), which appear mutually exclusive. Yellow indicates cells that express high levels of both TLX and ASCL1. Single cell RNA sequencing data and cluster markers obtained from Neftel et al. (2019).
Figure 8
Model – Tll reverts INPs to NSC fate to initiate tumourigenesis.
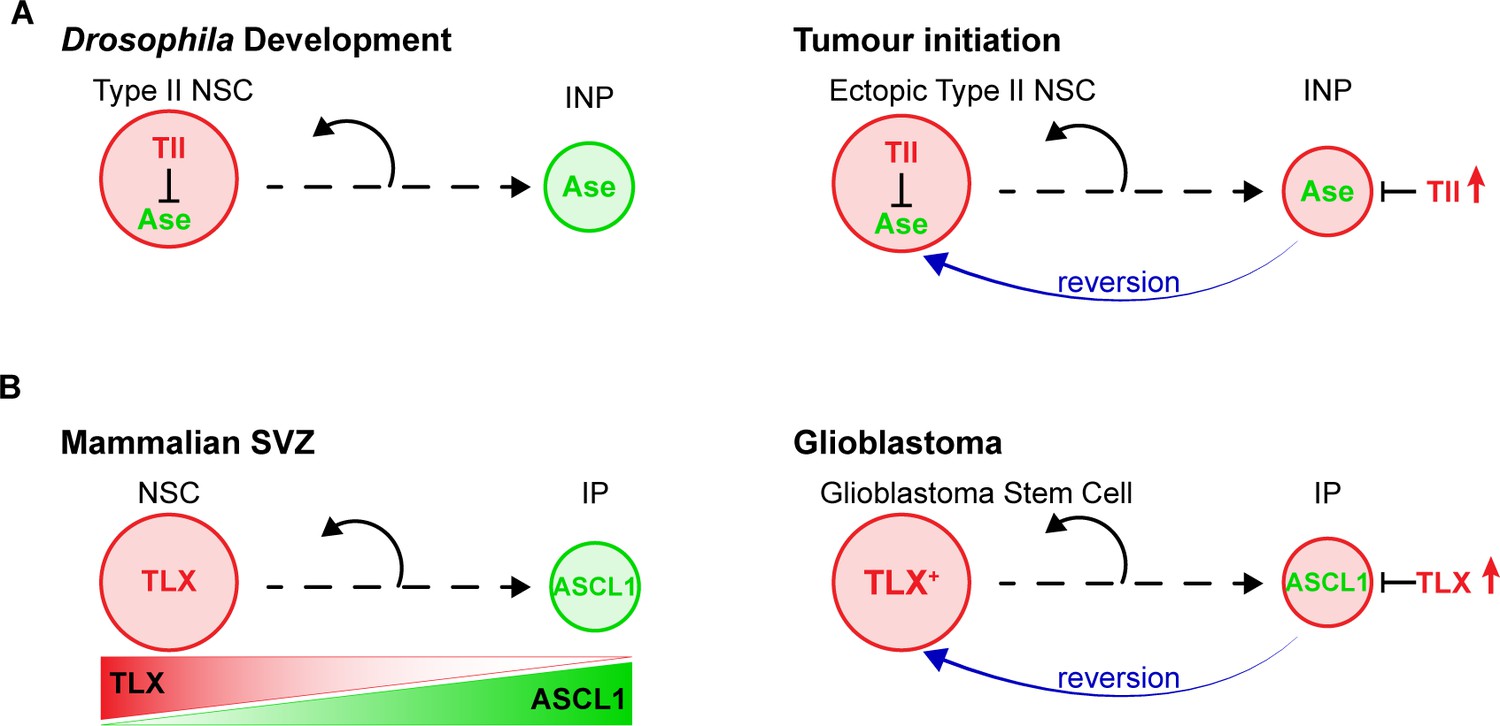
(A) Schematics depicting the promotion of Type II NSC fate by Tll (red) in development and tumourigenesis. Tll must be down regulated in Type II lineages to allow differentiation. Ase (green) expression is activated during differentiation. If Tll is high in INPs, or in Type I lineages, Type II NSC fate is maintained, or induced, and tumours form. (B) In the adult mouse SVZ, TLX expression is high in NSCs and lower in intermediate progenitors (IPs) (Li et al., 2012; Obernier et al., 2011), whereas ASCL1 is high in IPs and low in NSCs (Kim et al., 2011; Parras et al., 2004). Based on our results, we predict that high levels of TLX associated with aggressive glioblastoma revert IPs through the repression of ASCL1 to promote the generation of glioblastoma stem cells.
Author response image 1
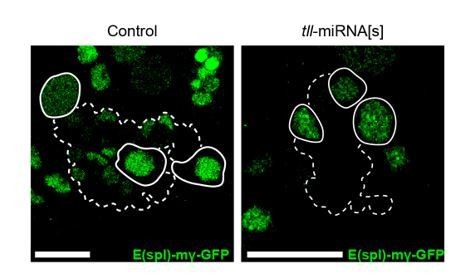
N signalling is maintained in Tll LOF Type II NSCs.
E(spl)-mγ-GFP, a N signalling reporter (Almeida and Bray., 2005), is expressed in Control Type II NSCs (left panel, solid white outlines) and in Tll LOF Type II NSCs (tll-miRNA[s], right panel, solid white outlines). Dotted outlines highlight three Type II lineages identified by pntP1>act-GAL4 driving UAS-lacZ(nls). n = 13 brains for Control; n = 12 brains for tll-miRNA[s]. Brains dissected at the end of the second instar larval stage. The control panel is a projection of two 1 μm slices; the tll-miRNA[s] panel is a single section confocal images. Scale bars represent 15 µm.
Author response image 2
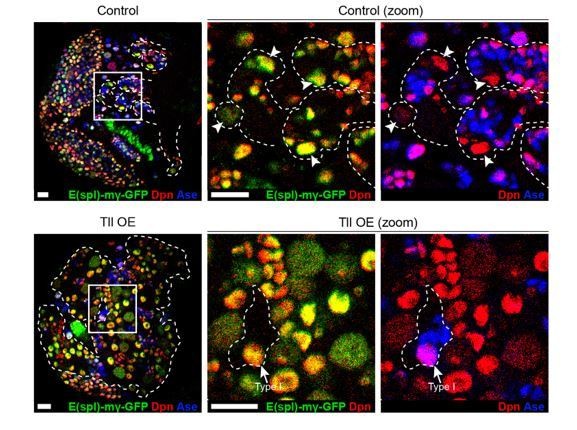
N signalling is active in ectopic NSCs in Tll GOF Type II lineages.
E(spl)-mγ-GFP (green), a N signalling reporter (Almeida and Bray., 2005), is expressed in Control Type II NSCs (top panels). Type II NSCs (Dpn+ (red) and Ase- (blue)) are indicated with white arrowheads and lineages are outlined in dotted white lines. Likewise, N signalling is active in the ectopic Type II NSCs in Tll GOF lineages (bottom panels). Note that N signalling is also active in Type I NSCs (Dpn+ and Ase+, see arrow in Tll OE zoom panels). Zoom panels are magnifications of the boxed regions shown. btd-GAL4,FRT19A/FM7act-GFP;+;tub-GAL80ts virgins were crossed to w; E(spl)-mγ-GFP; UAS-myr-mRFP/TM6B (Control) or w; E(spl)-mγ-GFP; UAS-tll, UAS-myr-mRFP/TM6B (Tll OE) males. Dotted white lines indicate btd-GAL4>myr-mRFP. GAL4 activity was restricted to larval development and brains were dissected after 3 days at 29 °C. n = 4 for Control and n = 5 for Tll OE. Single section confocal images. Scale bars represent 15 µm.
Tables
Key resources table
| Reagent type (species) or resource | Designation | Source or reference | Identifiers | Additional information |
|---|---|---|---|---|
| Genetic reagent (D. melanogaster) | w1118;+;+ | BDSC | RRID:BSDC_3605 | |
| Genetic reagent (D. melanogaster) | Ay-GAL4, UAS-GFP | BDSC | RRID:BDSC_4411 | |
| Genetic reagent (D. melanogaster) | Ay-GAL4, UAS-lacZ(nls) | BDSC | RRID:BDSC_4410 | |
| Genetic reagent (D. melanogaster) | btd-GAL4 | (Estella et al., 2003) | ||
| Genetic reagent (D. melanogaster) | erm-GAL4 | BDSC | RRID:BDSC_40731 | GMR9D11-GAL4 |
| Genetic reagent (D. melanogaster) | GMR71C09-GAL4 | BDSC | RRID:BDSC_39575 | |
| Genetic reagent (D. melanogaster) | insc-GAL4 | (Luo et al., 1994) | GAL4MZ1407 | |
| Genetic reagent (D. melanogaster) | pntP114-94-GAL4 | (Zhu et al., 2011) | ||
| Genetic reagent (D. melanogaster) | wor-GAL4 | (Albertson et al., 2004) | ||
| Genetic reagent (D. melanogaster) | OK371-GAL4 | BDSC | RRID:BDSC_26160 | VGlutOK371 |
| Genetic reagent (D. melanogaster) | tub-GAL80ts | BDSC | RRID:BDSC_7018 | |
| Genetic reagent (D. melanogaster) | UAS-ase | (Brand et al., 1993) | ||
| Genetic reagent (D. melanogaster) | UAS-FLP | BDSC | RRID:BDSC_4539 | |
| Genetic reagent (D. melanogaster) | UAS-FLP | BDSC | RRID:BDSC_4540 | |
| Genetic reagent (D. melanogaster) | UAS-lacZ | (Brand and Perrimon, 1993) | ||
| Genetic reagent (D. melanogaster) | UAS-LT3-NDam | (Southall et al., 2013) | ||
| Genetic reagent (D. melanogaster) | UAS-LT3-NDam-tll | this study | Tll-Dam fusion for Targeted DamID | |
| Genetic reagent (D. melanogaster) | UAS-mCD8-GFP | BDSC | RRID:BDSC_5130 | |
| Genetic reagent (D. melanogaster) | UAS-mCD8-GFP | BDSC | RRID:BDSC_5137 | |
| Genetic reagent (D. melanogaster) | UAS-mCD8-mCherry | BDSC | RRID:BDSC_27391 | |
| Genetic reagent (D. melanogaster) | UAS-myr-mRFP | BDSC | RRID:BDSC_7118 | |
| Genetic reagent (D. melanogaster) | UAS-myr-mRFP | BDSC | RRID:BDSC_7119 | |
| Genetic reagent (D. melanogaster) | UAS-tll | Kyoto DGRC | 109680 | |
| Genetic reagent (D. melanogaster) | UAS-tll-miRNA[s] | (Lin et al., 2009) | ||
| Genetic reagent (D. melanogaster) | UAS-tll-shRNA | VDRC | 330031 | |
| Genetic reagent (D. melanogaster) | UAS-TLX | this study | Human TLX under the control of UAS | |
| Genetic reagent (D. melanogaster) | G-TRACE | BDSC | RRID:BDSC_28280 | |
| Genetic reagent (D. melanogaster) | G-TRACE | BDSC | RRID:BDSC_28281 | |
| Genetic reagent (D. melanogaster) | erm-CD4-tdTomato | (Han et al., 2011) | R9D11-CD4-tdTomato | |
| Genetic reagent (D. melanogaster) | erm-mCD8-GFP | (Zhu et al., 2011) | R9D11-mCD8-GFP | |
| Genetic reagent (D. melanogaster) | erm-lacZ | (Haenfler et al., 2012) | R9D11-lacZ | |
| Genetic reagent (D. melanogaster) | Tll-GFP | BDSC | RRID:BDSC_30874 | |
| Genetic reagent (D. melanogaster) | Pnt-GFP | BDSC | RRID:BDSC_42680 | |
| Genetic reagent (D. melanogaster) | FRT82B, tub-GAL80 | BDSC | RRID:BDSC_5135 | |
| Genetic reagent (D. melanogaster) | FRT82B | BDSC | RRID:BDSC_2035 | |
| Genetic reagent (D. melanogaster) | FRT82B,tlll49/TM6B | (Pignoni et al., 1990) | ||
| Genetic reagent (D. melanogaster) | dpn>KDRTs-stop-KDRTs>GAL4 | (Yang et al., 2016) | ||
| Genetic reagent (D. melanogaster) | ase-GAL80 | (Neumüller et al., 2011) | ||
| Genetic reagent (D. melanogaster) | stg14-kd | (Yang et al., 2016) | ||
| Antibody | rabbit anti-Ase (polyclonal) | (Brand et al., 1993) Gift from the Jan Lab | IF 1:2,000 | |
| Antibody | chicken anti-β-Galactosidase (polyclonal) | abcam | ab9361 | IF 1:1,000 |
| Antibody | rabbit anti-β-Galactosidase (polyclonal) | Cappel (now MP Biomedicals) | 55976 | IF 1:10,000 |
| Antibody | guinea pig anti-Dpn (polyclonal) | (Caygill and Brand, 2017) | IF 1:5,000 | |
| Antibody | rat anti-Elav (monoclonal) | DSHB | 7E8A10 conc. | IF 1:100 |
| Antibody | chicken anti-GFP (polyclonal) | abcam | ab13970 | IF 1:2,000 |
| Antibody | rabbit anti-PntP1 (polyclonal) | A gift from Jim Skeath | IF 1:500 | |
| Antibody | mouse anti-Pros (monoclonal) | DSHB | MR1A | IF 1:30 |
| Antibody | rabbit anti-Tll (polyclonal) | (Kosman et al., 1998) Asian Distribution Center for Segmentation Antibodies | IF 1:300 |
Additional files
-
Supplementary file 1
Drosophila genotypes and experimental conditions.
- https://cdn.elifesciences.org/articles/53377/elife-53377-supp1-v2.docx
-
Transparent reporting form
- https://cdn.elifesciences.org/articles/53377/elife-53377-transrepform-v2.pdf
Download links
A two-part list of links to download the article, or parts of the article, in various formats.
Downloads (link to download the article as PDF)
Open citations (links to open the citations from this article in various online reference manager services)
Cite this article (links to download the citations from this article in formats compatible with various reference manager tools)
Tailless/TLX reverts intermediate neural progenitors to stem cells driving tumourigenesis via repression of asense/ASCL1
eLife 9:e53377.
https://doi.org/10.7554/eLife.53377


