Helix breaking transition in the S4 of HCN channel is critical for hyperpolarization-dependent gating
- KTH Royal Institute of Technology, Sweden
- University of Wisconsin-Madison, United States
- University of Wisconsin, United States
Figures
Figure 1 with 2 supplements
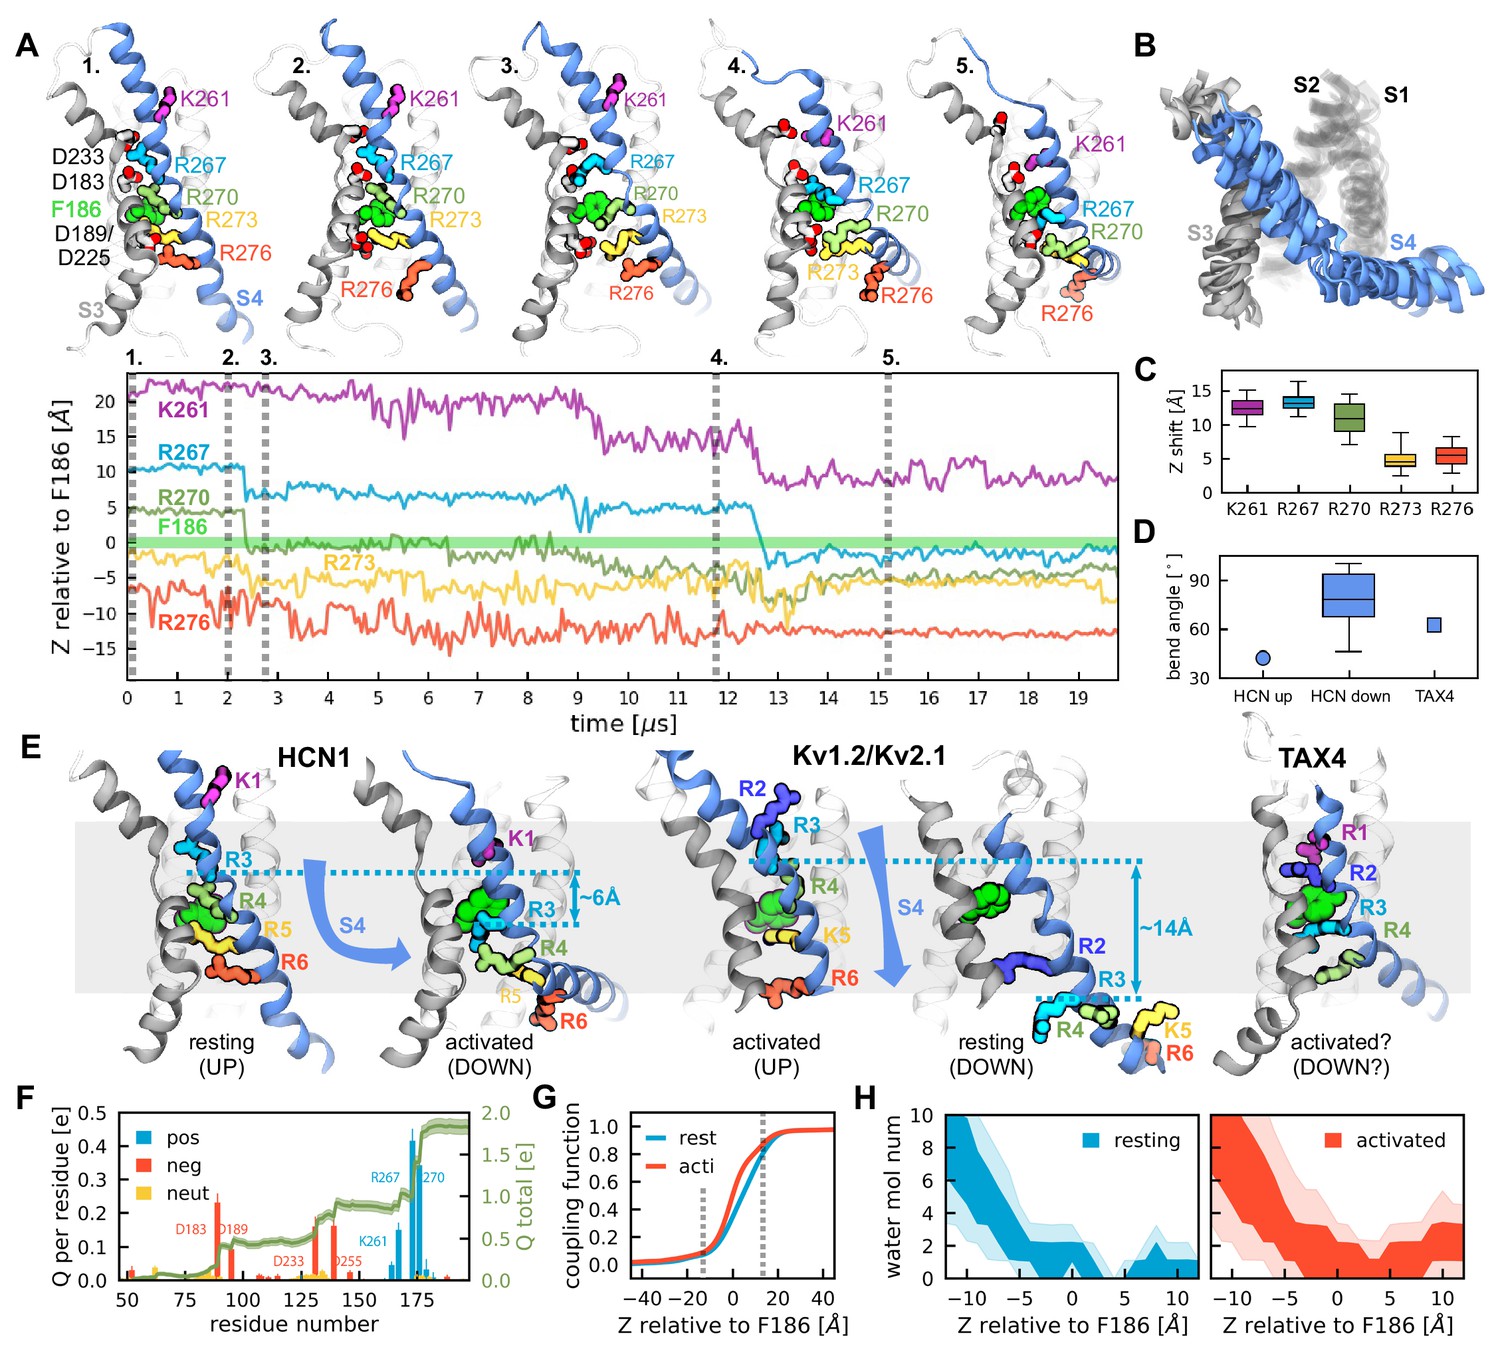
Activation of HCN1 via multi-microsecond long MD simulations.
(A) (Top) Conformational changes of the HCN1 voltage sensor triggered by an applied electric field. Representative snapshots of one voltage sensor along the trajectory are shown. The numbers correspond to the timepoints marked on the trajectory plot below. S4 is shown in blue, S3 in gray, S1 and S2 are transparent. (Bottom) Time-dependent displacement of the gating charges along the membrane normal in a representative voltage sensor measured relative to the charge transfer center (F186). (B) Overlay of representative structures of six activated voltage sensors from two independent ~20 µs simulation runs. (C) Overall displacement of gating charges (S4 basic residues) along the electric field direction. The box plot shows the median, 25-75% (box), 1-99% (bars) of the data collected from the six voltage sensors that underwent activation. (D) A comparison of the bend angles of lower S4 sub-helix with the principal axis of the VSDs of HCN1 and TAX4. HCN1 Up shows the angle between the S4 C-terminus of the HCN1 (PDB 5U6O) and the principal axis of its VSD; HCN1 Down shows the angle between the S4 C-terminus of the simulated structures at the end of the run and the principal axis of its VSD; TAX4 shows the angle between the S4 C-terminus of the TAX4 channel (PDB 5H3O, Li et al., 2017) and the principal axis of its VSD. The box plot shows the median, 25-75% (box), 1-99% (bars) of the data collected from the six voltage sensors that underwent activation. (E) Comparison of the VSDs from the HCN1 activated and resting states, the Kv1.2/2.1 activated and resting state extracted from long timescale simulations (Jensen et al., 2012), and the TAX4 open structure (PDB 5H3O, Li et al., 2017). Small cyan arrows show the displacement of the C atom of R3 along the applied electric field vector. (F) Per-residue gating charge computed per HCN1 subunit. Positive residues are shown in blue, negative in red and non-charged in orange. Green lines show the cumulative gating charge (thick) and the standard error (thin). (G) Coupling function corresponding to the resting (cyan) and activated (red) states. The dashed lines depict the boundaries of the transmembrane part of the voltage sensor. (H) Hydration of the HCN1 voltage sensor in the resting (left) and activated (right) states. The shaded regions show 25-75 (dark) and 10-90 (light) percentiles of the water molecule number collected for the six voltage sensors that underwent activation.
Figure 1—figure supplement 1

Design and model of an HCN1 mutant with faster activation kinetics.
(A) Consensus sequences from multiple sequence alignments for the voltage sensor of the EAG and HCN families shown as sequence logos (Crooks et al., 2004). The height of each residue is proportional to its frequency, while the height of the overall stack of residues is inversely proportional to Shannon entropy. Residues facing the interior of the voltage sensor are highlighted with gray rectangles. Candidate residues for mutations were chosen according to two criteria: they were hydrophobic and facing the VSD hydrated lumen in HCN1, and substitution to hydrophilic residues were tolerated in the EAG family. The mutated residues are marked with stars. (B) Z-position (along the membrane normal) of R270 relative to the charge transfer center residue (F186) along simulation time in the HCN1 wild type (cyan) and mutant (red). Each subunit is shown as a separate trace. (C) Cartoon representation of the voltage sensor with the two mutated residues (red). R270 and the hydrophobic plug (F186) used to monitor activation kinetics (see panel B) are shown in green. (D) Top: Example traces of the M153T/I160V mutant (right) compared to wild type HCN1 (left). Black traces represent current responses to depolarizing pulses whereas are red ones depict current responses elicited by hyperpolarizing potential pulses. Test pulses range from −150 mV to 50 mV from a holding potential of −10 mV. Scale bars show 2 µA (vertical) and 200 ms (horizontal). Bottom: Relative open probability vs. voltage relationships for the wild type (blue line) and mutant channel (red) with error bars (hidden within the symbols) showing standard deviation from three independent measurements.
Figure 1—figure supplement 2
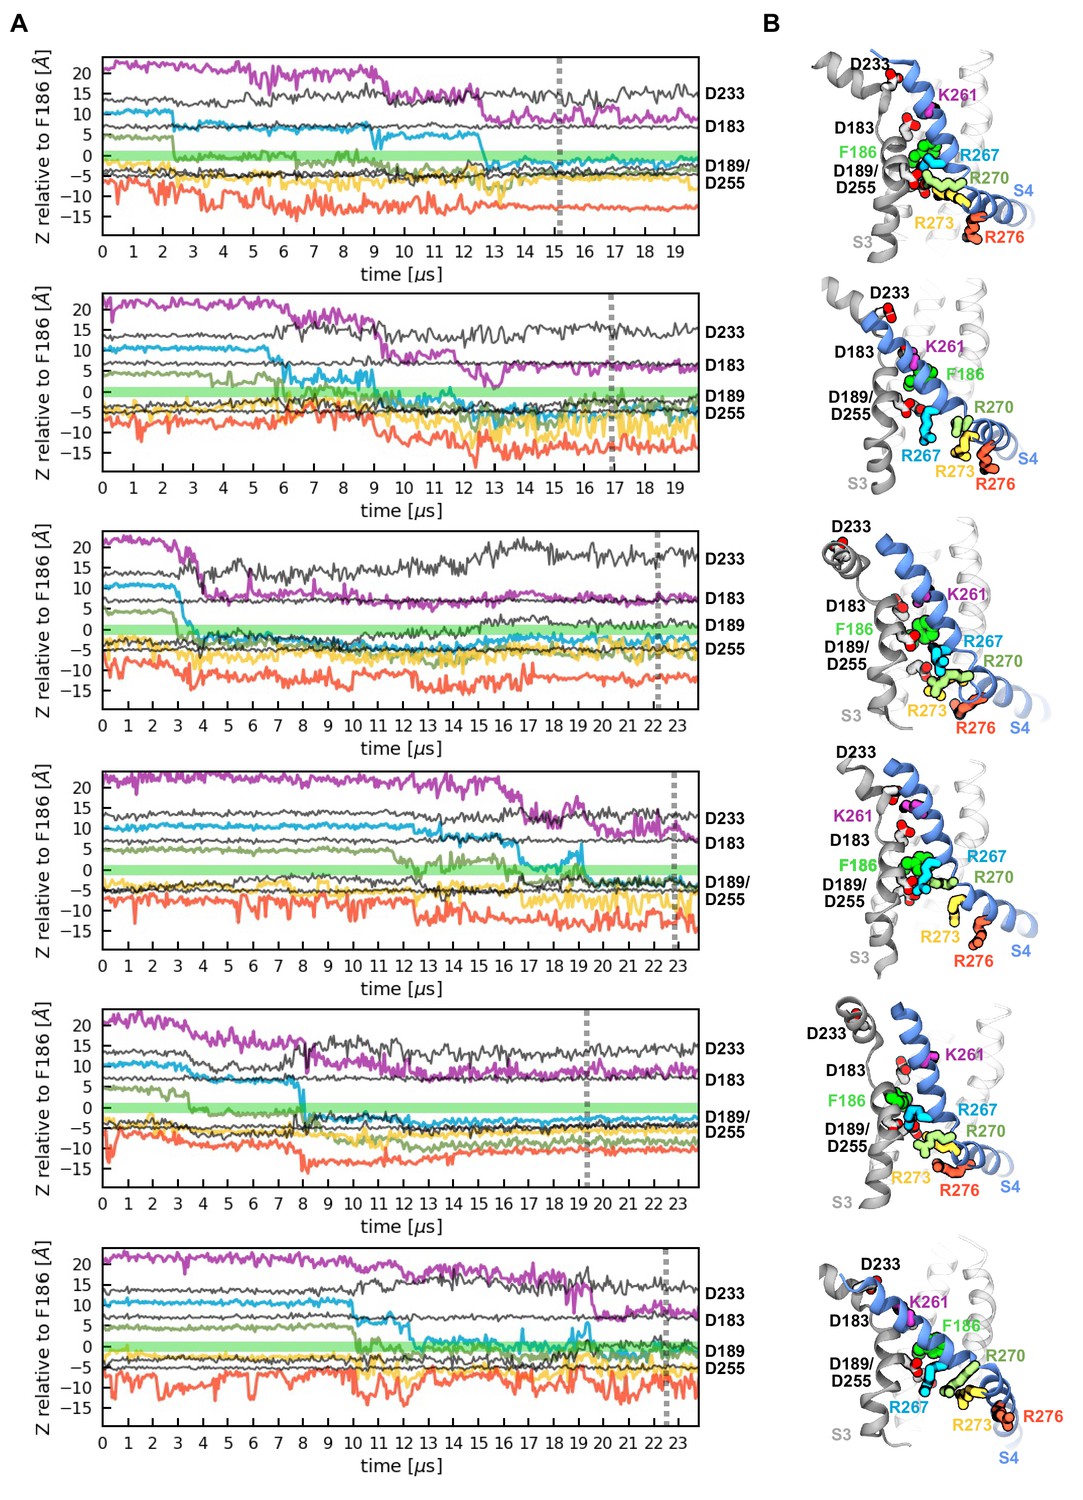
Activation of the six voltage sensor domains observed in two independent MD simulations.
(A) Z-position of gating charges (K261, R267, R270, R273, R276) and their negative counterparts (D183, D189, D233, D255) with respect to the hydrophobic plug (F186) along simulations time. (B) Representative conformations of the activated voltage sensor domains highlighting the localization of the residues presented in panel A.
Figure 2 with 1 supplement
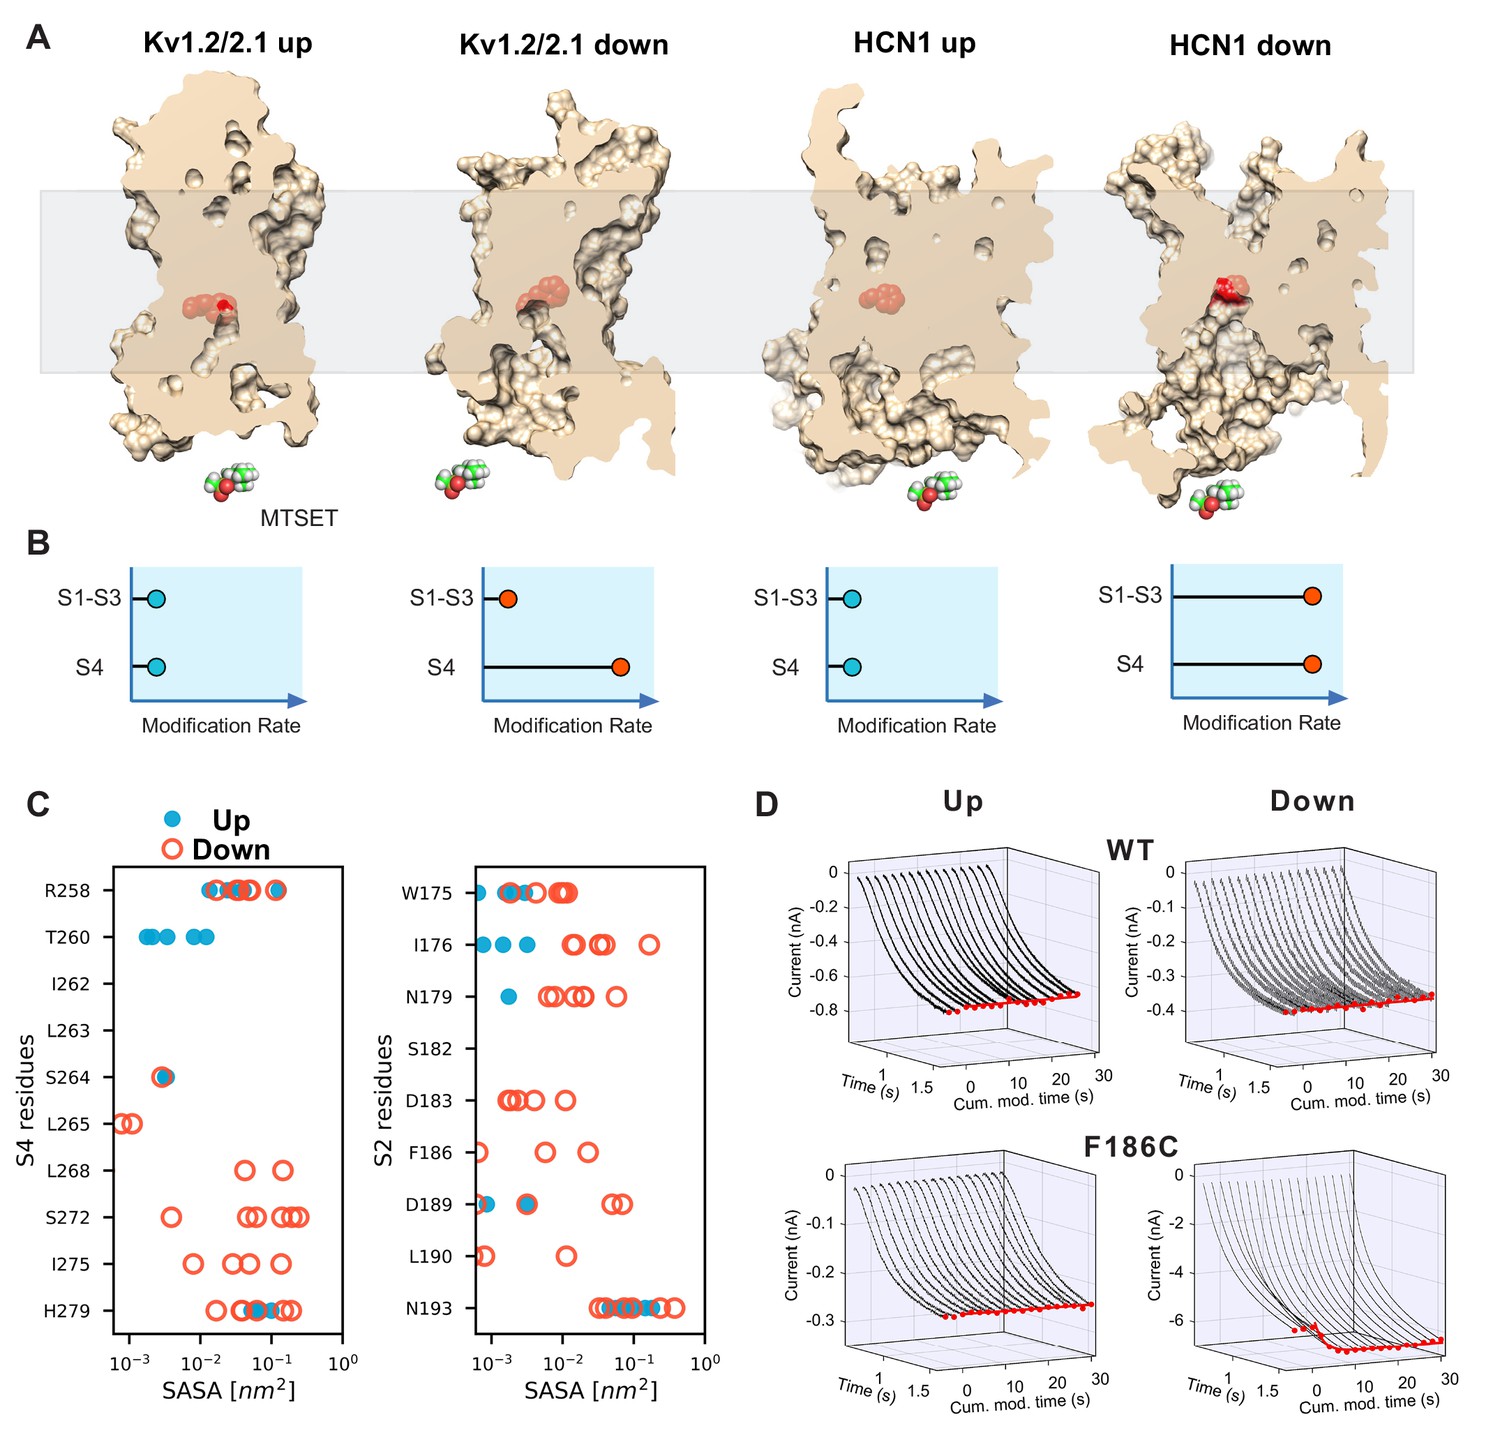
State-dependent accessibility of residues in S2 and S4 segments of HCN channel.
(A) Accessibility of the S2 charge transfer center (Phe residue) in representative molecular models of the activated and resting states Kv1.2/2.1 VSDs and the resting and activated states HCN1 VSDs extracted from molecular simulations. The charge transfer center is only accessible from the intracellular medium in the activated (Down) state of HCN1. A cutaway through the VSD is represented as a slightly transparent light brown surface; the charge transfer center (Phe residue) is represented as red spheres. (B) Predicted accessibility to internally applied polar cysteine modifying reagents. Accessibility to S4 cysteines will increase in the Down state compared to the Up state for both models as has been shown previously. The S2 cysteine at or proximal to the charge transfer center is expected to show very little modification in both Up and Down states in the canonical model. However, if the helix breaks and opens a large cavity in the Down state, the cysteine at the charge transfer center will become accessible in a state-dependent fashion. (C) Solvent accessibility estimates of S4 (left) and S2 (right) residues for both up and down state models of HCN1. The accessibility of each residue is estimated for the six voltage sensors that underwent activation and shown as one symbol each (closed blue circles for the resting Up state, open orange circles for the activated Down state). (D) State-dependent accessibility of the charge transfer center of hyperpolarization-activated ion channel. Wild type spHCN channel does not react with MTSET under hyperpolarized or depolarized condition (top two panels). Substitution of the charge transfer center, F186C, on the other hand, shows state-dependent reactivity with MTSET (bottom two panels). The rate of reactivity in the activated Down state is 440 ± 30 M−1s−1 versus 7.5 ± 0.3 in the resting Up state.
Figure 2—figure supplement 1
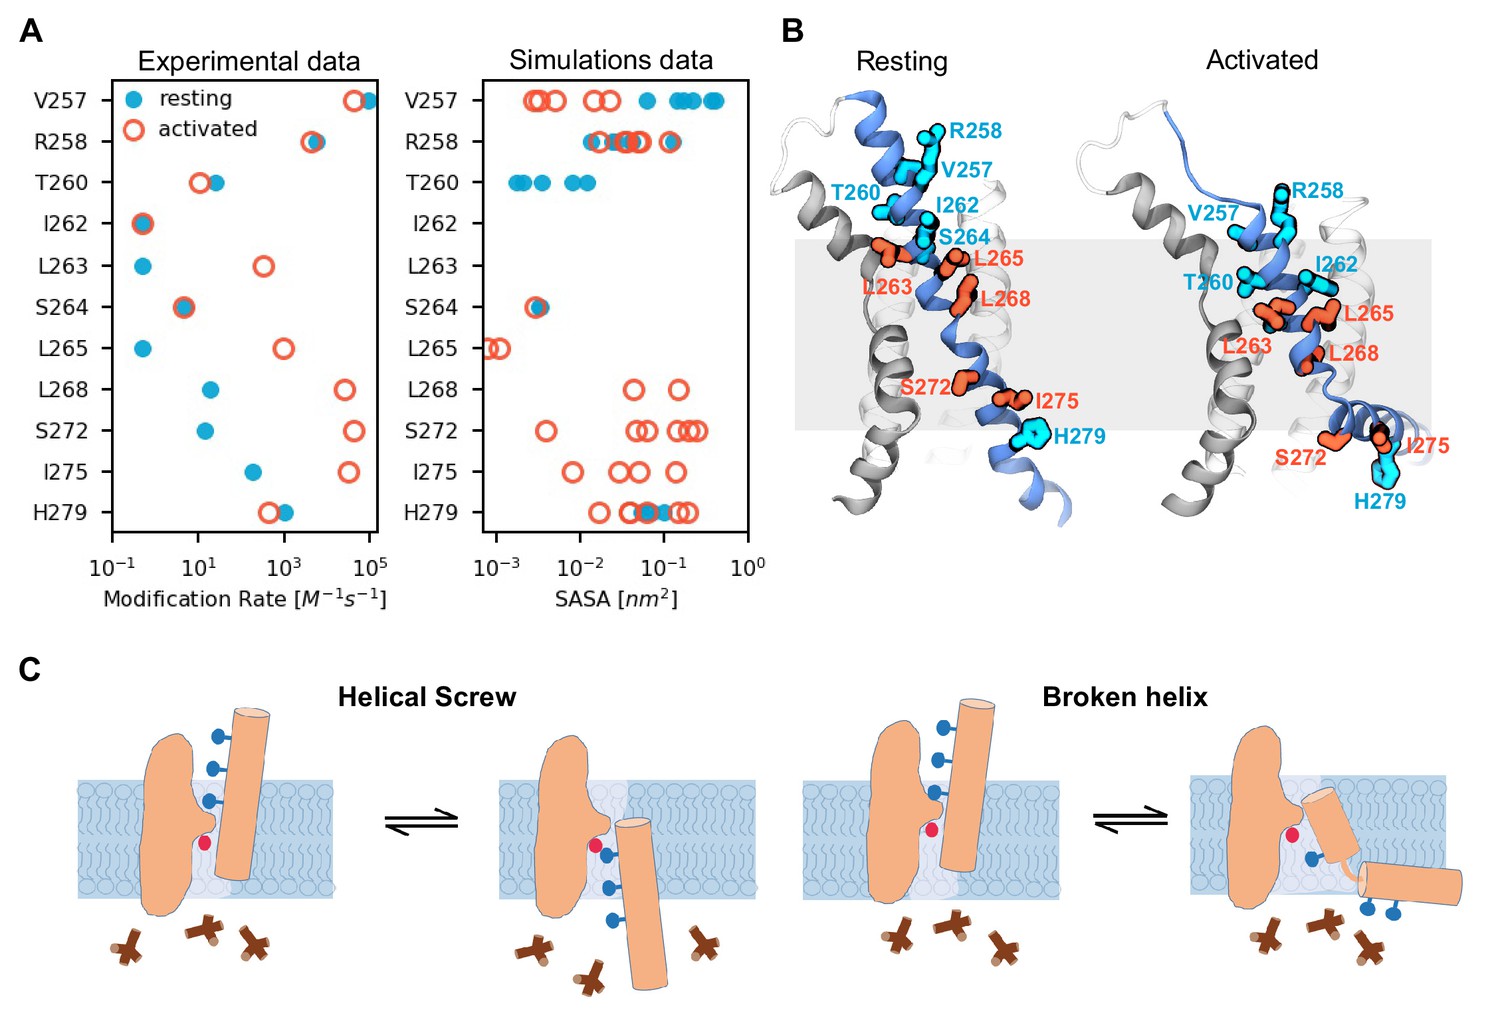
Activated state model explains state-dependent accessibility of S4 residues.
(A) Comparison of solvent accessibility data reported by Bell et al. (2004); Vemana et al. (2004) (left plot) and calculated from the MD simulations (right plot). Solvent accessibility is estimated experimentally as a rate of modification by MTSET and in the simulations as the surface area accessible to MTSET (SASA). For the simulations, the data was collected from the six voltage sensors that underwent activation; each data point corresponds to the average SASA estimated for one voltage sensor. The values for the resting (Up) state are shown as filled cyan circles, and those for the activated (Down) state as open red circles. (B) Models of the voltage sensor domains in the resting (Up) and activated (Down) conformations with residues in panel A highlighted. Residues accessible in both states are colored in cyan, and residues accessible mostly in the activated state are colored in red. (C) A cartoon highlighting the key features of the two possible models for hyperpolarization-dependent gating. In the canonical helical screw motion, the S4 translates across the membrane in a helical screw motion, past the charge transfer center within the gating scaffold. Our MD simulations of HCN1 channel show that the S4 helix moves down and breaks into two parts with the lower helix becoming almost parallel to the membrane.
Figure 3 with 2 supplements

A conserved serine residue (S272) located in the lower half of the S4 segment is critical for hyperpolarization-dependent gating.
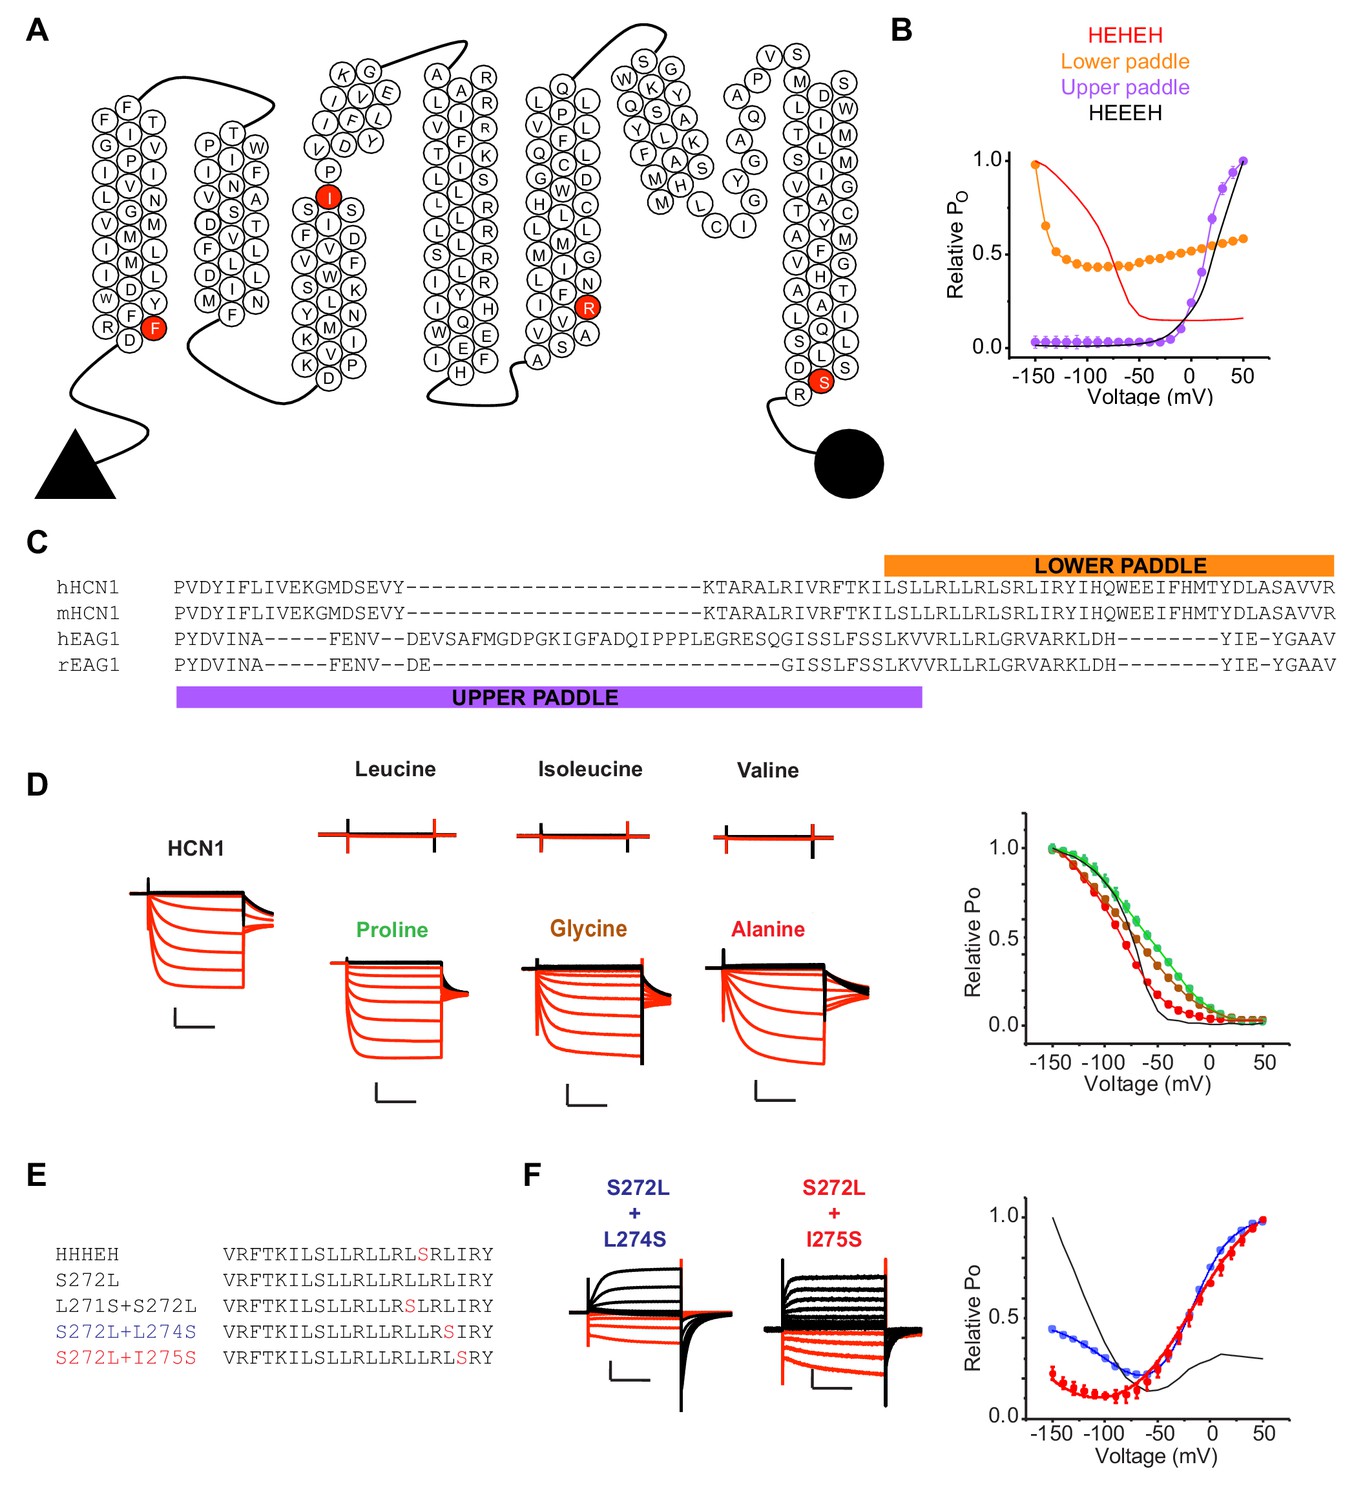
(A) Cartoon representations and representative current traces for chimeras with varying contributions of the HCN1 S4 helix. Black traces represent current responses to depolarizing pulses whereas are red ones depict current responses elicited by hyperpolarizing potential pulses. Test pulses range from −150 mV to 50 mV from a holding potential of 0 mV (lower paddle), −50 mV (HEHEH), or −90 mV (HEEEH and upper paddle). Scale bars show 5 µA (vertical) and 200 ms (horizontal). Color coding and scale bars are same throughout the figure. (B) Top: Consensus sequences from multiple sequence alignments for S4 helix of EAG and HCN families shown as sequence logos (Crooks et al., 2004). The height of each residue is proportional to its frequency, while the height of the overall stack of residues is inversely proportional to Shannon entropy. Bottom: Helicity of S4 helix plotted as a function of residue position in the activated state of HCN1 from simulations. The box plot shows the median, 25–75% (box), 1–99% (bars) of the data collected from the six voltage sensors that underwent activation. (C) Structure of a representative activated state model highlighting the position of key residues near the bend (L271 and S272 in gray and green sticks, respectively). (D) Left: Representative current traces from the bipolar chimera HHHEH and mutants of this background near the site of the S4 bending. Test pulses range from −150 mV to 50 mV from a holding potential of −50 mV (HHHEH and L271S+S272L) or −100 mV (S272L). Right: Relative PO vs. voltage curves for the mutants. Error bars represent standard deviation n = 4 (S272L), 4 (S271S+S272L) from independent measurement.
Figure 3—figure supplement 1
Probing the role of HCN S4 in hyperpolarization dependent gating.
(A) Snake plot of the mouse HCN1 (mHCN1) sequence showing the various breakpoints used for designing the chimeras. (B) Relative PO vs. voltage curves for the HEHEH and HEEEH chimeras, and the lower and upper paddle mutants. The parent HEHEH and HEEEH are shown as lines for clarity. Error bars represent standard deviation. (C) Sequence alignment of hHCN1, mHCN1, hEAG1 and rEAG1 showing the sequence used in the lower and upper paddle chimeras. (D) WT HCN1 with different mutations at S272 position. Black current traces are elicted by pulses to depolarizing potentials whereas red current traces are elicted by pulses to hyperpolarizing potentials. Scale bars represent 5 µA (vertical) and 200 ms (horizontal). Color coding and scale bars are same throughout the figure. Test pulses range from −150 mV to 50 mV from a holding potential of −10 mV. Right: Relative PO vs. voltage curves for the mutants presented on the left with WT HCN1 shown as a line for clarity. Error bars represent Standard Deviation from n = 4 (Glycine and Alanine), 5 (WT HCN1), 6 (Proline) from independent measurements. (E) Sequences of the S4 segment of the HHHEH chimera and its mutants S272L, L271S/S272L, S272L/L274S and S272L/I275S. (F) Representative current traces for the HHHEH chimera and its mutants S272L/L274S and S272L/I275S. Test pulses range from −150 mV to 50 mV from a holding potential of −80 mV. Right: Relative PO vs. voltage curves for the mutants presented. Error bars represent Standard Deviation from n = 4 (S272L/S274S), 5 (S272L/I275S) from independent measurements.
Figure 3—figure supplement 2
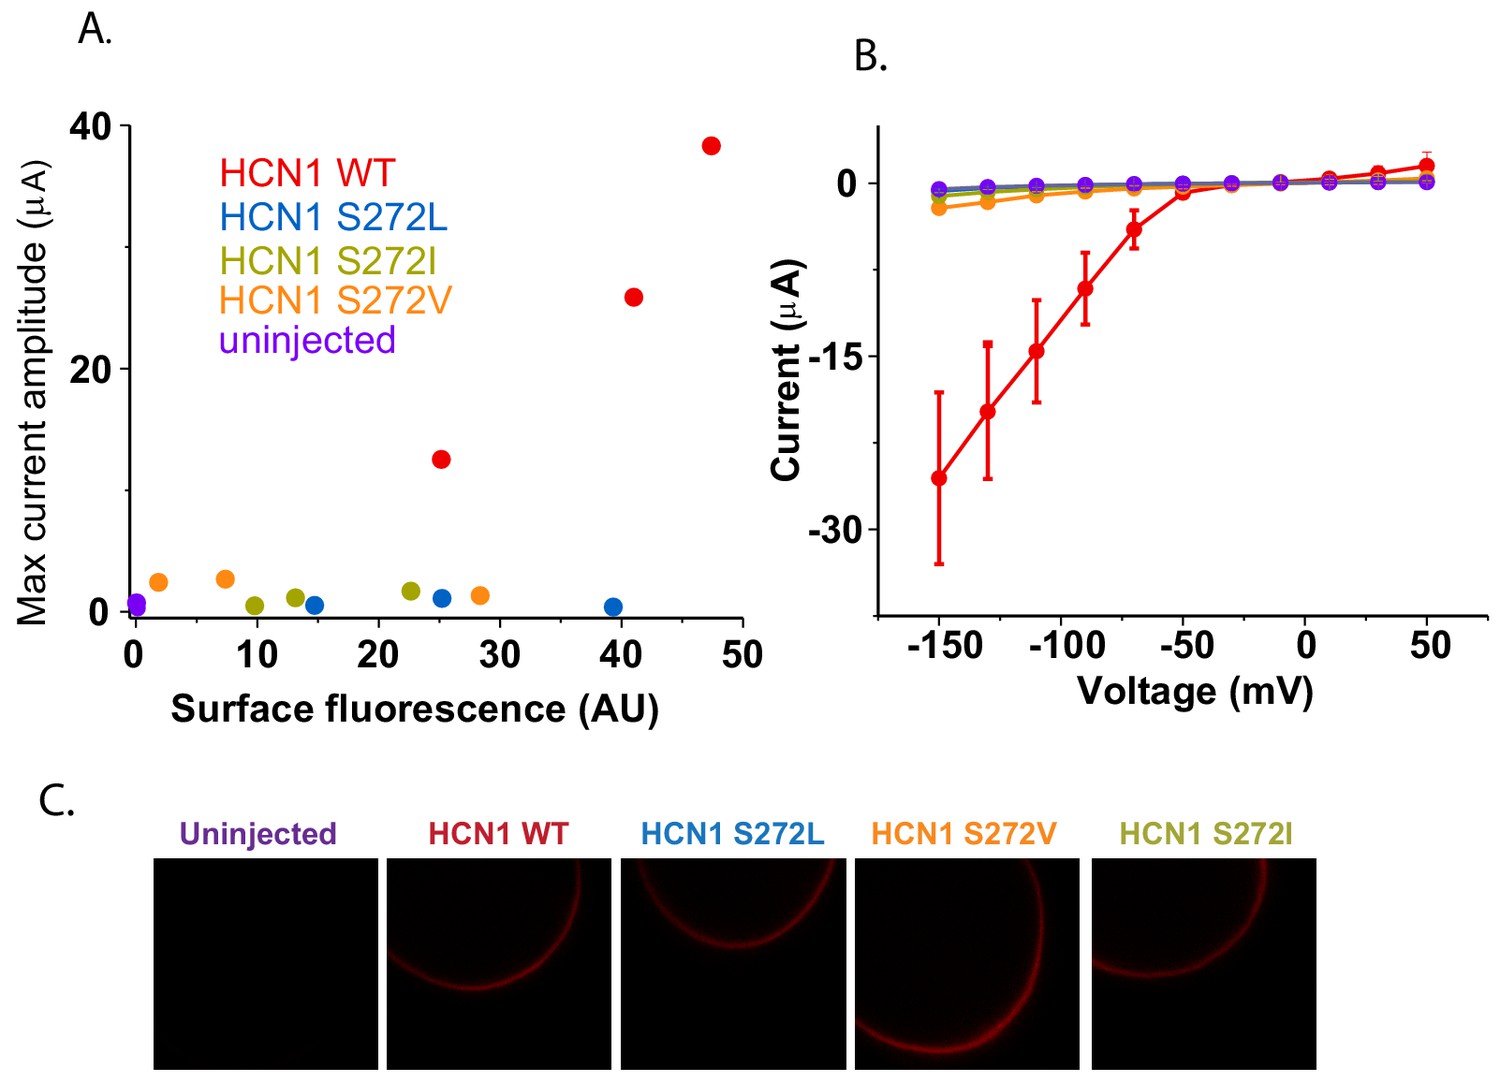
Surface trafficking of HCN1 and hydrophobic mutants at S272.
(A) Correlation of maximum current amplitude with mCherry surface fluorescence for HCN1 WT, hydrophobic mutants at S272 and uninjected oocytes. Each point represents the maximal current amplitude and integrated surface fluorescence of one oocyte. (B) Current-voltage relationships for the oocytes tested in (A) shown with the same color scheme. Error bars represent SEM for three oocytes (or two oocytes for uninjected). (C) Representative confocal micrographs of oocytes used in previous panels.
Figure 4
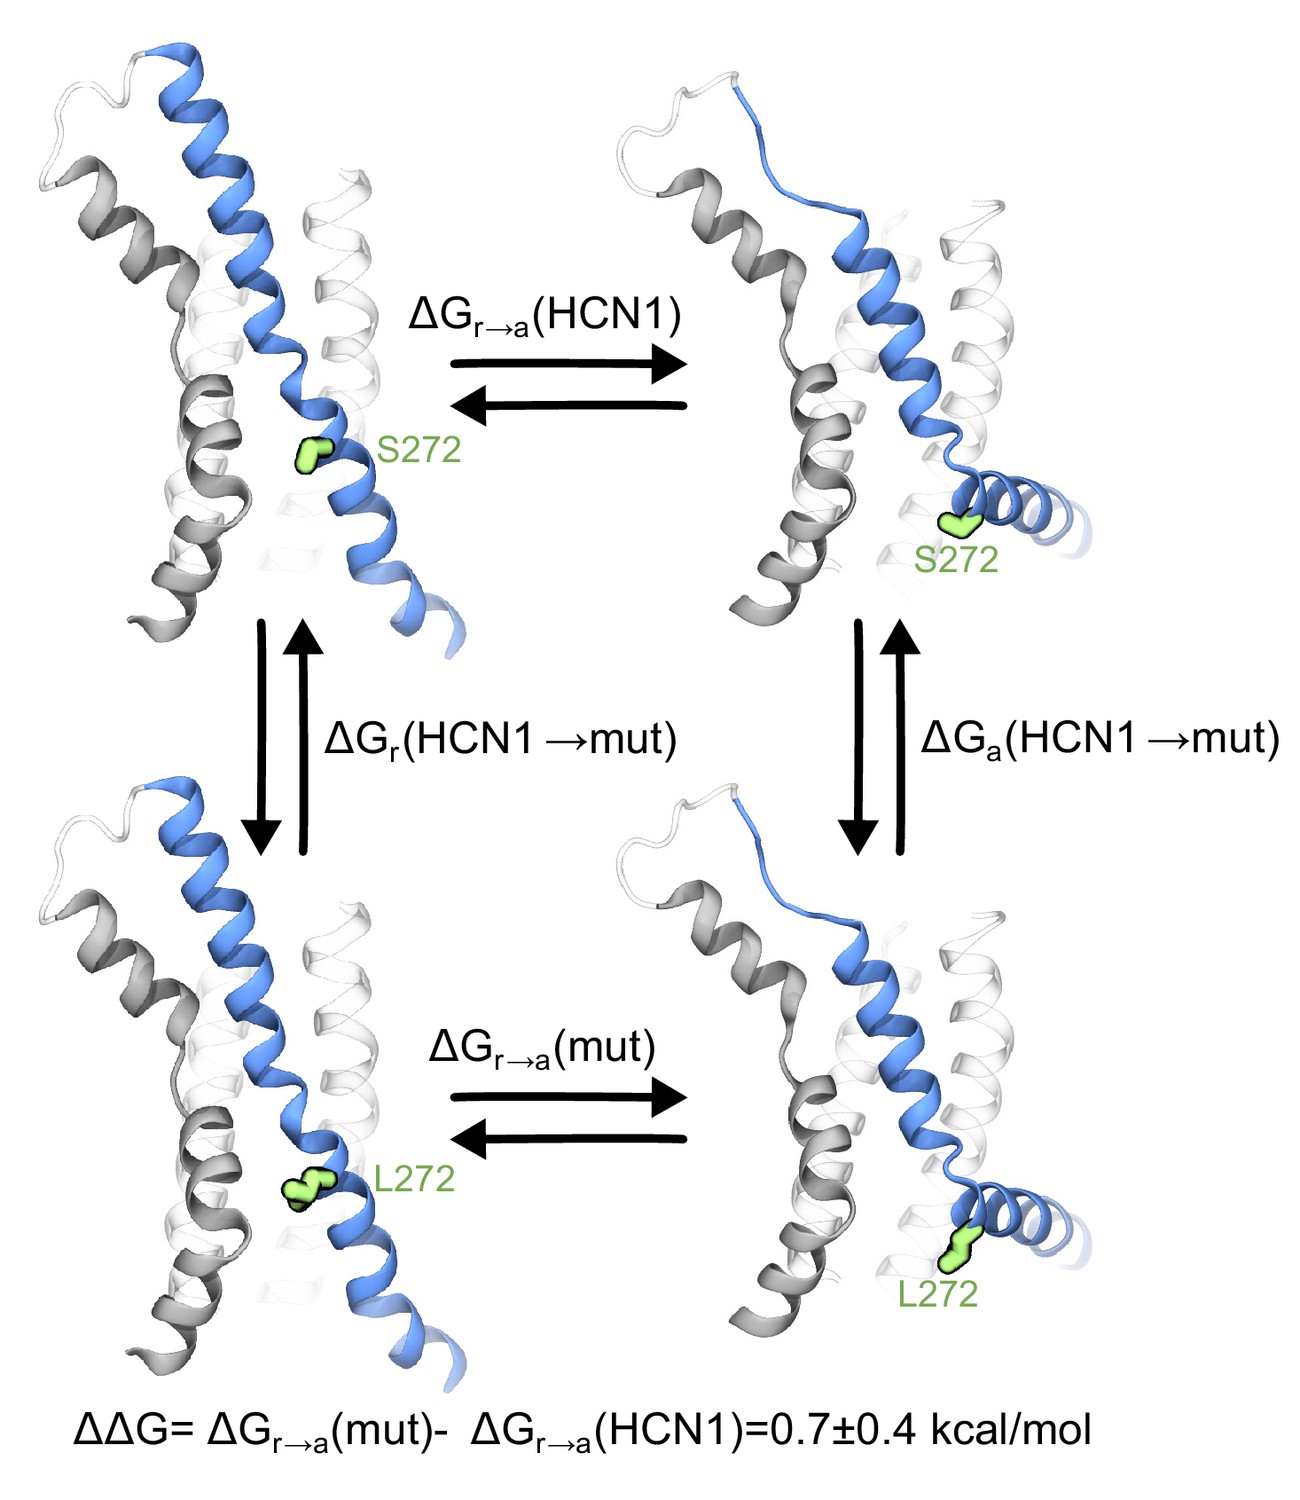
Contribution of the breakpoint serine to the free energy of activation of the HCN1 VSD.
The thermodynamic cycle shows the activation of HCN1 and its S272L mutant (∆Gr→a(mut) and ∆Gr→a(HCN1)), and the alchemical paths of S to L transition in the two VSDs (∆Ga(HCN1→mut) and ∆Gr(HCN1→mut)). The mutated residue is colored in green.
Figure 5 with 1 supplement

The physicochemical property of residues at the breakpoint is the primary determinant for gating polarity in HCN-EAG chimeras.
(A) Left: Representative current traces of the parent HHHEΔC SD (serine) and S272 mutants from two-electrode voltage clamp arranged according to decreasing hydrophobicity. The SD mutations are the same described previously (Cowgill et al., 2019). Black traces represent current responses to depolarizing pulses whereas red ones depict current responses elicited by hyperpolarizing potential pulses. Test pulses range from −150 mV to 50 mV from a holding potential of −50 mV (Glutamine), −60 mV (Serine), or −90 mV (Leucine, Valine, and Alanine). Scale bars show 5 µA (vertical) and 200 ms (horizontal). Right: Relative PO vs. voltage curves for the mutants presented on the left. The relative Po-V curve for the parent HHHEΔC SD is shown as a blue line. Error bars represent standard deviation from n = 6 (Leucine), 5 (Alanine and Valine), 4 (Proline) from independent measurements. (B) Correlation of gating polarity index (PO-150 mV/PO50 mV) with Kyle-Doolittle hydrophobicity (left), helical propensity (middle), and turn propensity (right) for the HHHEΔC SD. (C) Left: Representative current traces of the parent EEHEH (serine) and hydrophobic substitutions at S272 position. The traces are colored as described earlier. Pulse protocol is from −150 mV to 50 mV from holding potential of −40 mV (EEHEH) or −100 mV (all others). Scale bars show 2 µA (vertical) and 200 ms (horizontal). Right: Relative PO vs. voltage curves for the mutants presented on the left. The relative Po-V curve for the parent EEHEH is shown as a blue line. Error bars represent standard deviation n = 5 (Leucine and Isoleucine), 4 (Valine) from independent measurement.
Figure 5—figure supplement 1

Bipolar chimeras point to the outstanding role of S272 for hyperpolarization dependent gating.
(A) Top: Representative current traces for the HHHEH chimera and its single point mutants. Black current traces are elicted by pulses to depolarizing potentials whereas are red current traces are elicted by pulses to hyperpolarizing potentials. Test pulses range from −150 mV to 50 mV from a holding potential of −40 mV (Histidine, Glutamine, Alanine, Glycine), −50 mV (Serine), or −100 mV (Isoleucine, Valine, Proline). Scale bars represent 5 µA (vertical) and 200 ms (horizontal). Color coding and scale bars are the same throughout the figure. Bottom: Relative PO vs voltage plots for the S272 mutants in the HHHEH background. The black trace in each plot represents the original chimera with a serine at 272. Error bars represent Standard Deviation from n = 3 (Isoleucine and Histidine), 4 (Proline, Alanine and Glutamine) and 6 (Valine) from independent measurements. (B) Gating polarity index (PO-150 mV/PO50 mV) were plotted against the transmembrane helical propensity (left), Kyle-Doolittle (KD) hydrophobicity index (middle), and turn propensity (right) of amino acids according to those described previously (see Figure 5). (C) Representative current traces for the HHHEΔC SD chimera and its single point mutants. Test pulses range from −150 mV to 50 mV from a holding potential of −40 mV (Glycine) or −90 mV (all others). Bottom: Relative PO vs voltage plots for the S272 mutants in the HHHEΔC SD background. Error bars represent Standard Deviation from n = 5 (Histidine, Asparagine and Glycine), 6 (Leucine and Phenylalanine), or 4 (Proline) independent measurements. (D) Left: Structural overlay of the hHCN1 and rEAG1 voltage sensors with the position of G362 highlighted as spheres. Middle: Representative current trace for hEAG1 G362S measured in two-electrode voltage clamp. Due to the high conductance of this mutant at negative membrane potentials, current recordings in high external potassium resulted in clamp errors, thus ND96 solution was used externally (2 mM potassium). Right: Open probability vs. voltage relationships for hEAG1 and the G362S mutant. Error bars represent standard deviation.
Figure 6

Possible mechanism of hyperpolarization-dependent opening.
(A) Conformational rearrangements of S4 and S5 during activation. At the end of the simulations, the C-terminus of S4 (shown in dark blue for the resting Up state and in light blue for the activated Down state) is parallel to the membrane which causes the S5 helix (dark red for the resting Up state and in light red for the activated Down state) to tilt at the bottom. S5 helices of other subunits and S6 are shown as transparent helices for context. (B) Root mean square deviation (RMSD) of the S5 (top) and S6 (bottom) of HCN1 before (stars) and after (boxplots) MD simulations. HCN1 closed shows the RMSD values with respect to the initial structure of HCN1 (PDB 5U6O); TAX4 open shows the RMSD values with respect to the structure of TAX4 (PDB 5H3O); hERG open shows the structure of RMSD values with respect to the structure of hERG (PDB 5VA1). The arrows indicate the direction along which the HCN1 conformation evolves during activation. For instance, in case of S5, it diverges from the conformation in the HCN1 structure, and approaches that in TAX4 and hERG. (C) Network of interactions between the voltage sensor and the pore domain observed in the MD simulations (yellow), separate into two groups: between the C-termini of S1 and S5, and between the C-terminus of S4 and the N-terminus of S5. (D) Suggested model for coupling between the voltage sensor and the pore domain of HCN1. Upon activation, S4 (blue) pulls the N-terminus of S5 (green) through the first interaction network. The other interaction network anchors the C-terminus of S5 to a static S1 (yellow). These motions create room for S6 rearrangement and allow it to relax to an open conformation.
Author response image 1
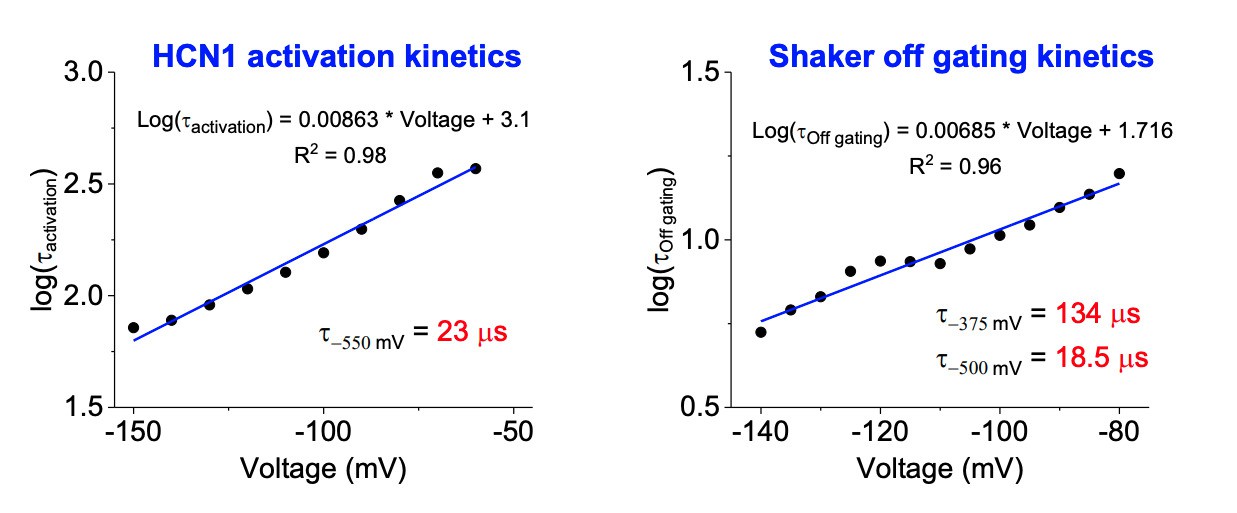
Kinetics of HCN1 and Shaker activation.
Left: The logarithm of the activation time constant (in milliseconds) is plotted against voltage for HCN1 and fit to a line. The time constant for activation at -550 mV is calculated using the equation shown. Right: The logarithm of the time constant (in ms) for off gating charge movement for Shaker is plotted against voltage. The predicted time constants at -375 and -500 mV are calculated as in the left panel.
Videos
Video 1
Conformational changes of the HCN1 voltage sensor during activation.
The S4 helix is shown in cyan, its positively charged residues in different colors (K261 purple, R267 cyan, R270 green, R273 orange and R276 red). The hydrophobic plug (F186) is colored in light green. S3 is gray and the rest of the voltage sensor is transparent.
Additional files
-
Supplementary file 1
Free energy differences for different replicates of the S to L alchemical transformations of the HCN1 VSD.
- https://cdn.elifesciences.org/articles/53400/elife-53400-supp1-v2.pdf
-
Transparent reporting form
- https://cdn.elifesciences.org/articles/53400/elife-53400-transrepform-v2.docx
Download links
A two-part list of links to download the article, or parts of the article, in various formats.
Downloads (link to download the article as PDF)
Open citations (links to open the citations from this article in various online reference manager services)
Cite this article (links to download the citations from this article in formats compatible with various reference manager tools)
Helix breaking transition in the S4 of HCN channel is critical for hyperpolarization-dependent gating
eLife 8:e53400.
https://doi.org/10.7554/eLife.53400


