Kinesin Kif2C in regulation of DNA double strand break dynamics and repair
- University of Nebraska Medical Center, United States
- Université de Montréal, Canada
- Anhui University, China
Figures
Figure 1 with 1 supplement
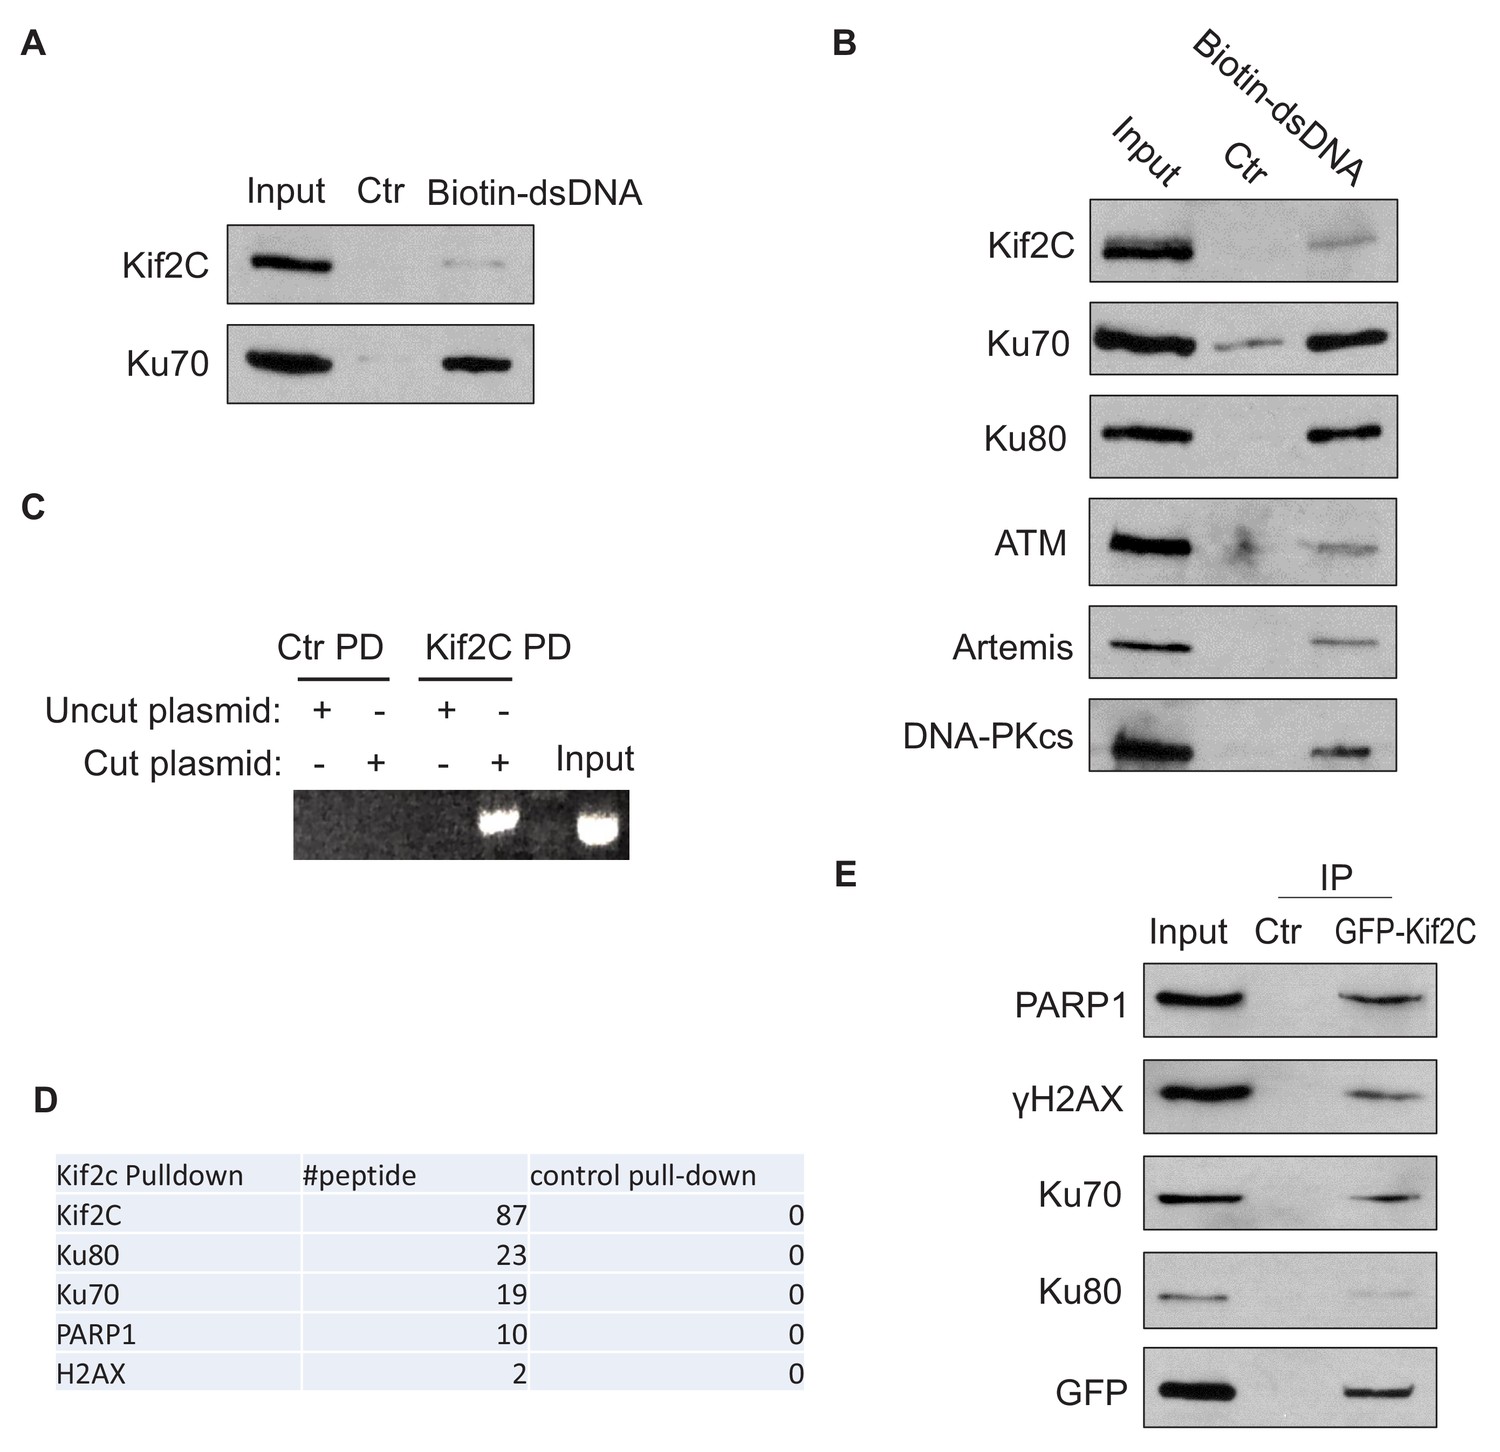
Kif2C associates with DNA double strands breaks and DNA repair proteins.
(A) Beads conjugated with a biotin-double stranded DNA fragment (dsDNA, 500 bp, as described in Materials and methods—DNA binding assay) were incubated in Xenopus egg extracts for 30 min, re-isolated, and resolved by SDS-PAGE. The input, control pull-down (with blank beads), and biotin-dsDNA pull-down were analyzed by immunoblotting. (B) Beads conjugated with biotin-dsDNA (as in panel A) were incubated in HeLa cell lysates for 30 min, re-isolated, and resolved by SDS-PAGE. The input, control pull-down (with blank beads), and biotin-dsDNA pull-down were analyzed by immunoblotting. (C) Xenopus Kif2C was expressed with MBP-tag, and purified on amylose beads. As described in Materials and methods—pull-down assay, MBP-Kif2C or control (blank) beads were incubated in Xenopus egg extracts supplemented with cut or uncut plasmid, re-isolated, and analyzed by PCR and agarose gel electrophoresis/ethidium bromide staining. (D) As described in Materials and methods—pull-down assay, human Kif2C was expressed with MBP-tag and purified on amylose beads. MBP-Kif2C or control (blank) beads were incubated in the lysates of doxorubicin-treated HeLa cells. Pull-down samples were analyzed by mass spectrometry. The identified DNA repair proteins and numbers of peptides are shown. (E) GFP-Kif2C was expressed in HeLa cells with doxorubicin-treatment. Immunoprecipitation (IP) was performed using anti-GFP or control (blank) beads. 10% input, control and GFP IP samples were analyzed by immunoblotting.
Figure 1—figure supplement 1
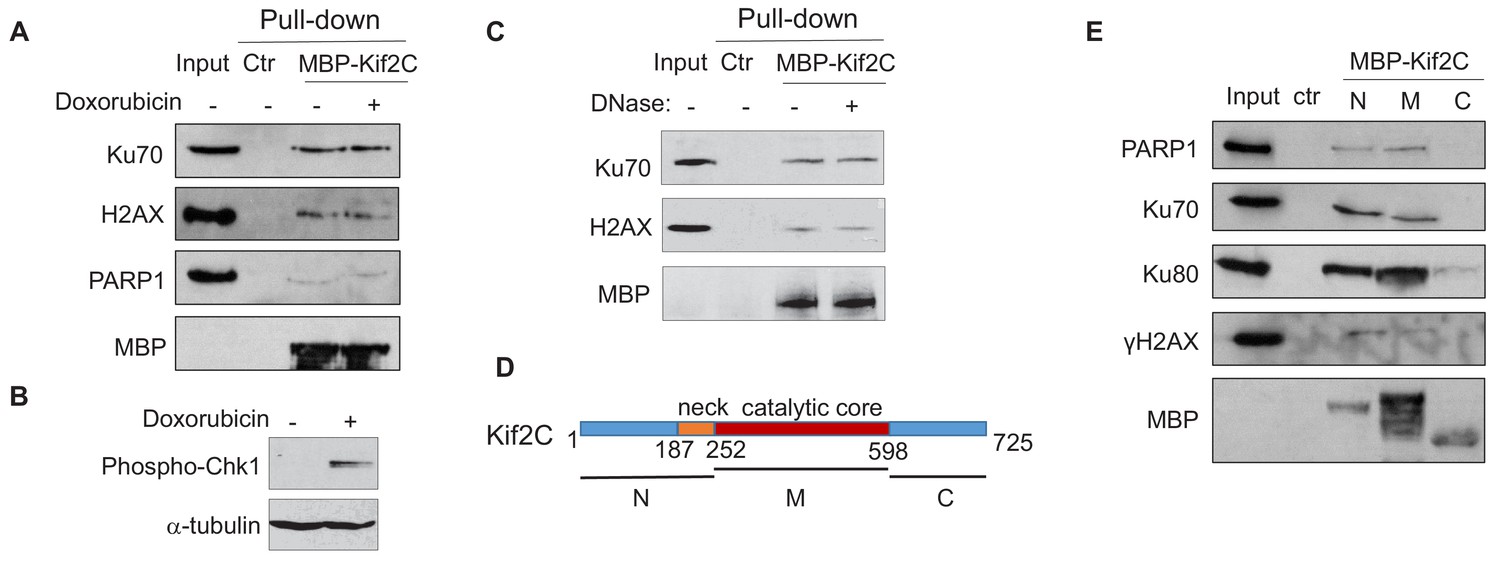
Kif2C associates with DNA repair proteins.
(A) MBP-Kif2C pull down was performed in HeLa cells with or without doxorubicin (2 μg/mL) treatment. Input, control pulldown with blank beads, and MBP pulldown samples were analyzed by immunoblotting. (B) Doxorubicin treatment, as in panel A, activated DNA damage signaling, as indicated by Chk1 phosphorylation at Ser-317. (C) MBP-Kif2C pull down was performed in HeLa cells as in panel A. Cell lysates were incubated with DNase I (100 units/mL) as indicated. Input, control pulldown with blank beads, and MBP pulldown samples were analyzed by immunoblotting. (D,E) The N, M, C segments of Kif2C, as shown in panel D, were used for pull-down in the lysates of HeLa cells treated with doxorubicin. Control (ctr) pull-down was performed using blank beads. Immunoblots are shown in panel E.
Figure 2 with 3 supplements
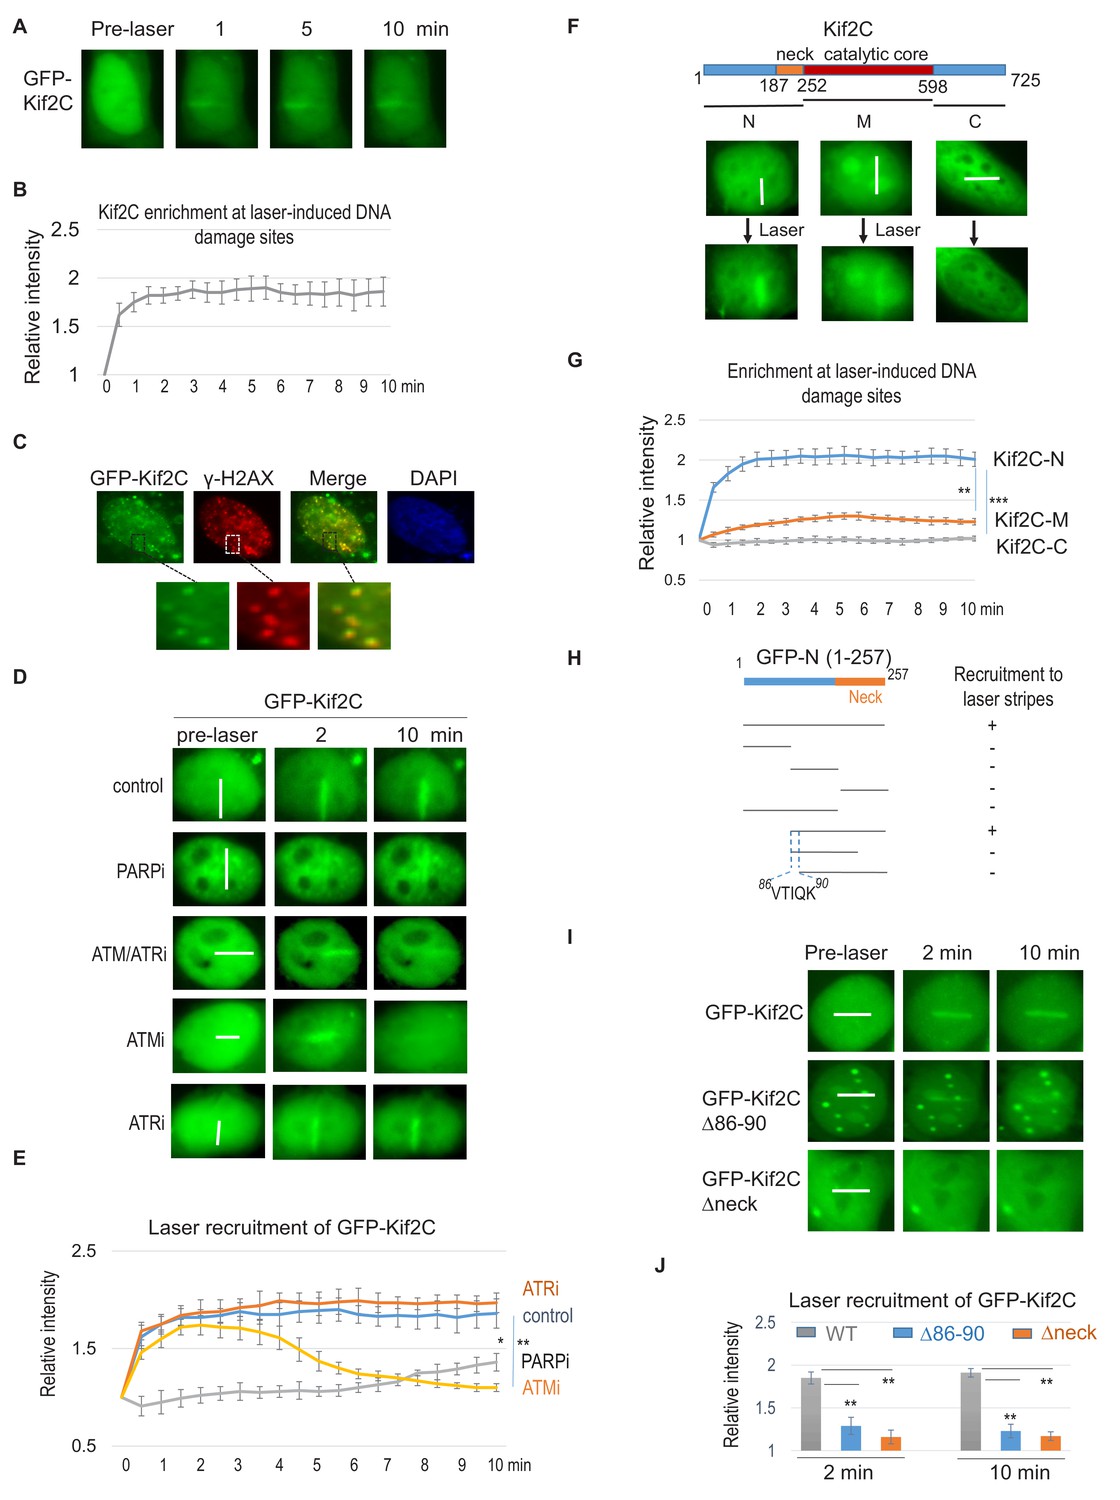
Kif2C is recruited to DNA damage sites in a two-stage manner.
(A) HeLa cells expressing GFP-Kif2C were subjected to laser micro-irradiation as described in Materials and methods—immunofluorescence and imaging. The fluorescent signal of GFP is shown at the indicated time points. (B) The intensity of the GFP signal at laser-cut sites was normalized to that outside of the laser-cut sites for the relative enrichment of GFP-Kif2C. The mean values and standard deviations are shown (quantification shown in 5 cells, consistent pattern observed in >10 cells and >3 independent experiments). (C) HeLa cells expressing GFP-Kif2C were treated with 10 Gy IR, the fluorescent signal of GFP and immunofluorescent signal of γ-H2AX are shown. Pre-extraction was performed by placing the dish on ice for 5 min with 0.1% Triton X-100 in 10 mm HEPES (pH 7.4), 2 mm MgCl2, 100 mm KCl, and 1 mm EDTA. (D) GFP-Kif2C was expressed in HeLa cells. Prior to laser-micro-irradiation, these cells were pre-treated with PARPi (olaparib, 10 μM), ATM/ATRi (caffeine, 2 mM), ATMi (Ku55933, 5 μM), or ATRi (Ve-821, 10 μM), as indicated. The localization of GFP-Kif2C at the indicated time points is shown. The white lines mark the regions of laser micro-irradiation. Consistent results were observed in >10 cells for each treatment. (E) The DNA damage recruitment of Kif2C was examined as in panel D. The intensity of the GFP signal at laser-cut sites was normalized to that outside of the laser-cut sites for the relative enrichment of GFP-Kif2C. The mean values and standard deviations are shown (N = 5). ATM/ATRi showed similar kinetics as ATMi. P values were determined by two-tailed Student’s t-test (*<0.05, **<0.01, ***<0.001). (F) The N-terminus, middle segment (M), and C-terminus of MCAK was expressed with a GFP tag to examine their localization in laser-treated HeLa cells. The white lines mark the regions of laser micro-irradiation. Consistent results were observed in >10 cells for each segment. (G) The DNA damage recruitment of Kif2C-N, M, and C was examined as in panel F. The intensity of the GFP signal at laser-cut sites was normalized to that outside of the laser-cut sites for the relative enrichment. The mean values and standard deviations are shown (N = 5). (H) A series of truncation mutants were generated from the N-terminus of Kif2C. These mutants, tagged with GFP, were analyzed for recruitment to laser-stripes 10 min after the treatment. The result of positive or negative recruitment was determined by consistent results in >10 cells. (I) GFP-Kif2C deleted of aa 86–90 or neck-motif was expressed in HeLa cells which were micro-irradiated by laser (as marked by white lines). Both the aa 86–90 and neck-motif of Kif2C are required for the efficient recruitment of Kif2C to laser stripes. The white line marks the path of laser. (J) The recruitment to laser stripes, as in panel I, was quantified for Kif2C (WT, or deleted of the aa 86–90 or neck-motif). The intensity of the GFP signal at laser-cut sites was normalized to that outside of the laser-cut sites for the relative enrichment. The mean values and standard deviations are shown (N = 5, **p<0.01).
Figure 2—figure supplement 1
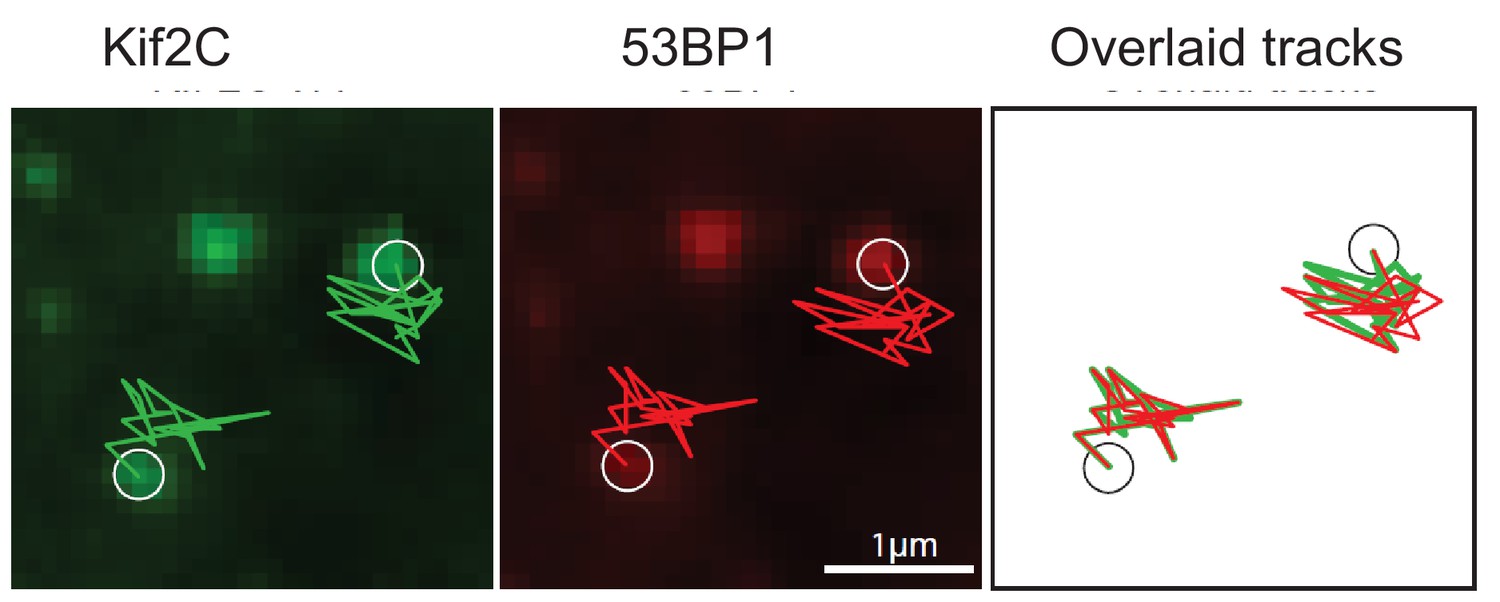
The co-localization and co-migration of Kif2C and 53BP1 foci.
Two representative examples of Kif2C and 53BP1 foci were tracked in U2OS cells. The coordinated movements of WT-KIF2C and 53BP1 foci are shown.
Figure 2—figure supplement 2
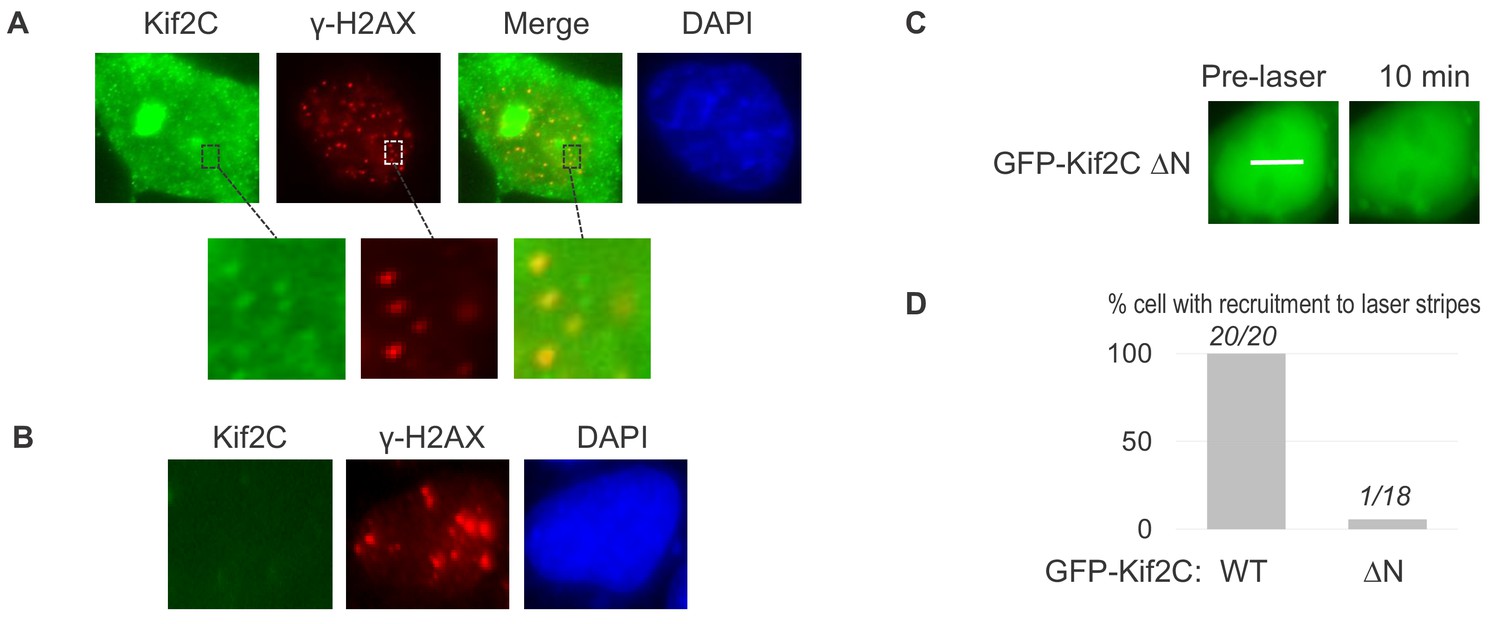
Kif2C recruitment to DNA damage sites.
(A) HeLa cells were treated with 10 Gy IR, the immunofluorescent (IF) signals of Kif2c and γ-H2AX are shown. Pre-extraction was performed by placing the dish on ice for 5 min with 0.1% Triton X-100 in 10 mM HEPES (pH 7.4), 2 mM MgCl2, 100 mM KCl, and 1 mM EDTA. (B) Kif2C and γ-H2AX IF was performed as in panel A, in Kif2C knockout (KO) cells. (C) The localization of GFP-Kif2C deleted of N-terminus before or after laser treatment is shown. The white line marks the path of laser. (D) Quantification of cells showing recruitment to laser stripes.
Figure 2—figure supplement 3
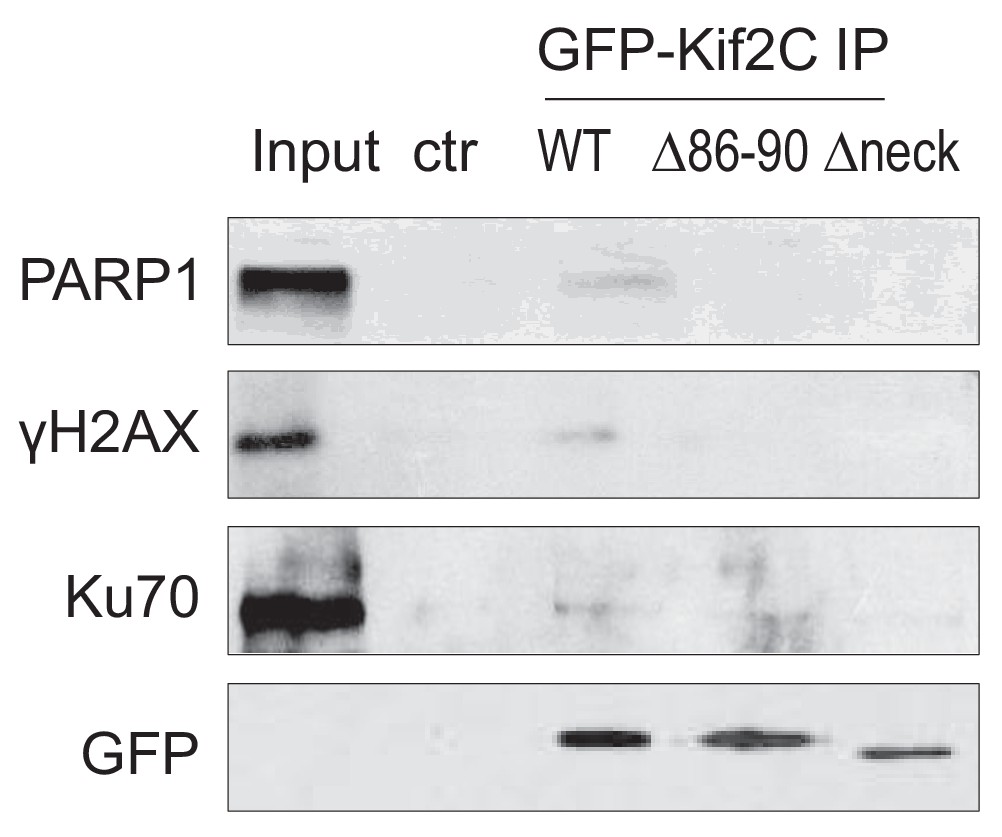
Kif2C associations with repair proteins were disrupted by mutations.
GFP-Kif2C (WT or deletion mutants) IP was performed using anti-GFP or control (blank) beads, as in Figure 1E. 10% input, control and GFP IP samples were analyzed by immunoblotting.
Figure 3 with 3 supplements
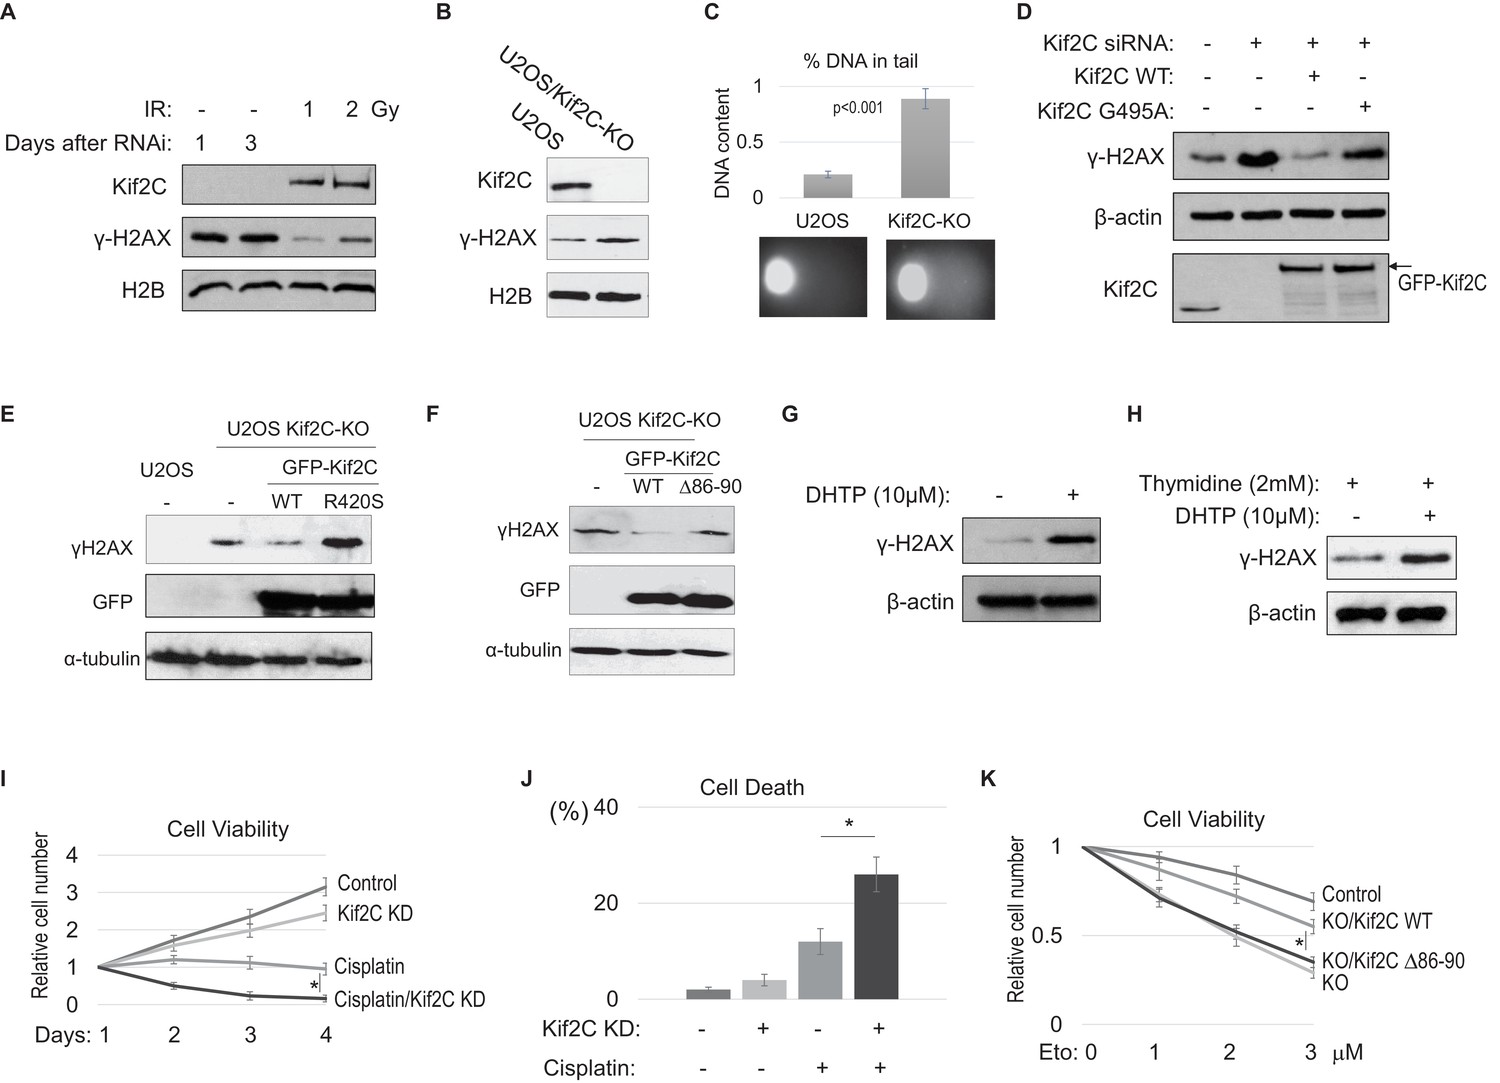
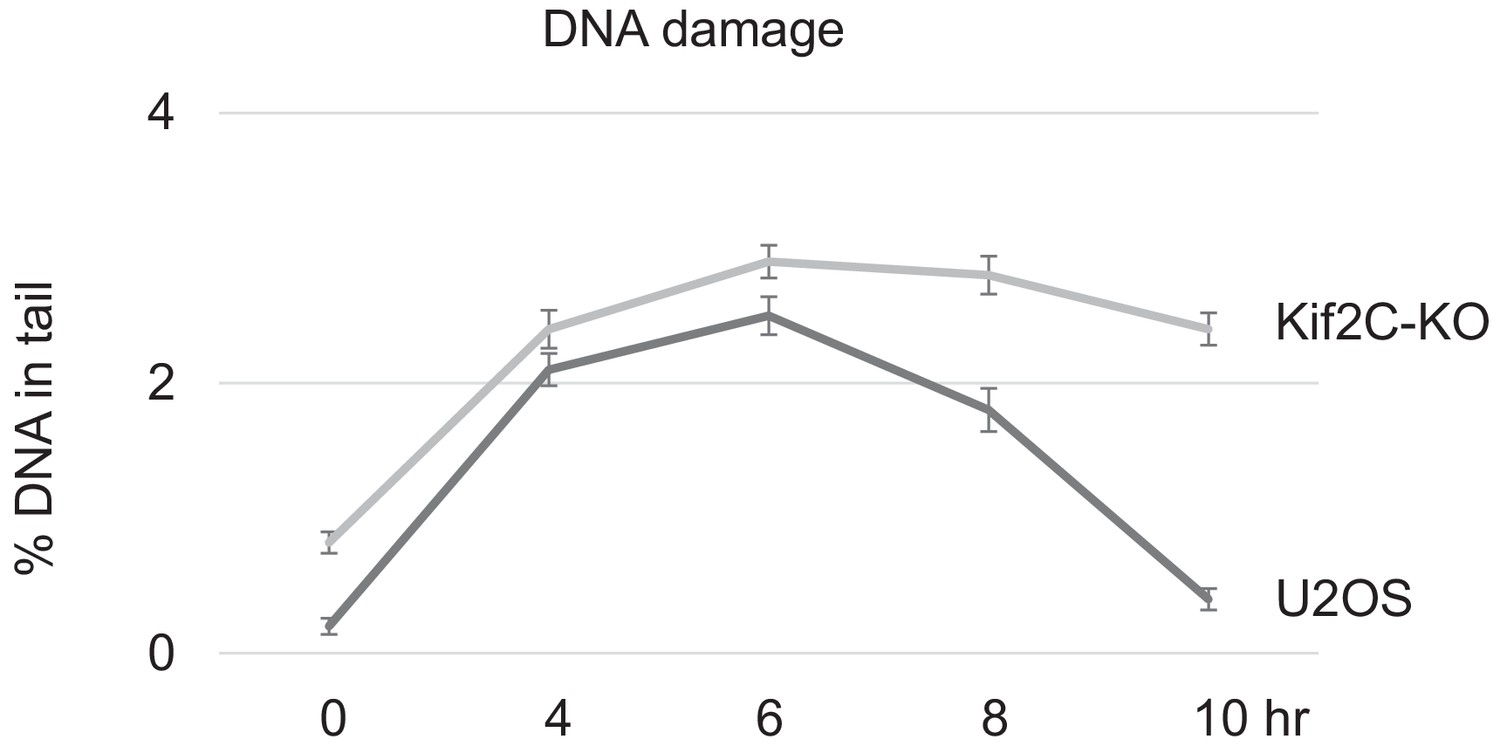
Kif2C suppression leads to accumulation of endogenous DNA damage and DNA damage hypersensitivity.
(A) HeLa cells were treated with Kif2C siRNA for 1 and 3 days, or with IR at 1 or 2 Gy (followed by 30 min incubation), as indicated. These cells were then harvested and analyzed by immunoblotting. (B) Kif2C gene deletion was carried out using the CRISPR-Cas9 technique in U2OS cells. Cell lysates were collected and analyzed by immunoblotting. (C) The comet assay was performed in control or Kif2C knockout (KO) U2OS cells, as described in Materials and methods. The percentage of DNA in the tail section was quantified, the mean values and standard derivations are shown (N > 20). Representative images are shown below. (D) HeLa cells were treated with control siRNA or Kif2C siRNA, and reconstituted with siRNA resistant GFP-Kif2C (WT or G495A), as indicated. Cell lysates were harvested and analyzed by immunoblotting. (E) Control or Kif2C knockout (KO) U2OS cells were transfected with WT or R420S Kif2C tagged with GFP, as indicated. One day after transfection, the samples were analyzed by immunoblotting. (F) U2OS Kif2C knockout (KO) cells were transfected with WT or Δ86–90 Kif2C tagged with GFP, as indicated. One day after transfection, the samples were analyzed by immunoblotting. (G) Asynchronized HeLa cells were treated with 20 µM DHTP for 3 hr, as indicated. The cell lysates were analyzed by immunoblotting. (H) HeLa cells were first synchronized at G1/S by thymidine-arrest, and then treated with 10 µM DHTP for 3 hr. The cell lysates were analyzed by immunoblotting. (I) HeLa cells were incubated in cisplatin (6.7 μM) and Kif2C siRNA, as indicated. The relative cell viability was determined by normalizing the cell number to that of the first day. The mean values and standard deviations, calculated from three independent experiments, are shown. *p<0.05. (J) HeLa cells were treated as in panel I for 2 days, and measured by the trypan blue exclusion assay for cell death. The mean values and standard deviations, calculated from three independent experiments, are shown. (K) WT or Δ86–90 Kif2C was expressed in Kif2C KO cells as in panel F. 1 day after transfection, these cells, along with control U2OS, were treated with various doses of etoposide for 2 days. The relative cell viability was determined by first calculating the ratio of cell number in day 3 to that in day 1, and then normalizing the ratio of etoposide treated cells to that of the untreated. The mean values and standard deviations, calculated from three independent experiments, are shown.
Figure 3—figure supplement 1
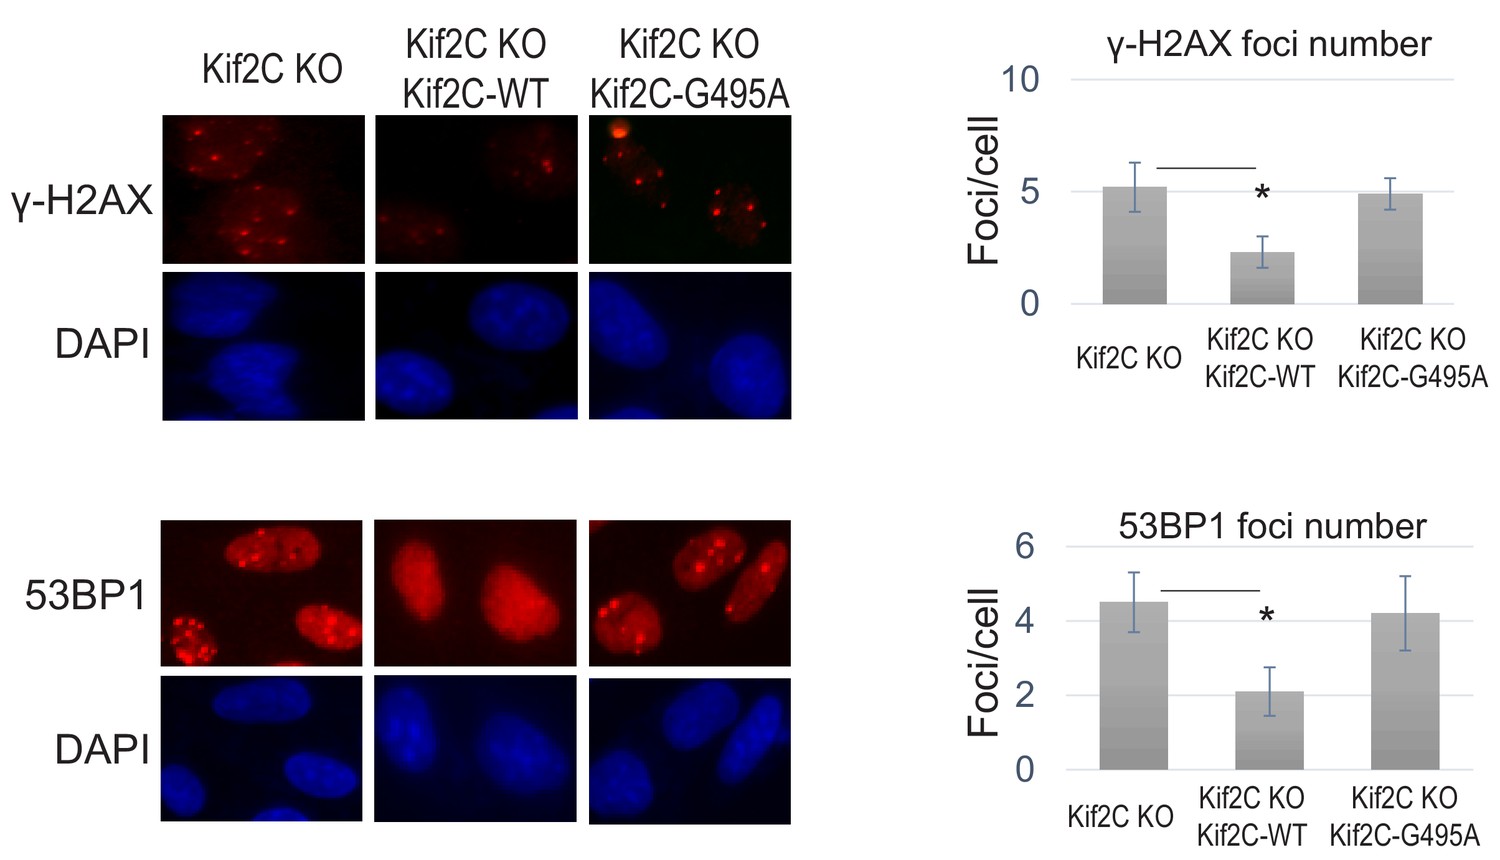
Foci formation of γ-H2AX and 53BP1 in undamaged Kif2C knockout (KO) cells.
Representative foci formation is shown in Kif2C KO cells with or without expression of WT or G495A Kif2C, as in Figure 3D. Quantifications of foci number are shown on the right panels (N > 20).
Figure 3—figure supplement 2
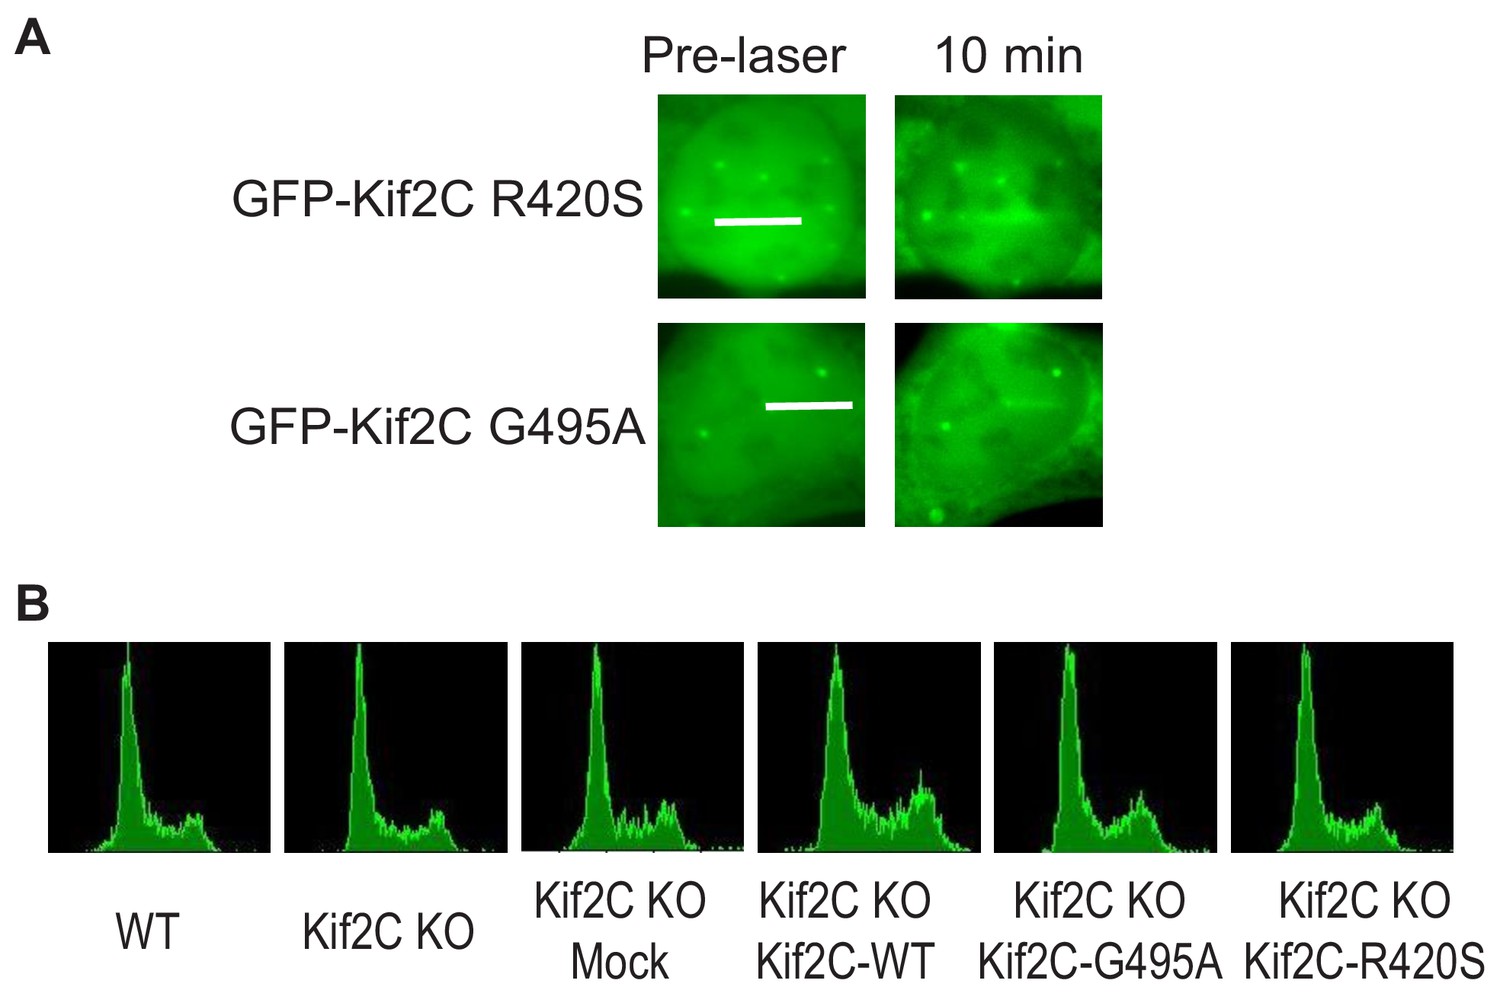
Kif2C recruitment and cell cycle effect.
(A) The recruitment of GFP-Kif2C R420S and G495A to laser-induced DNA damage sites. The GFP localization before or after laser treatment is shown. The white line marks the path of laser. (B) WT or Kif2C KO U2OS cells were analyzed by FACS for cell cycle distribution. Cells were mock transfected or transfected with WT, G495A or R420S Kif2C, as in Figure 3.
Figure 3—figure supplement 3
The MT depolymerase activity of Kif2C is involved in the DNA damage response.
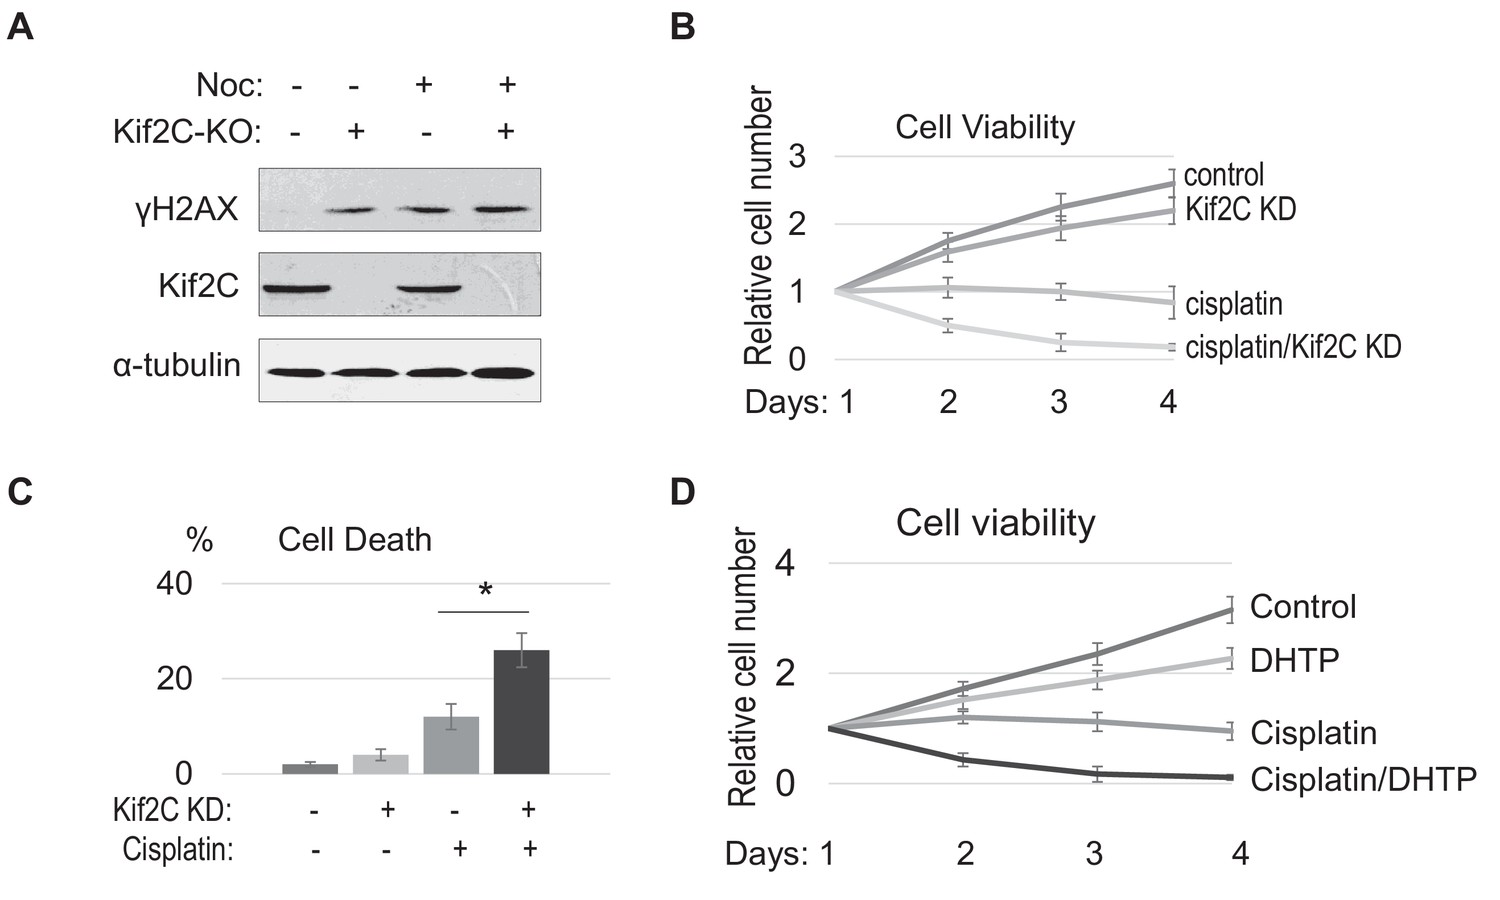
(A) Kif2C depletion does not further induce DNA damage in cells treated with nocodazole (100 ng/ml). Control or Kif2C knockout (KO) U2OS cells were treated with nocodazole for 8 hr, as indicated. The samples were analyzed by immunoblotting. (B) Human head and neck cancer SCC38 cells were incubated in cisplatin (6.7 μM) and Kif2C siRNA, as indicated. The relative cell viability was determined by normalizing the cell number to that of the first day. The mean values and standard deviations, calculated from three independent experiments, are shown. (C) SCC38 cells were treated as in panel B for 2 days, and measured by the trypan blue exclusion assay for cell death. The mean values and standard deviations, calculated from three independent experiments, are shown. (D) HeLa cells were incubated in cisplatin (6.7 μM) and DHTP (10 μM), as indicated. The relative cell viability was determined by normalizing the cell number to that of the first day. The mean values and standard deviations, calculated from three independent experiments, are shown.
Figure 4 with 2 supplements
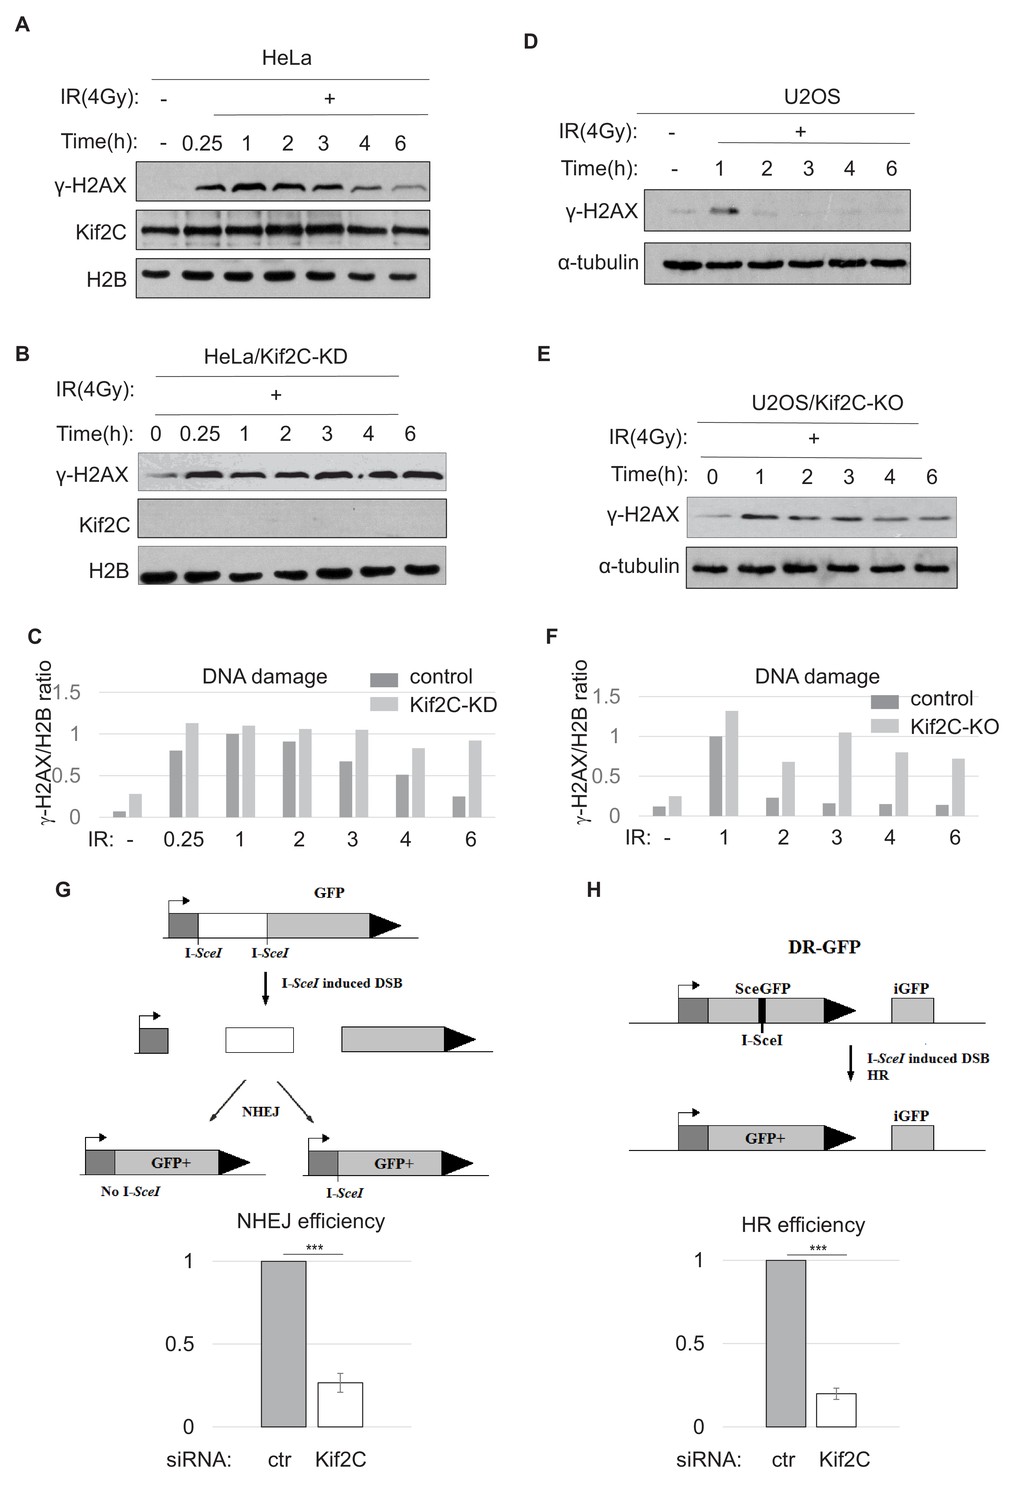
Kif2C is required for DNA double strand break repair.
(A, B, C) HeLa cells treated with control (A) or Kif2C siRNA (B) were irradiated with 4 Gy IR, and incubated as indicated. The cell lysates were analyzed by immunoblotting. Quantification is shown in panel C. (D, E, F) U2OS cells, control (D) or Kif2C knockout (KO, (E), were irradiated with 4 Gy IR, and incubated as indicated. The cell lysates were analyzed by immunoblotting. Quantification is shown in panel F (as relative to 1 hr time point in control HeLa cells). (G, H) Chromosome-integrated, I-SceI-induced NHEJ (G) or HR (H) reporter systems are illustrated in the upper panels. These reporter cells were transfected with control or Kif2C siRNA. DNA repair was measured by immunoblotting of GFP expression in relative to β-actin expression. The GFP/β-actin ratio in Kif2C-depleted cells was normalized to that in control cells for relative repair efficiency. The mean values and standard deviations, calculated from three independent experiments, are shown. Statistical significance was analyzed using an unpaired 2-tailed Student’s t-test (***p<0.001). Kif2C depletion did not impact the expression of I-SceI (Figure 4—figure supplement 2).
Figure 4—figure supplement 1
Kif2C depletion impairs DNA repair.
Comet assay was performed in U2OS cells with or without Kif2C knockout. The cells were treated with doxorubicin at time 0 for 1 hr. The percentage of DNA in the tail section was quantified, the mean values and standard derivations are shown (N > 10).
Figure 4—figure supplement 2

Kif2C depletion did not affect the expression of I-SceI.
Figure 5 with 3 supplements
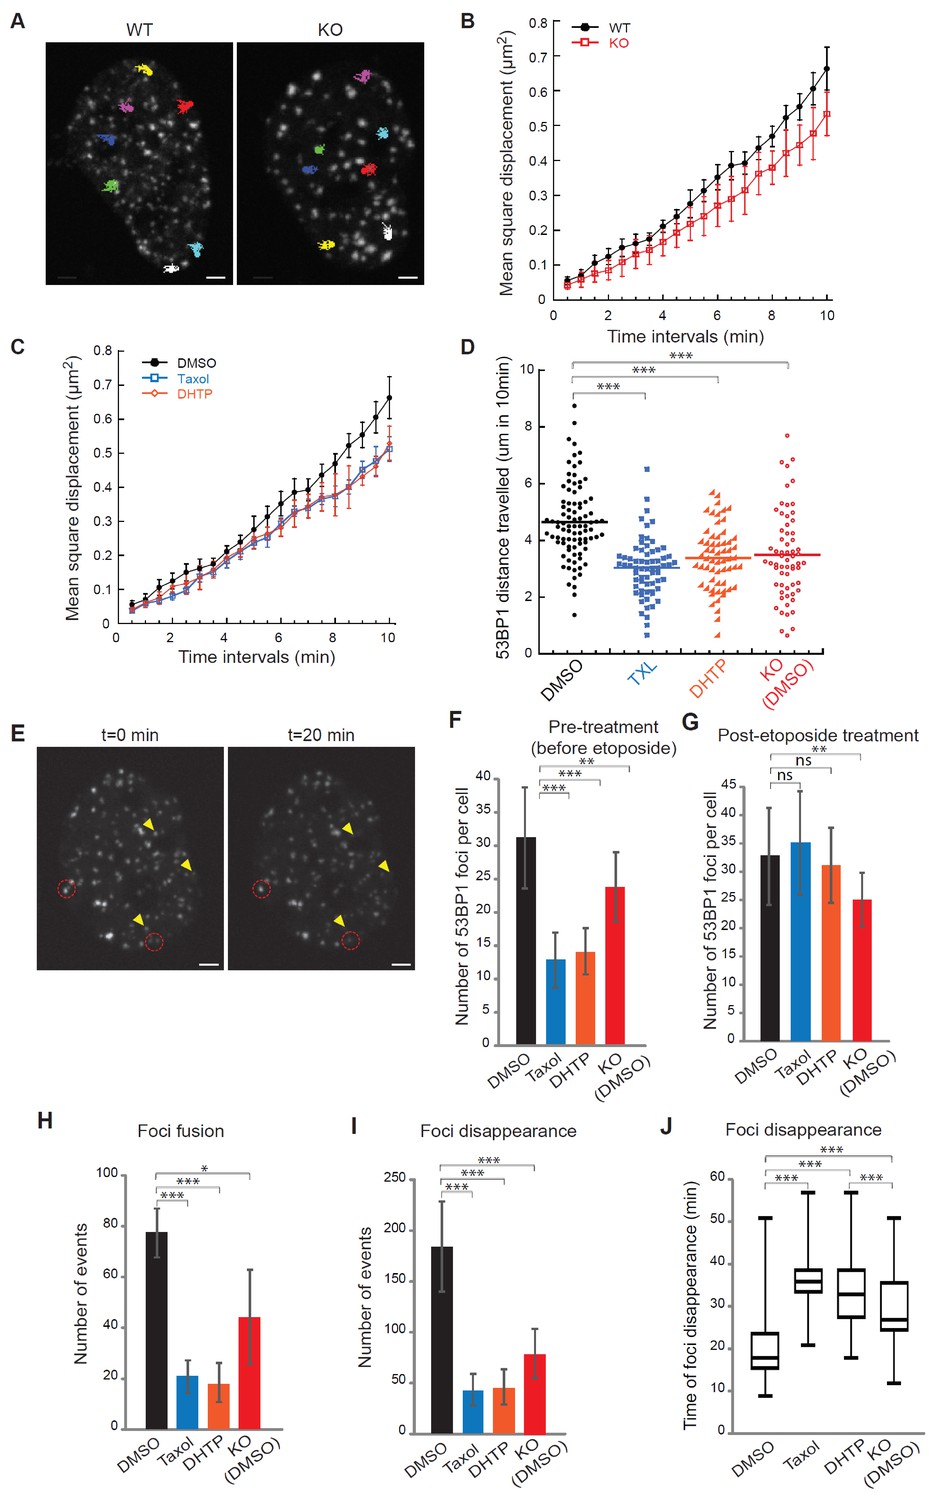
Kif2C mediates DNA double strand break mobility and foci dynamics.
(A) Examples of 10 min mobility traces of EGFP-53BP1 foci in WT and Kif2c knockout (KO) U2OS cells after etoposide (20 μM) treatment. Kif2C depletion did not impact 53BP1 expression (Figure 5—figure supplement 1A). (B) Mean-square displacement measurements of EGFP-53BP1 foci in WT and Kif2C KO U2OS cells, shown in black in red, respectively. (C) Mean-square displacement measurements of EGFP-53BP1 foci in WT U2OS cells treated with the vehicle control (DMSO), Taxol (5 μM), or DHTP (20 μM), as indicated. (D) Quantification of the distance travelled by EGFP-53BP1 foci over 10 min in the corresponding cells described in B-C. (E) Examples of disappearance (yellow arrowheads) and fusion (red circle) events of EGFP-53BP1 foci induced by etoposide in U2OS cells. (F, G) Number of EGFP-53BP1 foci in WT or Kif2C KO U2OS cells, treated with the vehicle control (DMSO), Taxol, or DHTP. These inhibitors were added either 5 min before (F) or 5 min after (G) etoposide treatment. (H–J) Numbers of fusion (H) and disappearance (I–J) events of EGFP-53BP1 foci in the corresponding cells in panel G are shown. A total of 15 randomly selected cells were analyzed over three independent experimental runs. For disappearance events, number of occurrence in the first 30 min under each treatment condition is shown in (I) and the time required for foci disappearance (min) over the entire hour of recording is shown in (J) (>150 events quantified per condition). The box represents 50% of the foci disappearance events and the line shows the median of the data set. All microscopy image acquisitions began five minutes after final compound treatment, either every 30 s for 10 min (A–D) or every 3 min for one hour (H–J). All data were collected from at least three independent experimental sets. Error bars, S.D.; ns: p>0.05; *p≤0.05; **p≤0.01; ***p≤0.001, by Student’s t-test.
Figure 5—figure supplement 1
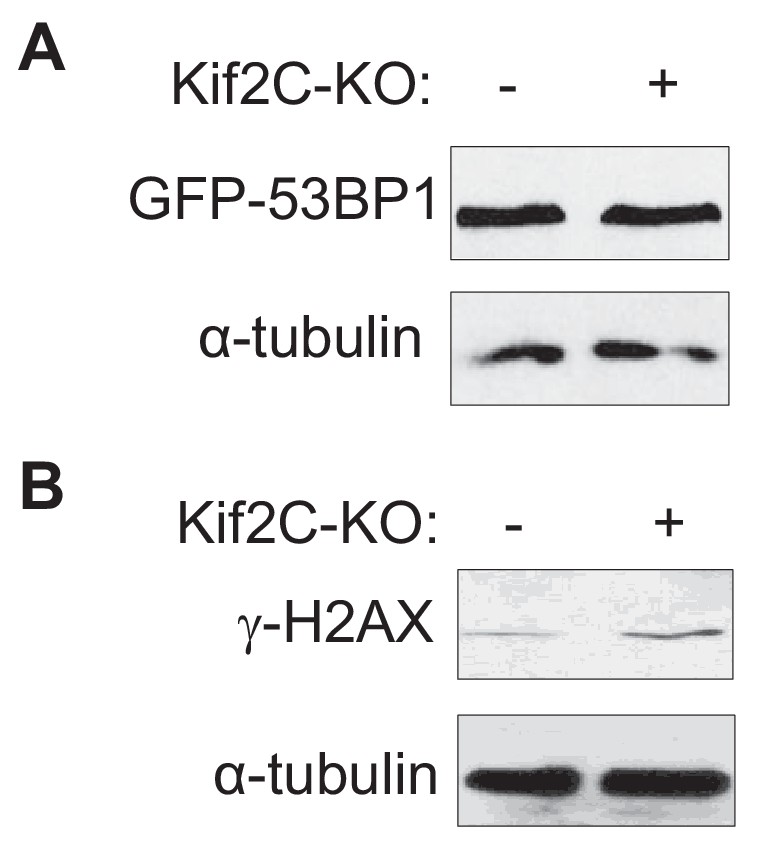
Kif2C depletion did not affect the expression of GFP-53BP1 (A).
Kif2C depletion increased g-H2AX induced by etoposide (B).
Figure 5—figure supplement 2
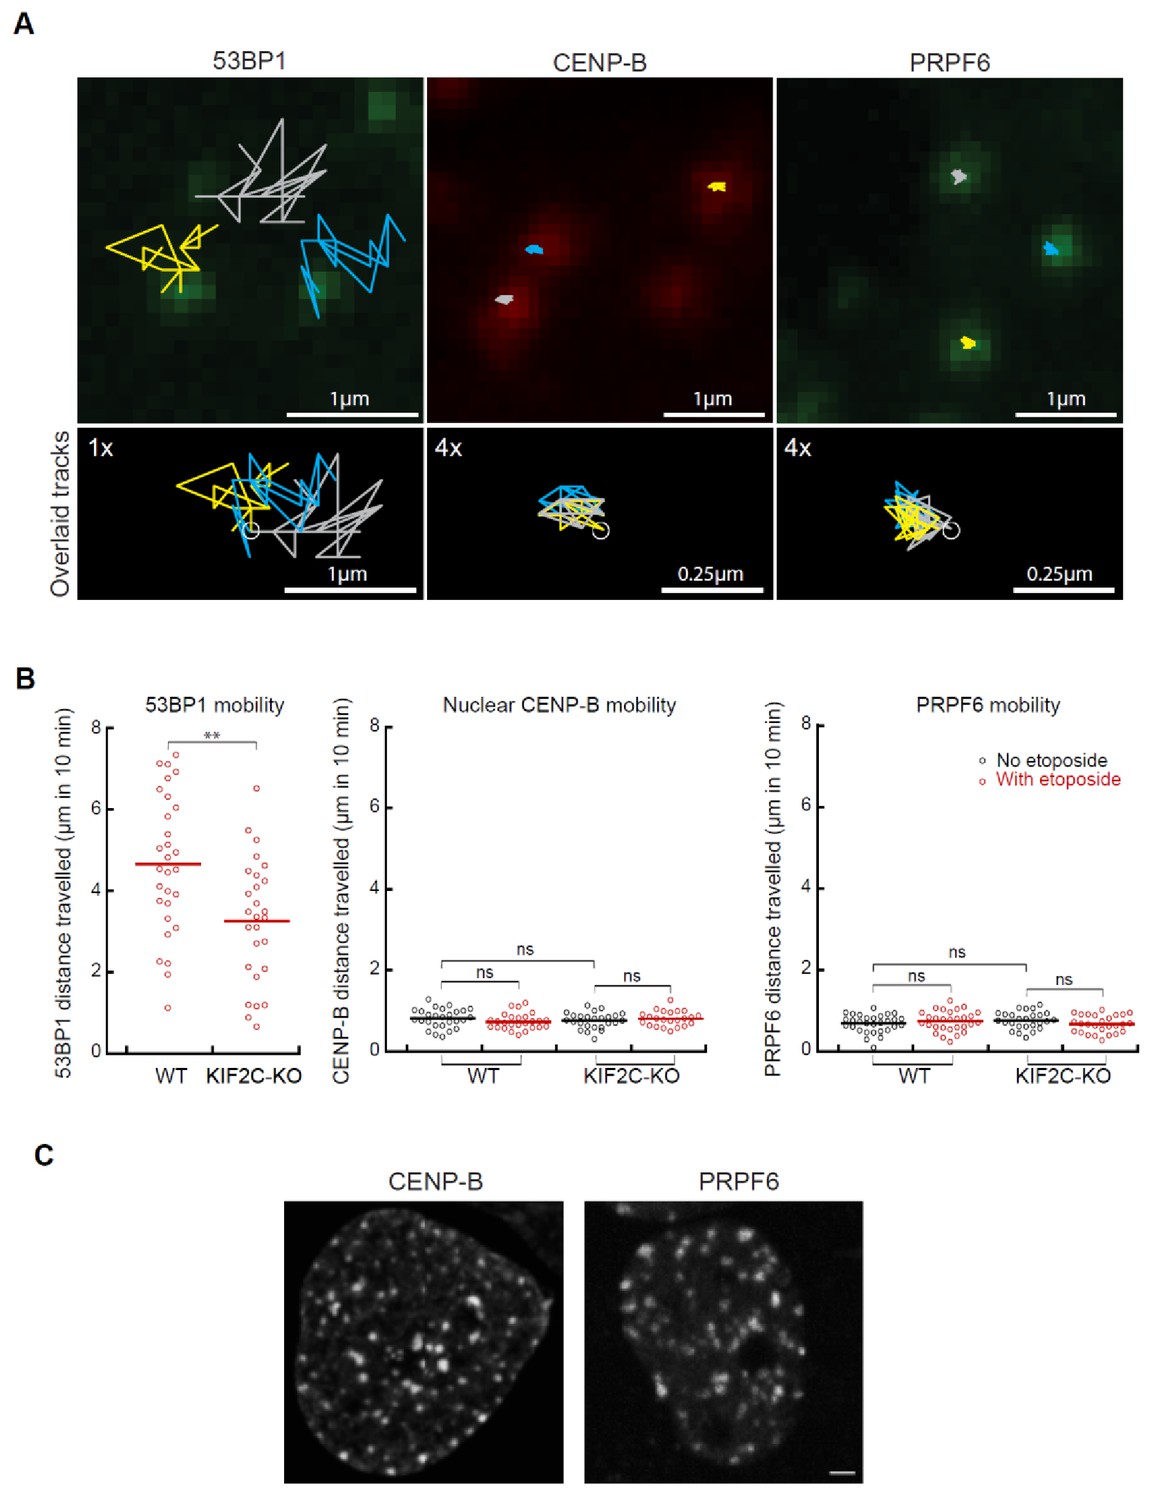
Kif2C depletion did not influence the general nuclear dynamics.
(A) Representative examples of 10 min mobility traces of EGFP-53BP1, mCherry-CENP-B and EGFP-PRPF6 in U2OS cells. The tracked traces were overlaid over the corresponding images (upper panel). The lower panel shows the same traces aligned with a common starting point (indicated by circles). Note that the randomness of 53BP1 traces and the coordinated movement of the CENP-B and PRPF6 foci, representing general nuclear dynamics. (B) Quantification of the distance travelled by EGFP-53BP1, mCherry-CENP-B and EGFP-PRPF6 foci over 10 min in WT-U2OS and KIF2C-KO-U2OS cells. 53BP1 mobility was tracked 5 min after etoposide treatment, while the mobility of nuclear CENP-B and PRPF6 was tracked either with or without the addition of etoposide. (C) Examples of the intra-nuclear foci localization of CENP-B and PRPF6.
Figure 5—figure supplement 3
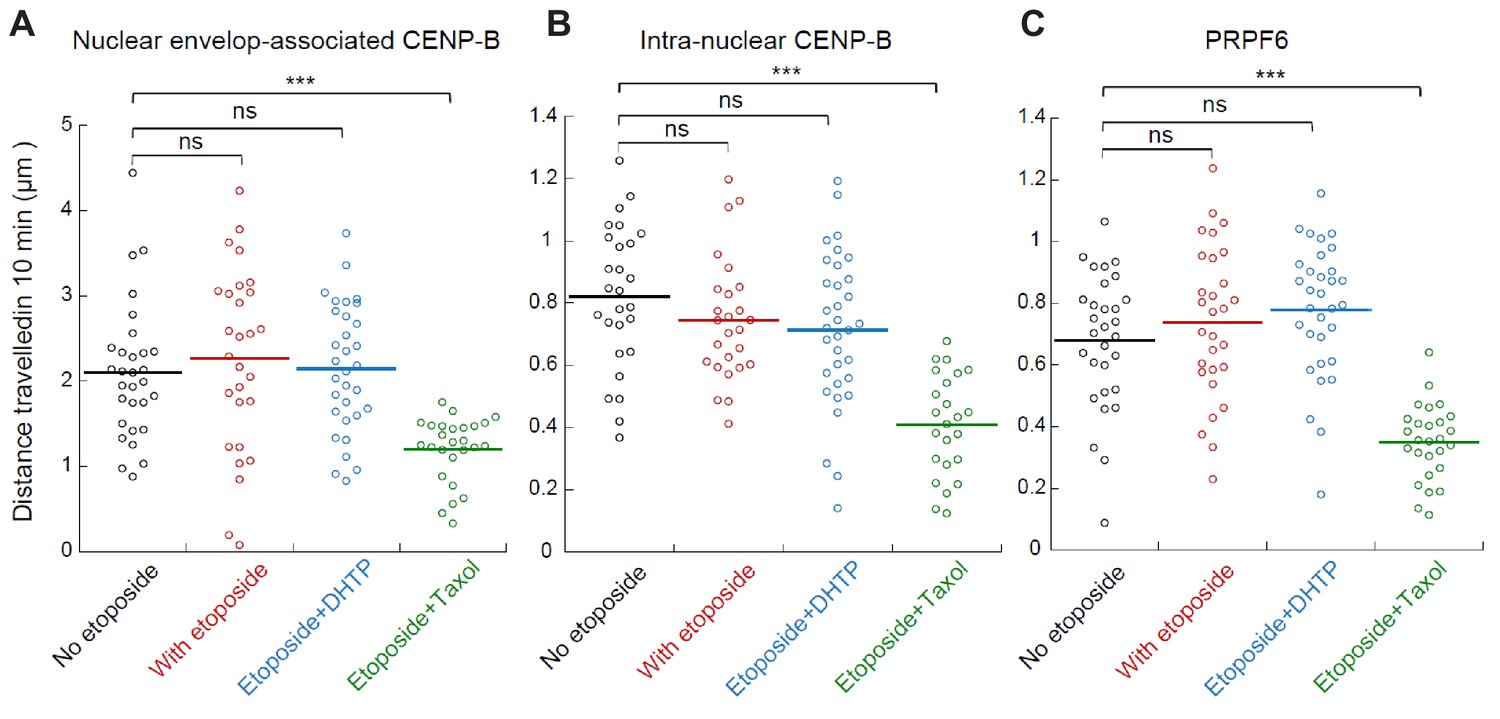
Taxol, but not DHTP, reduced the general mobility of CENP-B and PRPF6.
Quantification of the distance travelled by nuclear envelop-associated mCherry-CENP-B foci (A), intra-nuclear mCherry-CENP-B foci (B), or intra-nuclear PRPF6 foci (C) over 10 min in U2OS cells without or with etoposide treatment, in the presence or absence of DHTP (20 μM) or taxol (5 μM).
Figure 6 with 1 supplement
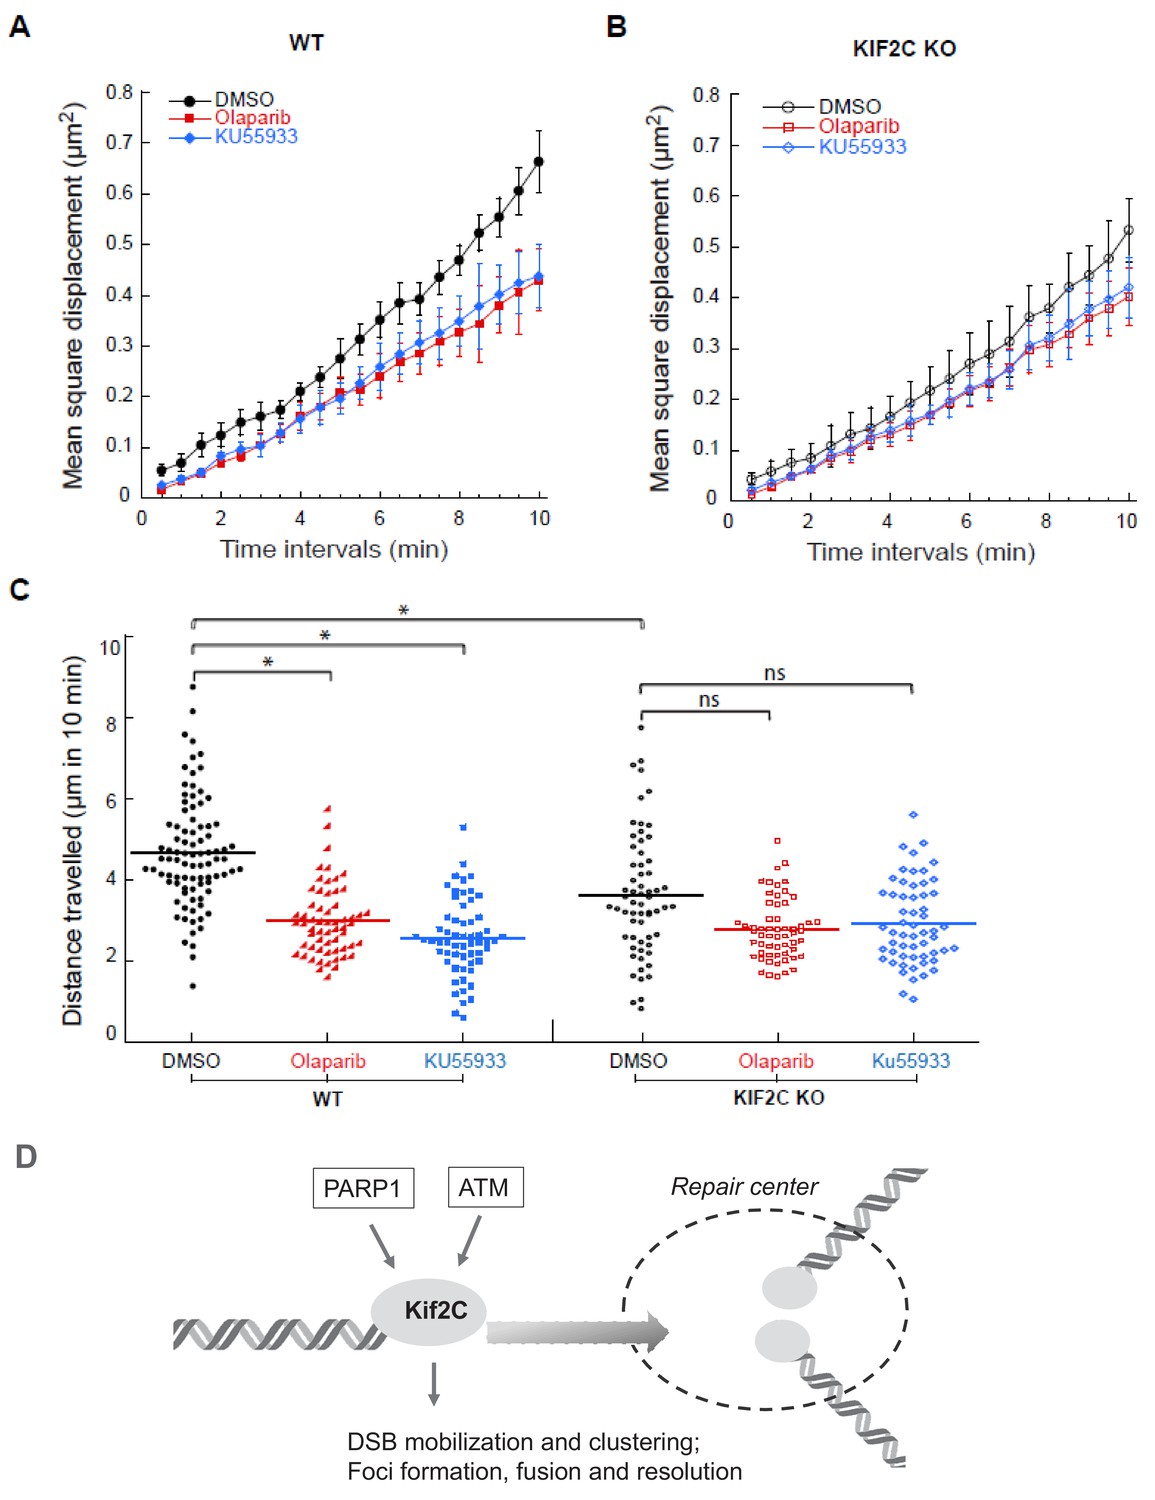
ATM and PARP inhibition impairs Kif2C-dependent foci mobility.
(A–B) Mean-square displacement measurements of EGFP-53BP1 foci in WT (A) and Kif2C KO (B) U2OS cells treated with the vehicle control (DMSO), the PARP1 inhibitor olaparib (10 μM), or the ATM inhibitor KU55933 (20 μM), as indicated. More than 50 foci were analyzed in three independent experiments. (C) Quantification of the distance travelled by EGFP-53BP1 foci over 10 min in the corresponding cells described in A-B. Experimental set up and image acquisition were the same as described in Figure 5. (D) Kif2C mediates DSB end mobilization and the formation of DNA damage foci (model). Kif2C is recruited to DSB ends in a manner that depends on both ATM and PARP activities. Mediated by its MT depolymerase activity, Kif2C promotes the movement, and the subsequent clustering, of DSB ends. Therefore, Kif2C is an important downstream factor of the PARP and ATM-mediated DNA damage response that governs the mobility and dynamics of DSB ends.
Figure 6—figure supplement 1
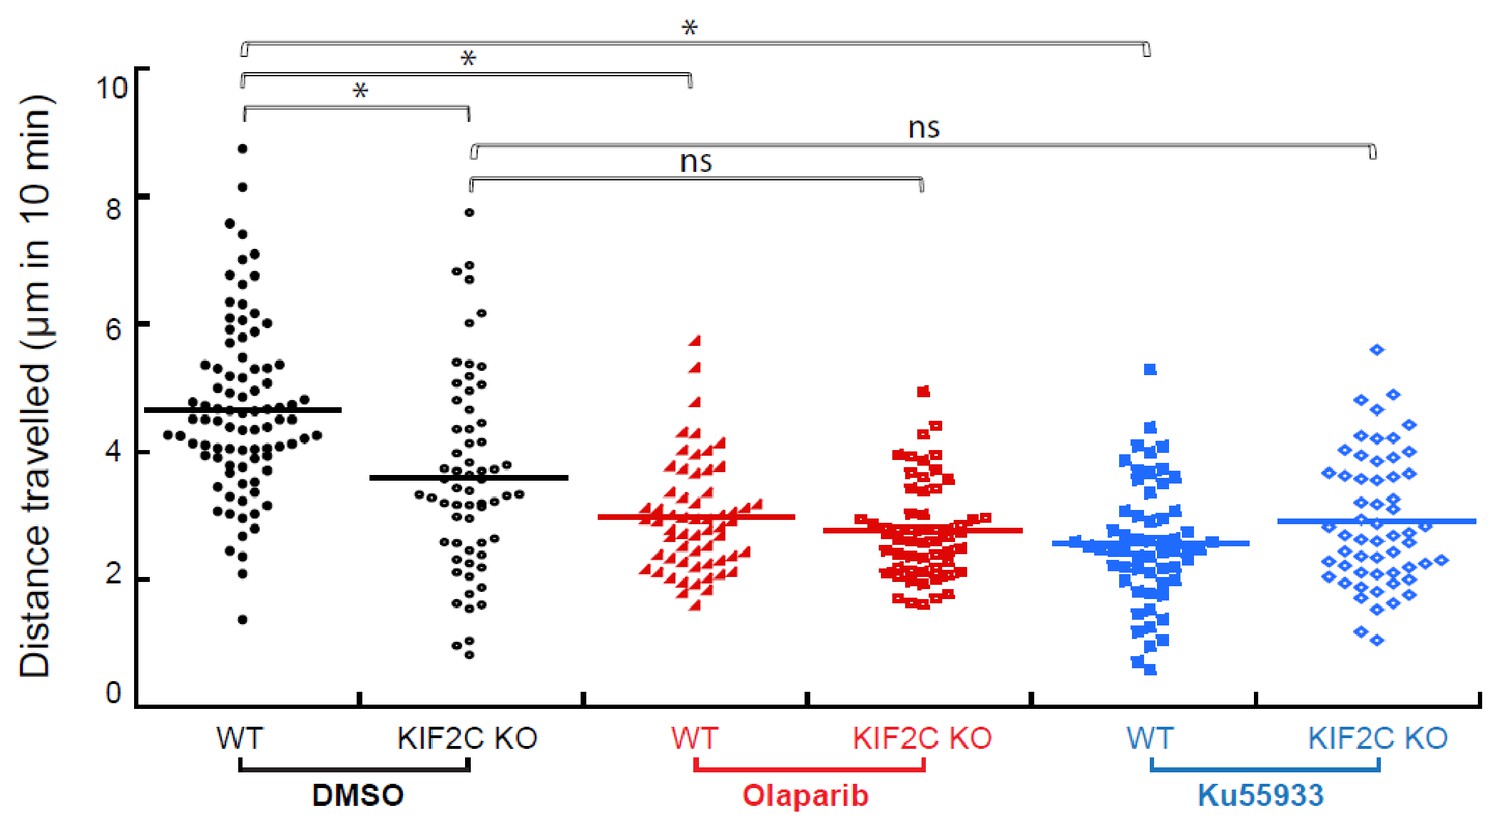
ATM and PARP inhibition impairs Kif2C-dependent foci mobility.
As shown in Figure 6A and B, Mean-square displacement measurements of EGFP-53BP1 foci were measured in WT and Kif2C KO U2OS cells treated with the vehicle control (DMSO), the PARP1 inhibitor Olaparib (10 μM), or the ATM inhibitor KU55933 (20 μM). Quantification of the distance travelled by EGFP-53BP1 foci over 10 min in the corresponding cells, as in Figure 6, is presented here in three groups (DMSO, Olaparib, and Ku55933).
Author response image 1

Mean ssquare displacement analysis of EGFP-53BP1 monility over 10 minutes in WT-U2OS cells DMSO control and in the presence of 5 μM or 10 μM taxol.
Videos
Video 1
Kif2C is recruited to DNA damage sites.
Video 2
Kif2C foci co-localize and co-migrate with 53BP1 foci.
Video 3
An example of foci fusion.
Video 4
An example of foci resolution.
Additional files
Download links
A two-part list of links to download the article, or parts of the article, in various formats.
Downloads (link to download the article as PDF)
Open citations (links to open the citations from this article in various online reference manager services)
Cite this article (links to download the citations from this article in formats compatible with various reference manager tools)
Kinesin Kif2C in regulation of DNA double strand break dynamics and repair
eLife 9:e53402.
https://doi.org/10.7554/eLife.53402


