Zebrafish macrophage developmental arrest underlies depletion of microglia and reveals Csf1r-independent metaphocytes
- Department of Clinical Genetics, Erasmus University Medical Center Rotterdam, Netherlands
- Institut de Recherche Interdisciplinaire en Biologie Humaine et Moléculaire (IRIBHM), Université Libre de Bruxelles (ULB), Belgium
- Laboratory of Cell Differentiation, Institute of Molecular Genetics of the Czech Academy of Sciences, Czech Republic
- Department of Hematology, Erasmus University Medical Center, Netherlands
- WELBIO, ULB, Belgium
Figures
Figure 1 with 1 supplement
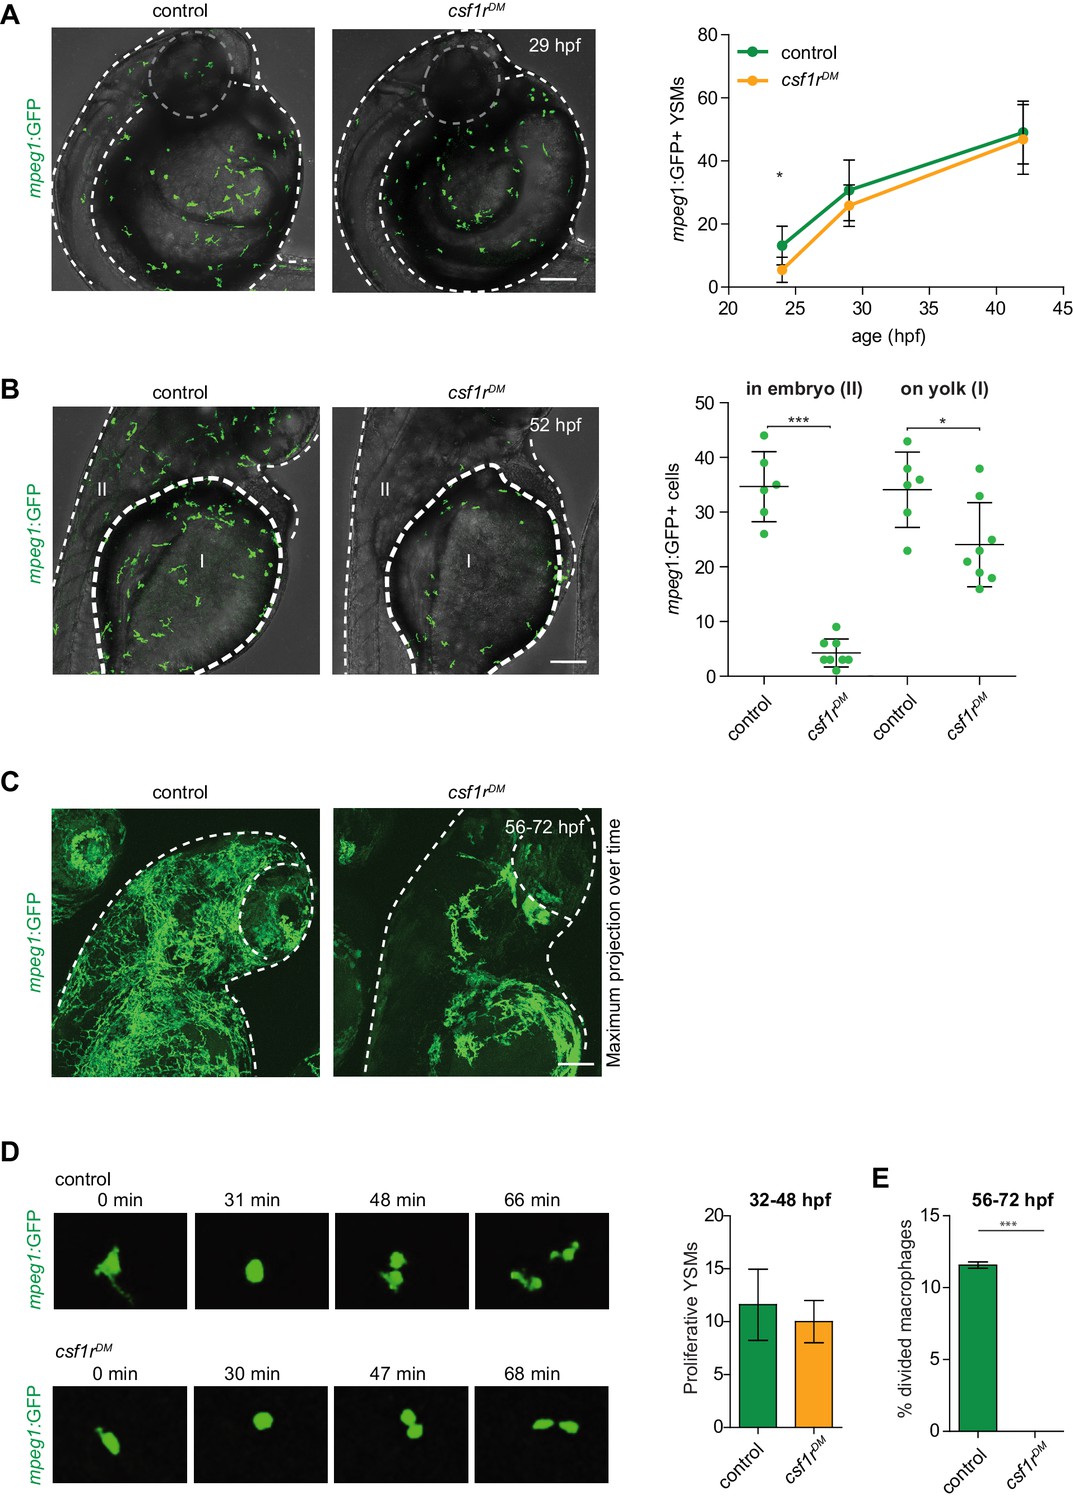
mpeg1+ primitive macrophages on the yolk in control and csf1rDM larvae.
(A) Representative images of mpeg1+ macrophages located on the yolk (29 hpf) and quantification of mpeg1+ cell numbers over time. (B) Representative images of mpeg1+ positive primitive macrophages at 52 hpf. The dotted line indicates the border between the yolk (I) and the embryonic tissue (II). Quantification of mpeg1+ macrophages that colonized the tissue (II) and primitive macrophages located on the yolk (I). (C) Representative maximum projection of long term time lapse imaging of control and csf1rDM larvae showing migratory trajectories of mpeg1+ macrophages. (D) Snap shots from dividing mpeg1+ primitive macrophages in control and csf1rDM larvae (~36 hpf) and quantification of proliferative primitive macrophages during 16 hr time lapse imaging (~32 hpf – 48 hpf) (control n = 5, csf1rDM n = 3). (E) Quantification of fraction proliferative embryonic macrophages during 16 hr time lapse imaging (~56 hpf – 72 hpf) in control and csf1rDM larvae (n = 3 per group). Scale bars represent 100 µM. Error bars represent standard deviation. Statistical significance is calculated using one-way ANOVA with Dunnett’s multiple comparison test or Student’s t-tests *<0.05 **<0.01 ***<0.001. mpeg1+ cells were quantified on one side of the embryo (right side). Each dot represents one fish.
Figure 1—figure supplement 1
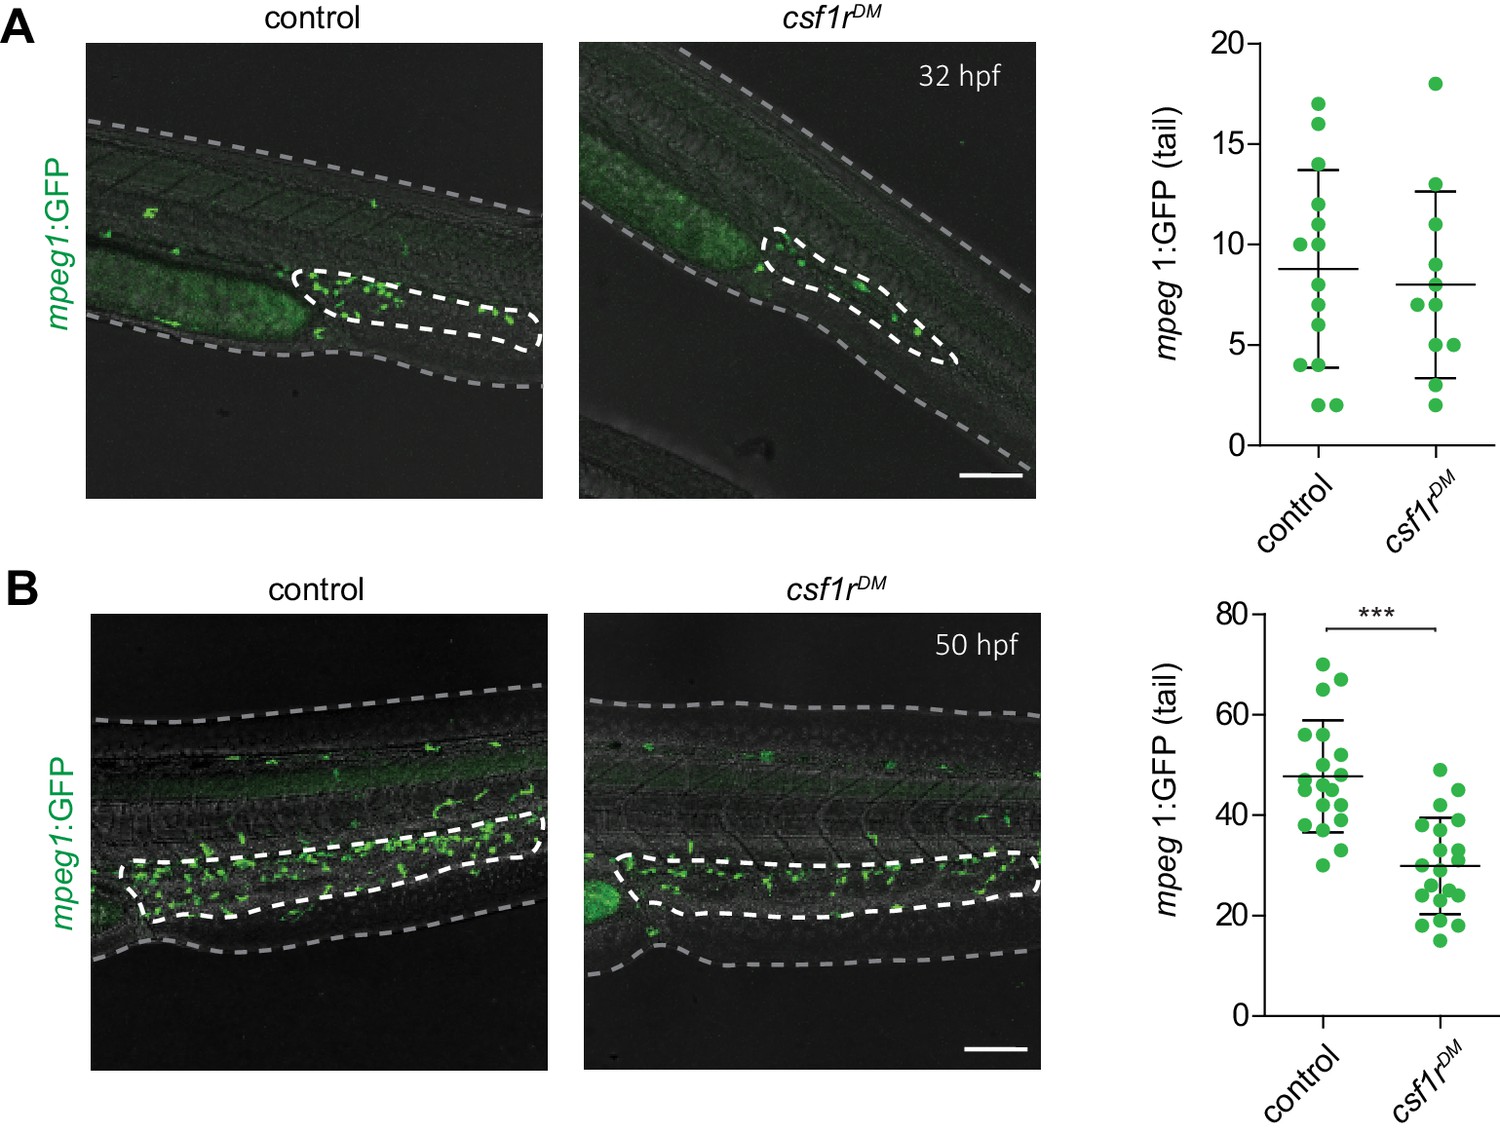
Mpeg1+ cells can be detected in the tail region of control and csf1rDM larvae.
(A) Representative images of mpeg1+ myeloid progenitors located in the tail region at 32 hpf and quantification. (B) Representative images of mpeg1+ myeloid progenitors located in the tail region at 50 hpf and quantification. Scale bars represent 100 µm. Error bars represent standard deviation. Statistical significance is calculated using Student’s t-tests ***<0001. Mpeg1+ cells were quantified on one side of the embryo (right side). Each dot represents one fish.
Figure 2 with 1 supplement
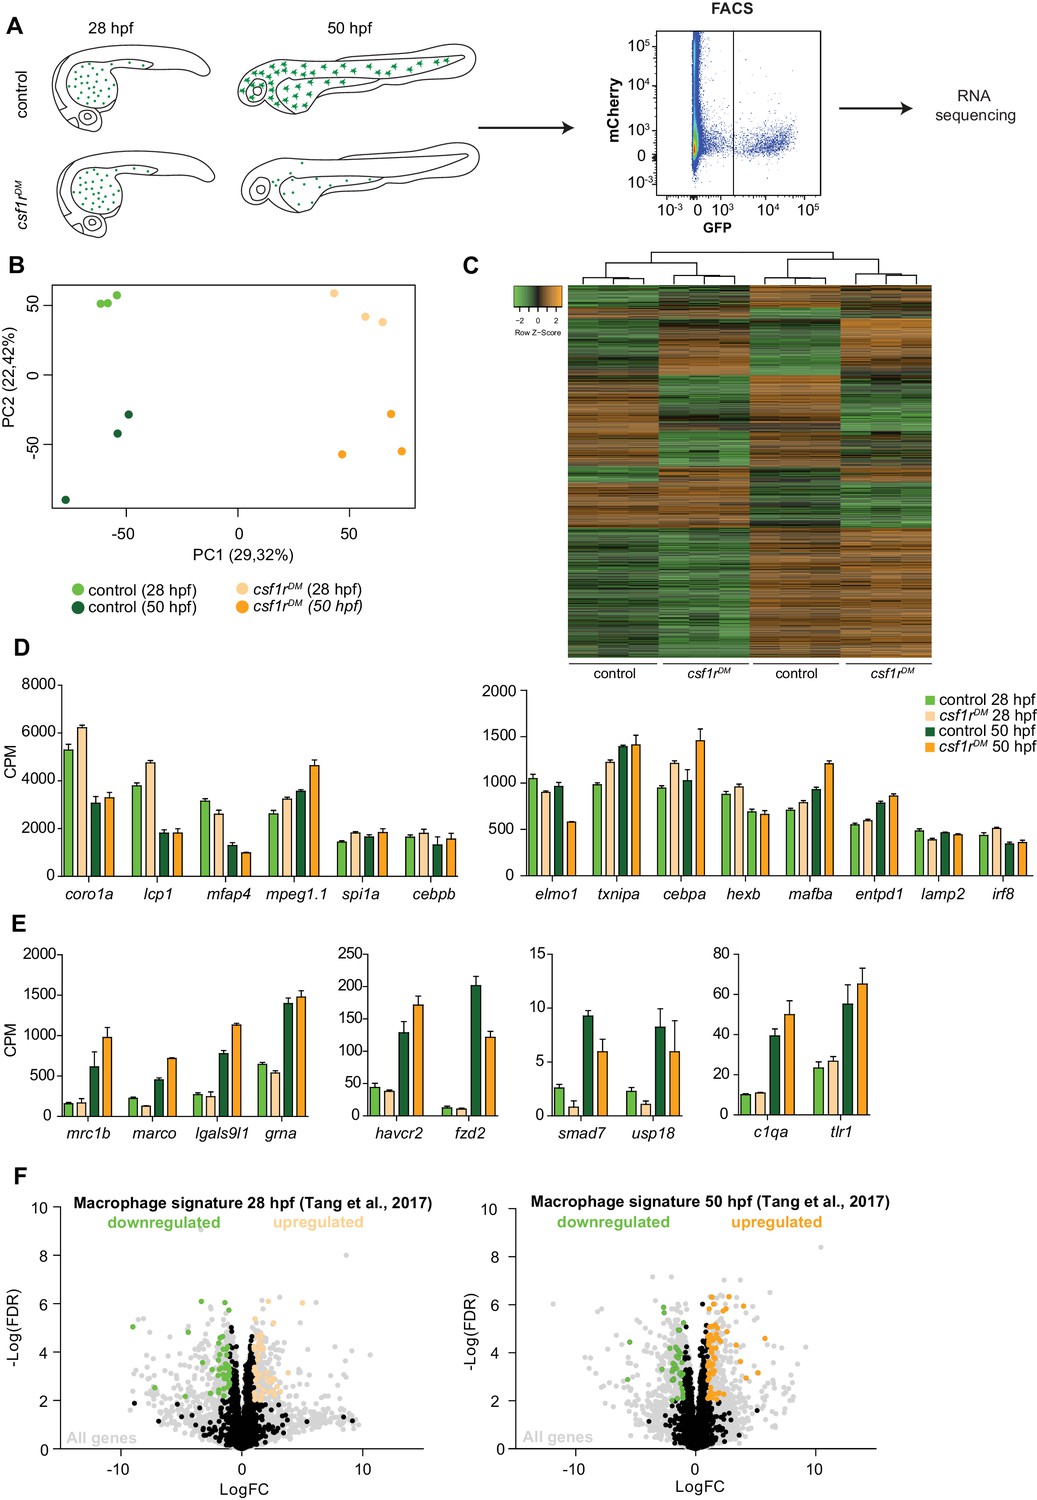
RNA sequencing of primitive macrophages at different developmental stages reveals cell cycle arrest in csf1rDM macrophages from 2 dpf onward.
(A) Schematic representation of the experimental set-up. mpeg1+ cells were isolated from both control and csf1rDM larvae at 28 hpf and 50 hpf using FACS. These cells were used for RNA sequencing. (B) PCA analysis shows clustering of triplicates and segregation on genotype (component 1) and developmental stage (component 2). (C) Heat map showing all significantly differentially expressed genes (logFC > |1|; FDR < 0.01). (D) Counts per million (CPM) of ‘macrophage signature’ genes show high, non-differential expression in all groups (logFC > |1|; FDR > 0.01). (E) CPM values of ‘macrophage signature’ genes induced over time in control and csf1rDM macrophages (logFC > |1|; FDR < 0.01). (F) Volcano plot showing genes expression changes between control and csf1rDM at 28 hpf and 50 hpf respectively. Light grey: all reads, Black/Green/Orange: Macrophage/myeloid signature genes based on data from Tang et al. (2017) (Tang et al., 2017); Black: non-differentially expressed between controls and csf1rDM macrophages; Green: significantly upregulated in control macrophages; Orange: significantly upregulated in csf1rDM macrophages (logFC > |1|; FDR < 0.01). 4% and 5% of the macrophage genes were significantly differentially expressed between control and csf1rDM macrophages at 28 and 50 hpf respectively.
Figure 2—figure supplement 1
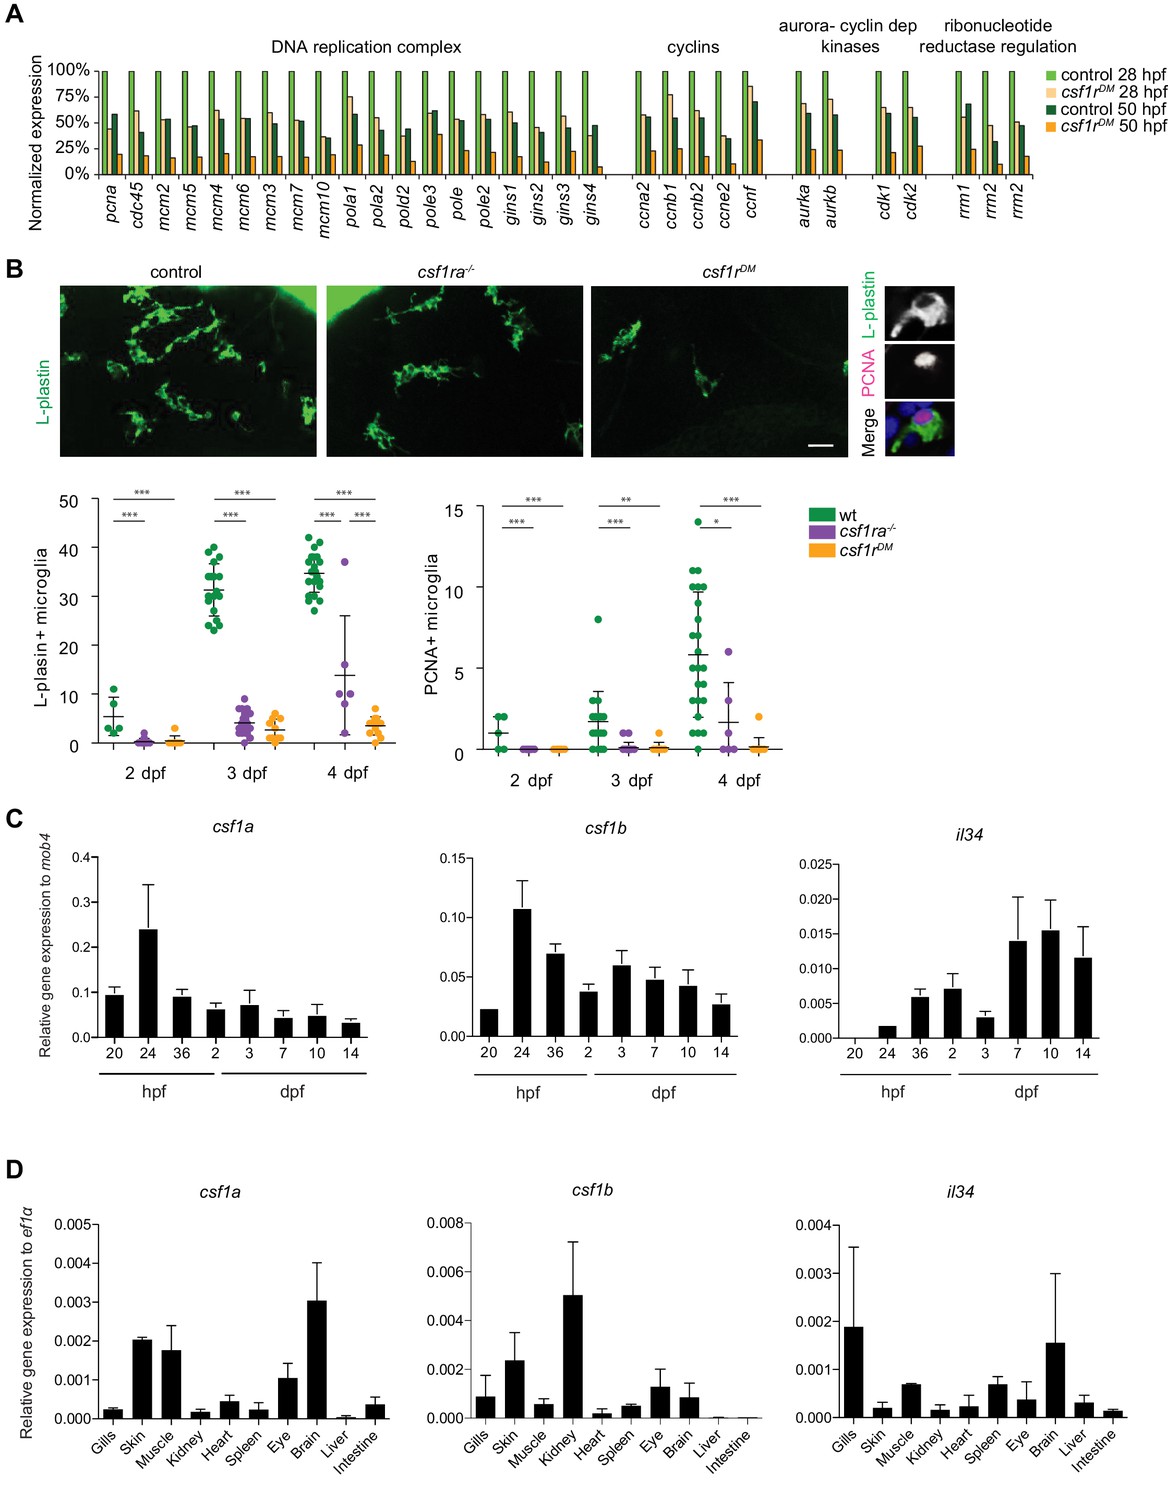
csf1rDM macrophages and microglia have a proliferation defect.
(A) Normalized CPM values of genes involved in DNA replication/cell cycle. (B) Representative images of L-plastin immunohistochemistry of microglia in different csf1rDM larvae at 4 dpf in the midbrain. Scale bar represents 20 µM. Quantification of L-plastin+ microglia in control and different csf1r mutants at 2, 3 and 4 dpf and quantification Pcna+/L-plastin double positive microglia at 2, 3 and 4 dpf. (C) qPCR analysis on 10–15 whole embryos/larvae per group at different developmental timepoints, the number of replicates are depicted in Table 2. (D) qPCR analysis on different organs isolated from adult zebrafish (3–5 organs/sample), the number of replicates are depicted in Table 2. Statistical significance is calculated using one-way ANOVA with Dunnett’s multiple comparison test *<0,05 **<0,01 ***<0001. Each dot represents one fish.
Figure 3
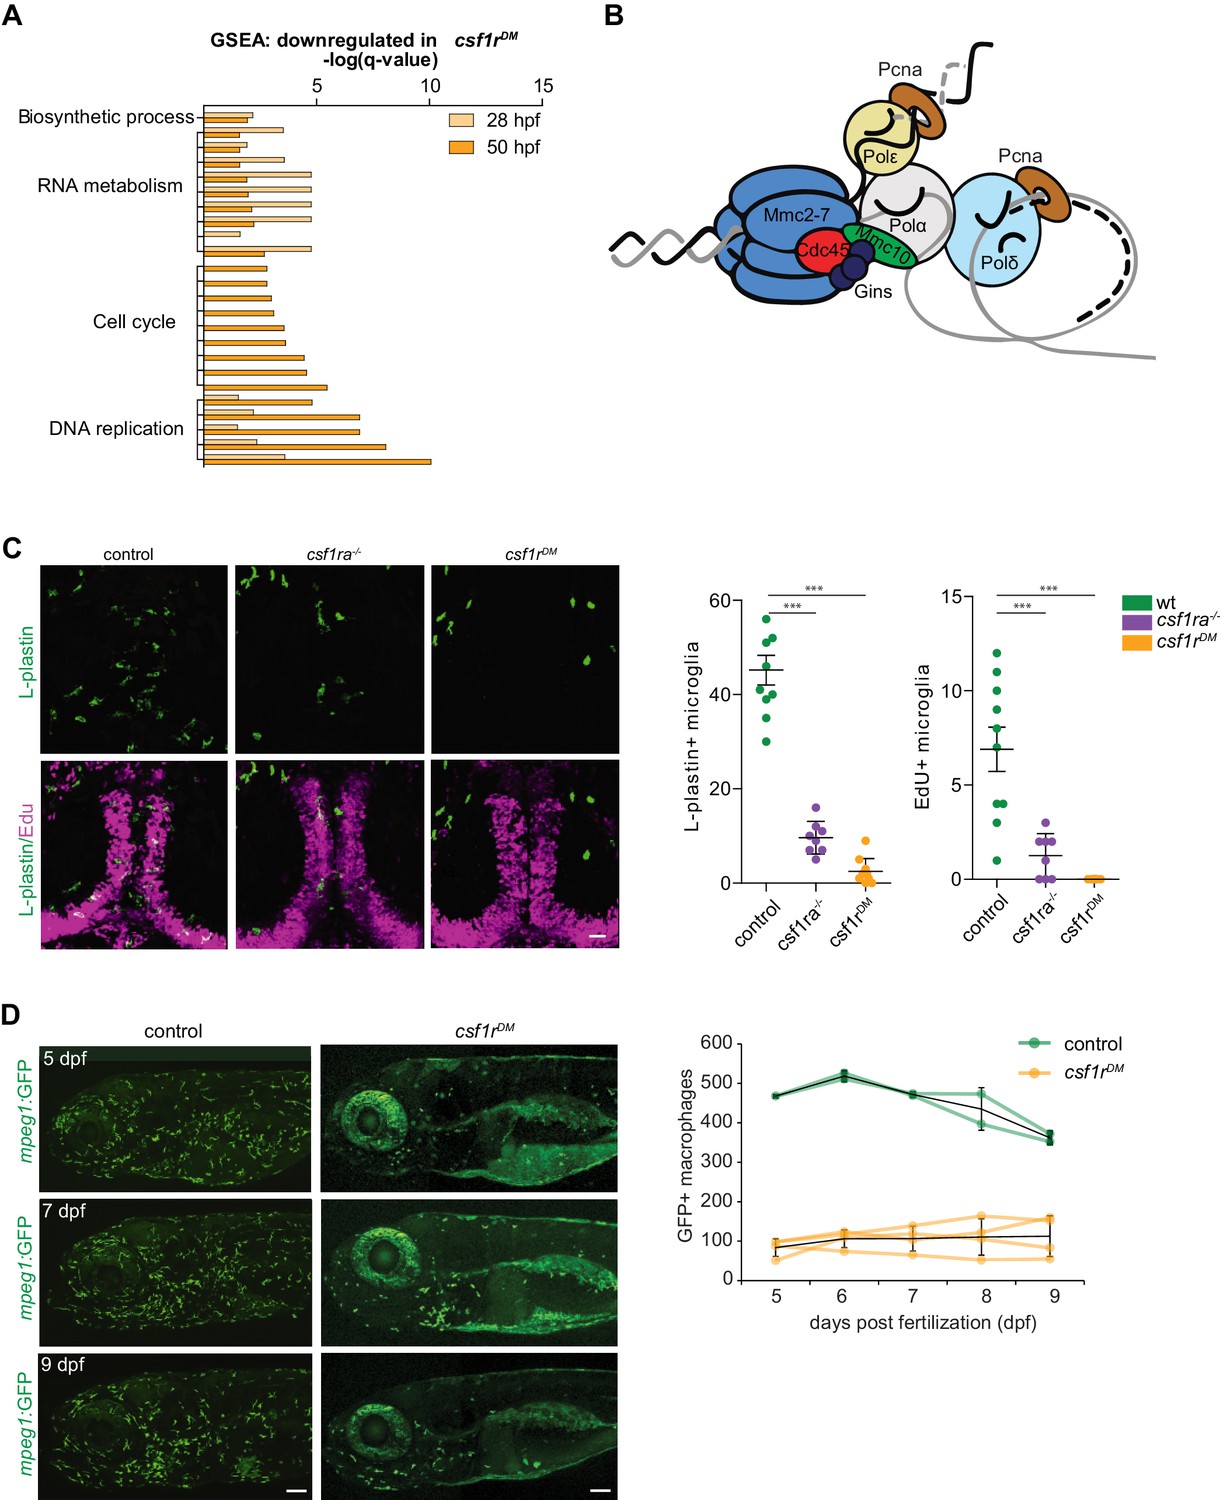
Csf1r-deficient tissue resident macrophages (microglia) fail to proliferate.
(A) Bar graph showing the GO terms associated with enriched genes downregulated in csf1rDM macrophages (p<0,05). (B) Cartoon representing the vertebrate DNA replication complex, all components were significantly downregulated in csf1rDM macrophages. (C) Representative images and quantification of L-plastin/Edu double positive microglia at 5 dpf. Scale bar represents 25 µM. (D) Representative images, and quantification, of mpeg1+ macrophages in the anterior part of 5, 7 and 9 day old zebrafish and quantification of total number of macrophages at the imaged half of the total embryo. Mpeg1+ cells were quantified on one side of the embryo (right side). Error bars represent standard deviation. Statistical significance is calculated using one-way ANOVA with Dunnett’s multiple comparison test *<0,05 **<0,01 ***<0001. Each dot represents one fish.
Figure 4 with 1 supplement
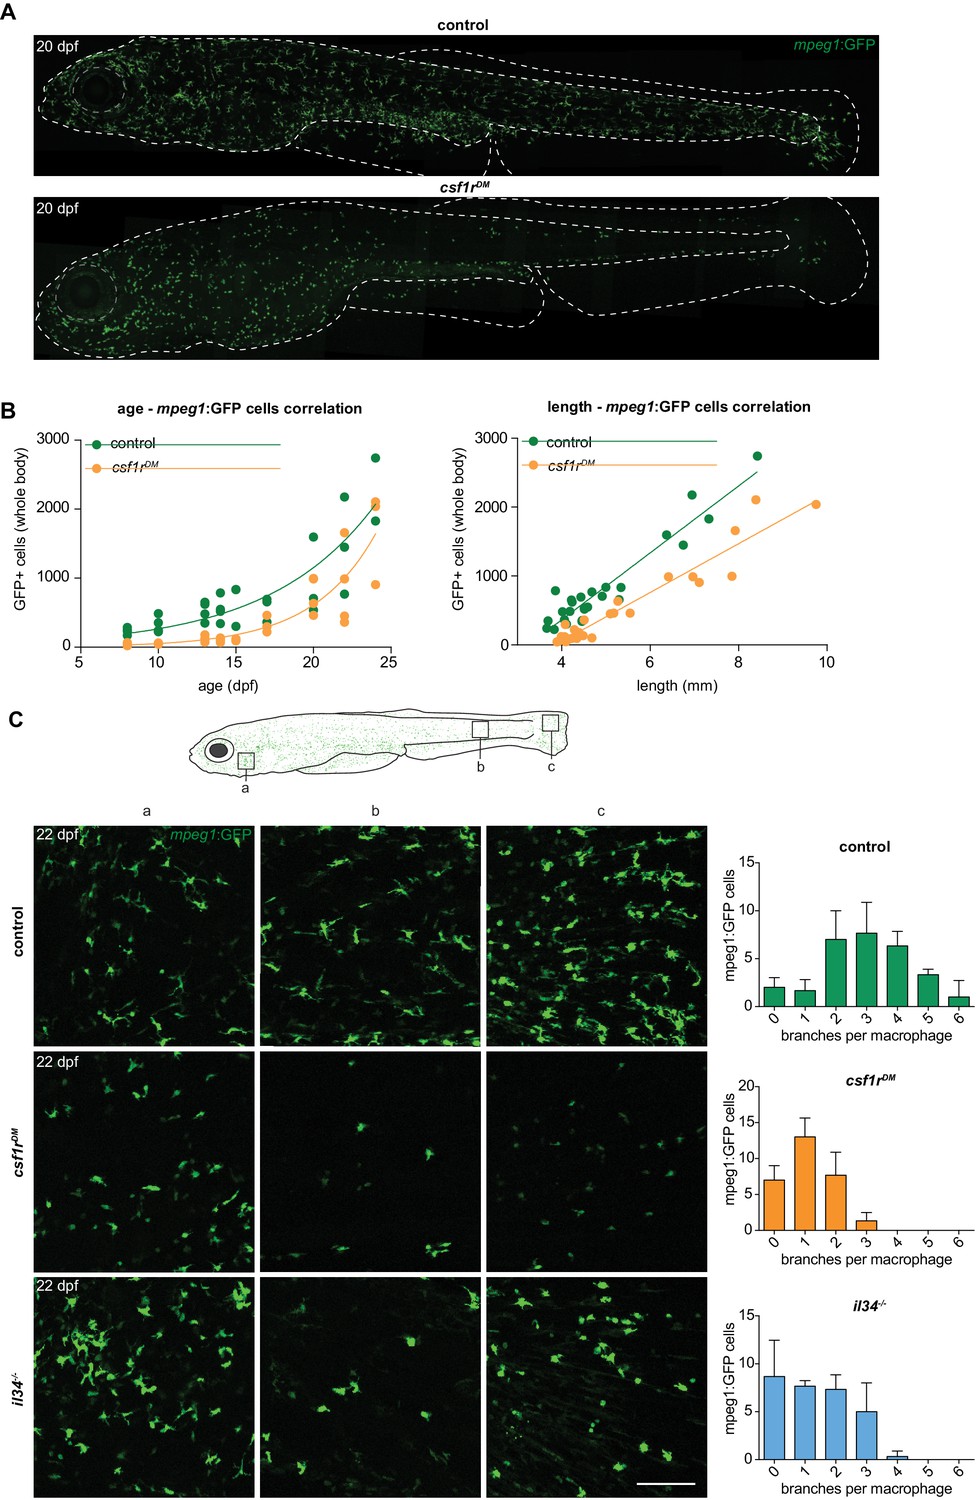
Two morphologically distinct populations of mpeg1+ cells in emerge from 15 dpf in the zebrafish skin.
(A) Representative images of a control and csf1rDM zebrafish at 20 dpf. Dotted line represents the outline of the fish and its eye. (B) Quantification of the total number of mpeg1+ cells at one unilateral side of the fish at different time points between 8 and 24 dpf. The number of mpeg1+ cells was manually counted from the unilateral side presented in panel A. Plot showing the relationship between number of mpeg1+ cells and fish size. Each dot represents one fish. (C) Representative images of mpeg1+ cells in different body regions at 22 dpf showing differences in morphology between controls and csf1rDM or il34-/-mpeg1+ cells (n = 3 per group). Error bars represent standard deviation. Mpeg1+ cells were quantified on one side of the embryo (right side).
Figure 4—figure supplement 1
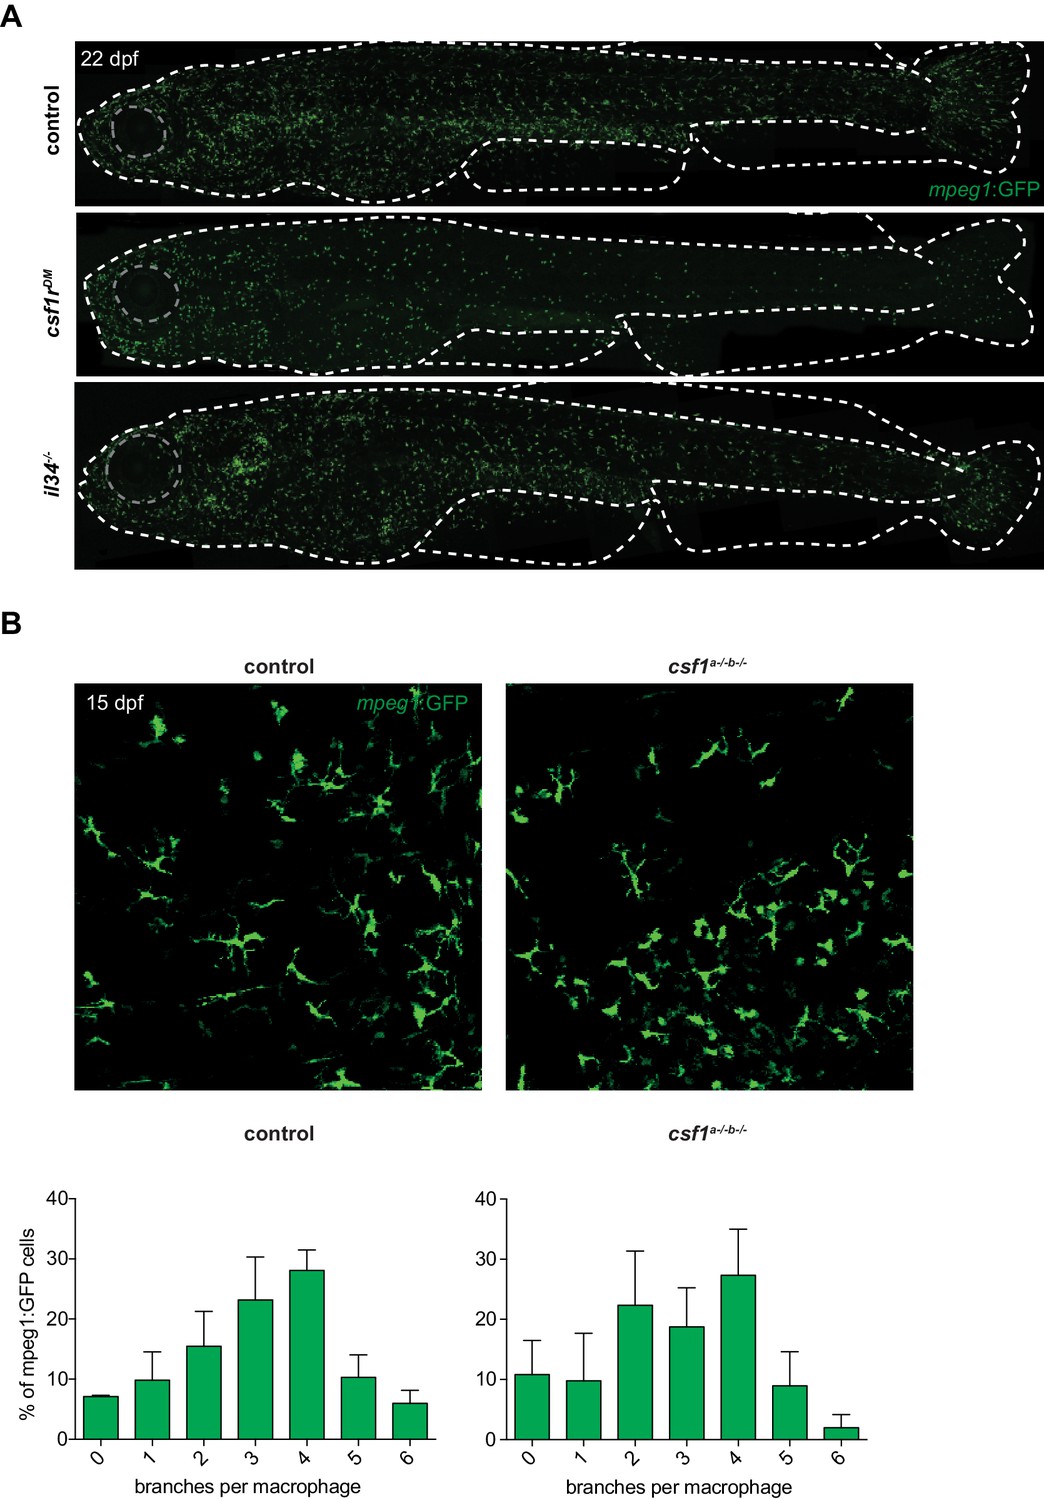
Abnormal morphology of csf1rDM and il34-/-, but not csf1a-/-b-/- larval mpeg1+ cells in the skin.
(A) Representative images of a control, csf1rDM and il34-/- fish at 22 dpf. Dotted line represents the outline of the fish and its eye. (B) Representative images of mpeg1+ cells in the skin of csf1a-/-b-/- showing no differences in morphology between control and csf1a-/-b-/-mpeg1+ cells at 15 dpf (n = 3 per group). Error bars represent standard deviation.
Figure 5 with 2 supplements
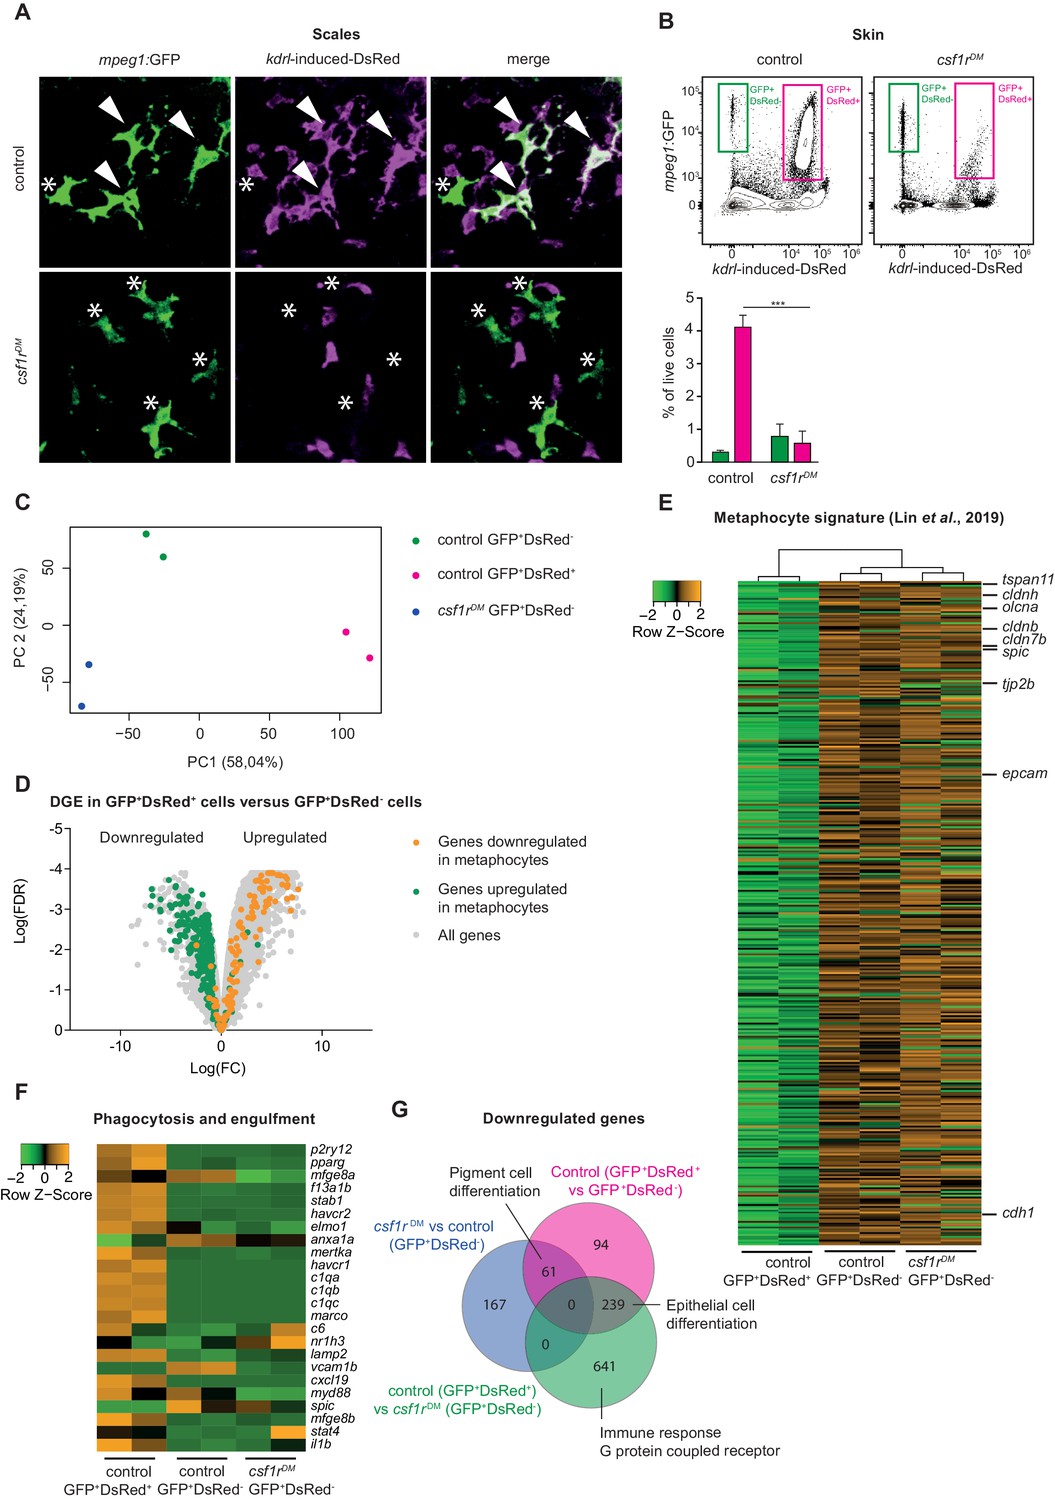
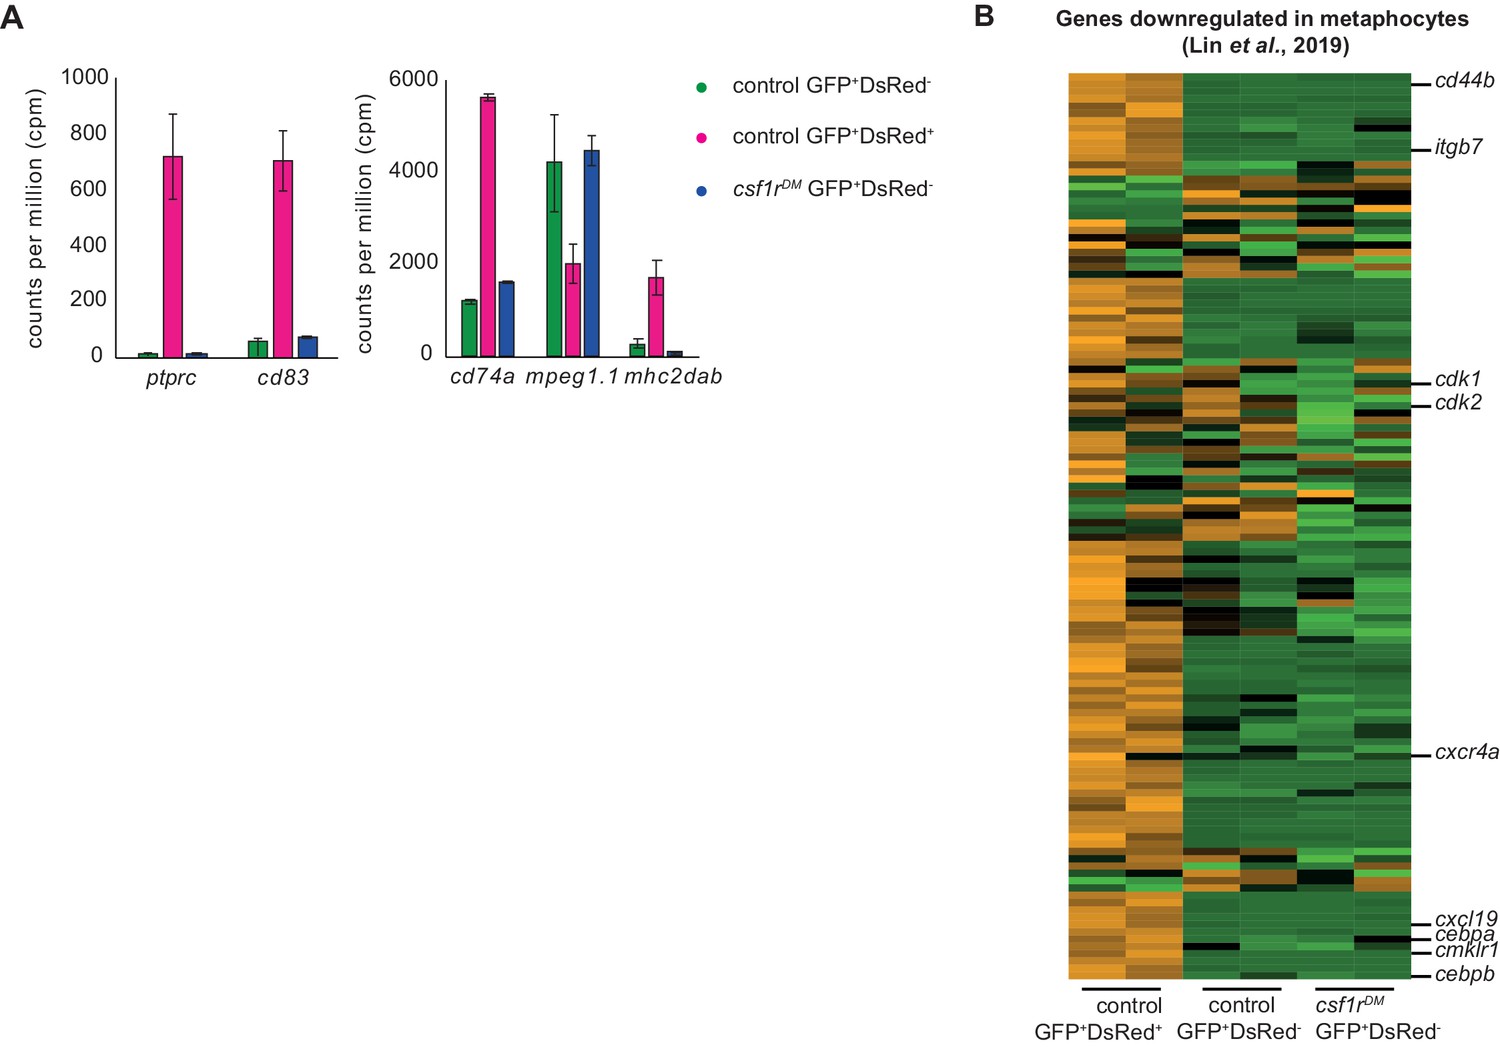
Amoeboid mpeg1+ cells in the zebrafish skin are of non-hematopoietic origin and have a metaphocyte transcriptome.
(A) Immunofluorescence on manually dissected scales from adult skin of control and csf1rDM mpeg1:EGFP +; kdrl-induced-DsRed+ adults (4 mpf). Stars: single-positive (SP) cells; white arrowheads: double-positive (DP) cells. (B) FACS analysis on cells from the adult skin (4 mpf, n = 3 per group) and quantification. GFP+DsRed-=mpeg1+ only, GFP+DsRed+=mpeg1+/kdrl-induced-DsRed+. (C) PCA analysis showing segregatin based on cell type (PC1) and genotype (PC2). (D) Volcano plot showing gene expression changes between control GFP+DsRed+ versus GFP+DsRed- cells. Light grey: DGE of all genes, Green: DGE of genes enriched in metaphocytes logFC >2 (Lin et al., 2019); Orange: DGE of genes downregulated in metaphocytes logFC <2 (Lin et al., 2019). (E) Heat map showing the expression of metaphocyte signature genes. (F) Heat map showing the expression of phagocytosis and engulfment genes. (G) Venn diagram showing DGE between the three groups (logFC > |2|; FDR < 0.05).
Figure 5—figure supplement 1

Gating strategy for isolating mpeg1+ cells from juveniles.
(A) FACS sorting strategy showing one representative example for each genotype. (B) Quantification of the length of the fish and the percentage mpeg1+ cells out of live cells ***<0001. Each dot represents one fish.
Figure 5—figure supplement 2
Expression profiles of non-hematopoietic and hematopoietic mpeg1+ cells of control and csf1rDM juvenile zebrafish.
(A) Graphs showing counts per million (cpm) values for various genes enriched in macrophages. (B) Heat map showing the expression of genes downregulated in metaphocytes compared to neutrophils and LCs (LogFC <2, Lin et al., 2019).
Figure 6

RNA sequencing of juvenile mpeg1+ cells and FACS analysis of brain, liver and gut, shows systemic depletion of macrophages in csf1rDM zebrafish.
(A) Schematic representation of the RNA sequencing strategy. (B) PCA analysis shows clustering of triplicates and segregation on genotype (control/il34-/- vs. csf1rDM). (C) Heat map showing the expression of metaphocyte signature genes in control, il34-/- and csf1rDM mpeg1+ cells. (D) Volcano plot showing gene expression changes between control and csf1rDM at 1.5 mpf. Light grey: DGE of all geness, Green: DGE of some phagocytosis genes downregulated in csf1rDM mpeg1+ cells; Orange: DGE of genes enriched in metaphocytes (Lin et al., 2019). (E) Heat map showing phagocytosis and engulfment genes. (F–H) FACS analysis on cells from the adult (4 mpf) brain (F), liver (G) and gut (H) and quantifications. GFP+DsRed-=mpeg1+ only, GFP+DsRed+=mpeg1+/kdrl-induced-DsRed+.
Figure 7
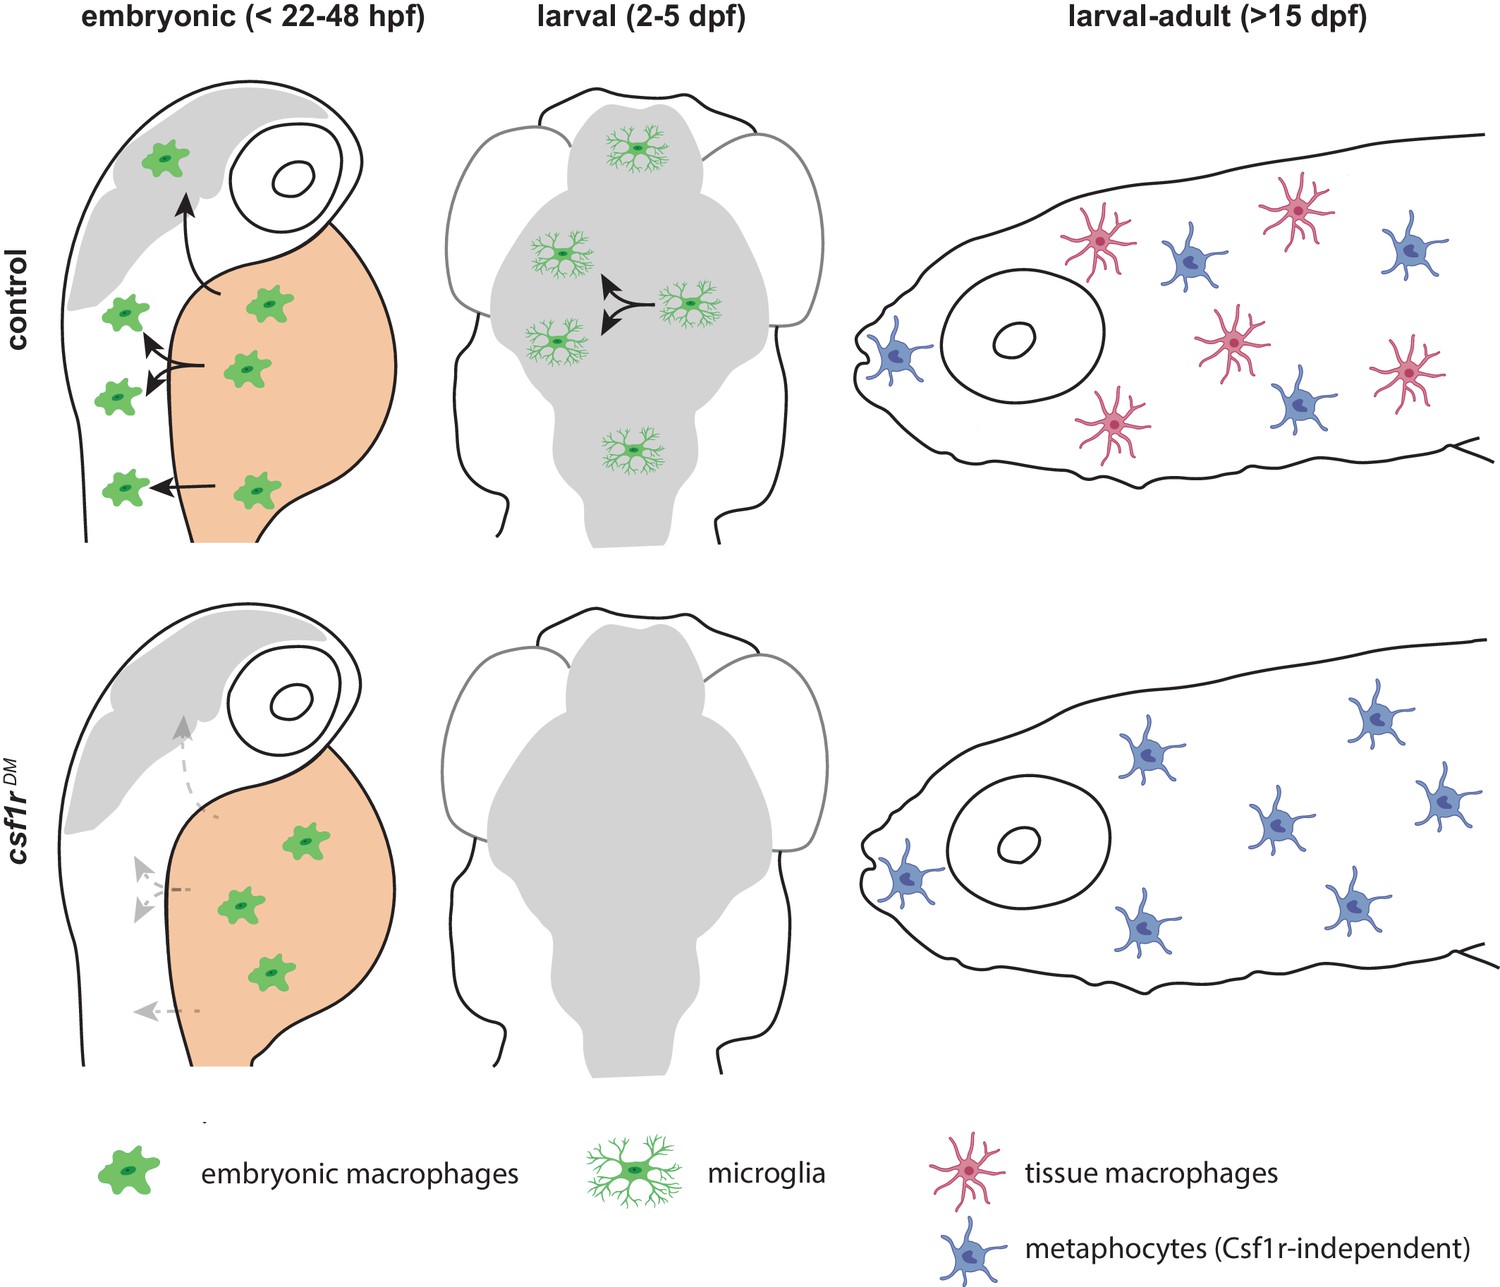
Schematic presentation of macrophage development in control and csf1r-deficient zebrafish.
Upper panels indicate development of macrophages, microglia and definitive macrophages and metaphocytes: embryonic macrophages (left), microglia in larval brain (middle) and macrophages and metaphocytes in larva >15 dpf. Lower panels indicate abnormalities found in macrophage development in csf1r-deficient zebrafish: embryonic macrophages fail to migrate across the embryo (left), fewer macrophages arrive in the brain, and fail to divide (middle), metaphocytes develop normally whereas macrophages are depleted from larval to adult stages.
Author response image 1
Videos
Video 1
Time-lapse recording of primitive macrophages on the yolk from 32 to 48 hpf showing frequent proliferative events in both control and csf1rDM embryos.
Video 2
Time-lapse recording from 56 to 72 hpf, showing the colonization of the embryo by macrophages in control and the migration defect observed in csf1rDM embryos.
Video 3
3 hr time-lapse recordings of macrophages in the skin showing branched, mesenchymal macrophages and non-branched, amoeboid metaphocytes in control fish and only non-branched, amoeboid metaphocytes in csf1rDM fish.
Tables
Key resources table
| Reagent type (species) or resource | Designation | Source or reference | Identifiers | Additional information |
|---|---|---|---|---|
| Gene (Danio rerio) | Tg(mpeg1:EGFP)gl22 | Ellett et al., 2011 | gl22Tg RRID:ZFIN_ZDB-ALT-120117-1 | Transgenic |
| Gene (Danio rerio) | il34re03/re03 | Kuil et al., 2019 | re03 RRID:ZFIN_ZDB-ALT-190814-11 | Mutant |
| Gene (Danio rerio) | csf1rbre01/re01 | Oosterhof et al., 2018 | re01 RRID:ZFIN_ZDB-ALT-180807-1 | Mutant |
| Gene (Danio rerio) | csf1rbsa1503/sa1503 | ZIRC, This paper | sa1503 RRID:ZFIN_ZDB-ALT-120411-187 | Mutant |
| Gene (Danio rerio) | csf1raj4e1/j4e1 | Parichy et al., 2009 | j4e1 RRID:ZFIN_ZDB-ALT-001205-14 | Mutant |
| Gene (Danio rerio) | Et(shhb:KalTA4,UAS-E1b:mCherry)zf279 | (Distel et al., 2009) | zf279Et RRID:ZFIN_ZDB-ALT-120221-7 | Transgenic |
| Gene (Danio rerio) | Tg(kdrl:Cre)s898 | Bertrand et al., 2010 | s898Tg RRID:ZFIN_ZDB-ALT-100419-3 | Transgenic |
| Gene (Danio rerio) | Tg(actb2:loxP-STOP-loxP-DsRedexpress)sd5 | Bertrand et al., 2010 | sd5Tg RRID:ZFIN_ZDB-ALT-100301-1 | Transgenic |
| Antibody | anti-PCNA (mouse monoclonal) | Agilent | Agilent Cat# M0879, RRID:AB_2160651 | IHC (1:250) |
| Antibody | Anti-DsRed (rabbit polyclonal) | Takara Bio Clontech | Takara Bio Cat# 632496, RRID:AB_10013483 | IHC (1:500) |
| Antibody | Anti-GFP (chicken polyclonal) | Abcam | Abcam Cat# ab13970, RRID:AB_300798 | IHC (1:500) |
| Antibody | anti-Lplastin (rabbit) | gift from Yi Feng, University of Edinburgh | IHC (1:500) | |
| Commercial assay or kit | Click-iT EdU | Invitrogen | C10340 | Cell Proliferation Kit for Imaging |
| Software, algorithm | Prism 5 | Graphpad | GraphPad Prism, RRID:SCR_002798 | Data visualization and statistics software |
| Software, algorithm | Leica | LASX | Leica Application Suite X, RRID:SCR_013673 | Microscope image processing software |
| Software, algorithm | FIJI | ImageJ | National Center for Microscopy and Imaging Research: ImageJ Mosaic Plug-ins, RRID:SCR_001935 | Image analysis software |
| Software, algorithm | FlowJo v10 | Treestar | FlowJo, RRID:SCR_008520 | FACS software |
| Software, algorithm | R (Bioconductor package) | Durinck et al., 2009; Robinson et al., 2010 | edgeR, RRID:SCR_012802 GAGE, RRID:SCR_017067 | Transcriptomics data analysis software |
Table 1
List of primers used for qPCR experiments.
| Gene | Forward Primer | Reverse Primer |
|---|---|---|
| ef1α | GAGAAGTTCGAGAAGGAAGC | CGTAGTATTTGCTGGTCTCG |
| mob4 | CACCCGTTTCGTGATGAAGTACAA | GTTAAGCAGGATTTACAATGGAG |
| csf1a | ACGTCTGTGGACTGGAACTG | CTGTTGGACAAATGCAGGGG |
| csf1b | GGATTTGGGTCGGTGAGCTT | TGGAGAGGGGAACACACAGT |
| il34 | AGGGAGTTTCCGACGCTTTT | CTGAGAAGCCAGCATTCGGA |
Table 2
Number of biological replicates per group for qPCR.
| Age | csf1a | csf1b | il34 |
|---|---|---|---|
| 20 hpf | 3 | 1 | |
| 24 hpf | 5 | 2 | 1 |
| 36 hpf | 5 | 5 | 4 |
| 48 hpf | 3 | 4 | 2 |
| 72 hpf | 4 | 4 | 3 |
| 7 dpf | 5 | 4 | 5 |
| 10 dpf | 4 | 4 | 4 |
| 14 dpf | 3 | 3 | 2 |
| Organ | |||
| Gills | 3 | 3 | 3 |
| Skin | 3 | 4 | 3 |
| Muscle | 4 | 3 | 2 |
| Kidney | 4 | 4 | 2 |
| Heart | 5 | 2 | 4 |
| Spleen | 3 | 2 | 2 |
| Eye | 5 | 5 | 3 |
| Brain | 6 | 6 | 5 |
| Liver | 4 | 2 | 5 |
| Intestine | 3 | 1 | 3 |
Additional files
Download links
A two-part list of links to download the article, or parts of the article, in various formats.
Downloads (link to download the article as PDF)
Open citations (links to open the citations from this article in various online reference manager services)
Cite this article (links to download the citations from this article in formats compatible with various reference manager tools)
Zebrafish macrophage developmental arrest underlies depletion of microglia and reveals Csf1r-independent metaphocytes
eLife 9:e53403.
https://doi.org/10.7554/eLife.53403


