YAP regulates cell size and growth dynamics via non-cell autonomous mediators
- Harvard Medical School, United States
Figures
Figure 1 with 6 supplements
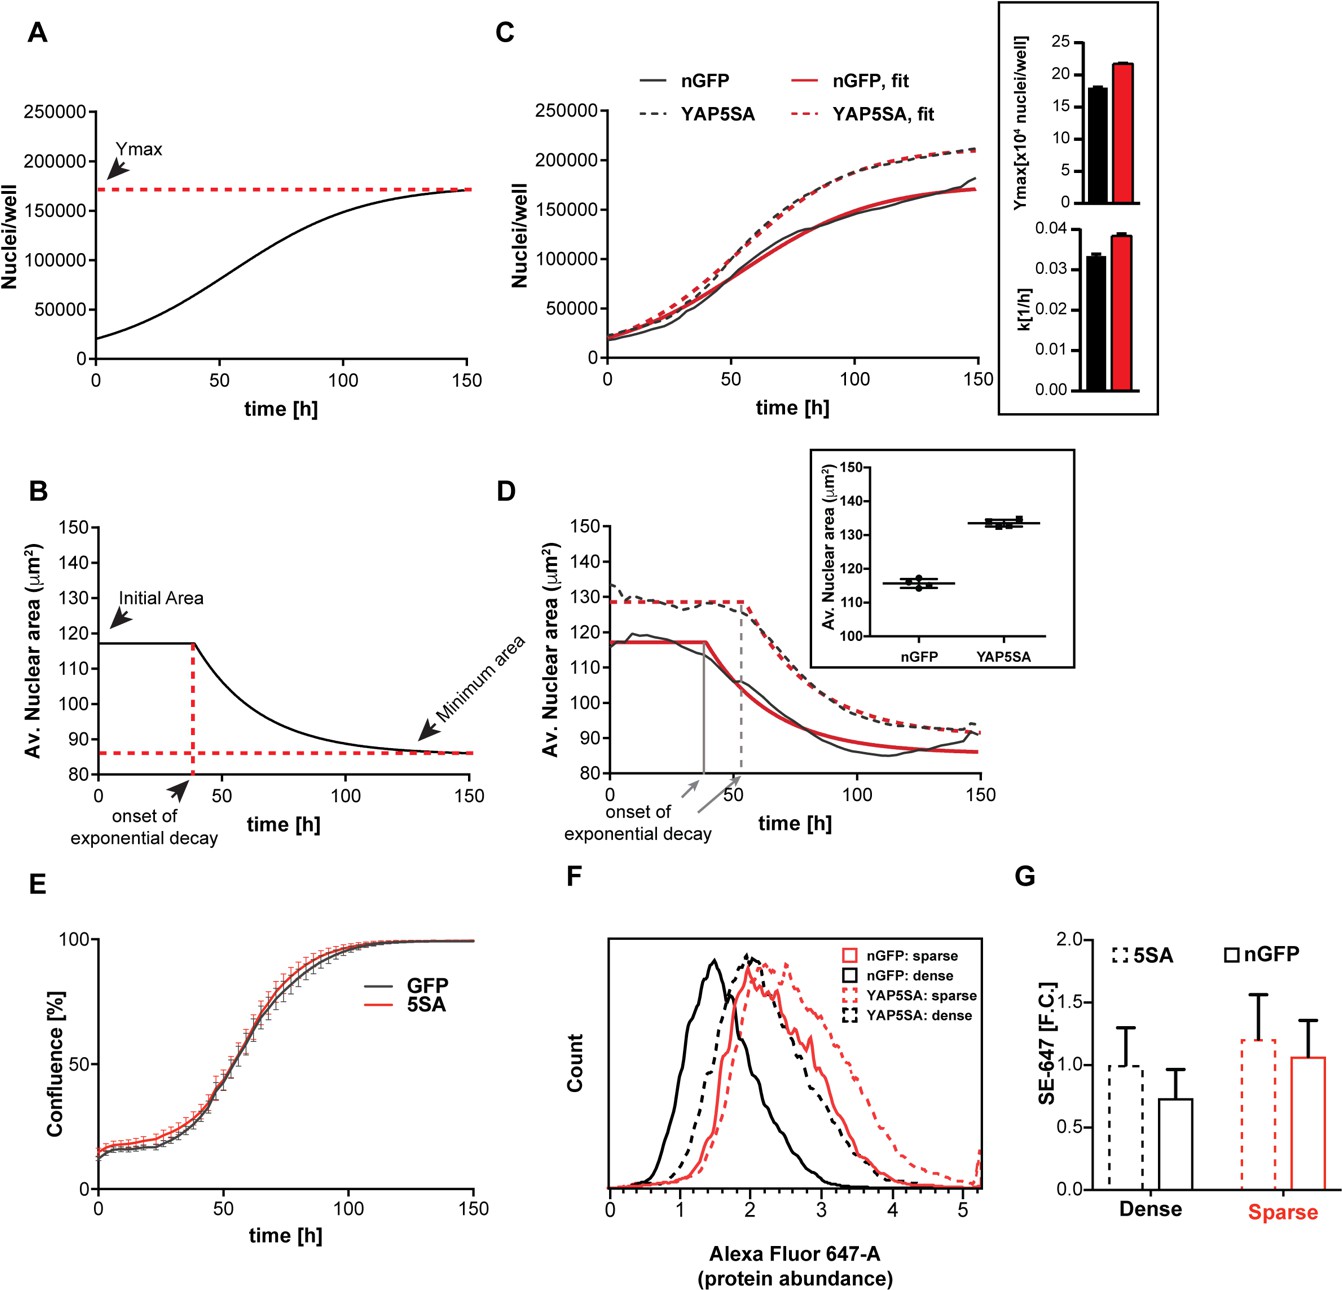
YAP5SA expression affects cell size and population growth dynamics.
(A) Example of population growth dynamics. The figure is a fit of data to the logistic growth equation in Figure 1—figure supplement 3A. Ymax is the carrying capacity of the population. (B) An example of changes in average nuclear area in a population of unsynchronized Flipin-Trex-293 cells over time after fitting to a plateau followed by exponential decay. While nuclear area is initially constant, it exponentially decays to a minimum as cell number increases. (C) Population growth curves of FlipinTrex-293 cells expressing constitutively active YAP (YAP5SA) or nuclear-GFP (nGFP). FlipinTrex-293 cells were seeded at ~20,000 cells/well on a 96-well plate (low density) and monitored over time. Ymax and k are both higher in 5SA cultures than nGFP cultures. In black, the average of 4 wells; in red, the fit to a logistic growth model; n = 4; mean ± SEM. (D) Changes in nuclear area over time in the same populations of cells in (C). Nuclear area is larger in YAP5SA cells vs. controls, but still decreases exponentially as cell density increases. In black, the average of 4 replicates; in red, the fit to a plateau followed by an exponential decay; n = 4; mean ± SEM. (E) Cell confluence is estimated by the relative area of the culture vessel covered by cells in bright field images. We observe no significant difference in the confluence of the YAP5SA vs nGFP cells. (F) Protein content was compared between populations of YAP5SA and nGFP ~20 hr after the same number of cells were seeded in 10 ml medium on 10 cm-dishes to represent either low density (~25% confluence) or high density (>90% confluence) conditions. All samples were simultaneously trypsinized, permeabilized, stained and measured on a LSRII flow cytometer at a concentration of 1 × 10⁶ cells/ml. A total of 10,000 cells were analyzed per condition. Protein content is higher in YAP5SA cells whether sparsely or densely seeded. (G) The population mean and SD of the data in (F).
Figure 1—figure supplement 1
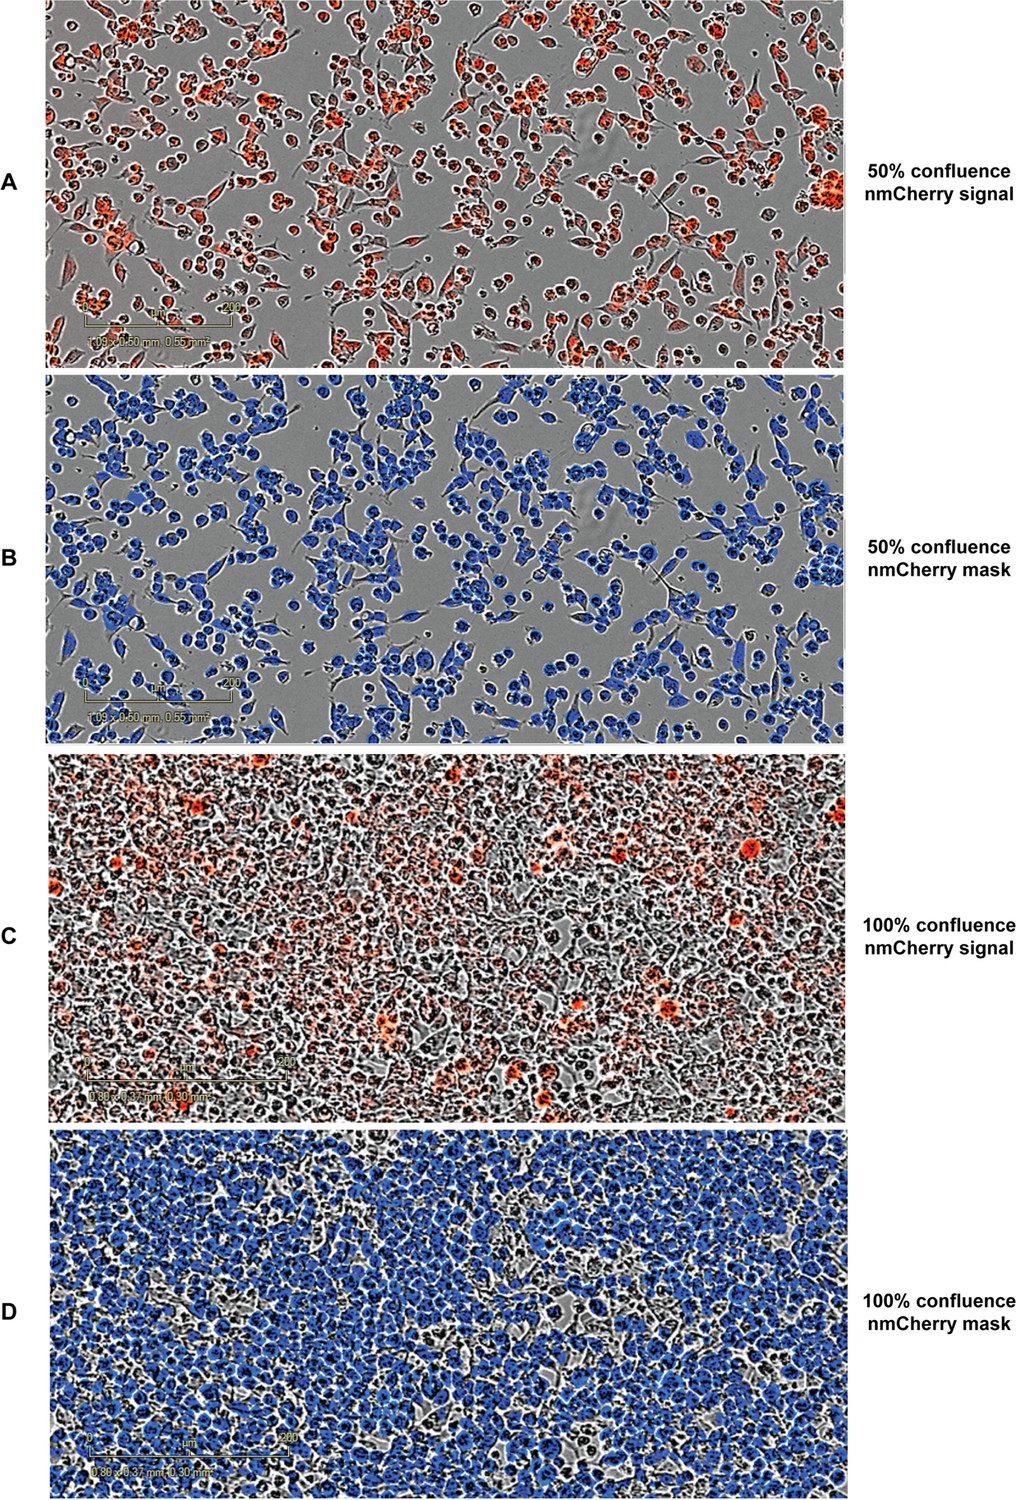
Example of images acquired on and analyzed by the Incucyte ZOOM to obtain data about the number of nuclei and their average area.
(A) HEK293 cells labelled with nmCherry growing at ~50% confluence. (B) The same field of view in A displaying the nmCherry mask used for estimating nuclear area and count as estimated by the Incucyte image analysis software. (C) Same as (A) at ~100% confluence. (D) Same as (B) at 100% confluence.
Figure 1—figure supplement 2
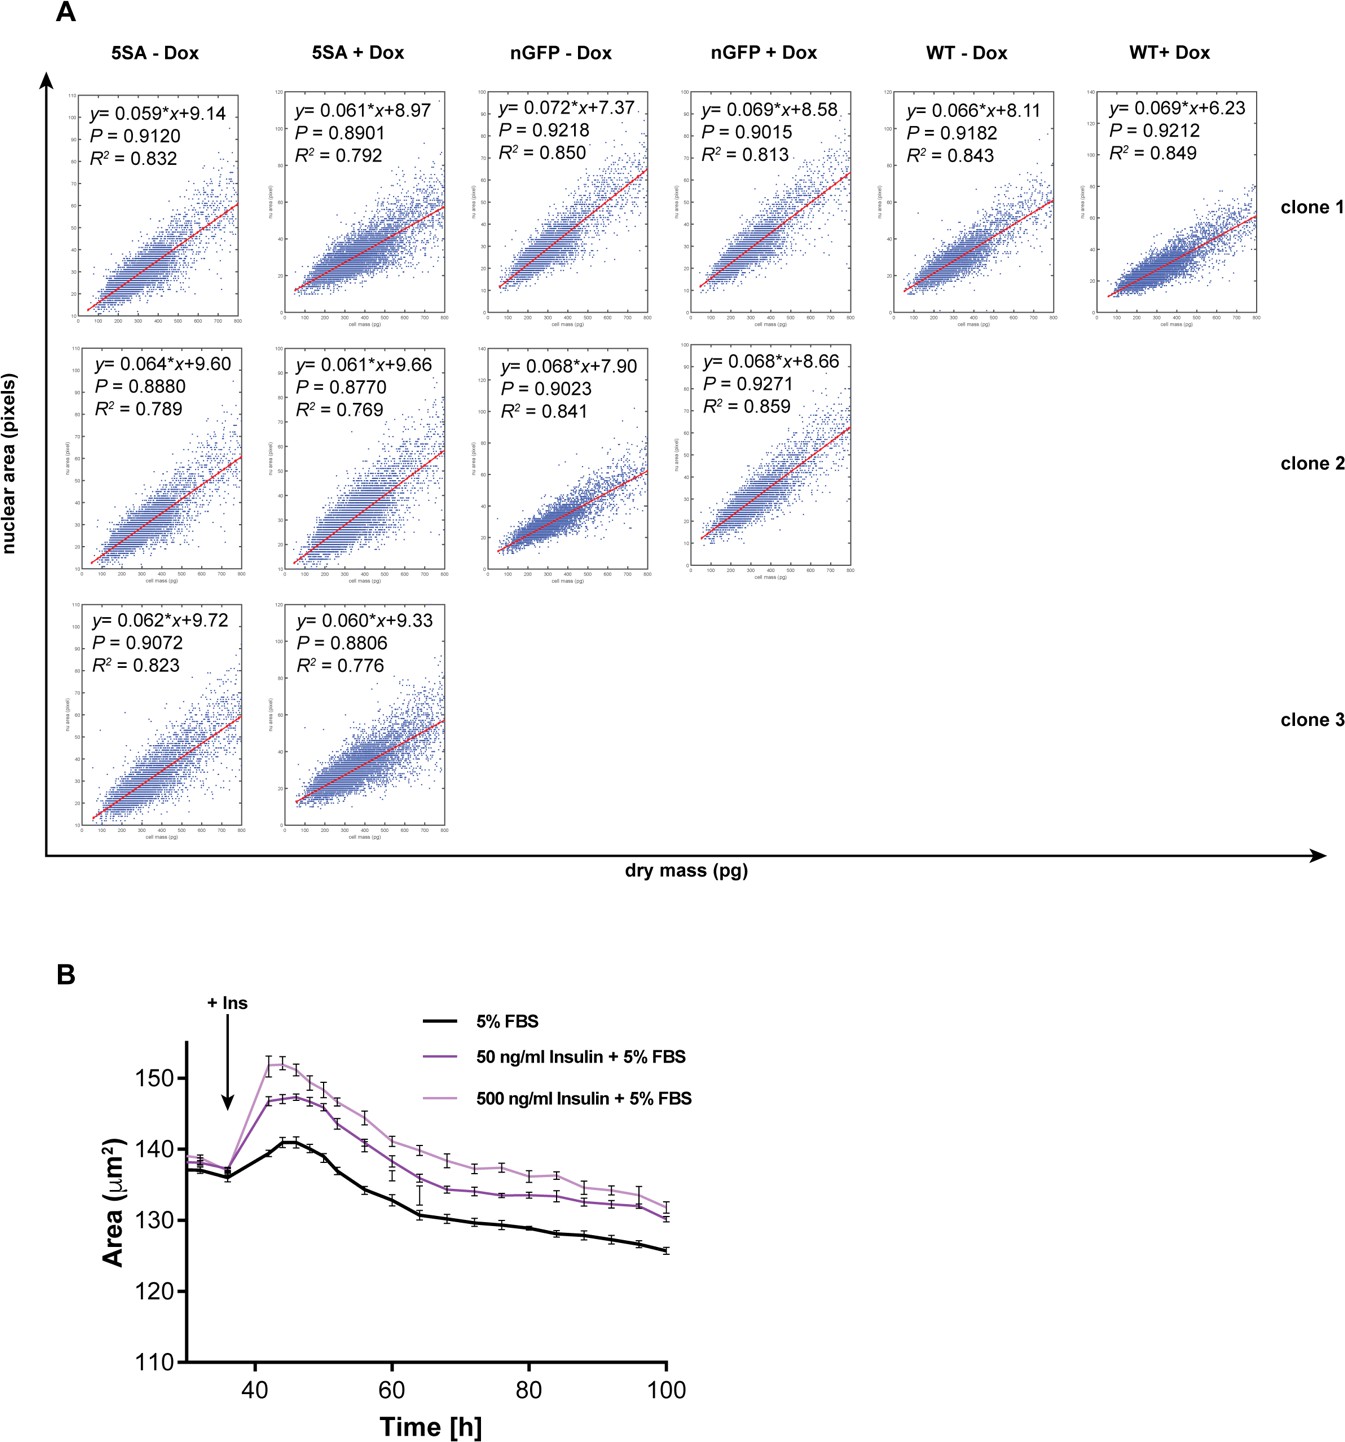
Nuclear area is a good proxy for cell size in Flipin-Trex-293 cells.
(A) Dry mass measurements across different clones were done using quantitative phase microscopy (QPM) on live, attached cultures of 50,000 cells/well. Nuclei were segmented based on Hoechst staining of the same cells. Nuclear area was compared to the dry mass on a per cell basis. The conditions depicted represent measurements done on three isogenic clones of FlipinTrex-293 cells expressing constitutively active YAP (YAP5SA), two clones expressing nGFP and the parental cell line. Each clone was measured before treatment with doxycycline (Dox) and after culturing with 50 ng/ml of Dox for 4 days. For the measurement cells were seeded in 2 ml medium on fibronectin-coated, glass-bottom, 6-well plates. p=Pearson correlation coefficient, slope=. The measurements demonstrate a strong correlation between nuclear area and dry cell mass across the various conditions depicted. (B) Flipin-Trex cells expressing nuclear mCherry were starved for 6 days in 0.5% FBS before they were treated with the indicated concentration of insulin and/or FBS. Insulin increases the nuclear area of FlipinTrex cells expressing nuclear mCherry in a titratable manner after 6 days of serum-starvation in 0.5% FBS.
Figure 1—figure supplement 3
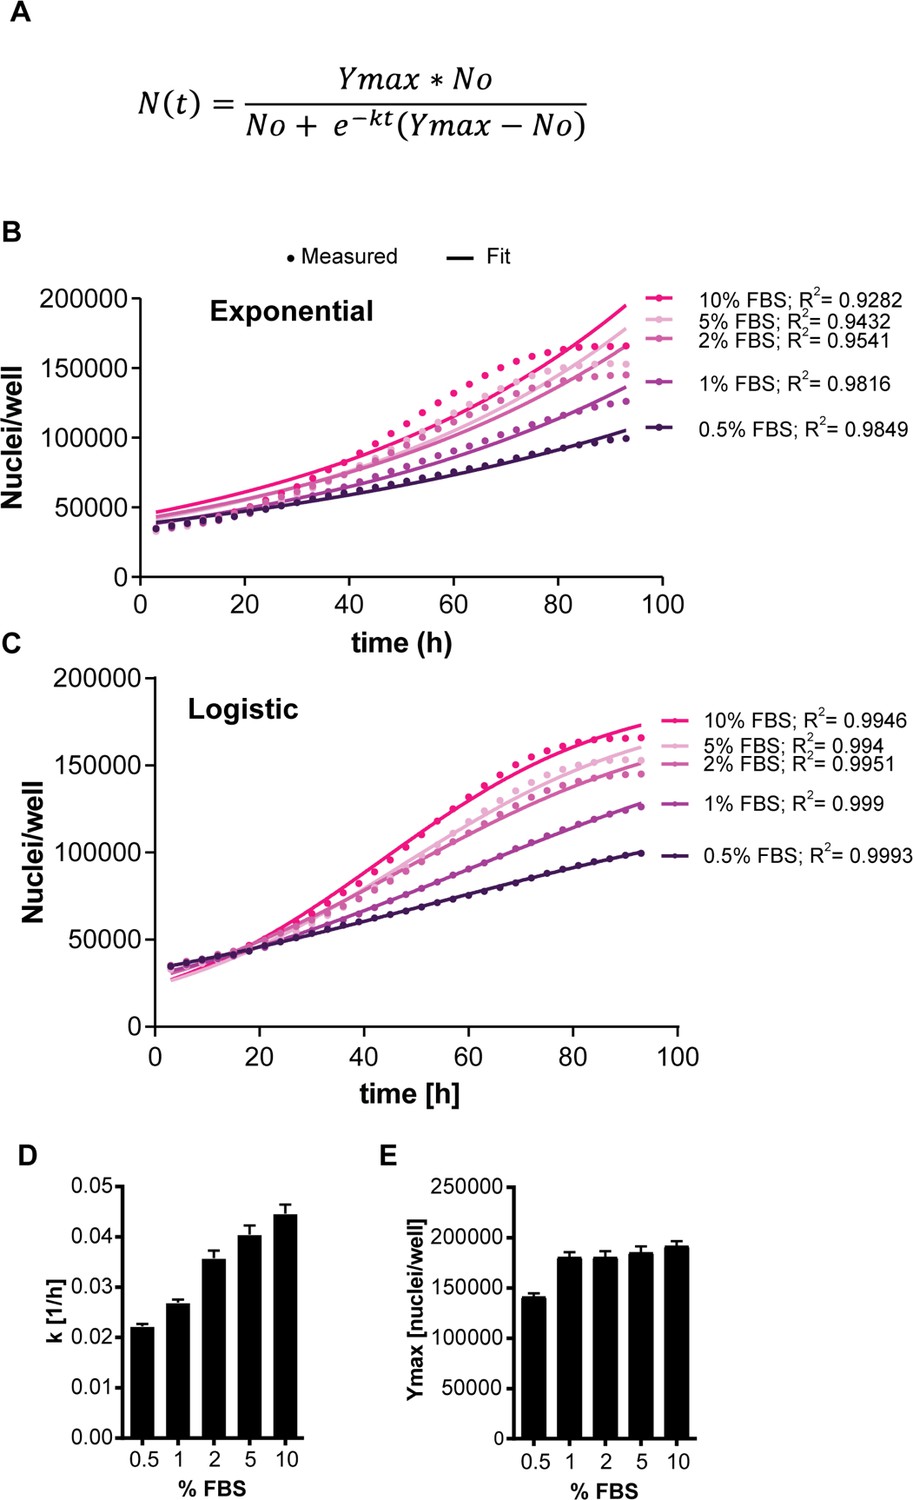
Fitting changes in cell number over time using the Logistic growth equation.
(A) Logistic growth equation. K is the growth rate in 1/h which is equivalent to the exponential growth rate at low density, and Ymax is the maximum number of cells reached per condition. (B, C) Flipin-Trex-293 cells expressing nuclear mCherry were seeded in varying concentrations of fetal bovine serum (FBS). Cells were imaged on an Incycte to track changes in cell count over time. The change in the number of nuclei/well over time is reflected in the growth rate. The growth rate decreases over time and is better modelled as logistic (C) rather than exponential growth (B). While the population growth rate estimated by fitting to the logistic growth model, k, increases by increasing fetal bovine serum (FBS) (D), the carrying capacity of a culture (Ymax) does not once the FBS concentration is above 0.5% (E). (D), (E): n = 5, mean ± SEM. (C), (B): dots are the raw data points representing the average of 5 wells and lines are the fits to the corresponding model.
Figure 1—figure supplement 4

Culture density affects cell death rates and cell size.
(A, B) Cell death was monitored using 50 nM of the fluorescent DNA-binding dye YOYO-1 that permeates only dead cells. Flipin-Trex cells were seeded in the presence of YOYO-1 which becomes fluorescent when bound to DNA. The rate of accumulation of green fluorescent signal/well is an indication of cell death over time. Cell death increases significantly once cells reach 100% confluence. (C) Cell volume of HEK293 cells was measured using Coulter Counter. Cells were counted and seeded the night before the measurement. Cells were seeded in 10 ml medium on a 10 cm dish at ~10×10^6, 5 × 10^6 and 2.5 × 10^6 cells/dish to achieve 100%, 50% and 25% confluence respectively. For the measurement cells were trypsinized and resuspended in Coulter measurement buffer. Each measurement represents the average volume from three independent plates ± S.D. (D) Protein concentrations of a total of 2.5 × 10^6 cells per density was done using BCA. Cells were cultured as described in C), trypsinized, counted, pelleted, washed in PBS and lysed in RIPA buffer; n = 3, mean ± S.D.
Figure 1—figure supplement 5
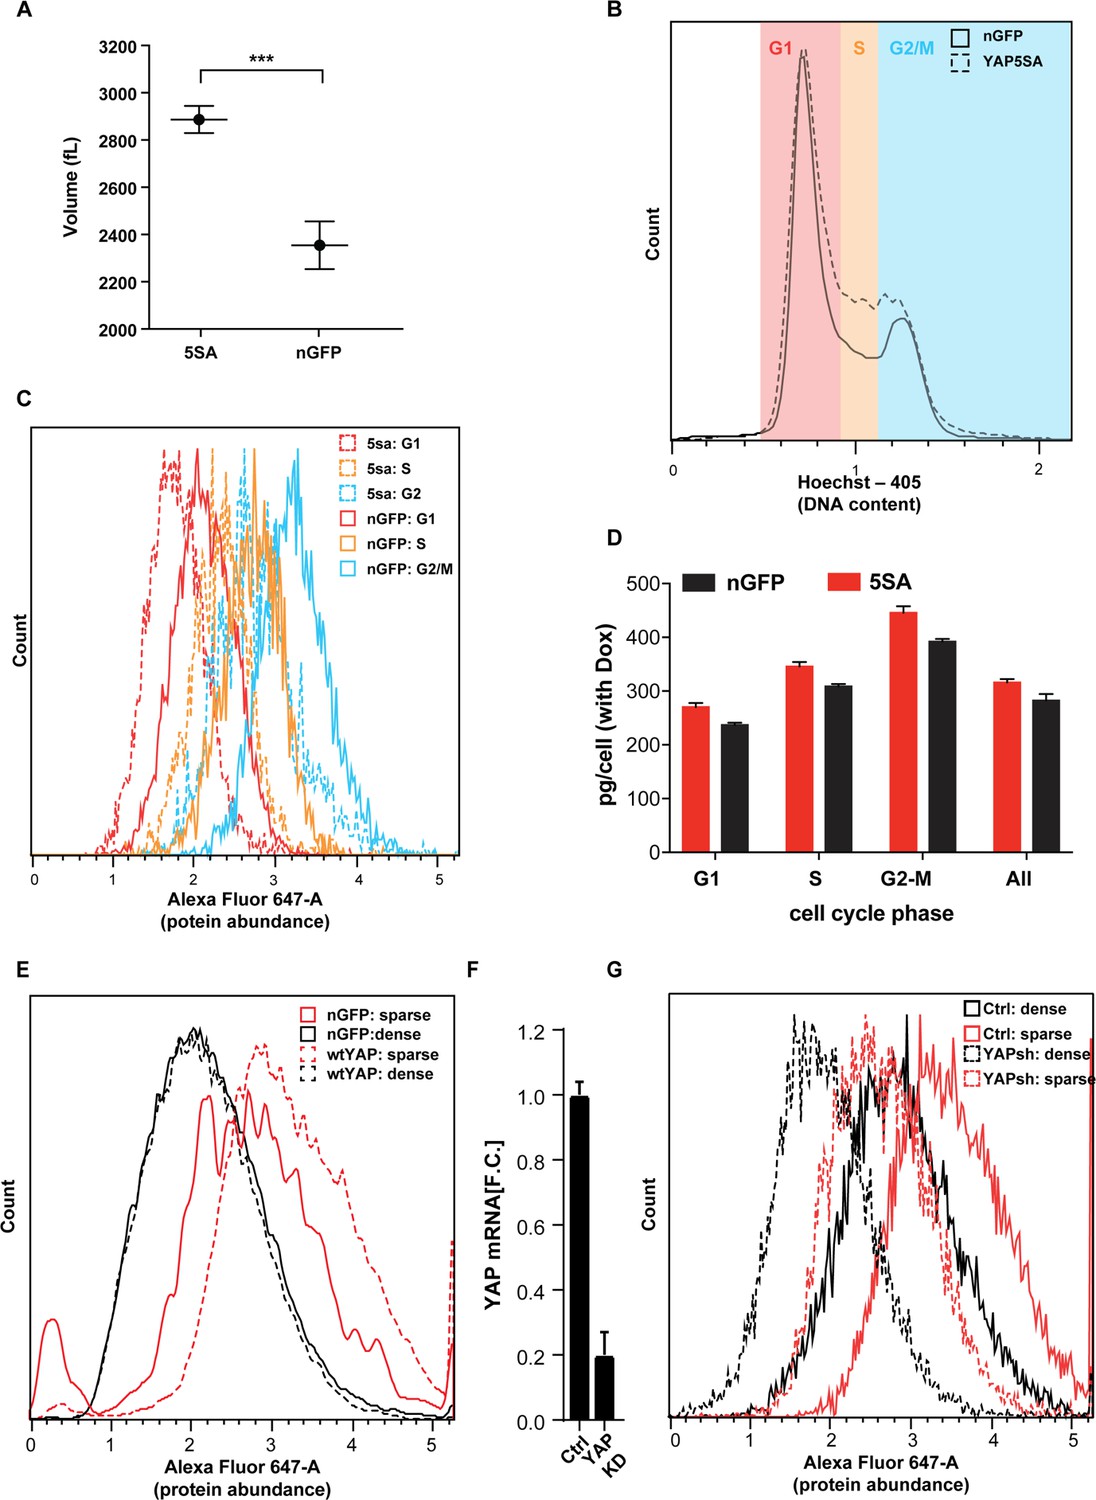
The effect of YAP5SA, YAPwt and YAPsh expression on cell size.
(A) Average cell volume was measured in a population of YAP5SA and nGFP-expressing Flipin-TREX-293 cells maintained in Dox+ medium over several passages. Cells were seeded at ~50% confluence the night before the measurement in 10 ml medium, on 10 cm dishes. For the measurement cells were trypsinized and resuspended in Coulter measurement buffer. 5SA-expressing cells are ~25% larger than nGFP-expressing cells. (B) In low density cultures of FlipinTrex-293 cells, YAP5SA vs. nGFP expression leads to a higher fraction of cells in S and G2/M. Cell cycle analysis was done after cells were trypsinized and stained using Hoechst as a DNA dye and the SE-dye for protein. (C) Total protein content is higher in YAP5SA-expressing cells (5SA) vs nuclear GFP (nGFP) controls throughout the cell cycle. (D) We also used quantitative phase microscopy (QPM) to simultaneously determine average dry cell mass/cell and cell cycle phase in three different clones of Flipin-TREX-293 cells expressing YAP5SA vs nGFP. Cells were cultured on 10 cm dishes for 3 days in the presence of Dox before they were transferred to a Fibronectin-coated, glass-bottom 6-well plate at ~50,000 cells/well for the measurement. Each measurement is based on >4000 total of cells not in contact with other cells. Each cells was binned into its respective position in the cell cycle based on the Hoechst signal intensity. The figure depicts the mean ± S.D. of the three clones. (E) Protein concentration in a population HEK293 cells constitutively expressing wild-type(wt) YAP was compared to nGFP-expressing controls. The histogram represents the distribution of protein concentration as estimated by SE-dye labelled cells cultured at high or low density. A day before the measurement cells were cultured in 10 ml medium on 10 cm dishes at ~10×10^6 cells/dish (high density) or 2.5 × 10^6 cells/dish (low density). For the measurement, cells were simultaneously trypsinized, fixed, permeabilized and stained with the SE-647 dye, then measured on an LSRII. wtYAP overexpression increases cell size in low density cultures. (F, G) A similar experiment as described in E) was done on HEK293 cells in which YAP levels were reduced to ~80% by shRNA expression (YAPKD) vs. empty vector controls (Ctrl). YAPKDs are smaller than empty vector controls (Ctrl) in sparse and dense cultures.
Figure 1—figure supplement 6

Serum is required for the 5SA-dependent changes in proliferation and size.
(A) Population growth is reduced when cells are cultured in 0.5% serum, but with 0.2% BSA, and is comparable between Flipin-Trex-293 cells expressing nuclear GFP (nGFP) and YAP5SA (5SA) cells (n = 5; mean ± SEM). (B) Total protein content is higher in 5SA vs. nGFP controls in the presence of FBS, but not in its absence. ~2.5×10^6 cells were cultured on a 10 cm dish either in the presence of 10% FBS or with 0.5% serum and 0.2% BSA. A day later cells were simultaneously trypsinized, fixed, stained and measured on an LSRII.
Figure 2 with 1 supplement
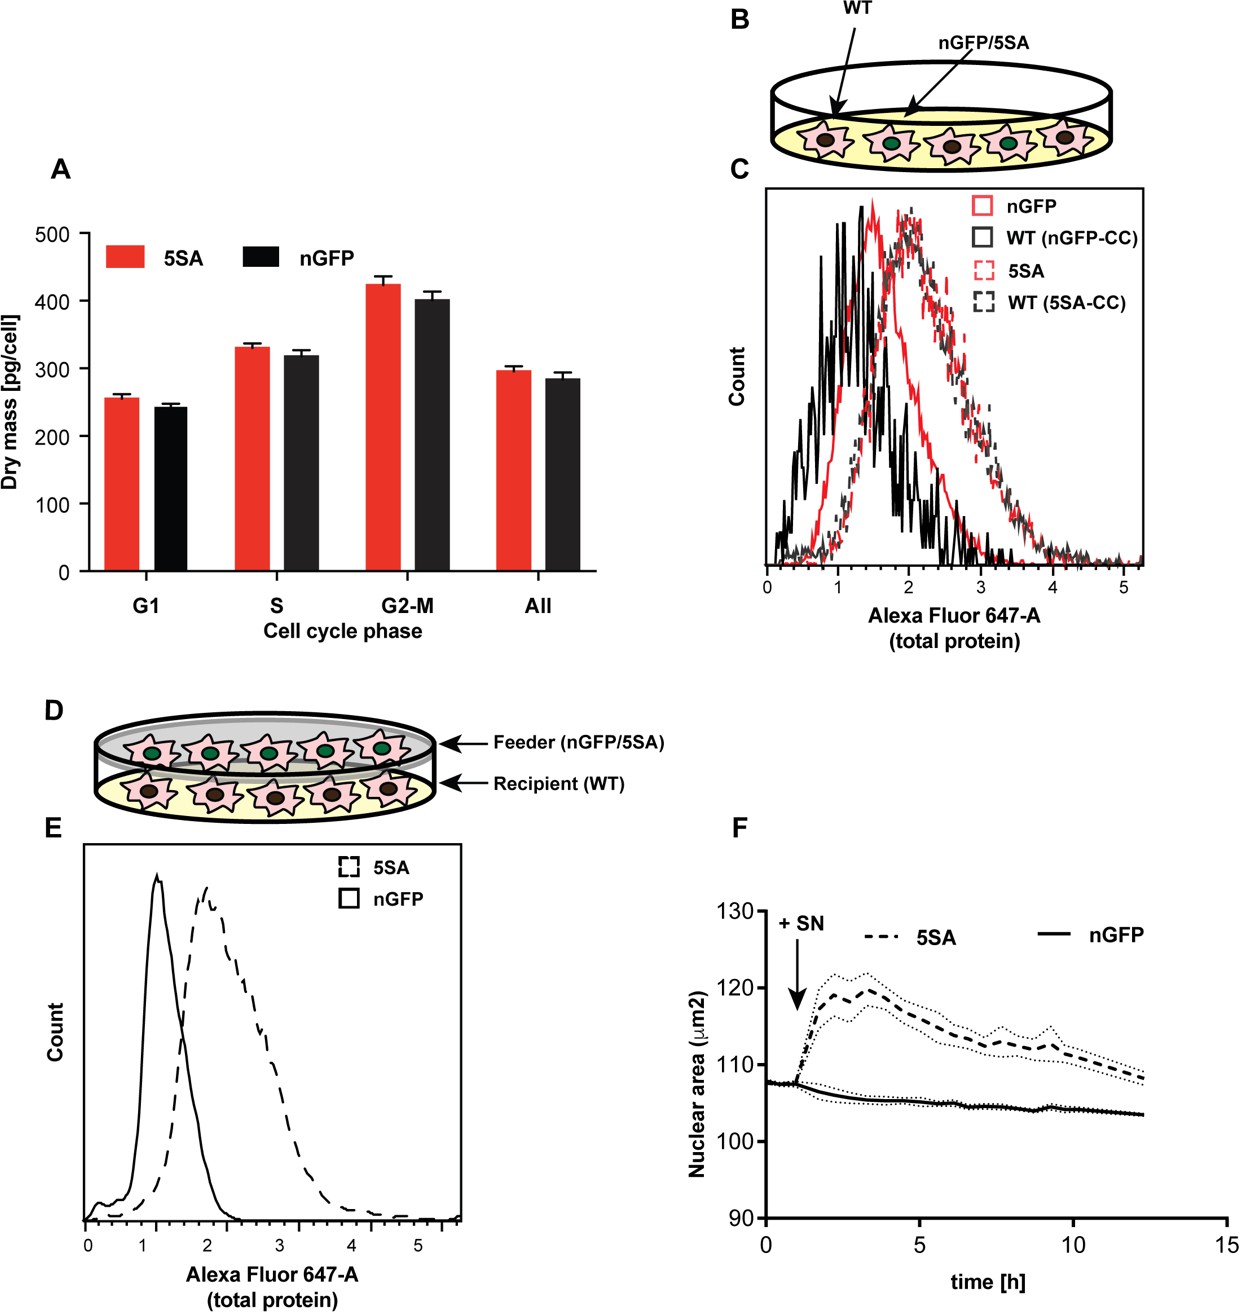
YAP5SA increases cell size non-autonomously.
(A) The average dry mass/cell ± S.D. in cultures of 3 isogenic clones of Flipin-Trex-293 cells engineered to express YAP5SA or nGFP was measured using quantitative phase microscopy (QPM). Cells had never been cultured in the presence of doxycycline before they were transferred to a Fibronectin-coated, glass-bottom 6-well plate at ~50,000 cells/well for the measurement. 30 min before the measurement Hoechst was added at a concentration of 2 μg/ml to allow DNA staining of live cells. The overall average per clone was calculated from >4,000 cells. The average size per cell cycle phase was determined from cells binned into the respective cell cycle phase depending on Hoechst-levels. Cell size is slightly higher in the population of uninduced 5SA cells vs. controls. (B) Experimental setup of data in (C). In short, cells expressing nuclear GFP (nGFP) or GFP-tagged YAP5SA (YAP phospho-mutant) cells were intermixed with wildtype (WT) cells at a ratio of 2:1 and grown for ~24 hr on 10 cm dishes before they were trypsinized and processed as single-cell suspensions at a concentration of 1 × 10^6 cells/ml. Total cell number was kept the same between both cultures, and all samples were simultaneously prepared for labelling using the SE-647 protein dye and analyzed on a LSRII. (C) Histograms of average protein content as estimated by SE-657 signal per cell. Cells were separated into two groups depending on whether or not they expressed GFP. Cc denotes the GFP-negative WT cells in the culture. GFP+ (red dotted line) and GFP- cells (black dotted line) in YAP5SA-co-cultures are larger than cells in the nGFP co-cultures. (D) Experimental set up for data in (E). WT cells were co-cultured with YAP5SA or nGFP cells on a 0.4 μm Transwell membrane in a 10 cm dish. The membrane allows the exchange of medium components but not physical contact. (E) WT cells from the setup in (D) were processed as explained above to allow SE-dye based quantification of their protein content. WT cells co-cultured with YAP5SA cells have higher protein content than those co-cultured with nGFP cells. (F) FlipinTrex-293 cells expressing n-mCherry were starved for 6 days in 0.5% FBS before they were treated with equal amounts of 5SA- or nGFP-conditioned medium. Medium conditioned by 5SA cells but not nGFP cells increases nuclear area.
Figure 2—figure supplement 1
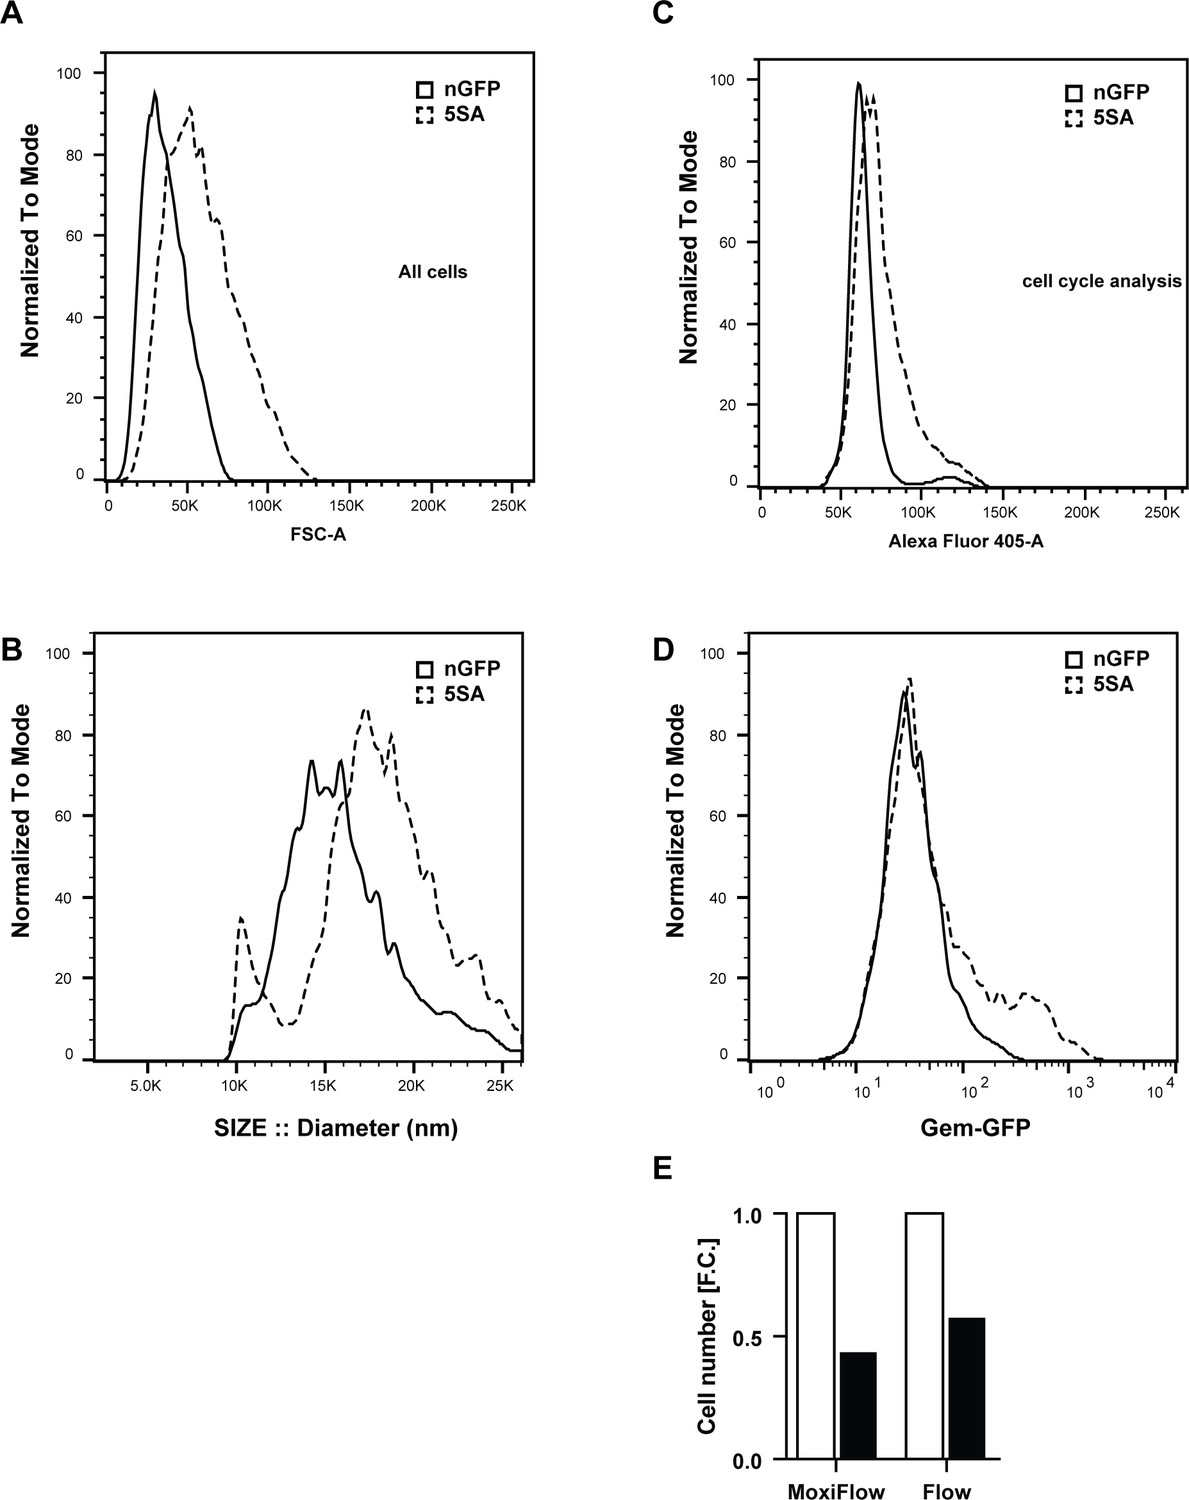
The effect of 5SA-conditioned medium on 3T3 fibroblasts.
To obtain conditioned medium Flipin-Trex cells expressing YAP5SA or nGFP were cultured in 10% FBS until they reached confluence. Thereafter, cells were switched to 0.5% FBS medium for 6 days to allow for the significant accumulation of soluble molecules in the medium in the presence of minimum amounts of FBS. The conditioned medium was then collected, concentrated on a 3000 Da cutoff centricon and resuspended in fresh medium. Meanwhile, 3T3 cells were starved in 0.5% FBS after reaching confluence for 6 days, then treated with conditioned medium for 48 hr. 3T3 cells were then trypsinized and resuspended in PBS+ 1% FBS before they were measured. 5SA-conditioned medium, vs. nGFP-conditioned medium, increases the size of 3T3 Fibroblasts as measured by changes in FSC-A distribution on a LSRII (A) and cell diameter on a coulter-based MoxiFlow (B). (C) The number of 3T3 fibroblasts in S and G2/M is higher when cells are treated with 5SA conditions medium. That is also reflected in an increase in the fraction of Geminin-GFP expressing cells (D). (E) The total cell number of the same cultures treated with 5SA-conditioned medium is double that of nGFP cells according to measurements done on a Moxiflow, or to the number of single-cell events counted on a flow cytometer.
Figure 3

YAP affects the population growth rate (k) and carrying capacity (Ymax).
(A) Experimental design for results in (B–G). Flipin-Trex-293 cells expressing nuclear GFP (nGFP) or GFP-tagged YAP5SA (YAP phospho-mutant) work as feeder cells for intermixed recipients expressing nuclear mCherry (n-mCherry). The total number of cells per well at seeding is kept constant at ~20,000 cells/well on a 96-well plate, though the ratios between cell types varied. Ymax and k are estimated based on counts from the recipient population only. (B–D) Increasing the fraction of YAP5SA to n-mCherry cells increases Ymax but does not affect k; p-values indicate the likelihood that the slope is non-zero; n = 5 wells; mean ± SEM. (B) Depicts raw data. (E) Population growth curves of YAP knockdowns (light blue) or empty vector controls (Ctrl; purple) when co-cultured with twice the number YAP5SA (dashed lines) or nGFP (solid line) cells; n = 6; mean ± SEM. Black lines represent the fit of the data to a logistic model. (F) Ymax is higher when recipient cells are co-cultured with YAP5SA feeders even if recipients have reduced levels of endogenous YAP (YAPKDs). Ymax is slightly lower than controls in YAPKDs. (G) K is lower in YAPKD recipients than ctrls, and is unaffected by feeder cell type. Meanwhile, co-culturing ctrls with YAP5SA feeders as depicted in (A) does increase k mildly. (H) Cells expressing n-mCherry were starved in 0.5% FBS for 6 days before they were treated with 5SA- or nGFP-conditioned medium. Treating cells with YAP5SA-conditioned medium increases Ymax in comparison to nGFP-conditioned medium; n = 4; mean ± SEM.
Figure 4
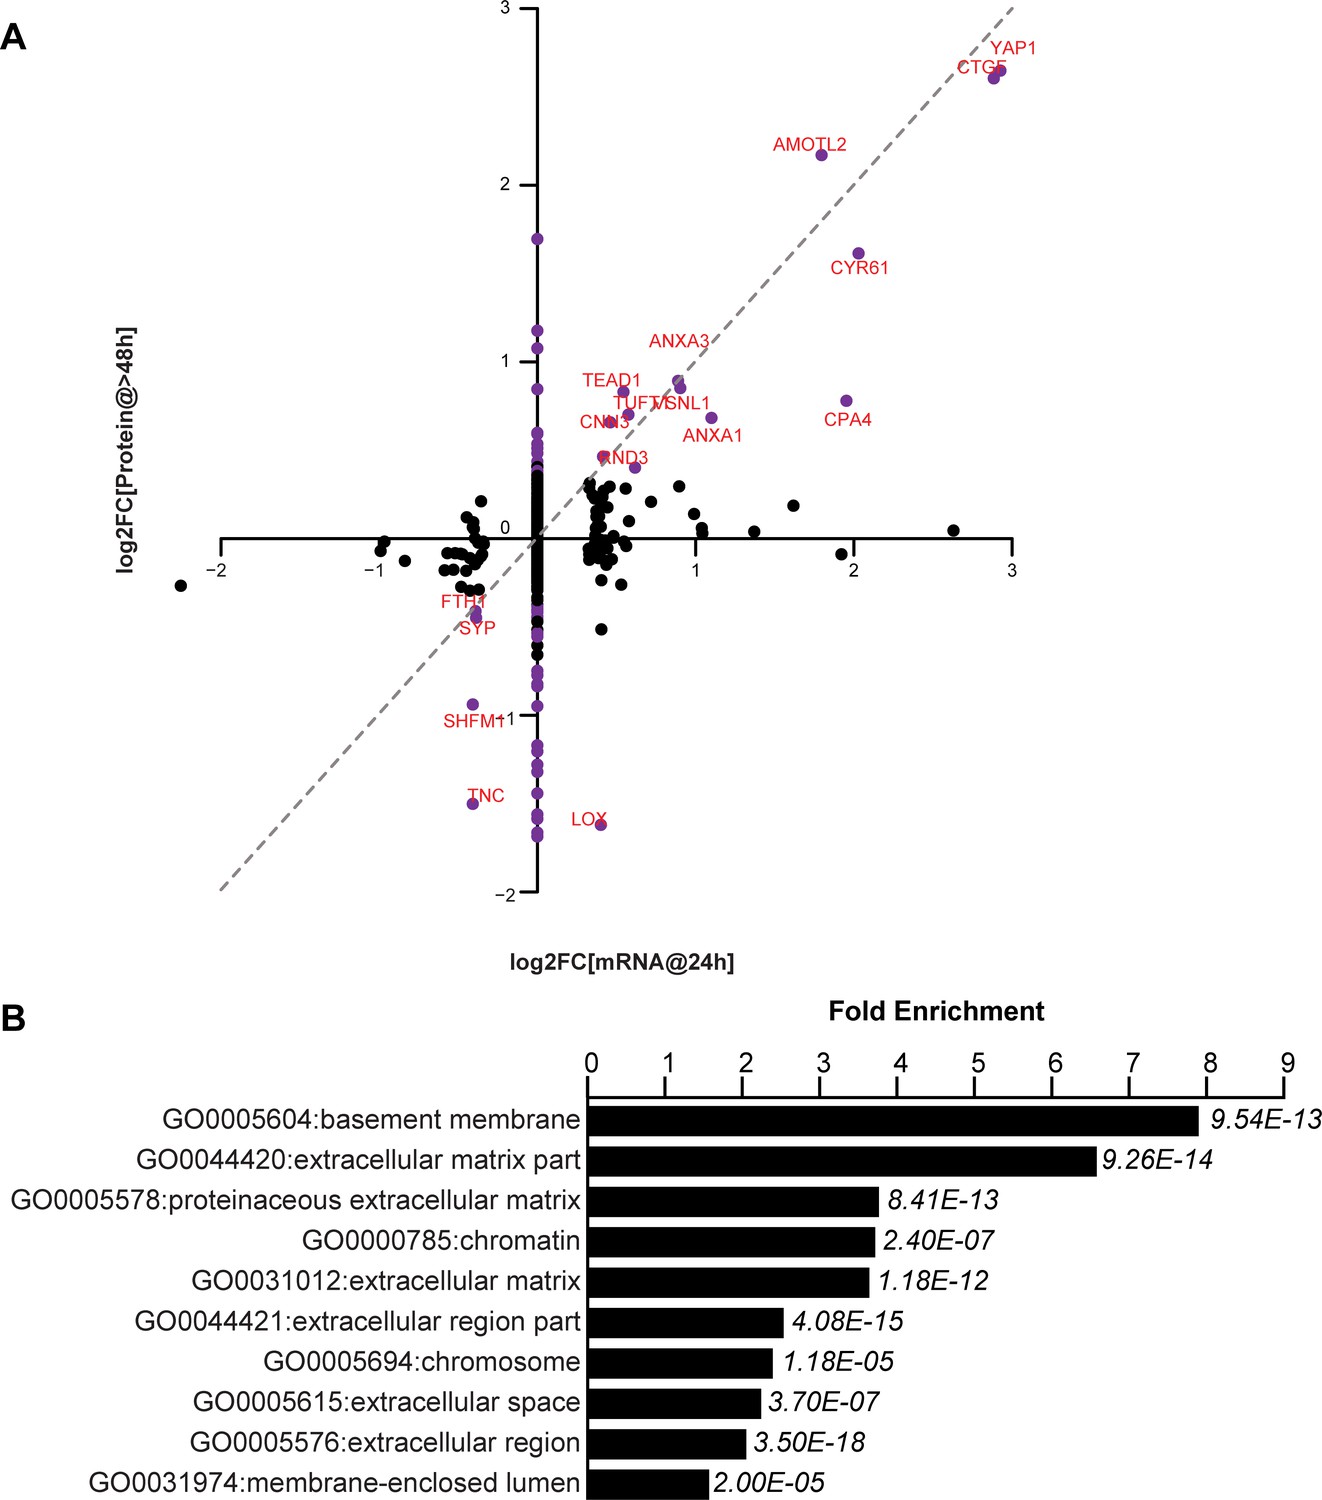
YAP-dependent changes in protein and mRNA expression levels.
(A) Scatter plot of changes in protein (y-axis) vs. mRNA levels (x-axis) upon YAP expression. Dots in purple indicate proteins have a log2[fold change] (log2FC) more than two standard deviations away from the mean. Dotted line indicates a 1:1 change in protein vs. mRNA levels. (B) The 10 most significantly enriched cellular compartments in which regulated proteins reside (according to fold enrichment relative to all identified proteins). Benjamini-Hochberg adjusted p-values are indicated in italics.
Figure 5 with 1 supplement
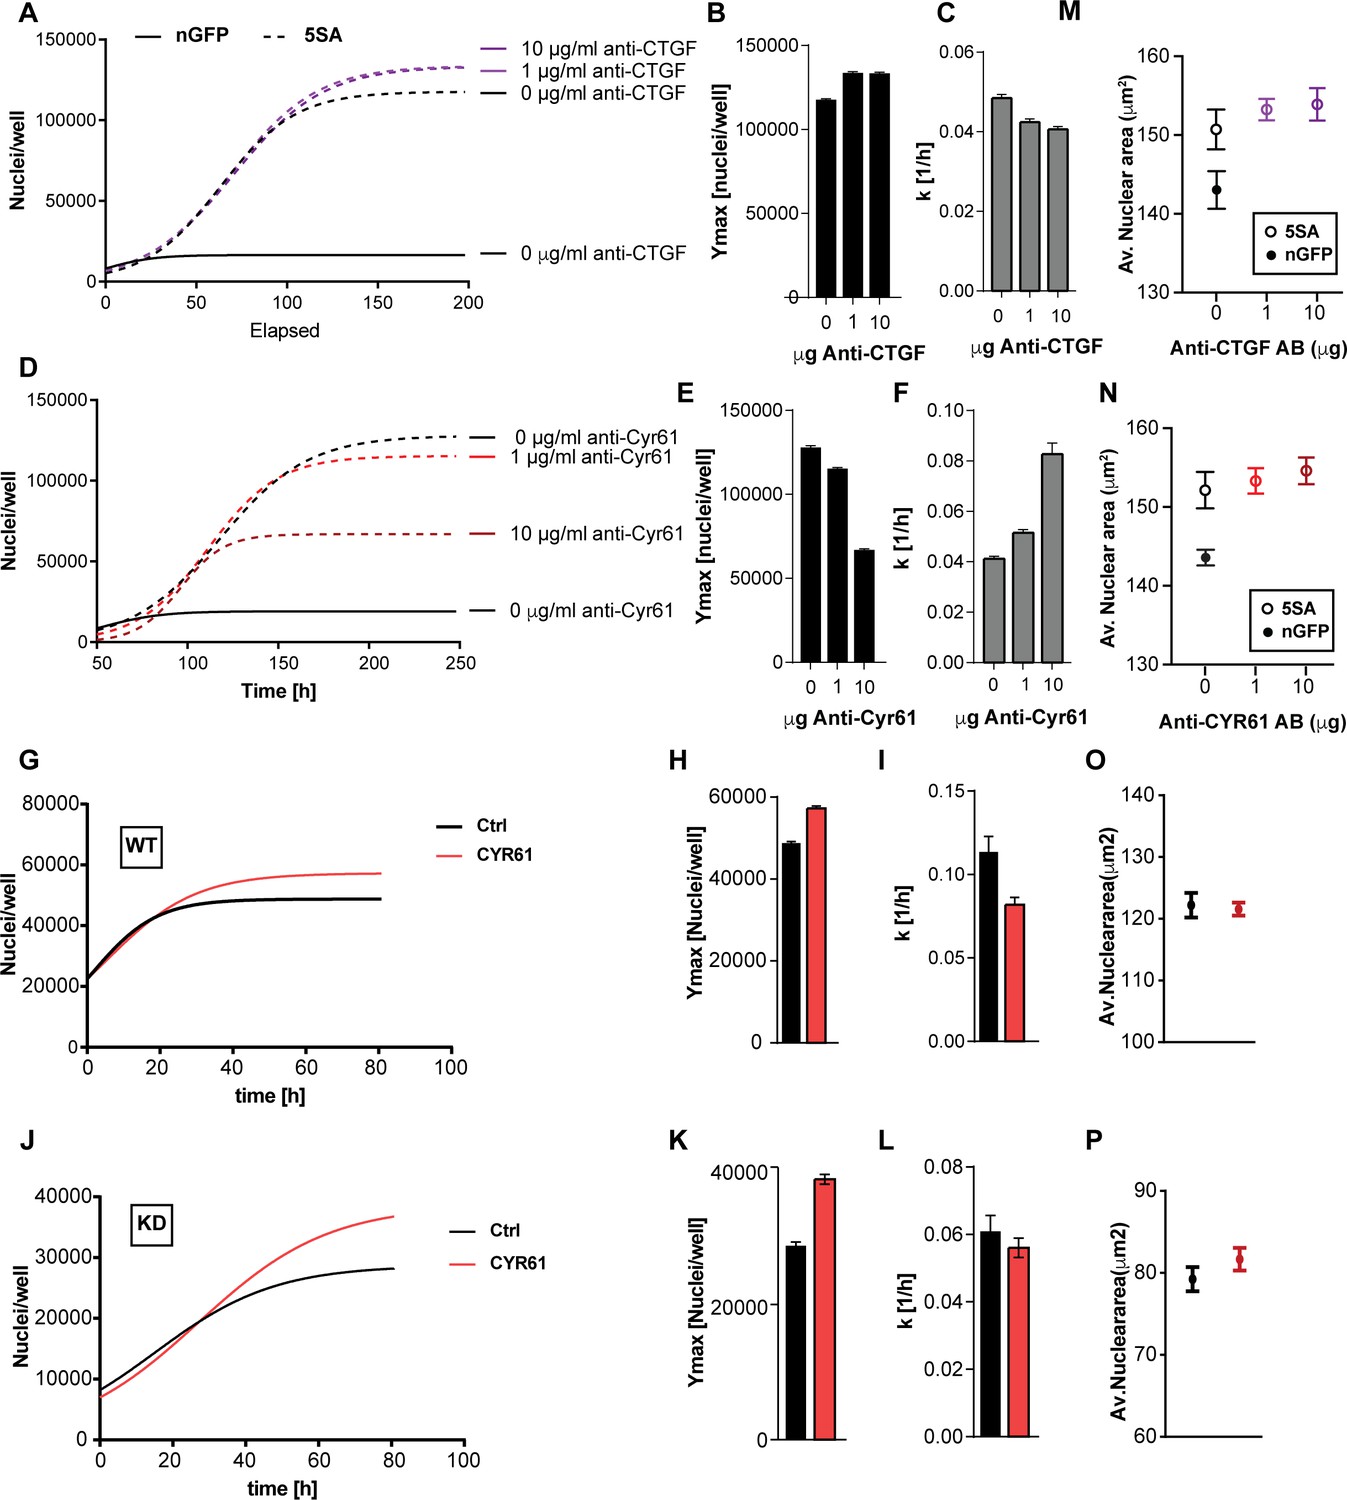
The effects of CTGF and CYR61 on cell size and number.
CTGF or CYR61 were neutralized by the addition of antibodies at the indicated concentration to the culture medium when cells were seeded. (A–C) In co-cultures of 6x YAP5SA: 1x nuclear mCherry expressing cells (n-mCherry), CTGF neutralization increases the n-mCherry cells’ carrying capacity (Ymax), while decreasing their rate of growth (k). (D–F) Neutralizing CYR61 in these cultures has opposing effects of larger magnitude compared to CTGF. (G–I) Treating cells expressing empty vector (WT) with 1 μg/ml of CYR61 increases Ymax and decreases k. (J–L) YAPKD cells respond to exogenous CYR61 with an increase in Ymax and a decrease in k. (M–N) Cell size is not affected by the presence of anti-Cyr61 or anti-CTGF. (O, P) Adding recombinant CYR61 at 1 μg/ml also has little effect on cell size in YAPKDs and controls. (B), (C), (E), (F), (H), (I), (K), (L) n = 5 wells; mean ± SEM. (M–P) n = 5 wells; mean ± SD).
Figure 5—figure supplement 1
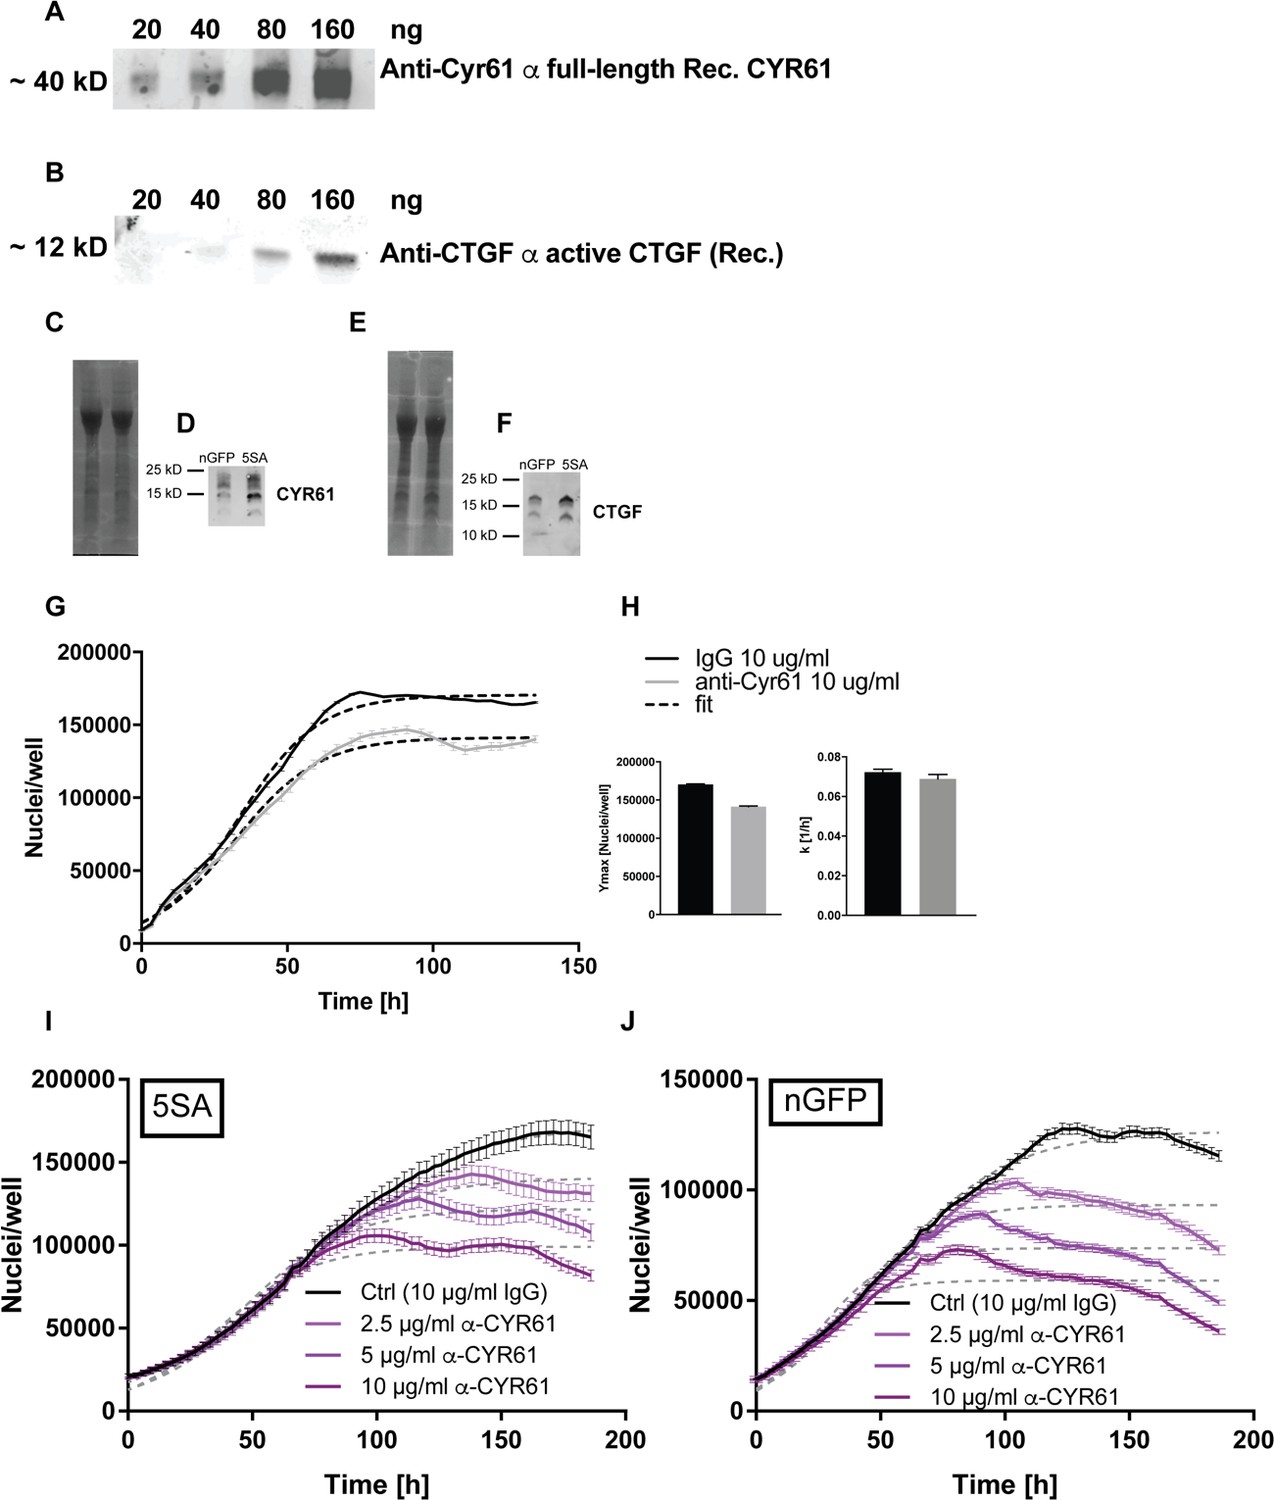
Validation of anti-CYR61 and anti-CTGF antibodies.
(A) The primary anti-Cyr61 antibody used in our assays recognizes titrated amounts of recombinant full length CYR61 (Peprotech). (B) The anti-CTGF antibody (Peprotech) recognizes the 12 kD peptide of recombinant active form of CTGF (Peprotech). Serum-free conditioned medium from FlipinTrex cells expressing nGFP or 5SA for 6 days was concentrated using Amicon filters. Equal amounts of total protein were loaded on a gradient tris-acetate gel and transferred to a nitrocellulose membrane for further probing using the antibodies in (A and B) (C, E). No full length CYR61 or CTGF was detectable in the concentrates, just the processed forms of CYR61 (D) and CTGF (F) which appear to be post-translationally modified to various degrees as indicated by the presence of several bands of higher molecular weight. (G, H) Pure cultures of flipinTrex-293 cells treated with 10 μg/ml of anti-CYR61 have a lower Ymax compared to those treated with polycolonal rabbit IgG as a control, but k is not significantly different. n = 5, mean ± SEM. (I, J) The effect of a second anti-CYR61 antibody raised against a different epitope of CYR61 was validated to have similar effects on population growth dynamics as the antibody we use throughout the manuscript. Pure cultures of YAP5SA and nGFP FlipinTrex cells show a titratable reduction in Ymax when treated with the 2nd antibody in comparison with 10 μg/ml of the polyclonal IgG control.
Figure 6
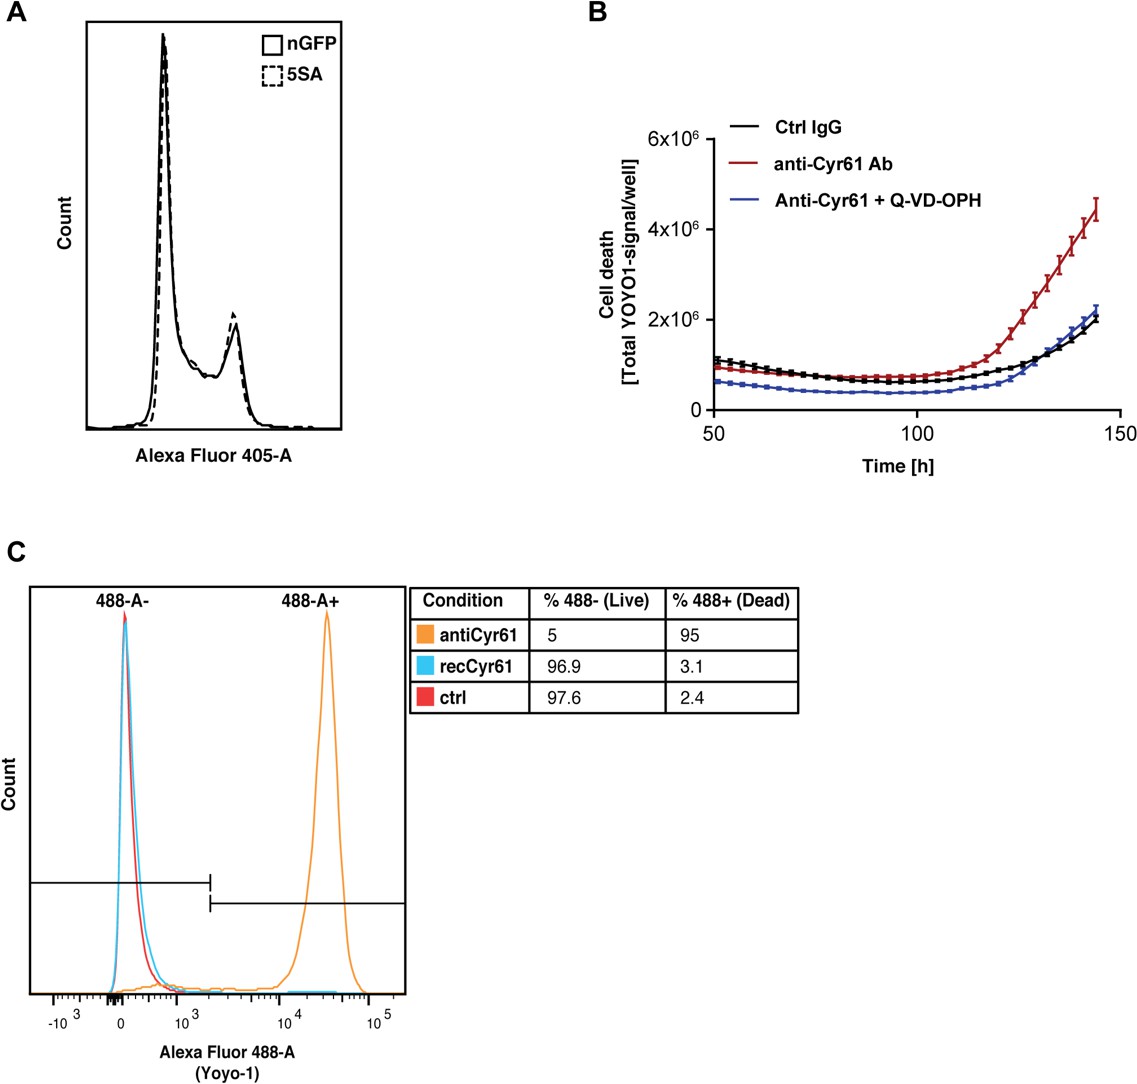
CYR61 affects cell proliferation and death at high density.
(A) FlipinTrex-239 cells expressing YAP5SA (5SA) or nuclear GFP (nGFP) were seeded at a density of 107 cells per 10 cm dish which is equivalent to the number of cells on a fully confluent dish. ~24 hr later, cells were trypsinized, treated with the cell-permeable DNA dye Hoechst 3342, and analyzed on a LSRII. The distribution of FlipinTrex-293 cells in the different cell cycle phases is comparable between these cultures. (B) Cells were seeded in the presence of 50 nM of the green fluorescent, non-cell permeable DNA dye YOYO-1; 10 μg/ml of anti-CYR61 or polyclonal rabbit IgG as a conrol; and 10 μM of the anti-apoptotic peptide Q-VD-OPH. Cell death increases as cell density increases as indicated by the increase in green fluorescent signal per well. Cell death is exacerbated in the presence of anti-Cyr61, and can be restored to control levels in the presence of the anti-apoptotic peptide Q-VD-OPH. (C) FlipinTrex-293 cells were cultured at high density cultures in the presence of YOYO-1 and treated with 10 μg/ml of anti-Cyr61/IgG or 1 μg/ml of recombinant CYR61 for 6 days. By that time, most of the cells treated with anti-CYR61 are mostly dead, while IgG controls and those treated with recombinant CYR61 are mostly alive.
Author response image 1
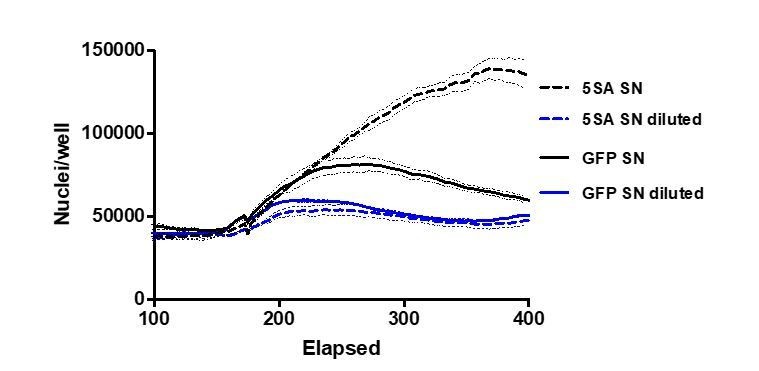
1 pt lines reflect the mean and 0.25 pt lines are ± SEM.
Additional files
-
Supplementary file 1
Table with protein and mRNA changes.
- https://cdn.elifesciences.org/articles/53404/elife-53404-supp1-v4.xlsx
-
Transparent reporting form
- https://cdn.elifesciences.org/articles/53404/elife-53404-transrepform-v4.docx
Download links
A two-part list of links to download the article, or parts of the article, in various formats.
Downloads (link to download the article as PDF)
Open citations (links to open the citations from this article in various online reference manager services)
Cite this article (links to download the citations from this article in formats compatible with various reference manager tools)
YAP regulates cell size and growth dynamics via non-cell autonomous mediators
eLife 9:e53404.
https://doi.org/10.7554/eLife.53404


