LAR receptor phospho-tyrosine phosphatases regulate NMDA-receptor responses
- Howard Hughes Medical Institute, Stanford University School of Medicine, United States
Figures
Figure 1
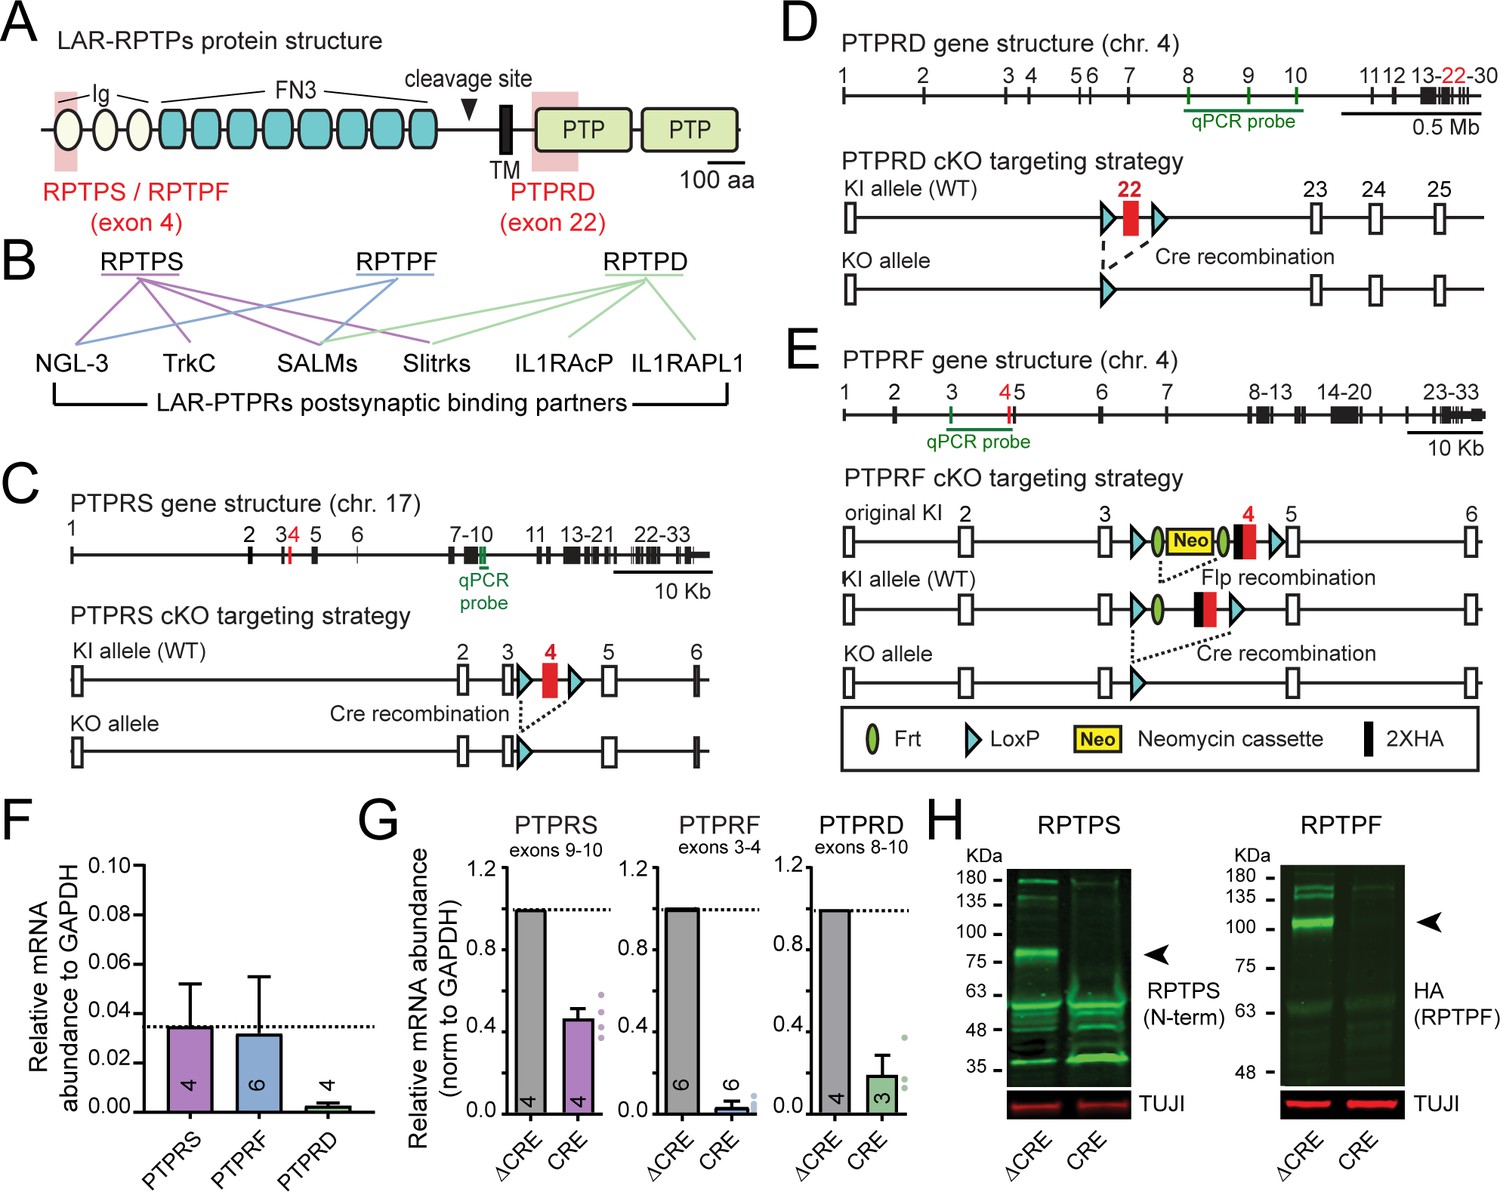
Targeting strategy and validation of LAR-PTPR conditional KO mice.
(A) Schematic of LAR-RPTPs. Shaded red areas show regions targeted in the cKO mice (Ig, immunoglobulin domain; FN3, fibronectin type three repeat; TM, transmembrane region; PTP, phospho-tyrosine phosphatase domain). (B) Schematic of trans-synaptic interactions of LAR-RPTPs (Um and Ko, 2013). (C–E) Gene structure and targeting strategy for PTPRS (C) (Bunin et al., 2015), PTPRD (D) (Farhy-Tselnicker et al., 2017), and PTPRF cKO mice that were generated for this project (E). Note that the targeted exons are shown in red and the exons amplified by the RT-PCR probes used in Figure 1F are shown in green. (F) mRNA abundance (normalized to GAPDH) of PTPRS, PTPRF, and PTPRD as determined by RT-PCR in wildtype cultured hippocampal neurons. (G) Effect of Cre-dependent deletion of PTPRS, PTPRF and PTPRD on their mRNA level in hippocampal cultures from PTPRS, PTPRF and PTPRD cKO mice, validating the targeting strategy. Note that although the PTPRS cKO completely ablates RPTPS protein expression because deletion of exon 4 causes a frameshift in the mRNA, the PTPRS mRNA levels are reduced by 50% upon cre recombination, because non-sense mediated decay only partially decreases the mRNA levels for this gene. Quantitative data are means ± SEMs. (H) Immunoblot for PTPRS (left) and PTPRF (middle) validating the cKO strategy (black arrowheads indicate the specific bands for PTPRS and PTPRF ectodomains).
Figure 2
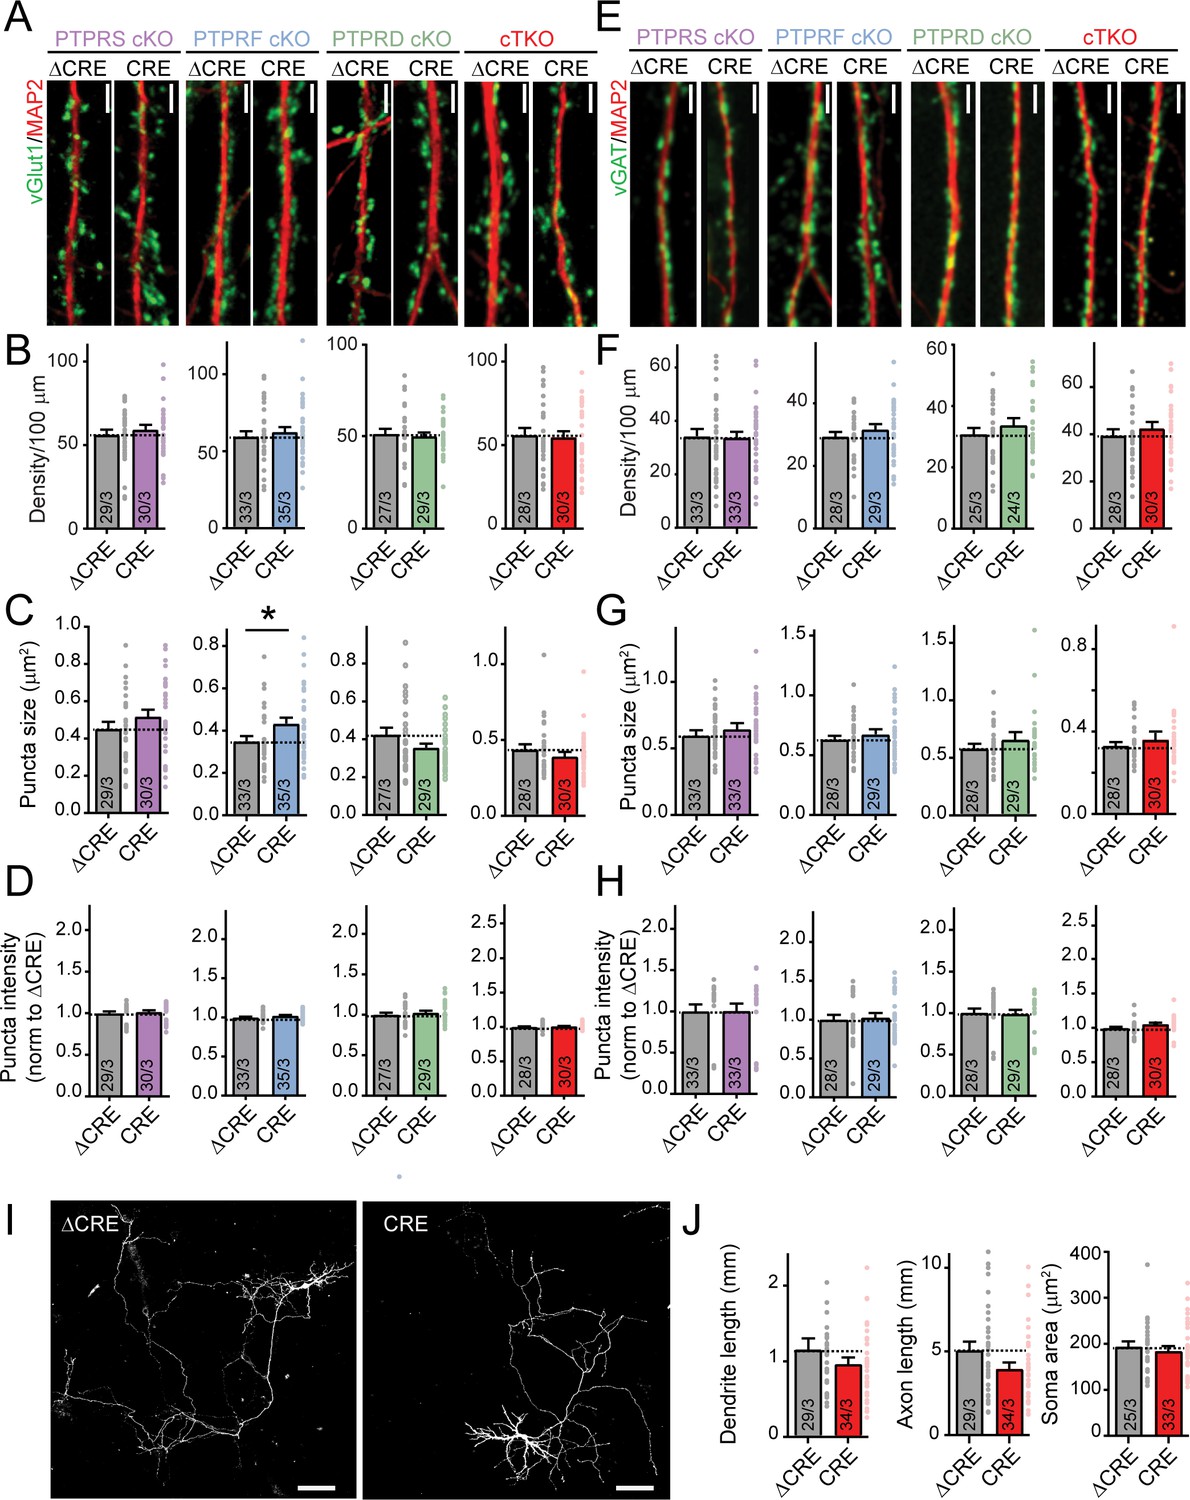
Deletion of LAR-RPTPs does not decrease synapse numbers or affect neuronal development in cultured hippocampal neurons.
All experiments were performed with hippocampal neurons cultured from single PTPRS, PTPRF, or PTPRD cKO mice or triple LAR-RPTP cKO mice. Neurons were infected with lentiviruses expressing Cre recombinase (CRE) or a non-functional mutant version of Cre recombinase (ΔCRE, used as control). (A) Representative images of dendrites stained for an excitatory synaptic marker (vGlut1, green; MAP2 in red was used to visualize dendrites). Scale bar, 10 μm. (B–D) Quantifications of excitatory synapse density (B), puncta size (C) and puncta intensity (D). (E) Representative images of dendrites stained for an inhibitory synaptic marker (vGAT, green; MAP2 in red was used to visualize dendrites). Scale bar, 10 μm. (F–H) Quantifications of inhibitory synapse density (F), puncta size (G) and puncta intensity (H). (I) Representative images of individually transfected hippocampal neurons from LAR-RPTP triple cKO mice. Scale bar, 100 μm. (J) Summary graphs of dendrite, axon, and soma sizes as a function of the LAR-RPTP triple deletion. All data are means ± SEMs. Data comparing two conditions were analyzed by two-tailed unpaired Student’s t-test (for B, PTPRS p=0.4667, ΔCRE n = 29/3, CRE n = 30/3; PTPRF p=0.5335, ΔCRE n = 33/3, CRE n = 35/3; PTPRD p=0.7261, ΔCRE n = 27/3, CRE n = 29/3; LAR-RPTP triple cKO mice p=0.8057, ΔCRE n = 28/3, CRE n = 30/3; for C, PTPRS p=0.2187, ΔCRE n = 29/3, CRE n = 30/3; for PTPRF *p=0.0253, ΔCRE n = 33/3, CRE n = 35/3; for PTPRD p=0.0958, ΔCRE n = 27/3, CRE n = 29/3; LAR-RPTP triple cKO mice p=0.3063, ΔCRE n = 28/3, CRE n = 30/3; for D, PTPRS p=0.6450, ΔCRE n = 29/3, CRE n = 30/3; PTPRF p=0.1505, ΔCRE n = 33/3, CRE n = 35/3; PTPRD p=0.4879, CRE n = 27/3, CRE n = 29/3; LAR-RPTP triple cKO mice p=0.4885, ΔCRE n = 28/3, CRE n = 30/3; for F, PTPRS p=0.8812, ΔCRE n = 33/3, CRE n = 33/3; PTPRF p=0.3262, ΔCRE n = 28/3, CRE n = 29/3; PTPRD p=0.3471, ΔCRE n = 25/3, CRE n = 24/3; LAR-RPTP triple cKO mice p=0.4300, ΔCRE n = 28/3, CRE n = 30/3; for G, PTPRS p=0.3232, ΔCRE n = 33/3, CRE n = 33/3; PTPRF p=0.1396, ΔCRE n = 28/3, CRE n = 29/3; PTPRD p=0.3039, CRE n = 25/3, CRE n = 24/3; LAR-RPTP triple cKO mice p=0.3876, ΔCRE n = 28/3, CRE n = 30/3; for H, PTPRS p=0.8706, ΔCRE n = 33/3, CRE n = 33/3; PTPRF p=0.7720, ΔCRE n = 28/3, CRE n = 29/3; PTPRD p=0.8650, ΔCRE n = 25/3, CRE n = 24/3, LAR-RPTP triple cKO mice p=0.0824, ΔCRE n = 28/3, CRE n = 30/3; for J, ΔCRE n = 29/3, CRE n = 34/3, p=0.5197 for dendrite length, p=0.0780 for axon length, ΔCRE n = 25/3, CRE n = 33/3, p=0.5488 for soma area).
Figure 3
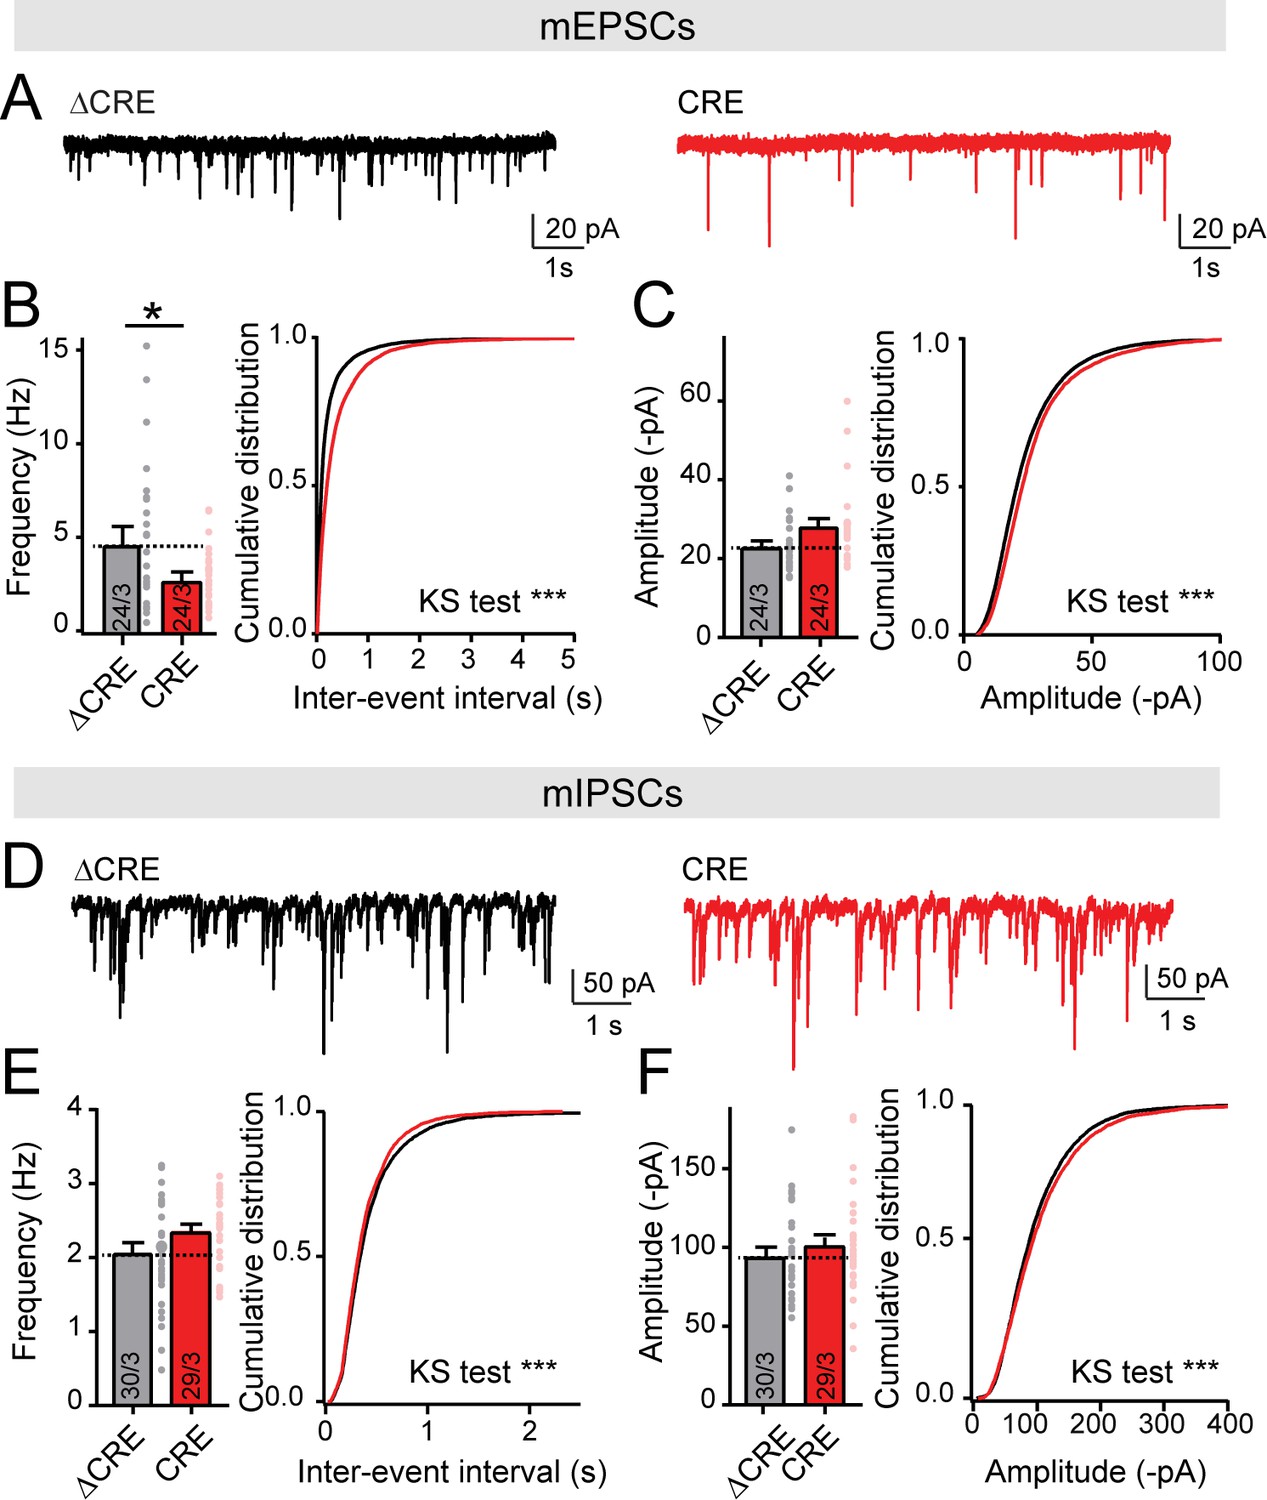
Deletion of LAR-RPTPs decreases mEPSCs frequency, but does not change mIPSCs frequency nor amplitude.
All experiments were performed with hippocampal neurons cultured from triple LAR-RPTP cKO mice. Neurons were infected with lentiviruses expressing Cre recombinase (CRE) or a non-functional mutant version of Cre recombinase (ΔCRE, used as control). (A–C) mEPSCs recordings in hippocampal cultures from LAR-PTPR triple cKO mice (A, representative traces; B, summary graph and cumulative plot for frequency; C, summary graph and cumulative plot for amplitude). (D–F) Same as A-C for mIPSCs (D, representative traces; E, summary graph and cumulative plot for frequency; F, summary graph and cumulative plot for amplitude). All data are means ± SEMs. Data comparing two conditions were analyzed by two-tailed unpaired Student’s t-test (for B, ΔCRE n = 24/3, CRE n = 24/3, *p=0.0384; for C, ΔCRE n = 24/3, CRE n = 24/3, p=0.0581; for E, ΔCRE n = 30/3, CRE n = 29/3, p=0.0697; for F, ΔCRE n = 30/3, CRE n = 29/3, p=0.3837). For cumulative plots statistical comparisons were performed using Kolmogorov-Smirnov (KS) tests (for B, ***p<0.0001; for C, ***p<0.0001; for E, ***p=0.0001; for F, ***p=0.0005).
Figure 4 with 1 supplement
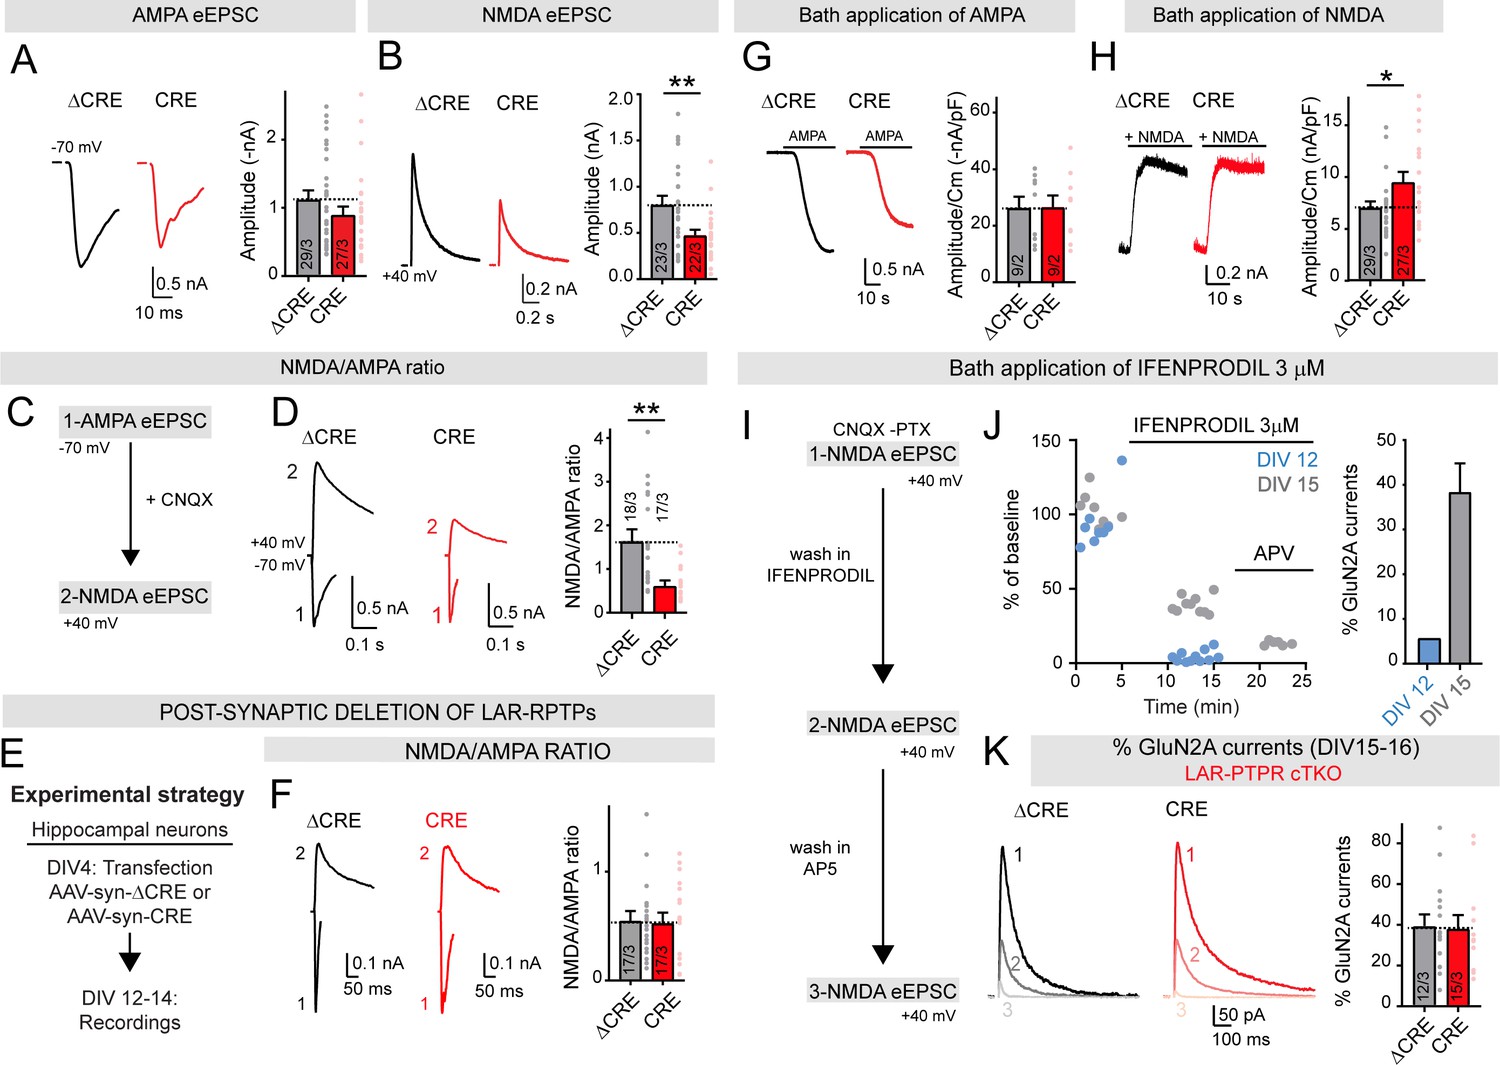
Deletion of LAR-RPTPs suppresses synaptic NMDAR- but not AMPAR-mediated responses in cultured hippocampal neurons.
All experiments were performed with hippocampal neurons cultured from triple LAR-RPTP cKO mice. Neurons were infected with lentiviruses expressing Cre recombinase (CRE) or a non-functional mutant version of Cre recombinase (ΔCRE, used as control). (A) AMPAR-EPSC amplitudes recorded at −70 mV in presence of PTX are not significantly altered by deletion of all three LAR-RPTPs (left, representative traces; right, summary graphs). (B) NMDAR-EPSC amplitudes recorded at +40 mV in presence of PTX and CNQX are decreased by deletion of all three LAR-RPTPs (left, representative traces; right, summary graphs). (C) Experimental strategy for recording the NMDA/AMPA ratio in hippocampal cultures from triple LAR-RPTP cKO mice infected with ΔCRE (WT) or CRE (KO). (D) NMDAR/AMPAR-EPSC ratios are suppressed by deletion of LAR-RPTPs. AMPAR-EPSCs were recorded at −70 mV in the presence of PTX, and NMDAR-EPSCs were then recorded at +40 mV in the presence of CNQX (left, representative traces; right, summary graphs). (E) Experimental strategy for post-synaptic deletion of LAR-RPTPs in hippocampal cultures. Cultures were sparsely transfected with AAV-synapsin-ΔCRE-EGFP or AAV-synapsin-CRE plasmids at DIV4. Transfected cells expressing EGFP were patched at DIV12-14. (F) NMDA/AMPA ratio in EGFP positive neurons, expressing Cre or ΔCre recombinase, showing that post-synaptic deletion of LAR-RPTPs does not impair AMPAR- or NMDAR-mediated EPSCs. (G) AMPAR-responses elicited by bath-applied AMPA (1 μM) are unchanged by deletion of LAR-RPTPs (left, representative traces; right, summary graphs of peak current densities). (H) NMDAR-responses elicited by bath-applied NMDA (10 μM) and glycine (10 μM) are increased by deletion of LAR-RPTPs (left, representative traces; right, summary graphs of peak current densities). (I–K) Effect of a bath application of 3 μM Ifenprodil, a specific GluN2B blocker, on control hippocampal cultures at different maturation stages (DIV12, blue or DIV15, grey). (I) Schematic of experimental procedures: whole-cell recordings of hippocampal neurons were performed in the presence of CNQX and PTX in the bath to isolate NMDAR-EPSCs that were recorded at +40 mV. Ifenprodil (3 μM) and AP5 were sequentially added to the bath and NMDAR-EPSCs were recorded. (J) Sample traces of NMDAR-EPSCs (% of baseline) as a function of time. Application of Ifenprodil completely blocked NMDAR currents at DIV12 (in blue), but only partially reduced NMDAR currents at DIV15 (in grey), confirming that with maturation neurons switched from GluN2B only containing NMDARs to GluN2A containing NMDARs. Subsequent application of AP5 completely inhibited NMDAR-EPSCs at DIV15; right summary graph depicts the percentage of GluN2A currents at DIV 12 and DIV15. (K) Reduction of NMDAR-EPSCs induced by Ifenprodil was unchanged upon deletion of LAR-RPTPs, suggesting that the NMDAR composition does not depend on LAR-RPTPs. All data are means ± SEMs. Data comparing two conditions were analyzed by two-tailed unpaired Student’s t-test (for A, ΔCRE n = 29/3, CRE n = 27/3, p=0.1993; for B, ΔCRE n = 23/3, CRE n = 22/3, **p=0.0057; for D, ΔCRE n = 18/3, CRE n = 17/3, **p=0.0010; for F, ΔCRE n = 17/3, CRE n = 17/3, p=0.8726; for G, ΔCRE n = 9/2, CRE n = 9/2, p=0.9682; for H, ΔCRE n = 25/3, CRE n = 20/3, *p=0.0212, for K, ΔCRE n = 12/3, CRE n = 15/3, p=0.8891).
Figure 4—figure supplement 1
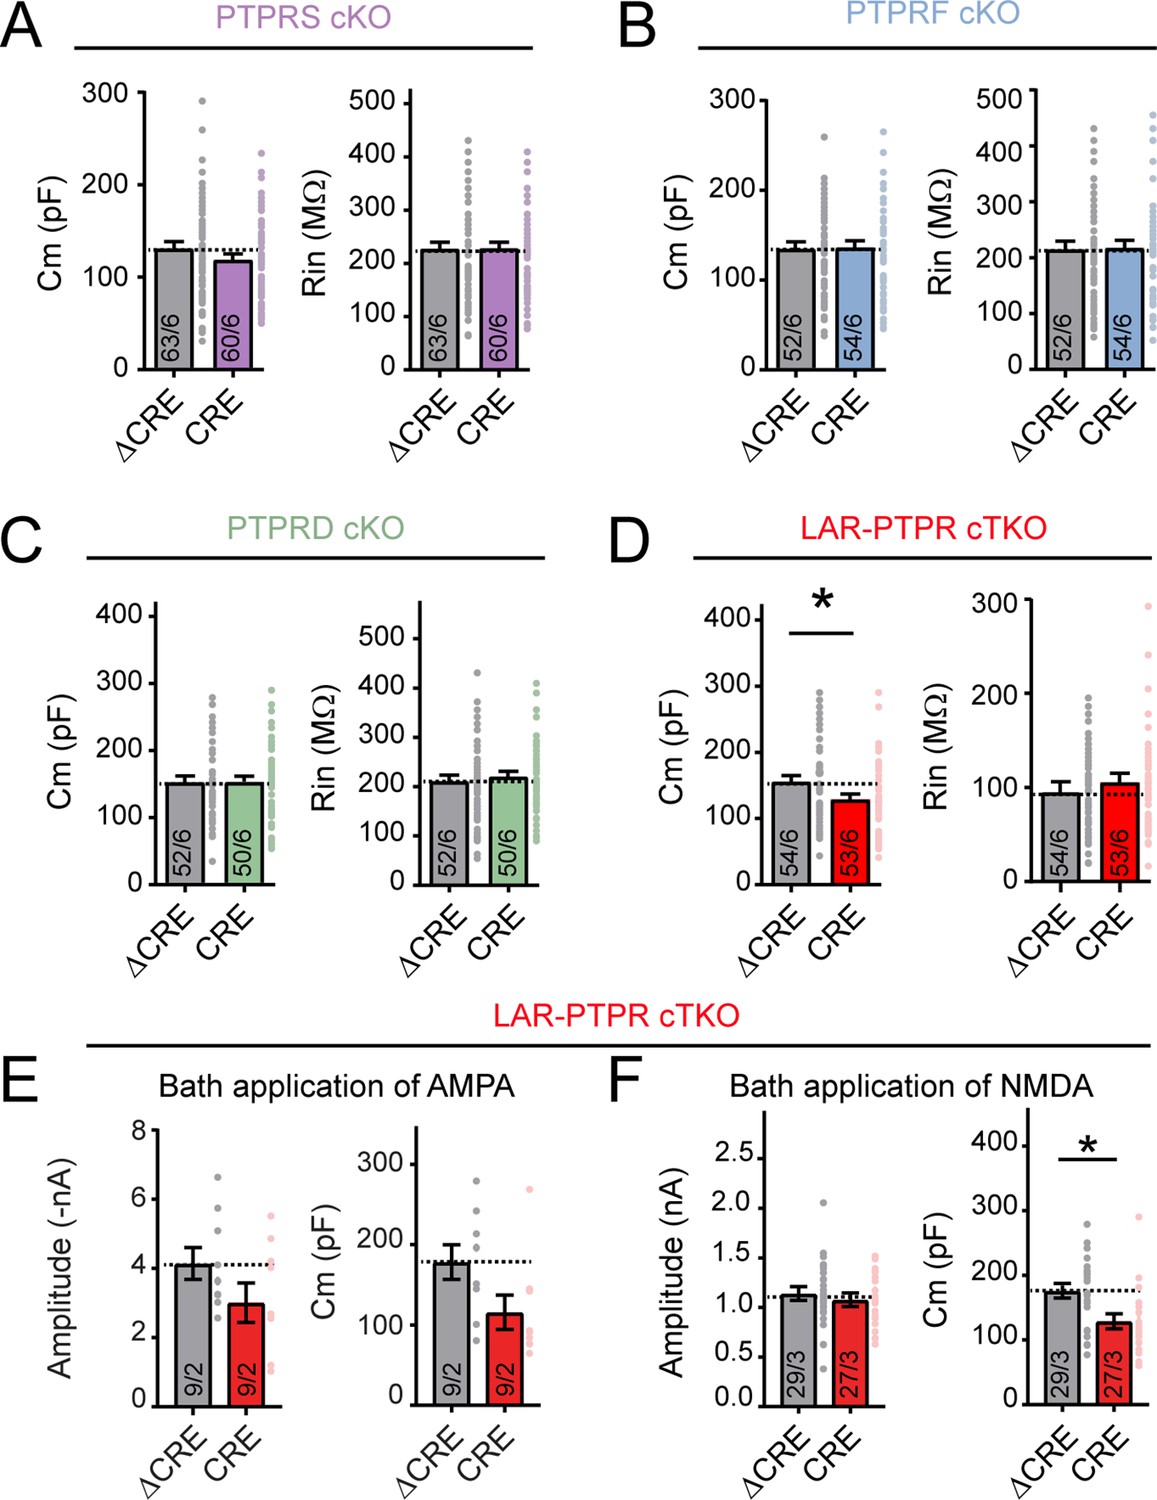
Triple deletion of LAR-RPTPs causes a modest reduction in the cell capacitance but not in the input resistance of cultured hippocampal neurons.
(A–D) Capacitance (Cm, left) and input resistance measurements (Rin, right) for hippocampal neurons from PTPRS (A), PTPRF (B), PTPRD (C) single cKO mice and LAR-PTPR triple cKO mice (D). All experiments were performed with hippocampal neurons cultured from LAR-PTPR cKO mice. Neurons were infected with lentiviruses expressing Cre recombinase (CRE) or a non-functional mutant version of Cre recombinase (ΔCRE, used as control). (E) Right, summary plot of the amplitude of AMPA responses elicited by bath application of AMPA; left, summary plot of the capacitance measurement (related to Figure 4G). (F) Right, summary plot of the amplitude of NMDA responses elicited by bath application of NMDA; left, summary plot of the capacitance measurement (referred to Figure 4H). Graphs show means ± SEM. Statistical comparisons were performed using two-tailed unpaired Student’s t-tests for graphs (for A, ΔCRE n = 63/6, CRE n = 60/6, p=0.1941 for Cm and p=0.9615 for Rin; for B, ΔCRE n = 52/6, CRE n = 54/6, p=0.8888 for Cm and p=0.8885 for Rin; for C, ΔCRE n = 52/6, CRE n = 50/6, p=0.9755 for Cm and p=0.5688 for Rin; for D, ΔCRE n = 54/6, CRE n = 53/6, *p=0.0265 for Cm and p=0.4243 for Rin; for E, ΔCRE n = 9/2, CRE n = 9/2, p=0.1437 for amplitude and ΔCRE n = 9/2, CRE n = 9/2, p=0.0561 for Cm; for F, ΔCRE n = 29/3, CRE n = 27/3, p=0.5296 for amplitude and ΔCRE n = 29/3, CRE n = 27/3, **p=0.0063 for Cm).
Figure 5
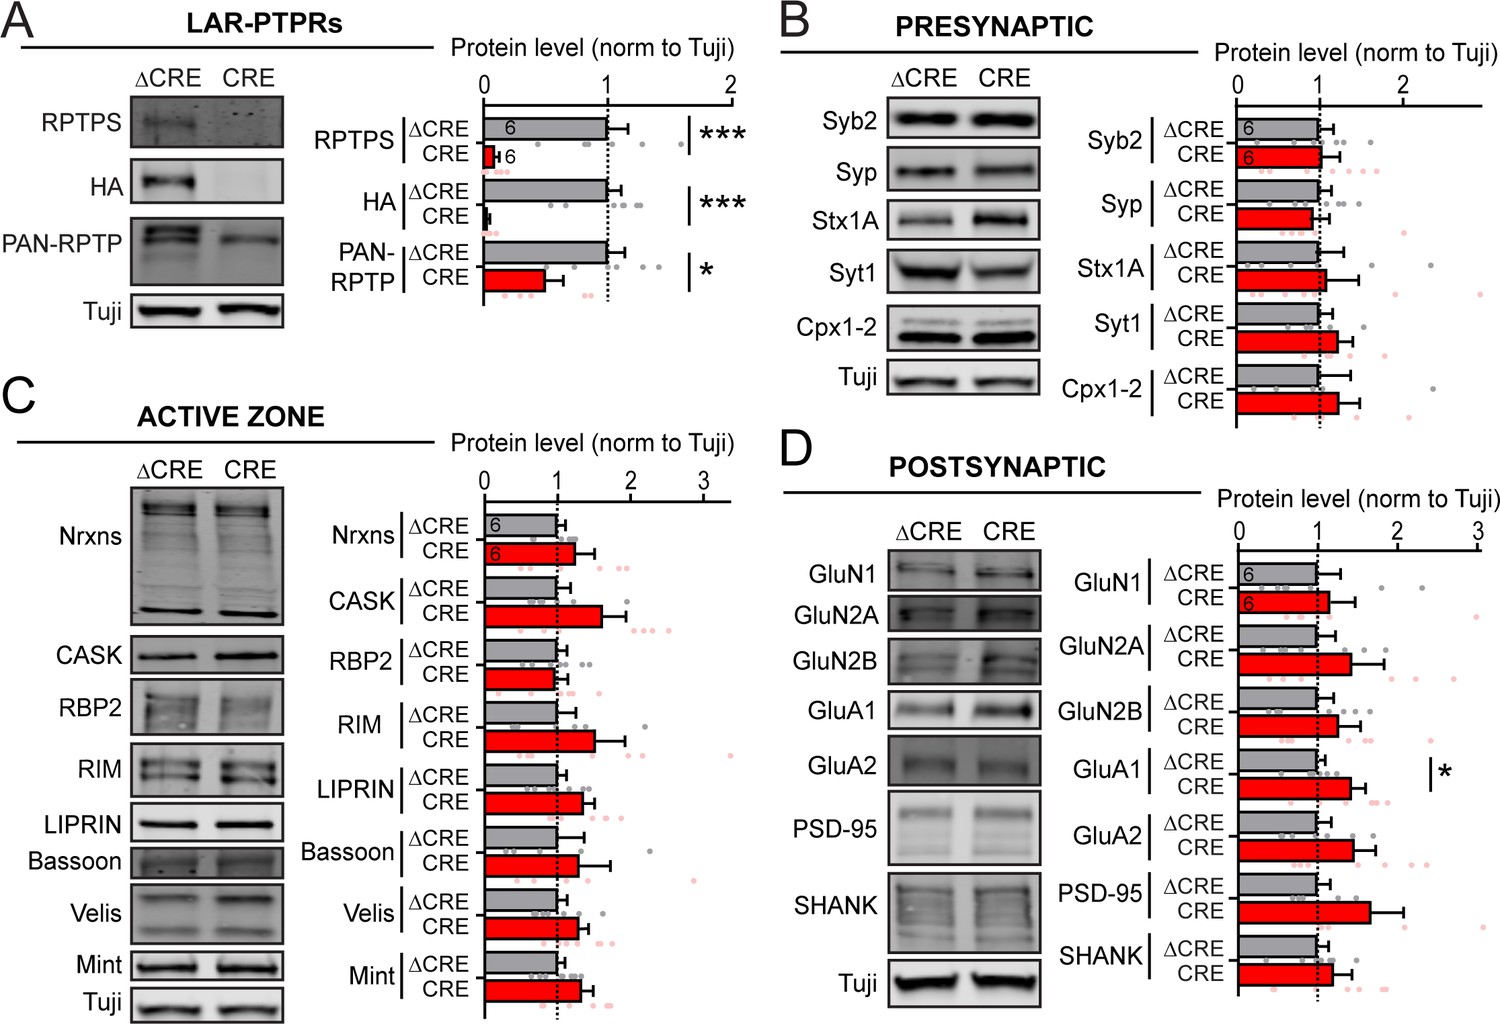
Global deletion of LAR-RPTPs does not significantly change the levels of pre- or postsynaptic proteins, including those of NMDARs and AMPARs.
All experiments were performed with hippocampal neurons cultured from triple LAR-RPTP cKO mice. Neurons were infected with lentiviruses expressing Cre recombinase (CRE) or a non-functional mutant version of Cre recombinase (ΔCRE, used as control). (A–D) Representative images of immunoblots (left in each panel) and summary graphs of protein levels (normalized for controls) obtained in hippocampal neurons cultured from LAR-RPTP triple cKO mice. Neurons were infected with lentiviruses expressing Cre or ΔCre at DIV4 as described above, and analyzed at DIV12-14. Proteins are organized into groups comprising LAR-RPTPs (A) and marker proteins for presynaptic (B), active zone (C), and postsynaptic (D) specializations. Graphs show means ± SEM. Statistical significance was assessed with the two-tailed unpaired Student’s t-test (ΔCRE n = 6, CRE n = 6, *p<0.05, ***p<0.001).
Figure 6 with 1 supplement
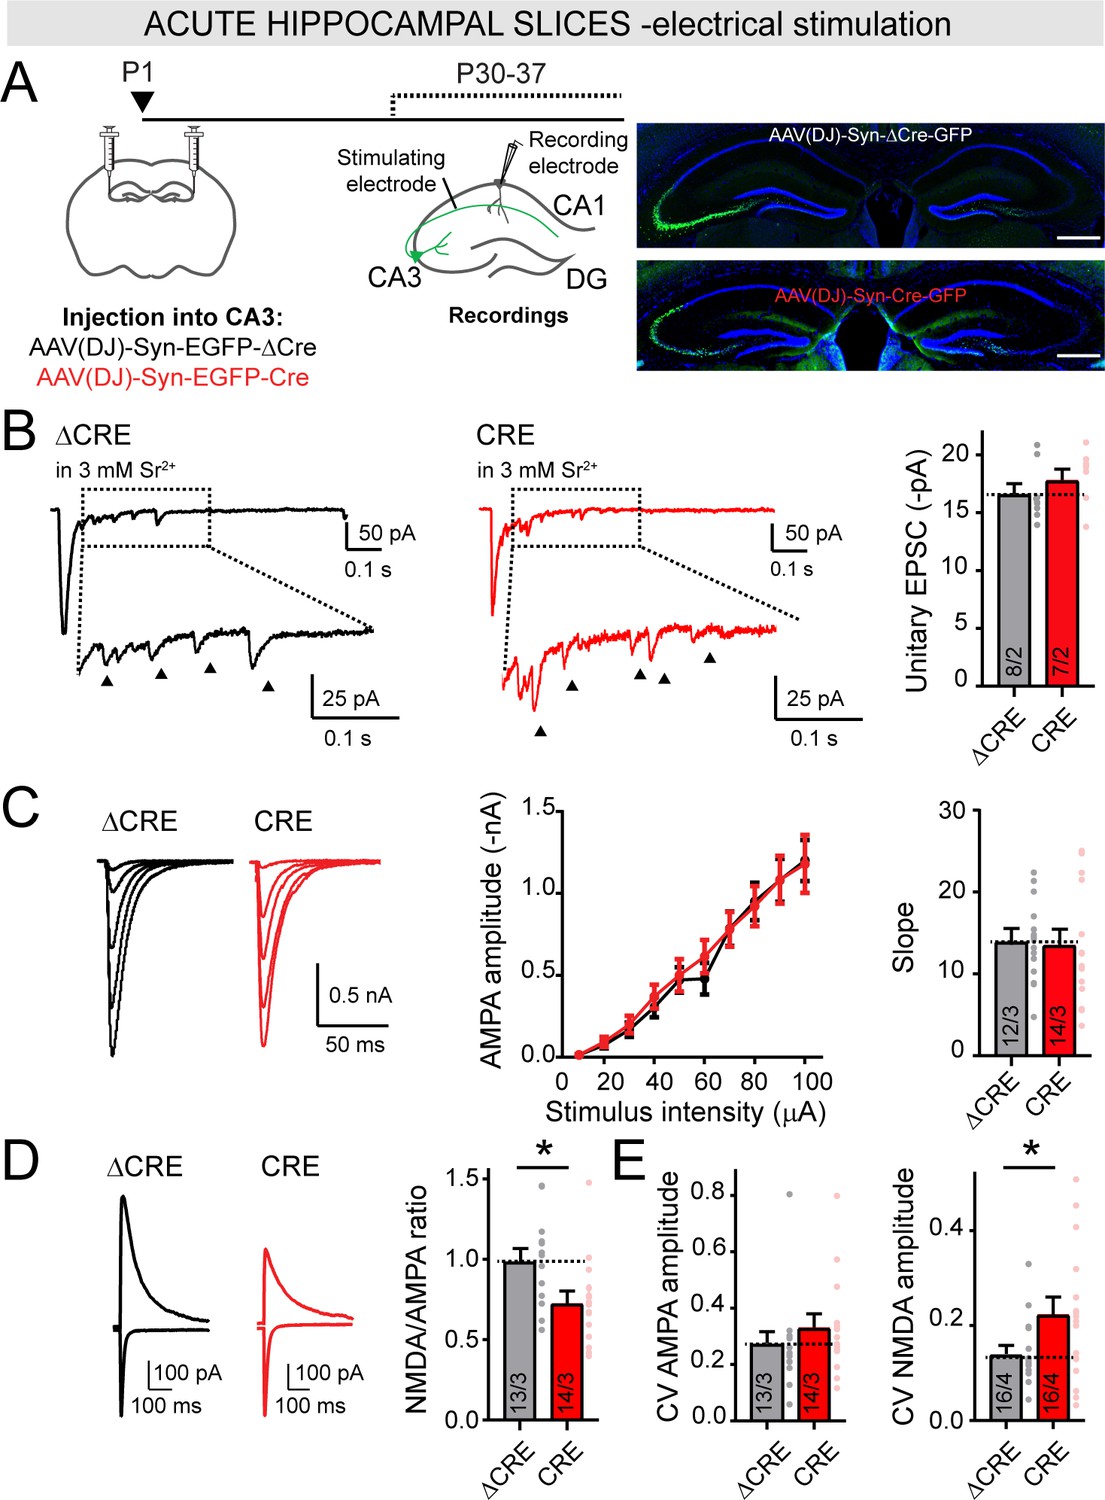
Deletion of LAR-RPTPs in vivo selectively decreases the NMDAR-/AMPAR-EPSC ratio at Schaffer collateral synapses in the hippocampus without affecting AMPAR-mediated synaptic connectivity.
(A) Schematic of experimental strategy for panels B-E (left), and representative images of injection sites in the CA3 region of the hippocampus (right; scale bar = 0.5 mm). The CA3 region of newborn littermate LAR-RPTP triple cKO mice was stereotactically infected with AAVs expressing ΔCre (as a control) or Cre, and Schaffer-collateral EPSCs elicited by electrical stimulation were recorded from CA1 neurons at P30-37. (B) AMPAR-mediated unitary EPSCs elicited by electrical stimulation of Schaffer collaterals in the presence of 3 mM Sr2+ extracellularly (0 Ca2+) are not altered by the deletion of LAR-RPTPs. EPSC peak amplitude (showed by arrows) was analyzed within 50–500 ms after the stimulation (dotted box). Results confirm that removal of LAR-RPTPs does not affect post-synaptic AMPAR amplitudes. (C) Input-output curves of AMPAR-EPSCs confirm that AMPAR-mediated synaptic connectivity is not affected by deletion of LAR-RPTPs from CA3 neurons. (D) Presynaptic LAR-RPTP deletion suppresses the NMDA/AMPA ratio (left, representative traces; right, summary graph). The peak amplitudes of AMPAR-EPSCs were recorded at −70 mV in PTX, and composite AMPAR- and NMDAR-EPSCs were then recorded at +40 mV in the same cells, with the NMDAR-EPSC component quantified at 50 ms after the stimulus. (E) Presynaptic LAR-RPTP deletion has no effect on the coefficient of variation (CV) of AMPAR-EPSCs (left) but cause a modest increase in the CV of NMDAR-EPSCs (right). All data are means ± SEMs. Data comparing two conditions were analyzed by two-tailed unpaired Student’s t-test (for B, ΔCRE n = 8/2, CRE n = 7/2, p=0.3711; for C, ΔCRE n = 12/3, CRE n = 14/3, p=0.8679 for slope; for D, ΔCRE n = 13/3, CRE n = 14/3, *p=0.0246 for NMDA/AMPA ratio; for E, ΔCRE n = 13/3, CRE n = 14/3, p=0.3606 for AMPAR-EPSC CV and ΔCRE n = 16/4, CRE n = 16/4, *p=0.0439 for NMDAR-EPSC CV). Input-output curves were analyzed by two-way ANOVA for repetitive measurements followed by Bonferroni post-hoc test (for C, ΔCRE n = 12/3, CRE n = 14/3, interaction p=0.9833).
Figure 6—figure supplement 1

LAR-RPTPs are highly expressed in hippocampal pyramidal neurons (A), and in vivo deletion of LAR-RPTPs does not significantly affect the frequency or amplitude of spontaneous EPSCs monitored in acute slices (B–C).
(A) Expression levels of LAR-RPTP mRNAs in hippocampal neurons, from single cell expression profile database (http://dropviz.org/). For CA3 pyramidal neurons, we averaged data from clusters HC_6–1, HC_6–2, HC_6–4, HC_6–7, HC_6–8; for CA1 pyramidal neurons, HC_5–22, HC_5–3, HC_5–4, HC_5–5, HC_5–7, HC_5–8; for subiculum, HC_5–14, HC_5–15; for entorhinal cortex, HC_3–4 to HC_3–11 (Saunders et al., 2018). (B–C) sEPSCs recorded in CA1 neurons from LAR-RPTP KO mice (CRE) and control (ΔCRE) at −70 mV holding potentials (B, representative traces, C, cumulative plots and summary graphs for sEPSCs frequency and amplitude). All recordings were performed from patched CA1 neurons in acute slices from 4 to 5 weeks old mice whose CA3 region had been bilaterally infected at P1 with AAVs (see Figure 6A). Data are means ± SEM. Statistical significance was assessed by two-tailed unpaired Student’s t-test (for C, ΔCRE n = 12/3, CRE n = 12/3, p=0.1796 for frequency and p=0.1247 for amplitude). For cumulative plots, statistical comparisons were performed using Kolmogorov-Smirnov (KS) tests (for B, ***p<0.0001 for frequency and p=0.3510 for amplitude).
Figure 7

Optical stimulation of Schaffer collaterals from LAR-PTPR KO mice confirmed a loss of synaptic NMDA receptors, resulting in a decrease of the NMDAR-/AMPAR-EPSC ratio.
(A) Schematic of experimental strategy for panels B-C (left), and representative images of infected slices expressing nuclear EGFP-tagged Cre (green) and tdTomato-tagged ChiEF (red)(right; scale bar = 0.2 mm). The CA3 regions of newborn LAR-RPTP triple cKO mice and unrelated WT mice were infected with two AAVs encoding a. Cre, and b. Cre-dependent ChieF, and Schaffer-collateral EPSCs elicited by optical stimulation were recorded from CA1 neurons at P30-37. (B) Presynaptic LAR-RPTP deletion suppresses the NMDAR-/AMPAR-EPSC ratio (left, representative traces; right, summary graph). Experiments were performed as for Figure 6D, except that optical stimulation was used. (C) Presynaptic LAR-RPTP deletion has no effect on the coefficient of variation (CV) of AMPAR-EPSCs (left) or NMDAR-EPSCs (right) measured in response to optical stimulation. All data are means ± SEMs. Data comparing two conditions were analyzed by two-tailed unpaired Student’s t-test (for B, WT BL6 mice n = 12/3, LAR-RPTP cKO mice n = 14/3, **p=0.0059; for C, WT BL6 n = 12/3, LAR-RPTP cKO mice n = 14/3, p=0.3817 for AMPAR CV, and p=0.1361 for NMDAR CV).
Tables
Key resources table
| Reagent type (species) or resource | Designation | Source or reference | Identifiers | Additional information |
|---|---|---|---|---|
| Strain, strain background (Mus musculus) | PTPRS KO mice | UC Davis KOMP repository | RRID: IMSR_KOMP:CSD76529-1c-Mbp | |
| Strain, strain background (Mus musculus) | PTPRD | Welcome trust Sanger institute | RRID: IMSR_EM:11805 | |
| Strain, strain background (Mus musculus) | PTPRF | Südhof lab | ||
| Strain, strain background (Mus musculus) | C57BL/6J | The Jackson laboratory | RRID: IMSR_JAX:000664 | |
| Strain, strain background (Mus musculus) | ACTB-Flpe | The Jackson laboratory | RRID: IMSR_JAX:005703 | |
| Cell line (include species here) | HEK293T cells | ATCC | RRID: CVCL_0063 | |
| Antibody | Anti-PTPRS | Südhof lab | PAC9986, RRID: AB_2802087 | 1:500 |
| Antibody | Anti-HA | Biolegend | 901515, RRID: AB_2565334 | 1:1000 |
| Antibody | Anti-PAN-RPTP | Neuromab | 75–194, RRID: AB_2174700 | 1:500 |
| Antibody | Anti-Nrxns | Südhof lab | G394, RRID: AB_2800397 | 1:500 |
| Antibody | Anti-CASK | Neuromab | 75–000, RRID: AB_2068730 | 1:1000 |
| Antibody | Anti-RBP2 | Südhof lab | 4193, RRID: AB_2617050 | 1:1000 |
| Antibody | Anti-RIM | Südhof lab | U1565, RRID: AB_2617054 | 1:1000 |
| Antibody | Anti-liprin | Südhof lab | 4396, RRID: AB_2617056 | 1:1000 |
| Antibody | Anti-Bassoon | Synaptic Systems | 141021, RRID: AB_2066979 | 1:1000 |
| Antibody | Anti-Velis | Südhof lab | U049, RRID: AB_2802084 | 1:1000 |
| Antibody | Anti-Mint | Südhof lab | P932, RRID: AB_2802085 | 1:1000 |
| Antibody | Anti-Synaptobrevin 2 | Synaptic Systems | 104211, RRID: AB_887811 | 1:1000 |
| Antibody | Anti-Synaptophysin | Synaptic Systems | 101011, RRID: AB_887824 | 1:1000 |
| Antibody | Anti-Syntaxin | Synaptic Systems | HPC-1, RRID: AB_887843 | 1:1000 |
| Antibody | Anti-Synaptotagmin 1 | Synaptic Systems | 105011, RRID: AB_887832 | 1:1000 |
| Antibody | Anti-Complexin | Südhof lab | L669, RRID: AB_2802086 | 1:1000 |
| Antibody | Anti-GluN1 | Synaptic systems | 114 011, RRID: AB_887750 | 1:1000 |
| Antibody | Anti-GluN2A | Invitrogen | A6473RRID: AB_10376044 | 1:1000 |
| Antibody | Anti- GluN2B | Neuromab | 75–097, RRID: AB_10673405 | 1:1000 |
| Antibody | Anti-GluA1 | Synaptic Systems | 182003, RRID: AB_2113441 | 1:1000 |
| Antibody | Anti-GluA2 | Synaptic Systems | 182103, RRID: AB_2113732 | 1:1000 |
| Antibody | Anti-PSD-95 | Neuromab | 75–028, RRID: AB_2292909 | 1:1000 |
| Antibody | Anti-PAN-SHANK | Neuromab | 75–089, RRID: AB_10672418 | 1:1000 |
| Antibody | Anti-Tubulin | Sigma | T2200, RRID: AB_262133 | 1:5000 |
| Antibody | Anti-vGluT1 | Millipore | AB5905, RRID: AB_2301751 | 1:1000 |
| Antibody | Anti-vGAT | Millipore | AB5062P, RRID: AB_2301998 | 1:1000 |
| Antibody | Anti-MAP2 | Encor Biotech | CPCA-MAP2, RRID: AB_2138173 | 1:500 |
| Antibody | Alexa fluor 546, goat anti mouse IgG | Invitrogen | A-11003, RRID: AB_2534071 | 1:1000 |
| Antibody | Alexa fluor 488, goat anti guinea pig IgG | Invitrogen | A-11073 RRID: AB_2534117 | 1:1000 |
| Antibody | Alexa fluor 633, goat anti mouse IgG | Invitrogen | A-21050 RRID: AB_2535718 | 1:1000 |
| Antibody | IRDye 680LT donkey anti mouse | Licor | 926–68022, RRID: AB_621848 | 1:10000 |
| Antibody | IRDye 680LT donkey anti rabbit | Licor | 926–68023, RRID: AB_10706167 | 1:10000 |
| Antibody | IRDye 800CW donkey anti mouse | Licor | 926–32212, RRID: AB_10715072 | 1:10000 |
| Antibody | IRDye 800CW donkey anti rabbit | Licor | 926–32213, RRID: AB_621848 | 1:10000 |
| Chemical compound, drug | Picrotoxin | Tocris | 1128 | |
| Chemical compound, drug | CNQX | Tocris | 1045 | |
| Chemical compound, drug | AP5 | Tocris | 0106 | |
| Chemical compound, drug | Tetrodotoxin citrate | ARC | 0640 | |
| Chemical compound, drug | Ifenprodil | Tocris | 2892 | |
| Chemical compound, drug | CTZ | Tocris | 0713 | |
| Software, algorithm | Clampfit | Molecular device | N/A | |
| Software, algorithm | Igor Pro | Wavemetrics Inc | RRID:SCR_000325 | |
| Software, algorithm | FIJI | NIH | RRID:SCR_002285 | |
| Software, algorithm | pClamp | Molecular device | RRID:SCR_011323 | |
| Software, algorithm | Prism | Graphpad software inc | RRID: SCR_002798 | |
| Software, algorithm | Image Studio Lite | Licor | RRID: SCR_014211 | |
| Software, algorithm | NIS-elements | Nikon | RRID:SCR_002776 |
Additional files
Download links
A two-part list of links to download the article, or parts of the article, in various formats.
Downloads (link to download the article as PDF)
Open citations (links to open the citations from this article in various online reference manager services)
Cite this article (links to download the citations from this article in formats compatible with various reference manager tools)
LAR receptor phospho-tyrosine phosphatases regulate NMDA-receptor responses
eLife 9:e53406.
https://doi.org/10.7554/eLife.53406


