The histone modification reader ZCWPW1 links histone methylation to PRDM9-induced double-strand break repair
- Center for Reproductive Medicine, Cheeloo College of Medicine, Shandong University, China
- National Research Center for Assisted Reproductive Technology and Reproductive Genetics, Shandong University, China
- Key laboratory of Reproductive Endocrinology of Ministry of Education, Shandong University, China
- Shandong Provincial Clinical Medicine Research Center for Reproductive Health, Shandong University, China
- CAS Key Laboratory of Genome Sciences and Information, Collaborative Innovation Center of Genetics and Development, Beijing Institute of Genomics, Chinese Academy of Sciences, China
- University of Chinese Academy of Sciences, China
- State Key Laboratory of Stem Cell and Reproductive Biology, Institute of Zoology, Chinese Academy of Sciences, China
- CUHK-SDU Joint Laboratory on Reproductive Genetics, School of Biomedical Sciences, Chinese University of Hong Kong, China
- CAS Center for Excellence in Animal Evolution and Genetics, Chinese Academy of Sciences, China
- Shanghai Key Laboratory for Assisted Reproduction and Reproductive Genetics, China
Figures
Figure 1 with 3 supplements
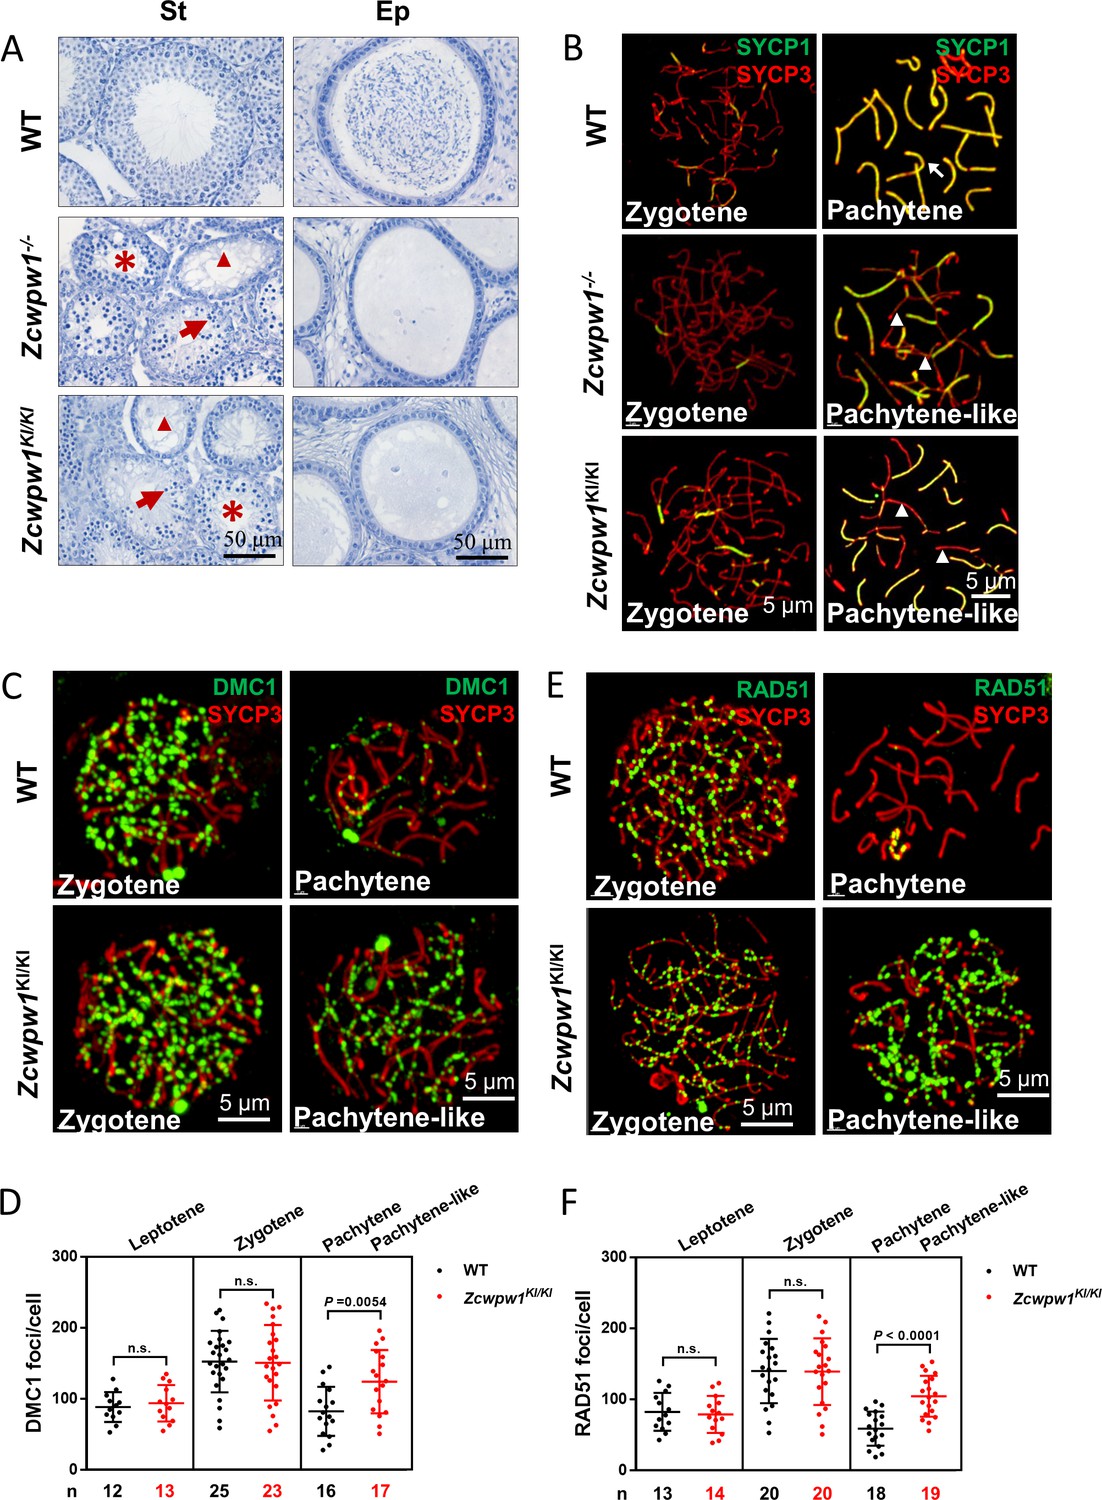
The H3K4me3 reader function of ZCWPW1 is required for synapsis and meiotic recombination.
(A) Hematoxylin staining of adult C57BL/6 wild type, Zcwpw1−/−, and Zcwpw1KI/KI testes (left panel) and epididymides (right panel). Adult Zcwpw1−/− and Zcwpw1KI/KI testis sections showed near complete arrest of spermatogenesis. Arrows, apoptotic spermatocytes; arrowheads, empty seminiferous tubules; asterisks, seminiferous tubules lacking post-meiotic spermatocytes. The spermatogenic arrest led to empty epididymides in adult Zcwpw1−/− and Zcwpw1KI/KI mice. (St) Seminiferous tubules, (Ep) Epididymides. Adult mice (6–8 weeks) with n = 5 for each genotype. (B) Chromosome spreads of spermatocytes from the testes of adult WT (upper panel), Zcwpw1−/− (middle panel), and Zcwpw1KI/KI (lower panel) males were immunostained for the SC marker proteins SYCP1 (green) and SYCP3 (red). The arrow indicates a pachytene spermatocyte in WT mice, with completely synapsed chromosomes, and the arrowheads indicate the pachytene-like spermatocytes in adult Zcwpw1−/− and Zcwpw1KI/KI mice with incompletely synapsed chromosomes. (C) Chromosome spreads of spermatocytes from the testes of adult WT and Zcwpw1KI/KI males were immunostained for DMC1 (green) and SYCP3 (red). Representative images of spermatocytes at zygotene and pachytene in WT and at zygotene and pachytene-like stages in Zcwpw1KI/KI are shown. (D) Each dot represents the number of DMC1 foci per cell, with black dots indicating WT spermatocytes and red dots indicating Zcwpw1KI/KI spermatocytes. Solid lines show the mean and SD of foci number in each group of spermatocytes. P values were calculated by Student’s t-test. N represents the number of cells counted, with black indicating WT spermatocytes and red indicating Zcwpw1KI/KI spermatocytes. (E) Chromosome spreads of spermatocytes from the testes of adult WT and Zcwpw1KI/KI males immunostained for RAD51 (green) and SYCP3 (red). (F) Each dot represents the number of RAD51 foci per cell, with black dots indicating WT spermatocytes and red dots indicating Zcwpw1KI/KI spermatocytes. Solid lines show the mean and SD of the foci number for each group of spermatocytes. P values were calculated by Student’s t test. Adult mice (6–8 weeks) with n = 3 for each genotype.
-
Figure 1—source data 1
Number of DMC1 and RAD51 foci in Figure 1D and F.
- https://cdn.elifesciences.org/articles/53459/elife-53459-fig1-data1-v3.xlsx
Figure 1—figure supplement 1
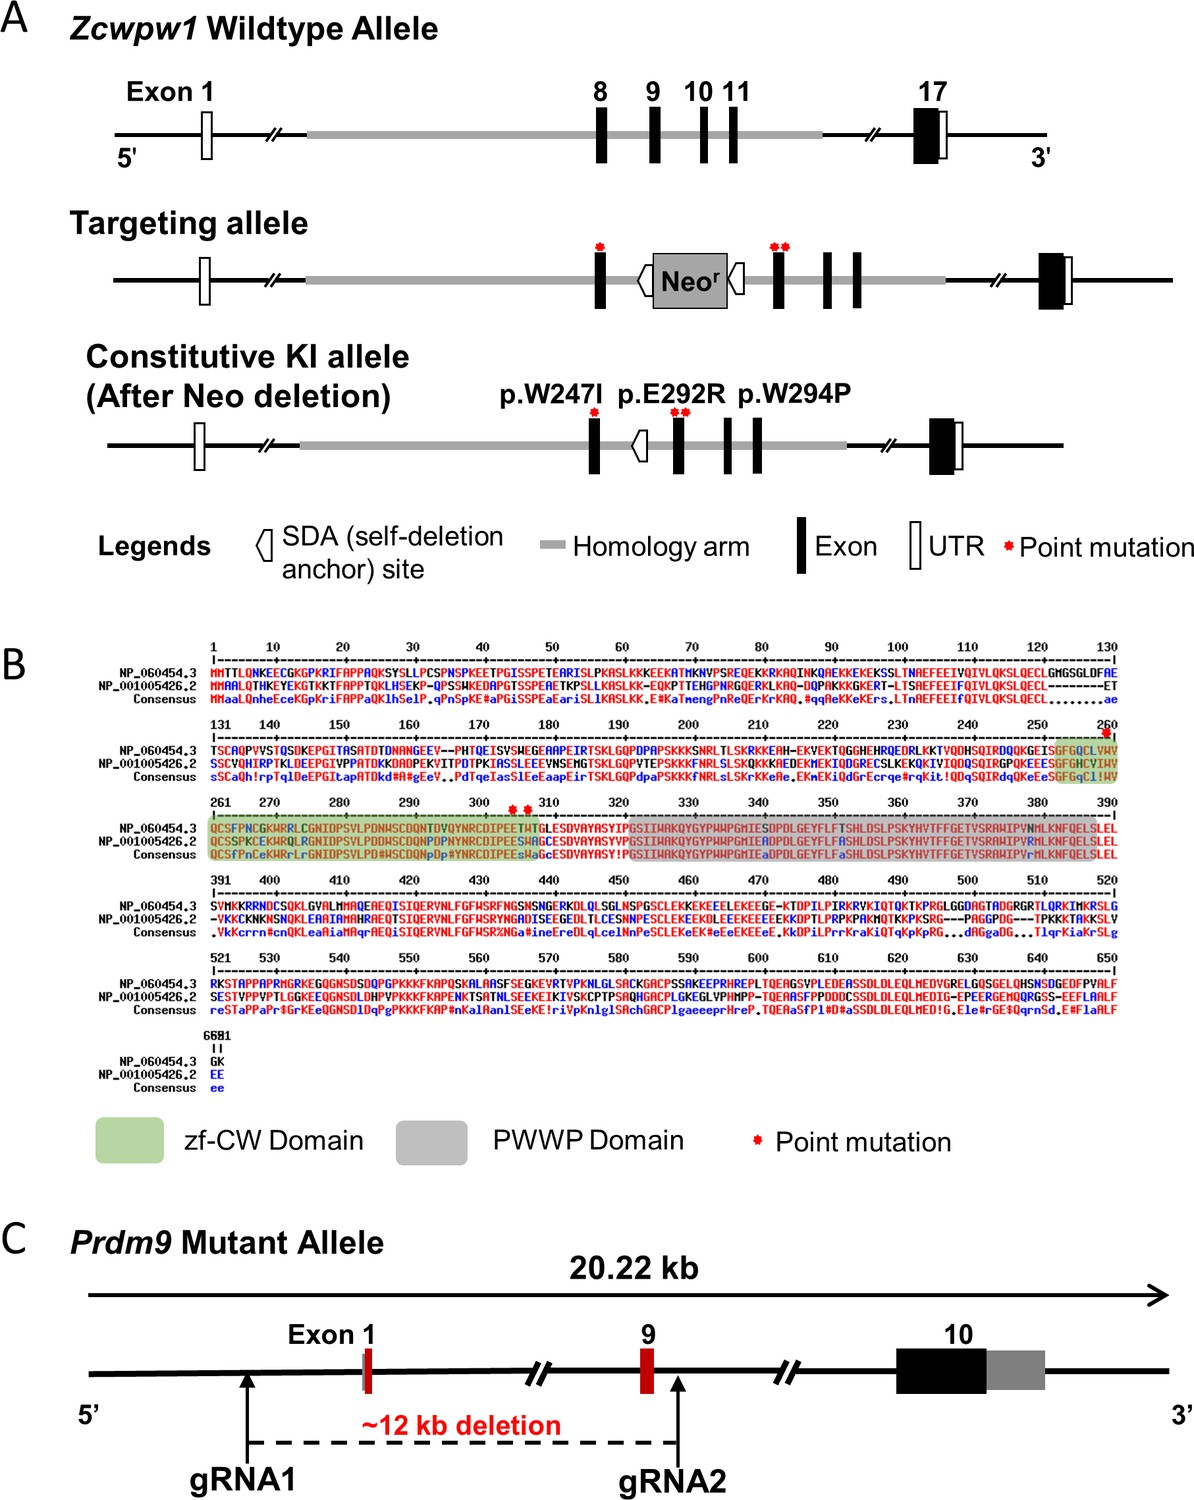
Generation of Zcwpw1 reader-dead-mutant mice and Prdm9 knockout mice.
(A) Schematic representation of the genome editing strategy to generate knock-in Zcwpw1 reader-dead-mutant mice. (B) Sequence alignment of human ZCWPW1 (NP_060454.3) and mouse ZCWPW1 (NP_001005426.2). Conserved regions of ZCWPW1 are indicated by green shaded areas for the zf-CW domain and gray-shaded areas for the PWWP domain. Red asterisks indicate the point mutation sites. (C) Schematic representation of the CRISP-cas9 genome editing strategy used to generate the Prdm9 knockout mice showing the gRNAs (arrows), the corresponding coding exons (black and red thick lines), and the non-coding exons (gray thick lines). Red thick lines (coding exons) represent approximately12 kb deleted from the wild-type Prdm9 allele.
Figure 1—figure supplement 2
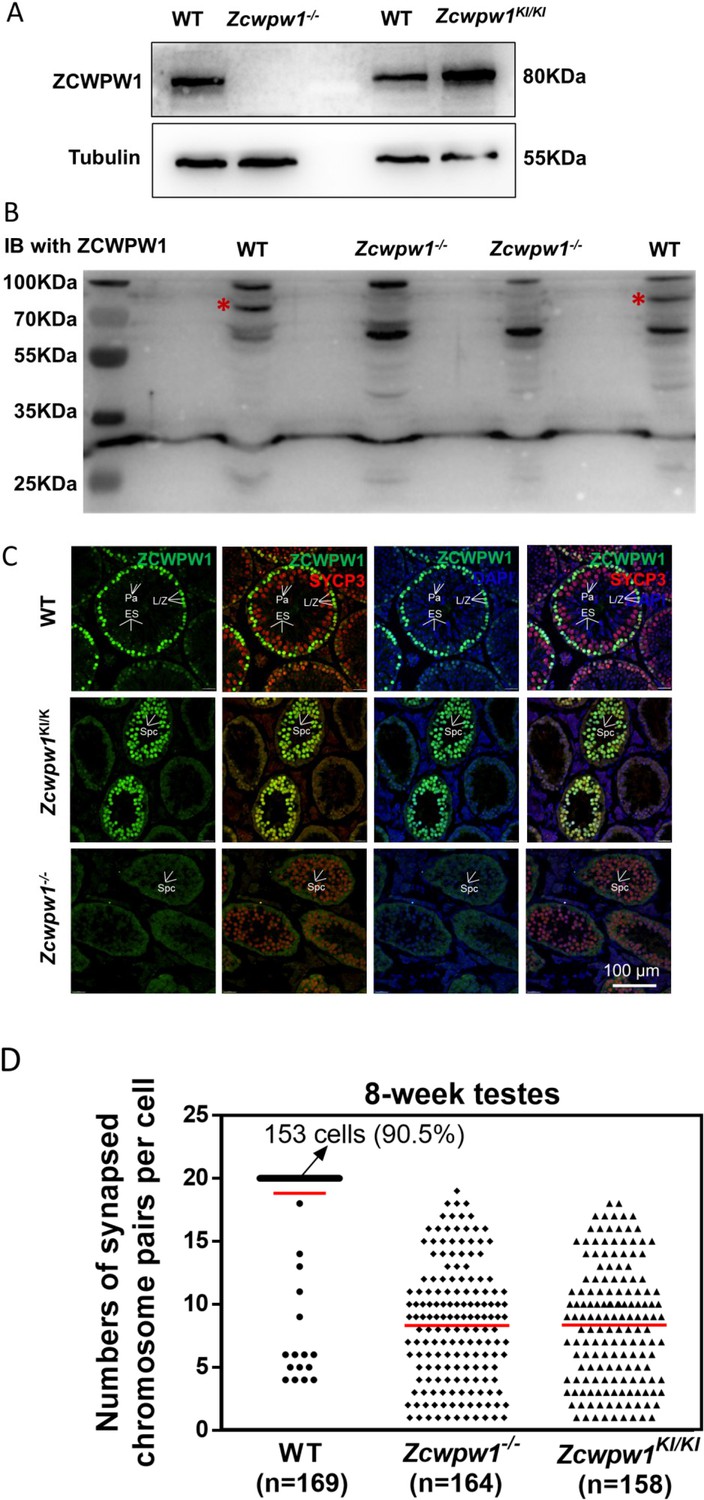
Distribution pattern of ZCWPW1 in WT, Zcwpw1KI/KI and Zcwpw1−/− mice.
(A) Western blots showing that ZCWPW1 was not detected in Zcwpw1−/− testes but was present in WT testes, and with a similarly intense signal for Zcwpw1KI/KI. Tubulin was used as the loading control. The experiments were performed using PD20 mice with n = 3 for each genotype. (B) Western blots using an antibody against ZCWPW1 showing that ZCWPW1 was not detected in Zcwpw1−/− testes but was present in WT testes. Asterisks indicate candidate band for ZCWPW1. (C) Immunofluorescence staining of ZCWPW1 and SYCP3 in WT, Zcwpw1KI/KI and Zcwpw1−/− histological cross-sections. DNA was stained with DAPI. Abbreviations: L/Z, leptotene/zygotene spermatocytes; Pa, pachytene spermatocytes; Spc, spermatocytes; ES, elongated spermatids. (D) The numbers of synapsed chromosome pairs in WT, Zcwpw1−/− and Zcwpw1KI/KI spermatocytes. In Zcwpw1−/− and Zcwpw1KI/KI spermatocytes, the average number of synapsed chromosome pairs was 8. All experiments were performed on adult mice (6–8 weeks old) with n = 3 for each genotype.
-
Figure 1—figure supplement 2—source data 1
Number of synapsed chromosome pairs per cell in Figure 1—figure supplement 2C.
- https://cdn.elifesciences.org/articles/53459/elife-53459-fig1-figsupp2-data1-v3.xlsx
Figure 1—figure supplement 3
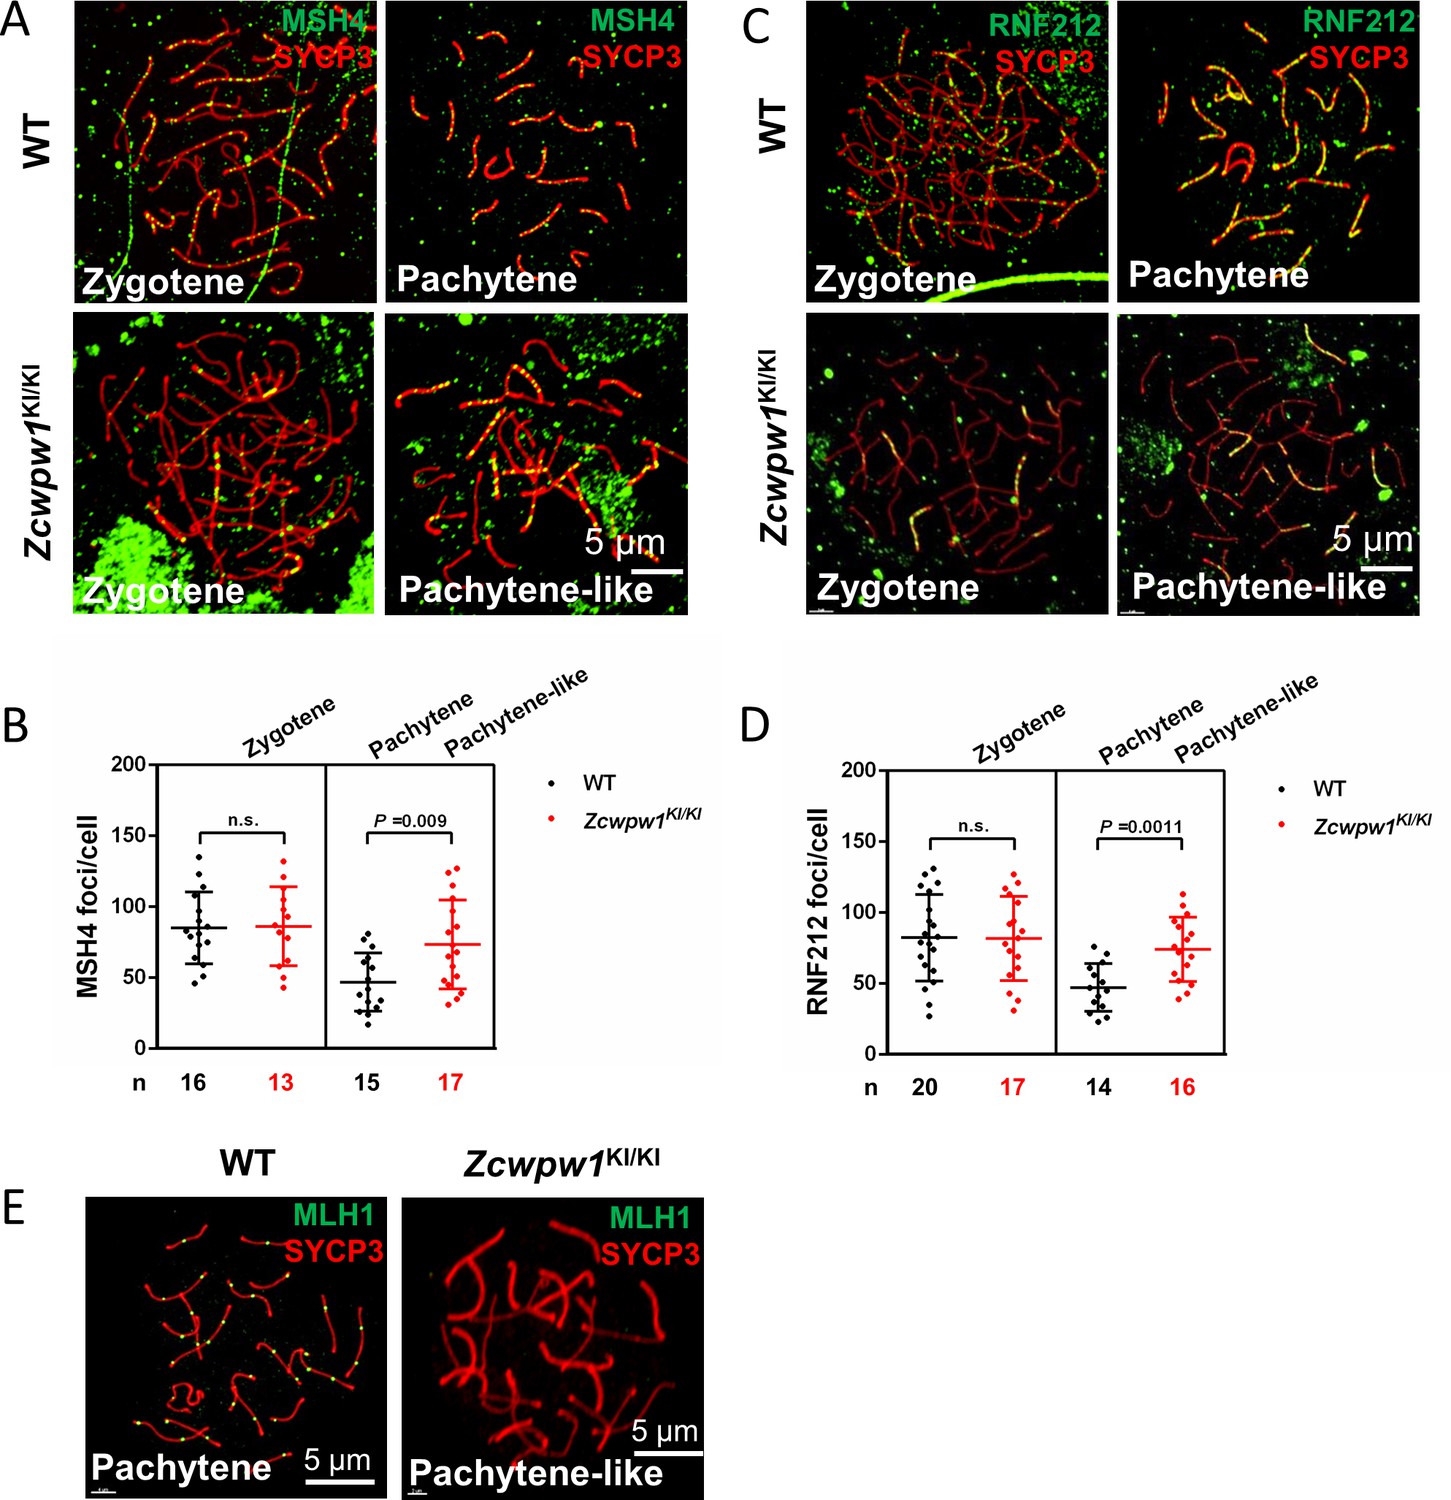
Meiotic recombination defects in Zcwpw1 knock-in mice.
(A) Chromosome spreads of spermatocytes from the testes of adult WT and Zcwpw1KI/KI males immunostained for the recombination factor MSH4 (green) and SYCP3 (red). (B) Each dot represents the number of MSH4 foci per cell. Black dots indicate WT spermatocytes, and red dots indicate Zcwpw1KI/KI spermatocytes. Solid lines show the mean and SD of foci in each group of spermatocytes. P -values were calculated by Student’s t-test. (C) Chromosome spreads of spermatocytes from WT and Zcwpw1KI/KI male mice immunostained for the recombination factor RNF212 (green) and SYCP3 (red). Representative images are shown for spermatocytes at the zygotene, pachytene, and pachytene-like stages of the three genotypes. (D) Each dot represents the number of RNF212 foci per cell, with black dots indicating WT spermatocytes and red dots indicating Zcwpw1KI/KI spermatocytes. Solid lines show the mean and SD of foci number for each group of spermatocytes. P-values were calculated by Student’s t-test. (E) Chromosome spreads of spermatocytes from the testes of adult WT and Zcwpw1KI/KI males immunostained for MLH1 (green) and SYCP3 (red). Representative images are shown for spermatocytes at the pachytene stage in WT and the pachytene-like stage in Zcwpw1KI/KI. All experiments were performed on adult mice (6–8 weeks old) with n = 3 for each genotype.
-
Figure 1—figure supplement 3—source data 1
Number of MSH4 and RNF212 foci in Figure 1—figure supplement 3B and D.
- https://cdn.elifesciences.org/articles/53459/elife-53459-fig1-figsupp3-data1-v3.xlsx
Figure 2
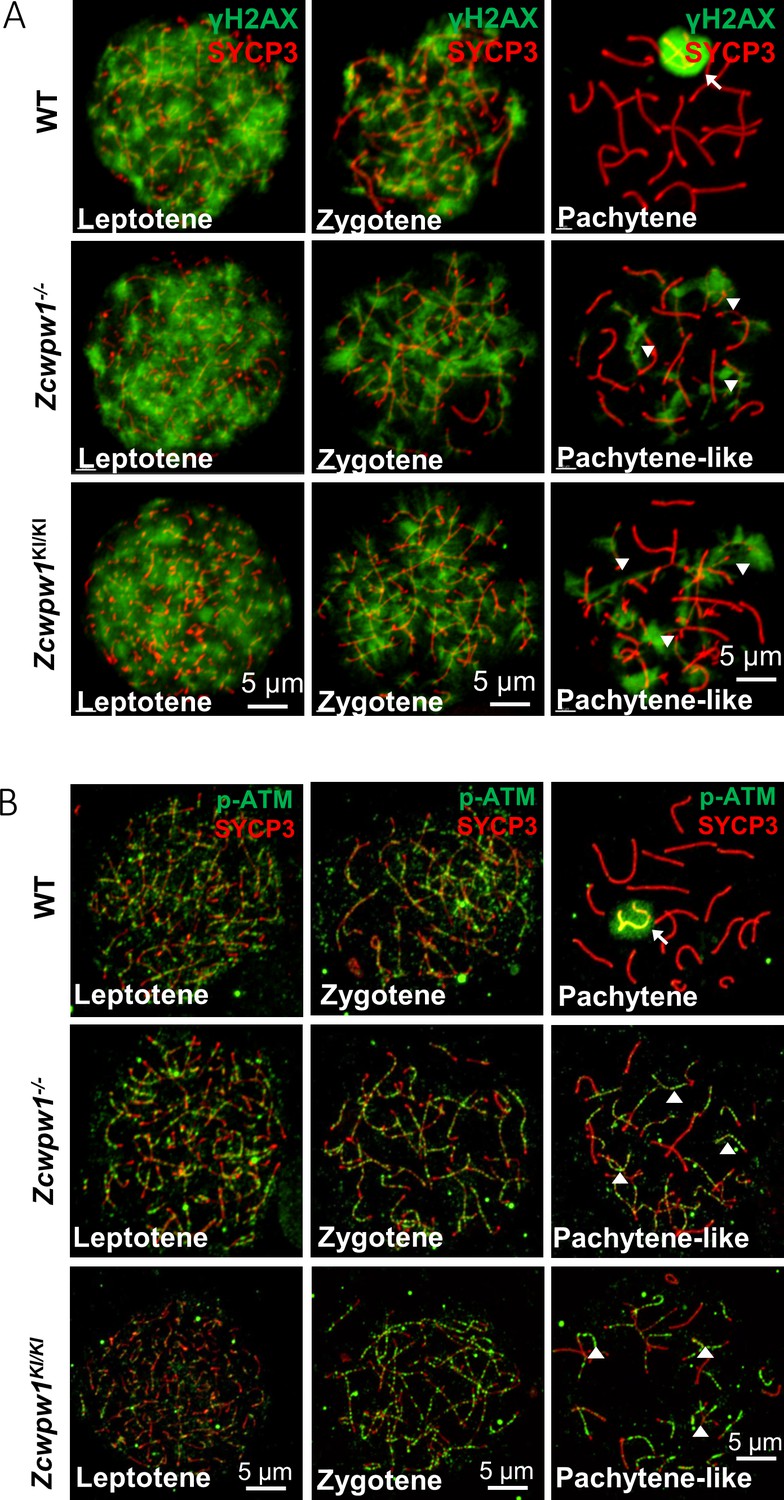
The H3K4me3 reader function of ZCWPW1 is required for DSB repair.
(A) Chromosome spreads of spermatocytes from the testes of adult WT, Zcwpw1−/−, and Zcwpw1KI/KI males immunostained for the DSB marker γH2AX (green) and SYCP3 (red). (B) Chromosome spreads of spermatocytes from the testes of adult WT, Zcwpw1−/−, and Zcwpw1KI/KI males immunostained for the DSB repair protein p-ATM (green) and SYCP3 (red). Representative images are shown for spermatocytes at the leptotene, zygotene, pachytene (arrow indicates the XY body), and pachytene-like (arrowheads indicate the p-ATM signal) stages of the three genotypes. All experiments were performed on adult mice (6–8 weeks) with n = 3 for each genotype.
Figure 3 with 4 supplements
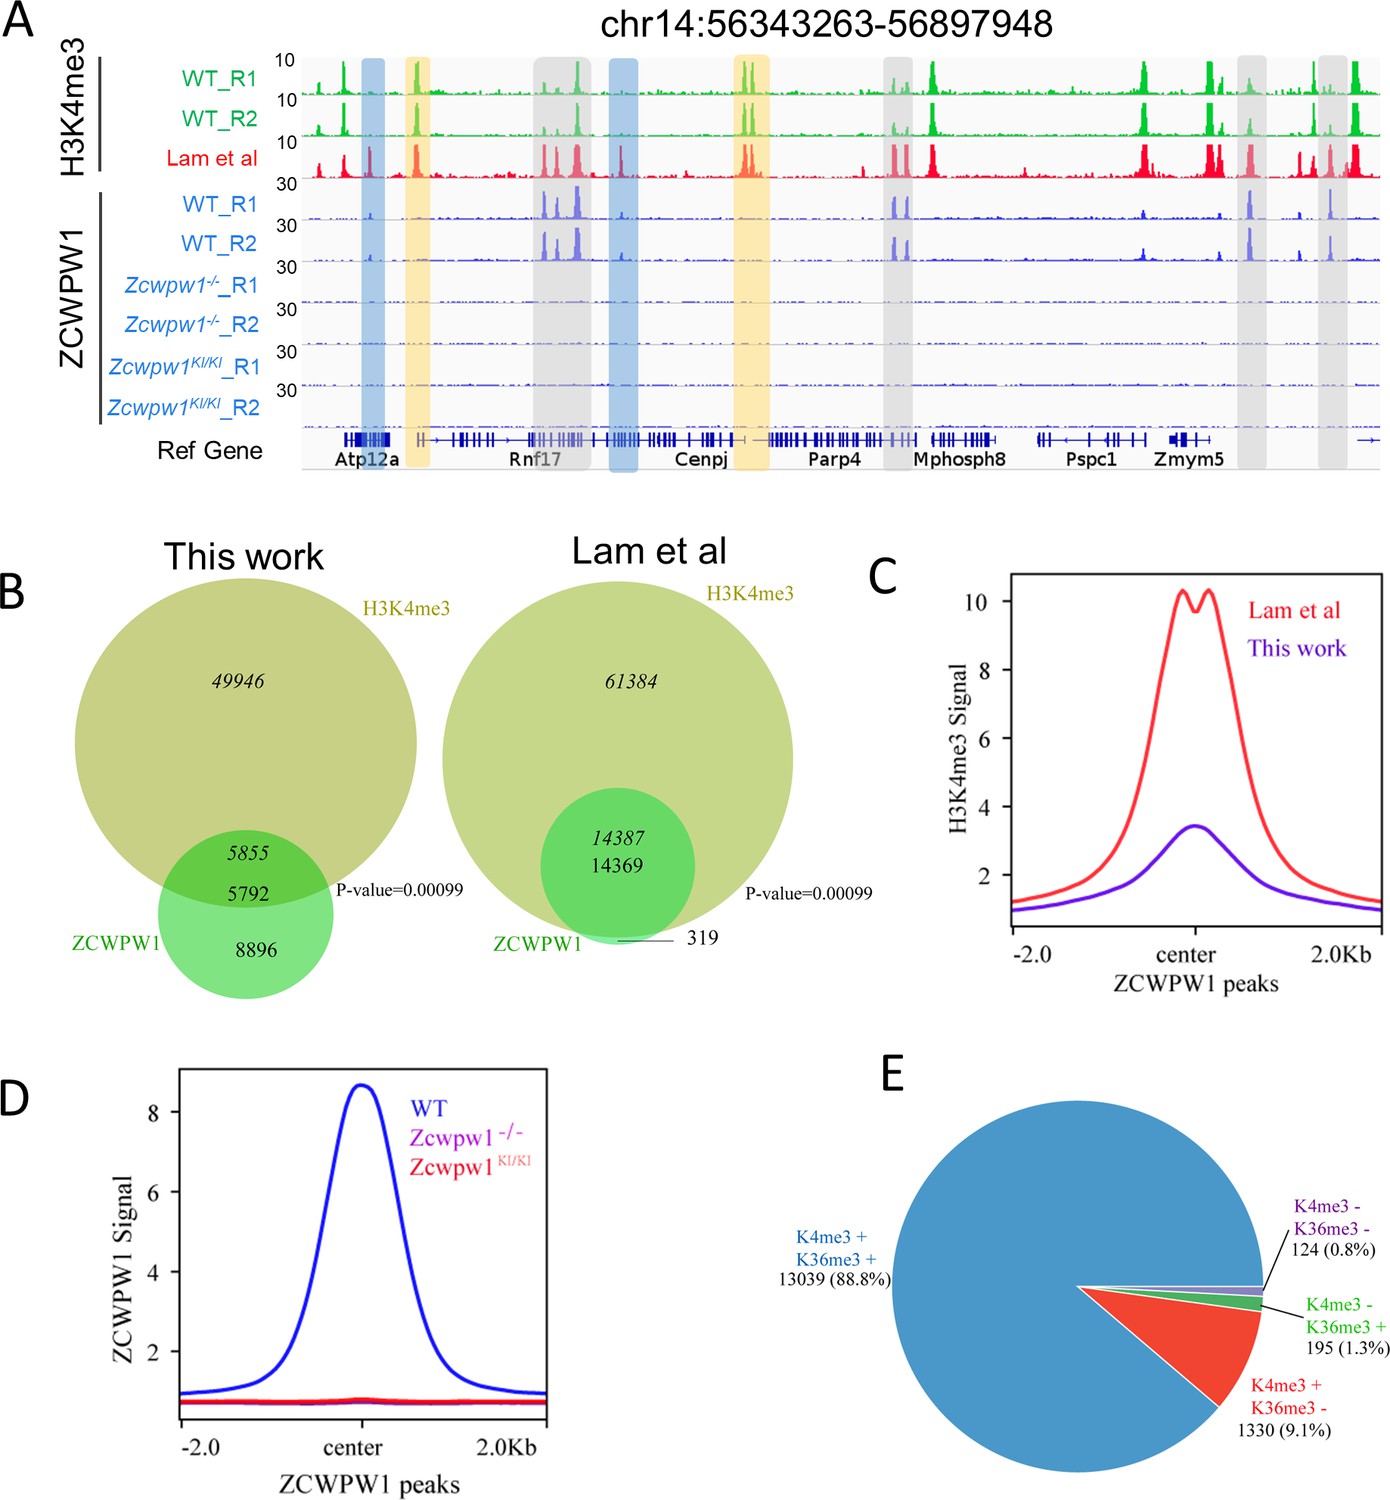
Zcwpw1 is an H3K4me3 reader.
(A) ChIP-seq genome snapshot of the distribution of H3K4me3 and ZCWPW1 peaks in C57BL/6 WT, Zcwpw1−/−, and Zcwpw1KI/KI mice along a 554 kb region of chromosome 14. H3K4me3 and ZCWPW1 signals were normalized (See Methods). Overlapping regions are indicated by grey or blue shaded areas, while non-overlapping regions of interest are indicated by orange shaded areas. R1 and R2 represent two independent replicates. The H3K4me3 tract (red)was generated with isolated stage-specific (SCP3+H1T−) spermatocyte nuclei (Lam et al., 2019) The unit of Y axis is fold change as described in the method. (B) Venn diagram showing the overlap between ZCWPW1 peaks and H3K4me3 peaks. H3K4me3 data generated in whole testes (left, this study) compared with H3K4me3 data generated with isolated stage-specific (SCP3+H1T−) spermatocyte nuclei (right, Lam et al.). Italics (14,387) indicates the number of H3K4me3 peaks overlapping ZCWPW1, while standard font (14,369) indicates the number of ZCWPW1 peaks overlapping with H3K4me3 marks. Sometimes, one broad ZCWPW1 peak perhaps overlap with two narrow H3K4me3 peaks, which will cause these two numbers differ. P-values were calculated by using the permTest (see Materials and methods, ntimes = 1000). (C) Profile plot of averaged normalized H3K4me3 signals (see Methods) in ZCWPW1 peaks obtained in this work and in Lam et al. The profile shows the average values over 4 kb intervals for all 14,688 detected peaks (binding sites). The unit of Y axis is average fold change as described in the method. (D) Profile plot of the averaged ZCWPW1 signal in 14,688 ZCWPW1 peaks, in C57BL/6 WT, Zcwpw1−/− and Zcwpw1KI/KI mice. The unit of Y axis is average fold change as described in the method. (E) Pie chart showing the ratio of four ZCWPW1 peak groups determined by their overlap with histone modification peaks generated with isolated stage-specific spermatocyte nuclei (Lam et al.). The ‘+” indicates overlap, while ‘−” indicates no overlap. All ChIP-seq experiments were performed in PD14 mice with n = 4 for each genotype.
Figure 3—figure supplement 1

Genome-wide properties of ZCWPW1-associated binding sites.
(A) The distribution of ZCWPW1 peak intensity and peak length by location in genomic elements. (***p<0.001 by two-tailed Wilcoxon rank sum test). The red boxplots and left Y-axis indicate peak intensity, while the blue boxplots and right Y-axis indicate peak length. (B) Percentage of ZCWPW1 binding sites (peaks) overlapping with DNA elements compared with the random binding sites obtained by random shuffling of the identified ZCWPW1 binding sites. The X-axis indicates the percentage of binding sites overlapping with DNA elements. The random groups and P-values were generated using permTest, an R function in the regioneR package (see Methods, ntimes = 1000). The barplot height of the random group represents the means of 1000 tests. Bars represent ± SD. (C) Percentage of ZCWPW1 binding sites (peaks) overlapping with transposable elements (TEs) compared with the random binding sites obtained by random shuffling of the ZCWPW1 binding sites. The X-axis indicates the percentage of binding sites overlapping with TEs. The random groups and P-values were generated using the same method as (B). (D) Percentage of ZCWPW1 binding sites (peaks) overlapping with Alu repeats compared with the binding sites obtained by random shuffling of the identified ZCWPW1 binding sites. The X-axis indicates the percentage of binding sites overlapping with Alu repeats. The random groups and P-value were generated as above.
Figure 3—figure supplement 2
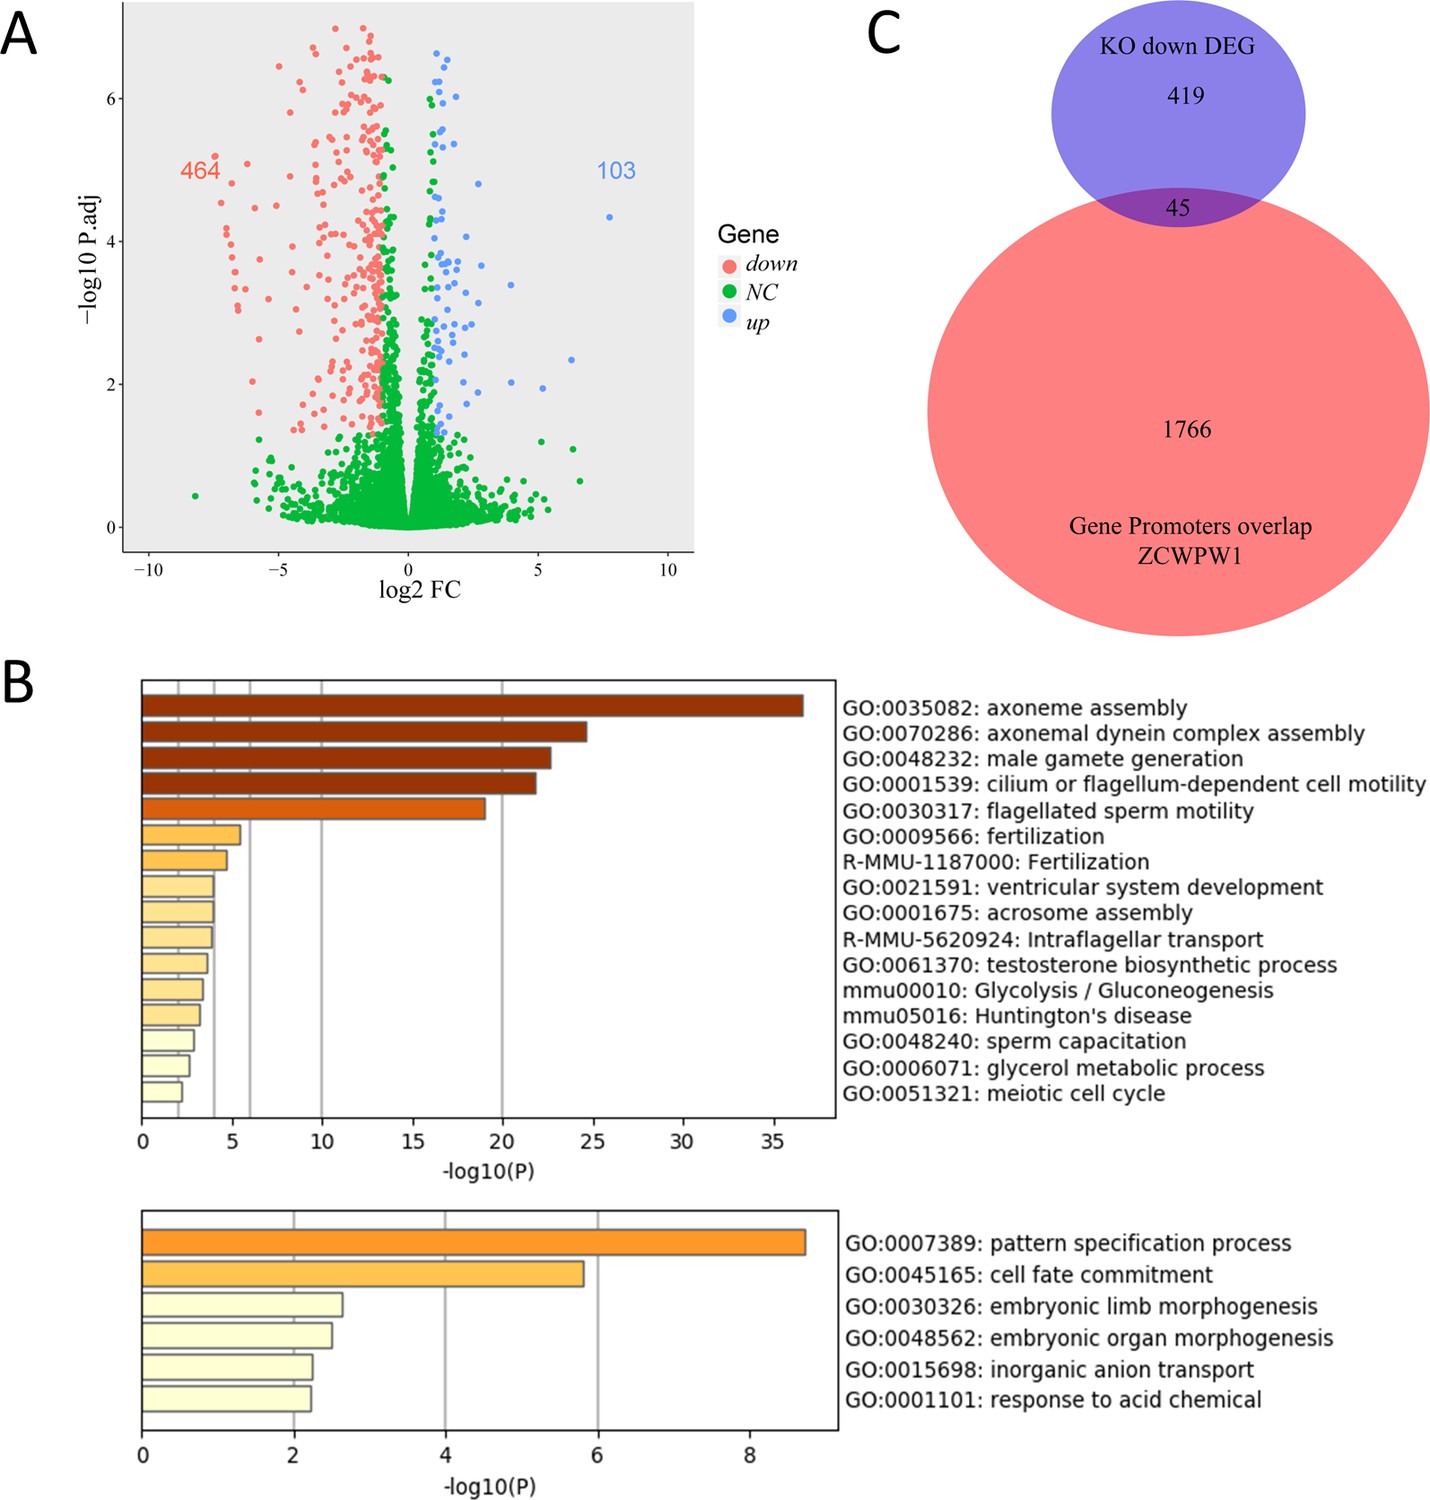
Transcriptional profiling analysis of WT and Zcwpw1−/− testes.
(A) Scatterplot of DEGs between WT and Zcwpw1−/− at PD14. Downregulated in Zcwpw1−/−, red; upregulated in Zcwpw1−/−, blue; no significant change (NC), green. P-adjust < 0.05 and FC ≥ 2 (Fold change). (B) Functional enrichment analysis of DEGs by Metascape. The upper bar chart shows DEGs with lower expression in Zcwpw1−/−, and the lower bar chart shows DEGs with higher expression in Zcwpw1−/−. (C) Venn diagram of the overlap between the genes with promoter regions overlapping ZCWPW1 binding sites and DEGs showing lower expression in Zcwpw1−/−. All RNA-seq experiments were performed on PD14 mice with n = 3 for each genotype.
Figure 3—figure supplement 3
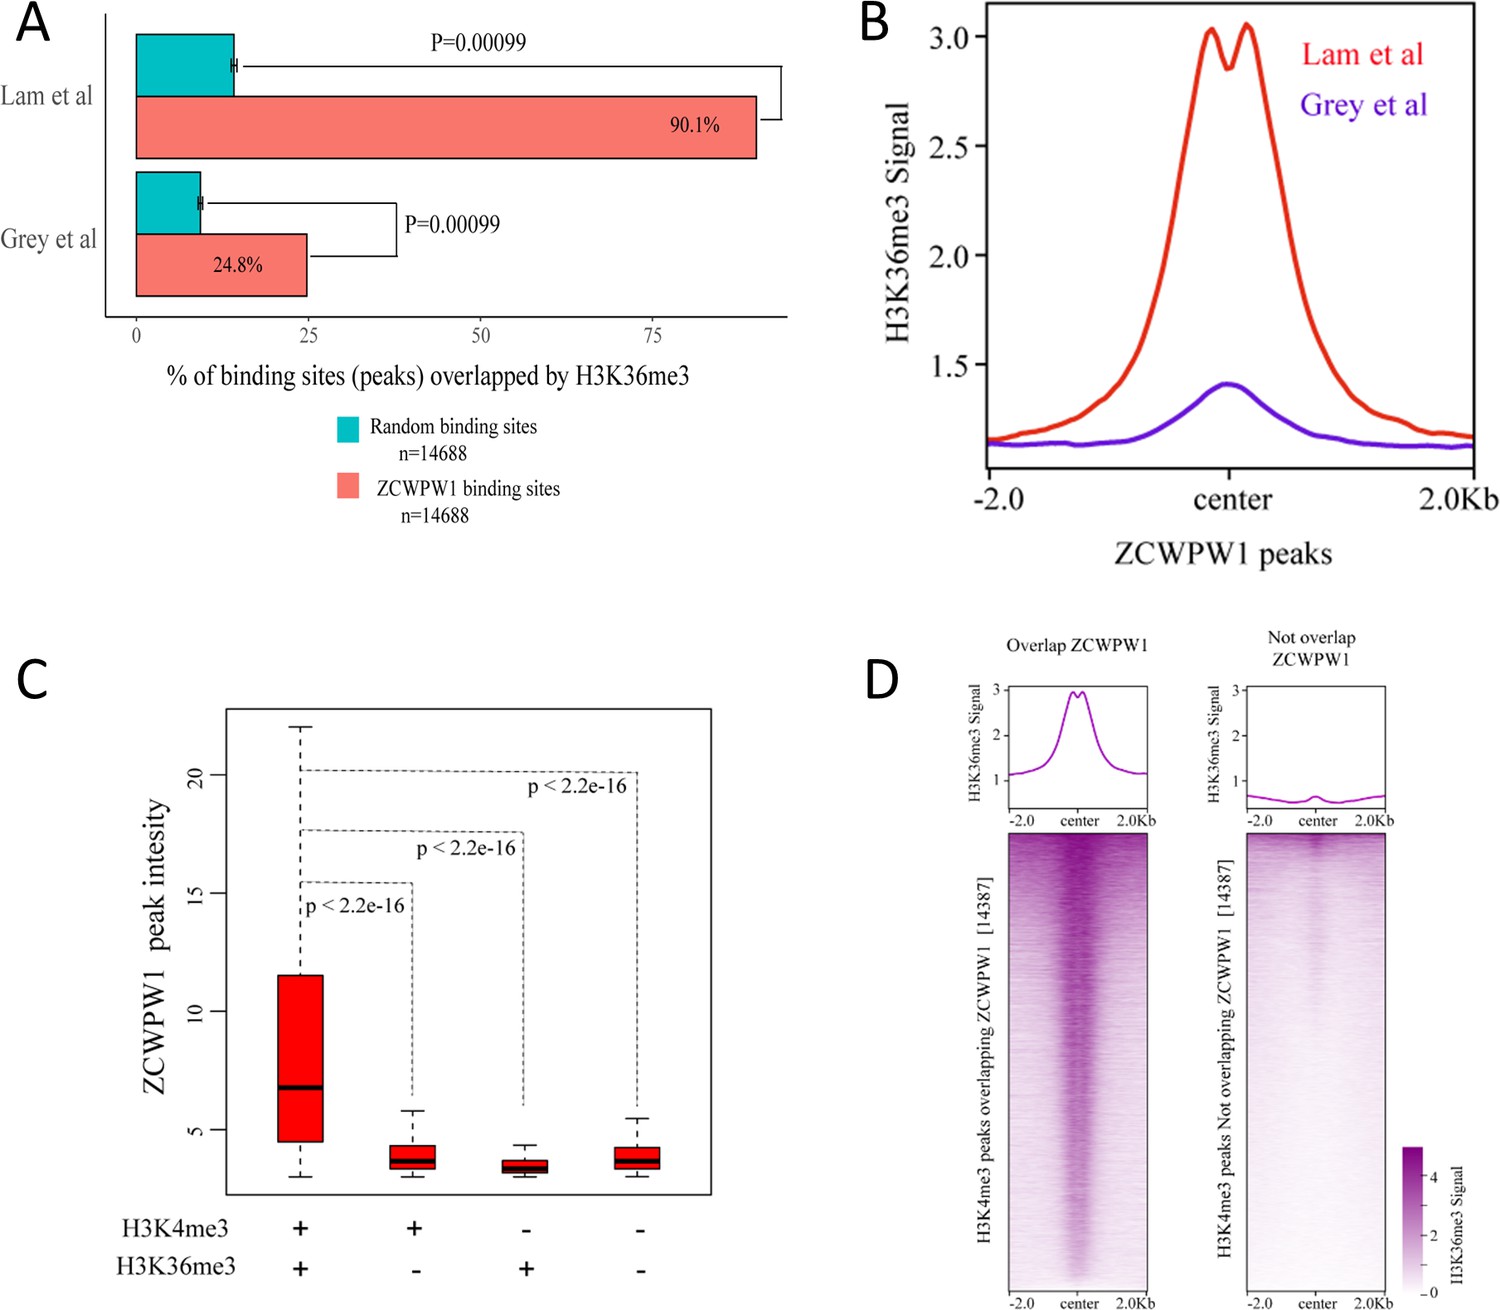
Correlations between ZCWPW1 peaks and H3K4me3 and H3K36me3 peaks.
(A) Percentage of ZCWPW1 binding sites (peaks) overlapping with H3K36me3 peaks identified by Lam et al., 2019 or Grey et al., 2018, compared with the random binding sites obtained by random shuffling of the identified ZCWPW1 peaks. The X-axis indicates the percentage of binding sites overlapping with H3K36me3 peaks. The random groups and P-values were generated using the method described above. (B) Profile plot of the averaged normalized H3K36me3 signal (See Methods) obtained from Grey et al. (whole testes) and Lam et al. (isolated stage-specific spermatocyte nuclei) in ZCWPW1 peaks. The profile shows the average values over 4 kb intervals for all 14688 peaks (binding sites). (C) Boxplots showing the peak intensity of four ZCWPW1 groups determined by their overlap with histone modification peaks (Lam et al.). + indicates overlap, - indicates no overlap. The P-values were calculated using the two-tailed Wilcoxon rank sum test. (D) Heatmap and averaged profile plot of the H3K36me3 signal (Grey et al.) on two types of H3K4me3 peaks (Grey et al.), including H3K4me3 peaks overlapping ZCWPW1 and H3K4me3 peaks not overlapping ZCWPW1. The 14,387 H3K4me3 peaks were randomly sampled from the total H3K4me3 peaks not overlapping with ZCWPW1 (61,384). Each row of the heatmap shows the H3K36me3 distribution on an H3K4me3 peak center ± 2 k bp. The color change from white to purple indicates a change in the normalized H3K4me3 signal from weak to strong.
Figure 3—figure supplement 4
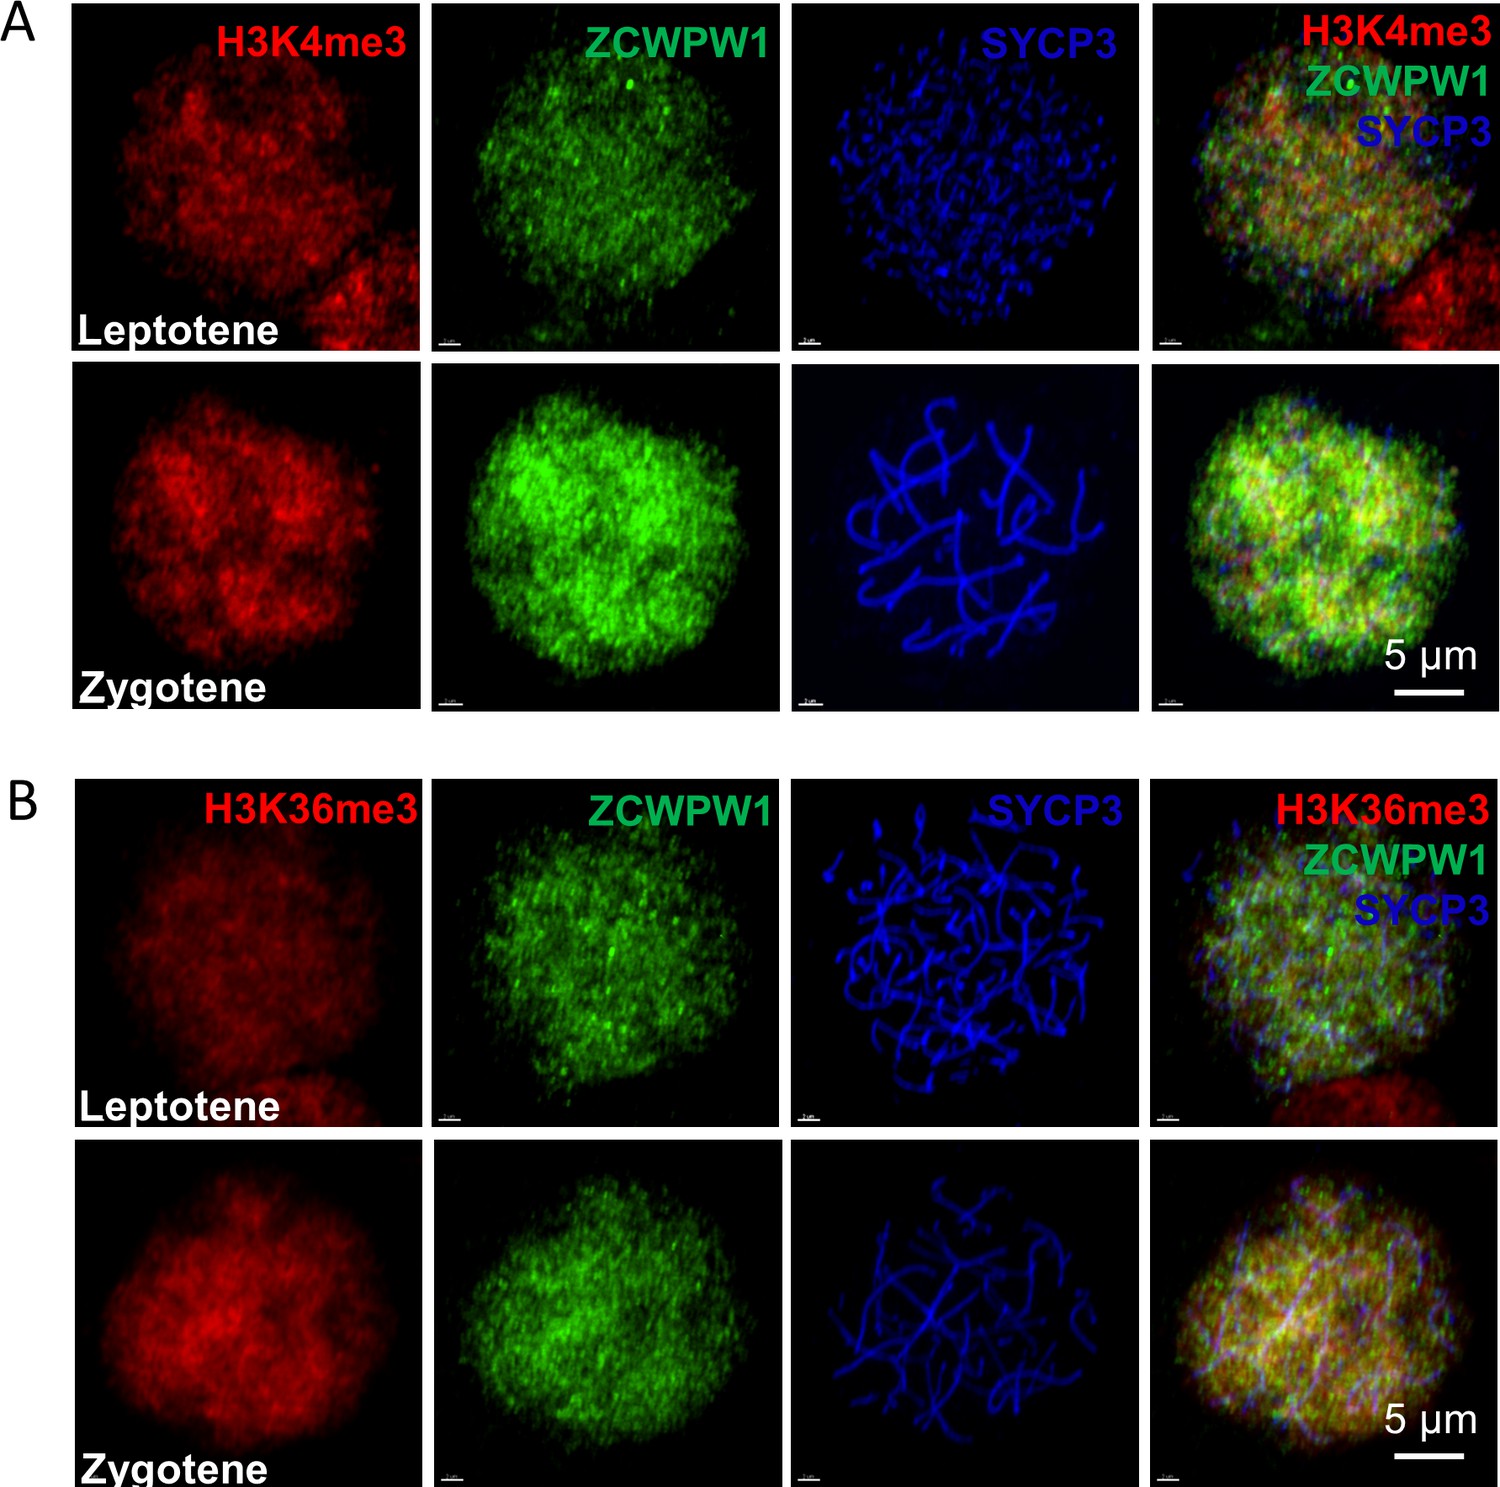
Zcwpw1, H3K4me3 and H3K36me3 localize to the nucleus in leptotene and zygotene spermatocytes.
(A) Chromosome spreads of spermatocytes from the testes of adult WT were immunostained for H3K4me3 (red), Zcwpw1 (green), and SYCP3 (blue). Representative images of spermatocytes at leptotene and zygotene stages are shown. (B) Chromosome spreads of spermatocytes from the testes of adult WT were immunostained for H3K36me3 (red), Zcwpw1 (green), and SYCP3 (blue). Representative images of spermatocytes at leptotene (upper panels) and zygotene (lower panels) stages are shown. All experiments were performed on adult mice (6–8 weeks old) with n = 3 for each genotype.
Figure 4 with 3 supplements
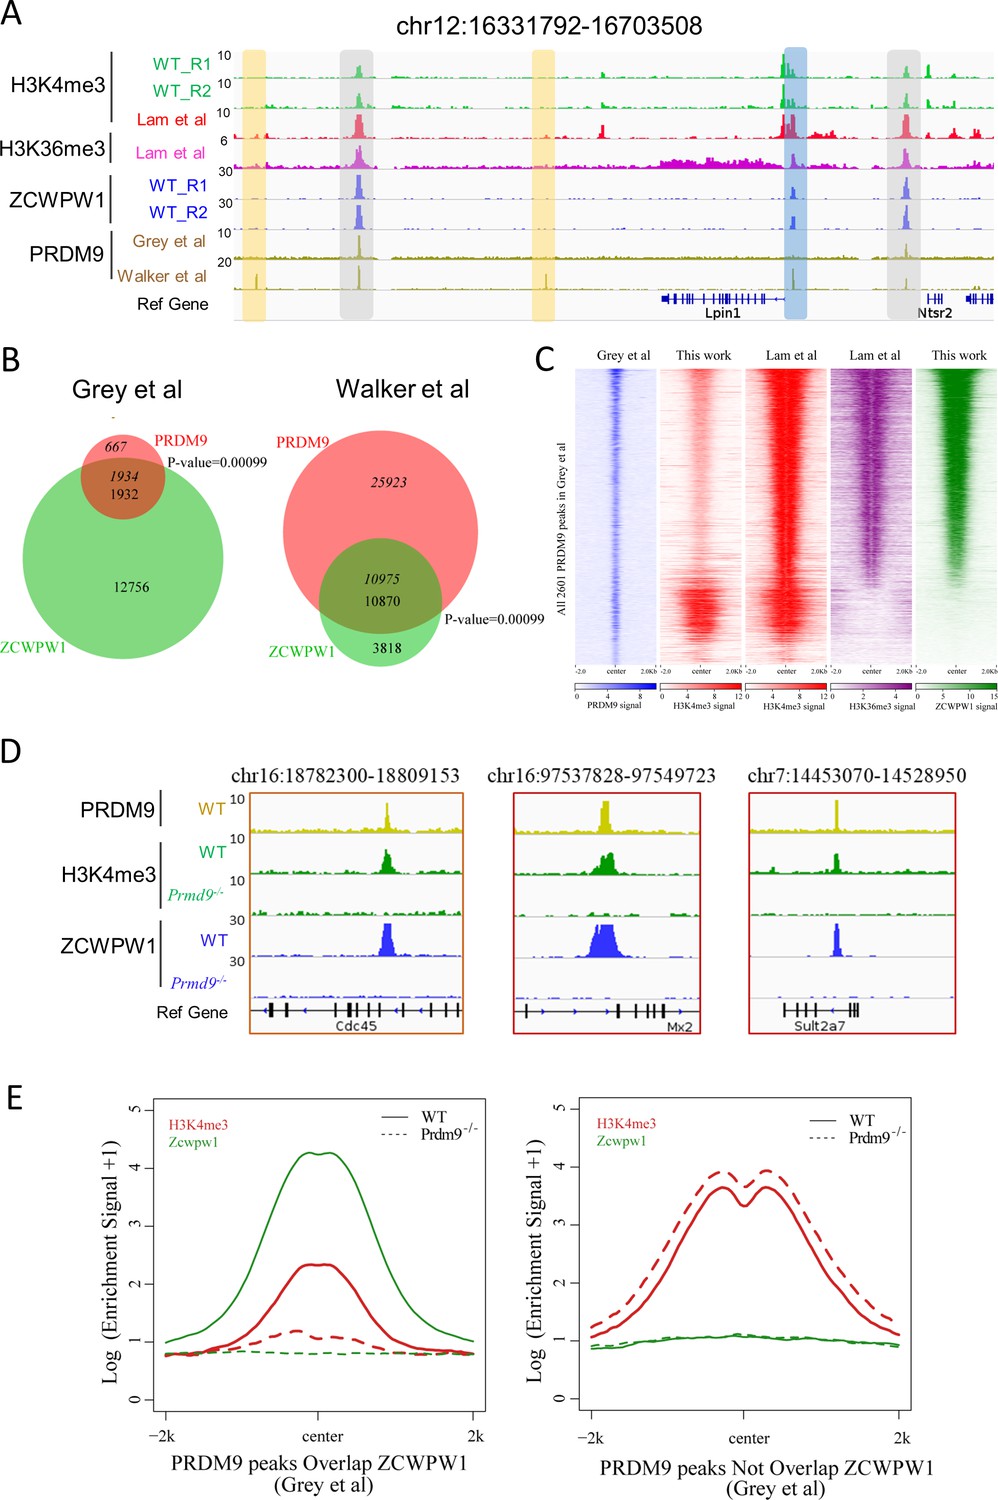
Zcwpw1 binding is strongly promoted by the histone modification activity of Prdm9.
(A) ChIP-seq genome snapshot of the distribution of H3K4me3, H3K36me3, ZCWPW1, and PRDM9 peaks in C57BL/6 mice along a 372 kb region of chromosome 12. Overlapping peaks in samples from all four analyses are indicated by grey or blue shaded areas, while non-overlapping regions of interest are indicated by orange shaded areas. The unit of Y axis is fold change as described in the method. (B) Venn diagram showing the overlap between PRDM9 peaks and ZCWPW1 binding sites. On the left are in vivo PRDM9 data generated by Grey et al., 2018, while on the right are in vitro affinity-seq PRDM9 data generated by Walker et al., 2015. Italics indicate PRDM9 peak overlap with ZCWPW1, while standard font indicates ZCWPW1 peak overlap with PRDM9 peaks. (C) Heatmap showing the correlation among H3K4me3, H3K36me3, and ZCWPW1 with PRDM9 peaks (Grey et al., 2018). Each row represents a PRDM9 binding site of ± 2 kb around the center and ranked by ZCWPW1 signal from the highest to the lowest. Color indicates normalized ChIP-seq signal (See Methods). (D) ChIP-seq genome snapshot showing changes in H3K4me3 and ZCWPW1 binding distributions following Prdm9 knockout (Prdm9−/−) along a 27/12 kb region of chromosome 16 and a 76 kb region of chromosome 7. The PRDM9 data were obtained from Grey et al., 2018. The unit of Y axis is fold change as described in the method. (E) Profile plot of averaged H3K4me3 and ZCWPW1 signals obtained in this work with two types of PRDM9 peaks Grey et al., 2018 following Prdm9 knockout. The Y-axis shows log base-2 transformation of the normalized signal. The unit of Y axis is average fold change as described in the method. All ChIP-seq experiments were performed using PD14 mice with n = 4 for each genotype.
Figure 4—figure supplement 1
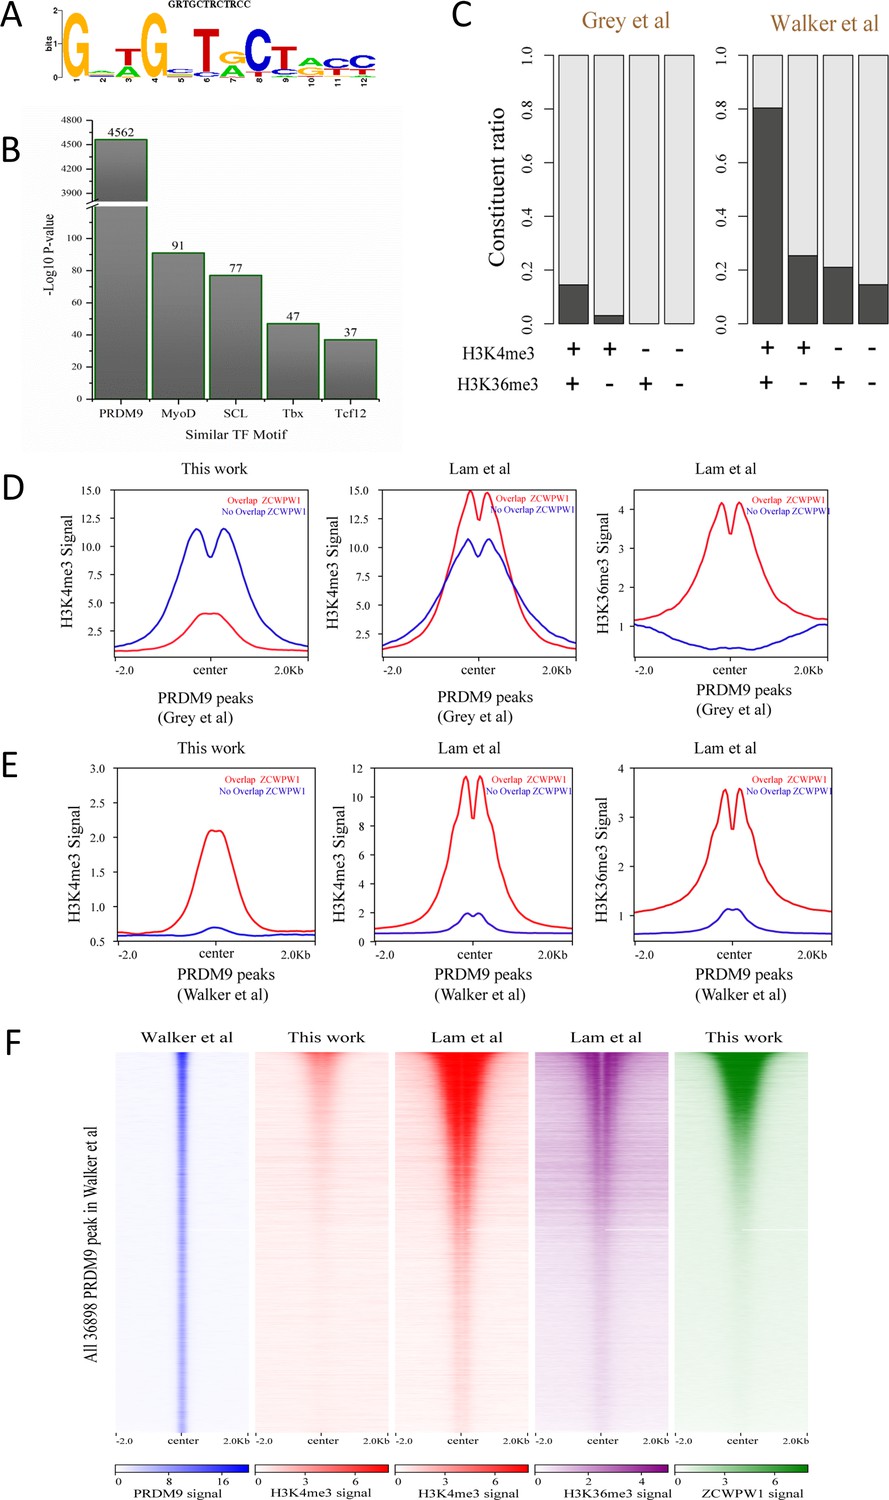
Correlation between Zcwpw1 binding sites and Prdm9-induced dual histone methylation.
(A) The rank-first de novo binding motif of Zcwpw1. (B) The similarity of this Zcwpw1 binding motif with those of other transcription factors. (C) Barplots showing the constituent ratio in four types of ZCWPW1 peaks, representing the ratio of ZCWPW1 peaks sharing overlap with PRDM9 peaks, and those not sharing overlap with PRDM9 peaks. Black indicates overlap, white indicates no overlap. The four ZCWPW1 groups classified by their overlap with histone modification peaks (Lam et al.). + indicates overlap, - indicates no overlap. (D) Profile plot of averaged H3K4me3 and H3K36me3 signals in different types of PRDM9 peaks generated by Grey et al. The profile shows the average values over 4 kb intervals for all 2601 detected PRDM9 binding sites. (E) Profile plot of averaged H3K4me3 and H3K36me3 in different types of PRDM9 peaks generated by Walker et al.; the profile shows the average values over 4 kb intervals for all 36898 of the detected PRDM9 binding regions. (F) Heatmap showing the correlation among H3K4me3, H3K36me3, and ZCWPW1 in the PRDM9 peaks (Walker et al.). Each row in the heatmap represents a PRDM9 binding site of ± 2 kb around the center and ranked from the highest to the lowest according to ZCWPW1 signal intensity. Color indicates normalized ChIP-seq signal (see methods).
Figure 4—figure supplement 2
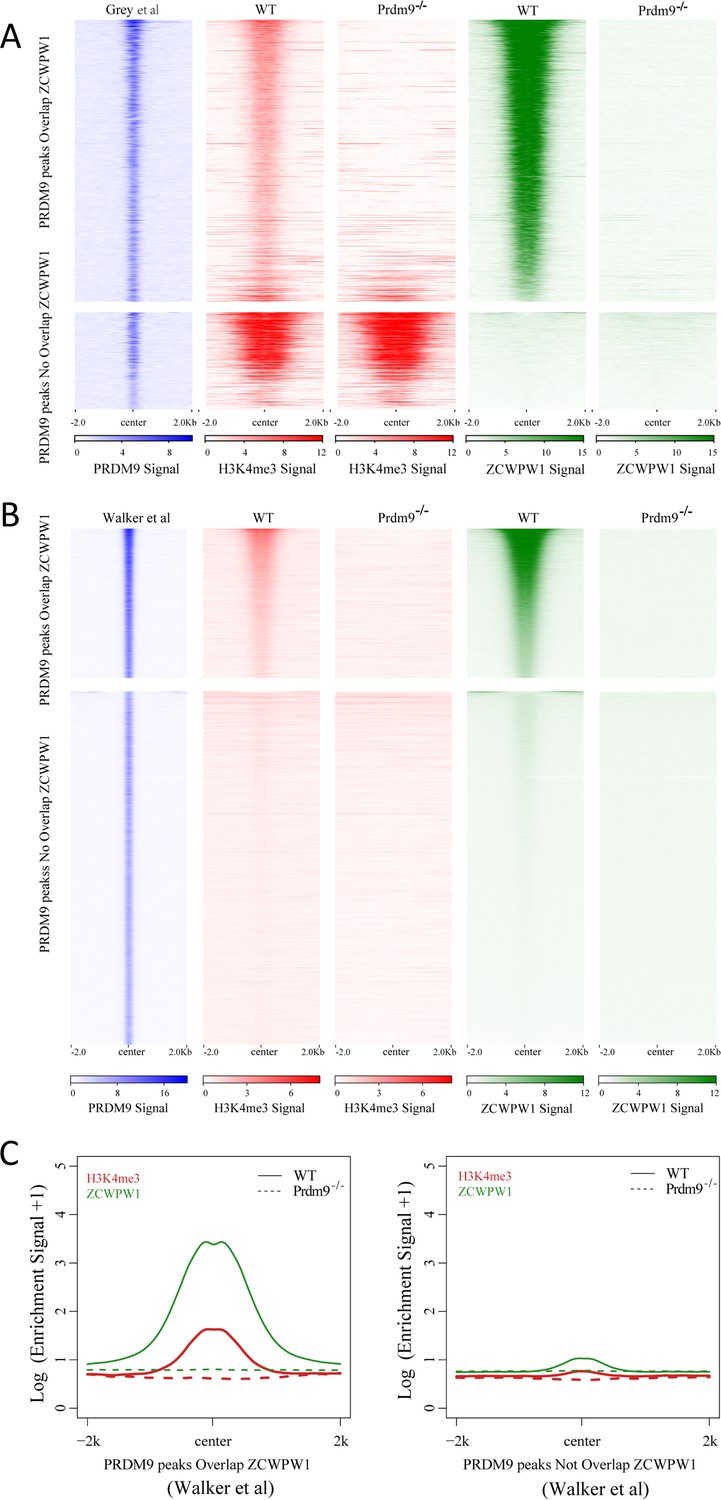
Correlation between Zcwpw1 chromatin occupancy and Prdm9-induced H3K4me3.
(A) Heatmap showing H3K4me3 and ZCWPW1 signals obtained in this work, in two types of PRDM9 peaks (Grey et al.) following Prdm9 knockout. Each row in the heatmaps represents a PRDM9 binding site of ± 2 kb around the center and ranked from the highest to the lowest according to PRDM9 density. Color indicates ChIP-seq density. (B) Heatmap showing H3K4me3 and ZCWPW1 signals obtained from this work, on two types of PRDM9 peaks identified by Walker et al. following Prdm9 knockout. Each row in the heatmaps represents a PRDM9 binding site of ± 2 kb around the center and ranked from the highest to the lowest according to PRDM9 density. Color indicates ChIP-seq density. (C) Profile plot of averaged H3K4me3 and ZCWPW1 signals obtained in this work and in two types of PRDM9 peaks identified by Walker et al. following Prdm9 knockout. The Y-axis indicates the log base-2 transformation of the normalized signals. All ChIP-seq experiments were performed using PD14 mice with n = 4 for each genotype.
Figure 4—figure supplement 3
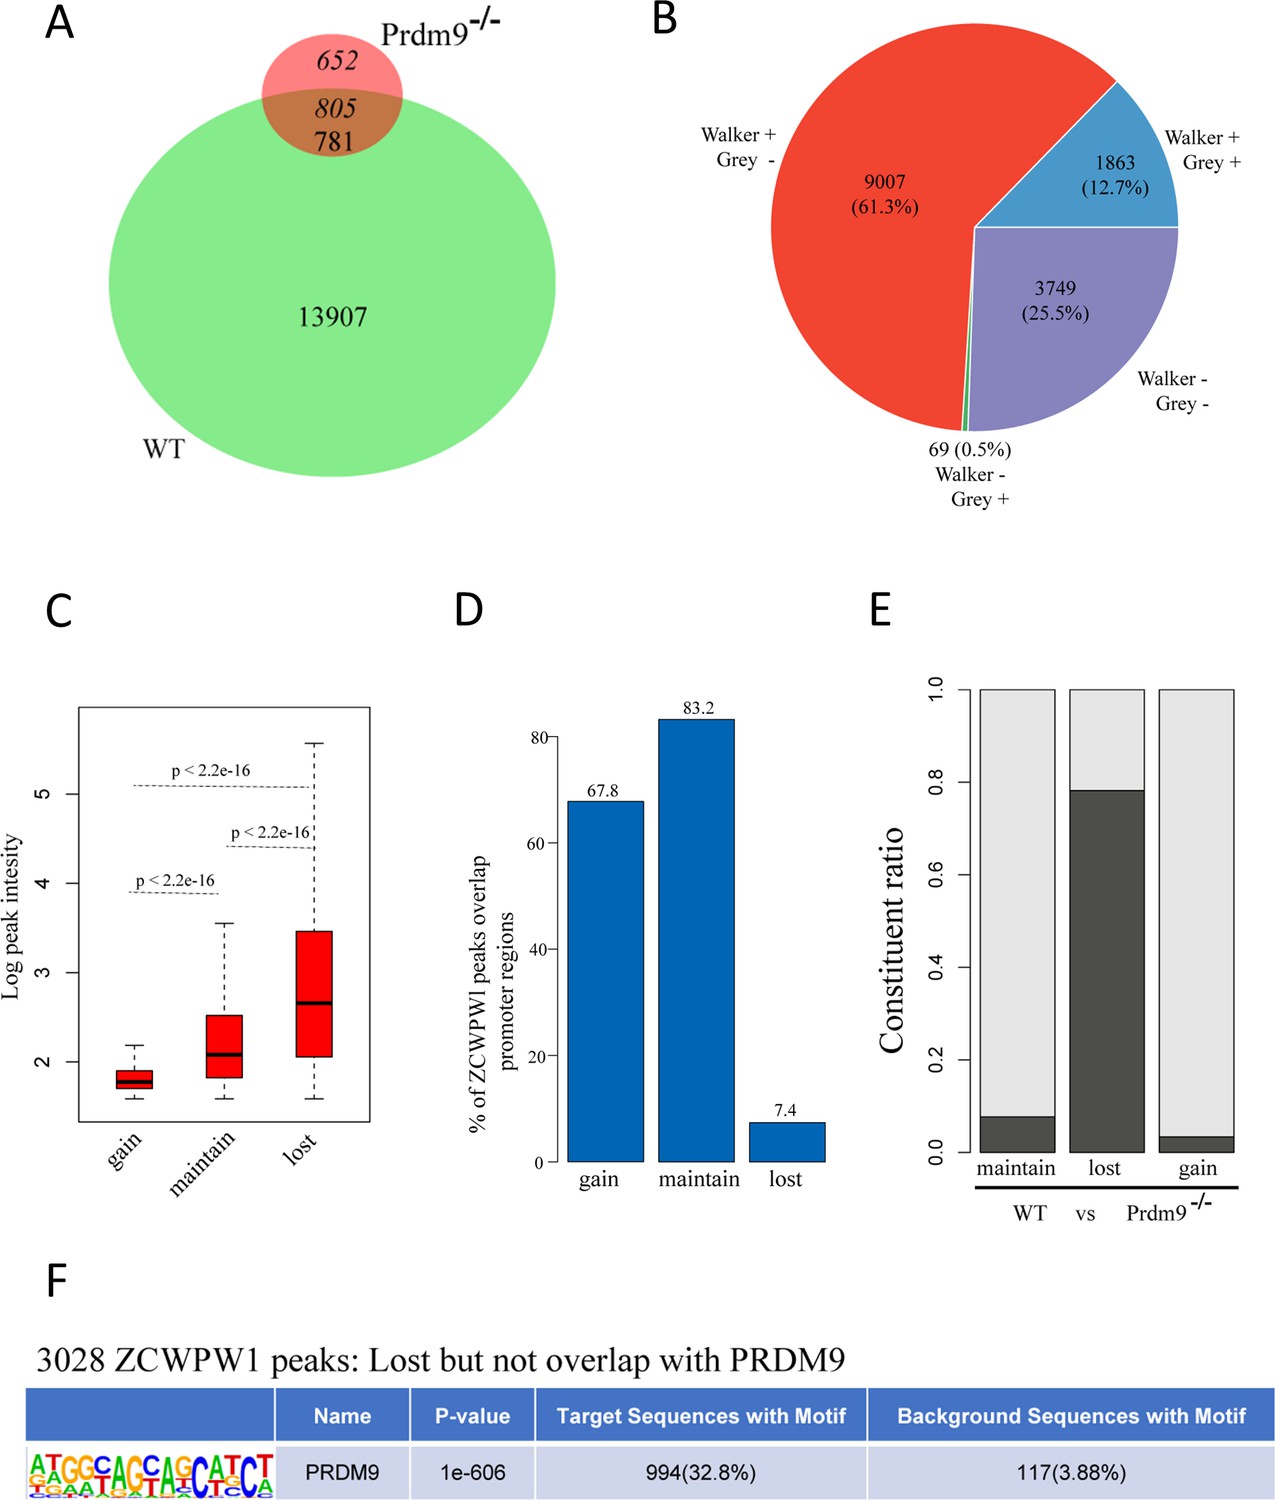
Change in Zcwpw1 chromatin occupancy following Prdm9 knockout.
(A) Venn diagram showing the overlap of the ZCWPW1 peaks between WT and Prdm9 knockout (Prdm9−/−). ZCWPW1 peaks were grouped by their detection in either WT, Prdm9−/−, or both as either gained (652) – indicating peaks only found after Prdm9 knockout, maintained (781) – indicating peaks found in both backgrounds, or lost (13,907) – indicating peaks found only in WT. (B) Pie chart showing the ratio of four ZCWPW1 peak groups determined by their overlap with two types PRDM9 peaks (Grey et al.; Walker et al.). + indicates overlap, - indicates no overlap. (C) Boxplots showing the peak intensity of the three ZCWPW1 groups. The Y-axis indicates the log base-2 transformation of normalized signals. P-values were calculated by two-tailed Wilcoxon rank sum test. (D) Barplots showing the percentage of ZCWPW1 peaks overlapping with promoter regions for the three groups of ZCWPW1 peaks. (E) Barplots showing the constituent ratio of each ZCWPW1 peak group according to whether they overlapped with PRDM9, which includes the merged peaks of Grey et al and Walker et al. Black indicates overlap, white indicates no overlap. (F) Motif analysis of the lost ZCWPW1 peaks that did not overlap with merged PRDM9 peaks. The value of background had been transformed to the condition that the ratio was stable and the number of regions was scaled to 3028.
Figure 5 with 1 supplement
Zcwpw1 localizes to DMC1-labelled DSB hotspots in a Prdm9-dependent manner.
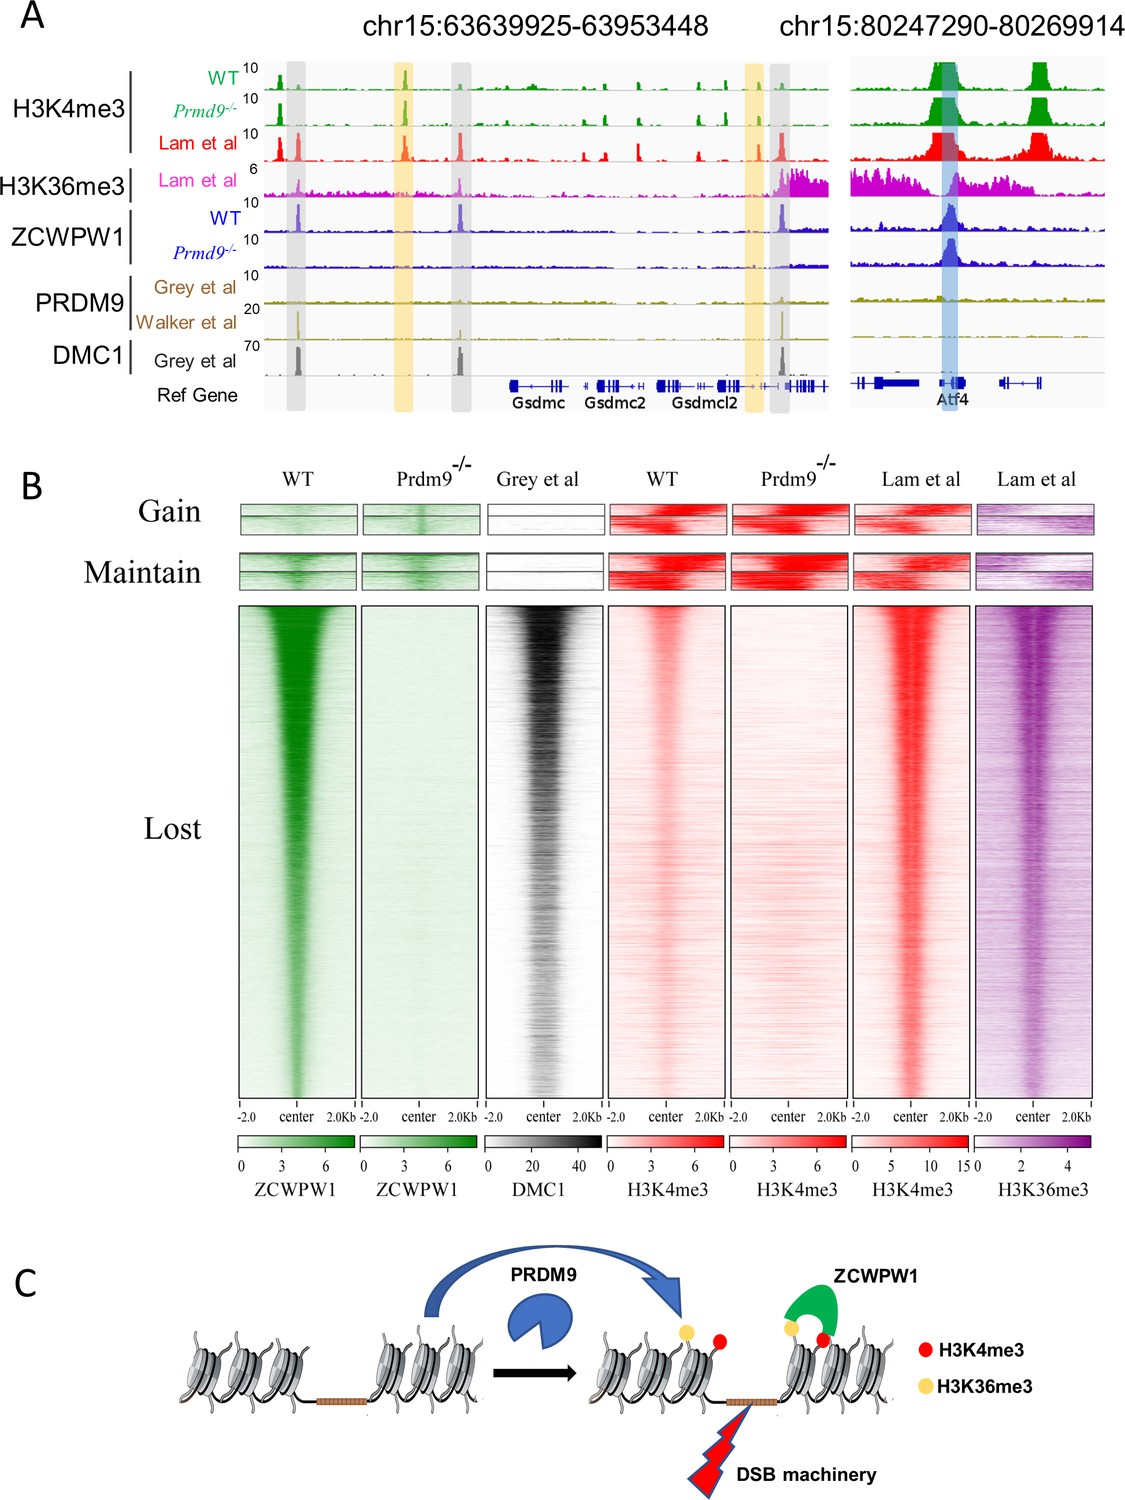
(A) ChIP-seq genome snapshot of the distribution of H3K4me3, H3K36me3, ZCWPW1, PRDM9, and DMC1 peaks in C57BL/6 mice with changes in H3K4me3 and ZCWPW1 binding sites in Prdm9 knockout mice. ZCWPW1 and DMC1 overlapping regions are indicated by gray-shaded areas, while non-overlapping regions of interest are indicated by orange or blue shaded areas. The unit of Y axis is fold change as described in the method. (B) Heatmap showing DMC1 (Grey et al), H3K4me3 (Lam et al), H3K36me3 (Lam et al), H3K4me3 (WT and Prdm9−/−), and ZCWPW1 (WT and Prdm9−/−) corresponding with Gained, Lost, or Maintained groups of ZCWPW1 peaks (also see Figure 4—figure supplement 3A). We used k-means clustering to define the ‘gain’ and ‘maintain’ group. We performed k-means clustering analysis to define the ‘gain’ and ‘maintain’ groups, and found two different subtypes within each group: a subtype with H3K4me3 signal similar along the ZCWPW1 peaks ± 2 kb, and a subtype with H3K4me3 mostly enriched on the ZCWPW1 peak center. All ChIP-seq experiments were performed using PD14 mice with n = 4 for each genotype. (C) Working model of ZCWPW1 in recognizing H3K4me3 and H3K36me3 deposited by PRDM9.
Figure 5—figure supplement 1
Correlation between the chromatin occupancy of Zcwpw1 and DMC1.
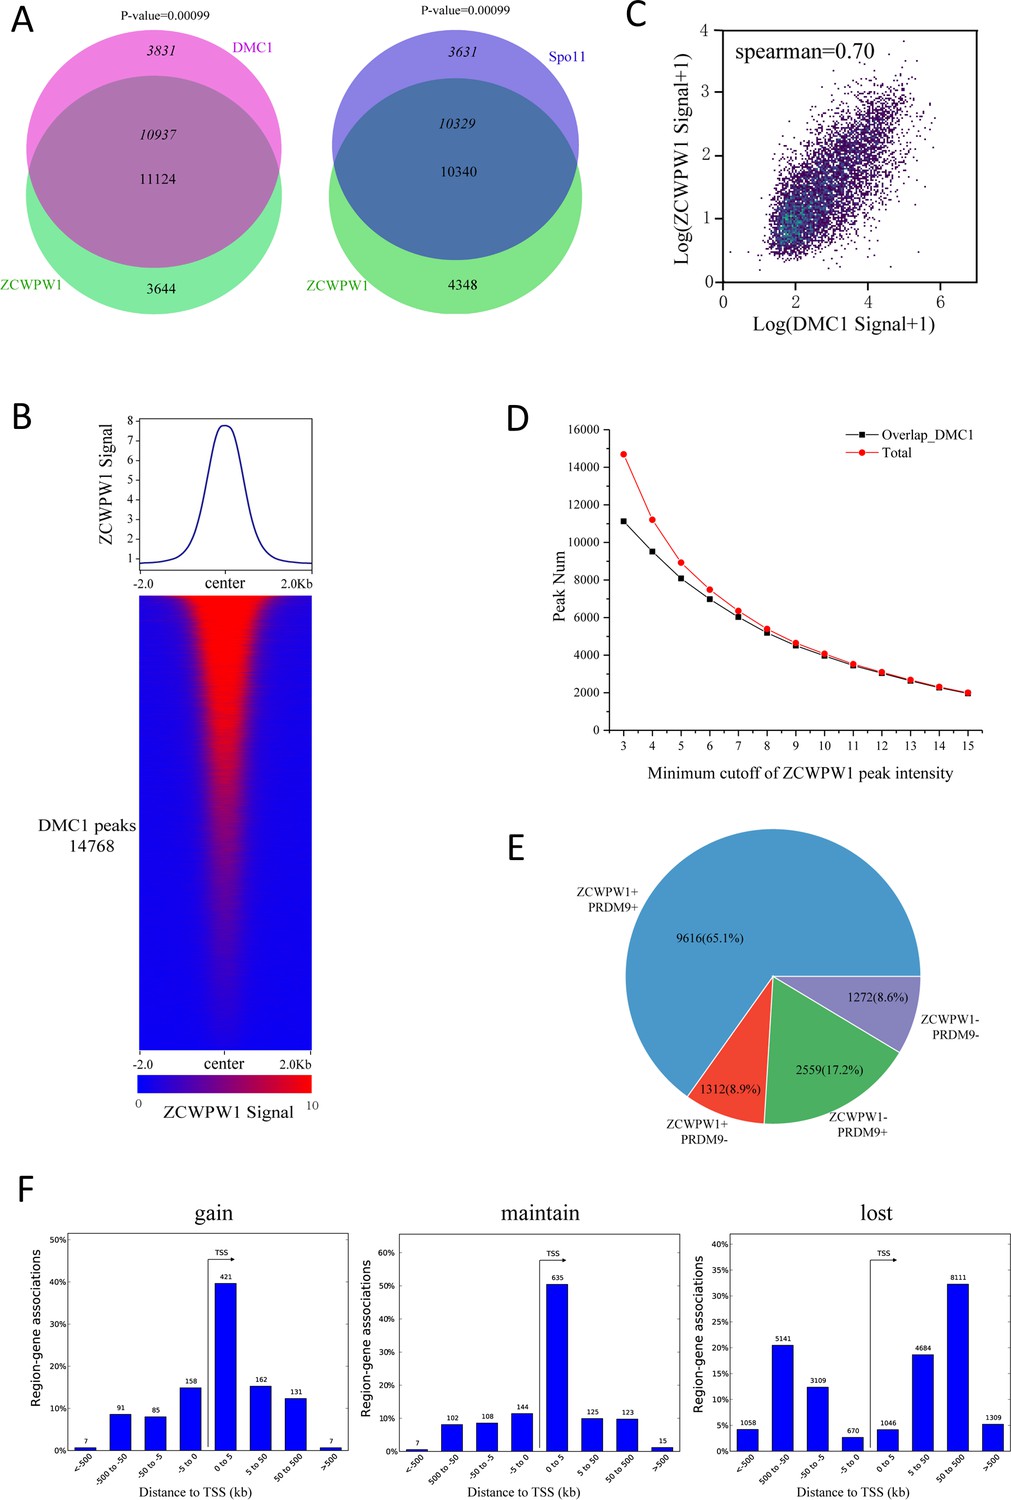
(A) Venn diagram showing the overlap of the DMC1 (Grey et al) and Spo11 (Lange et al.) peaks with ZCWPW1 binding sites. P-values were calculated using the permTest (see Methods, ntimes = 1000). (B) Heatmap and profile plot of the ZCWPW1 signal in all DMC1 peaks. Each row in the heatmap represents a DMC1 binding site of ±2 kb around the center and ranked according to ZCWPW1 signal from the highest to the lowest. Color indicates the normalized ChIP-seq signal (See methods). (C) Scatterplot showing the correlation between the normalized ZCWPW1 signal and DMC1 signal on all DMC1 peaks, with spearman correlation coefficient. The x and y axis indicated 2-based log transformation of normalized signal the ZCWPW1 and DMC1 after adding 1. (D) Line plots showing the overlap of ZCWPW1 peaks with DMC1 peaks based on different minimum cutoff values for ZCWPW1 peak intensity. The Y-axis indicates the overlap number, and the X-axis indicates the minimum cutoff of ZCWPW1 peak intensity. The red line represents the total number of ZCWPW1 peaks with a specific minimum cutoff for ZCWPW1 peak intensity. The black line represents the overlap number of ZCWPW1 peaks with DMC1 peaks with a specific minimum cutoff for ZCWPW1 peak intensity. (E) Pie chart showing the ratio of four DMC1 peak groups (Grey et al.) determined by their overlap with merged PRDM9 peaks (Grey et al.; Walker et al.) and ZCWPW1 peaks. + indicates overlap, - indicates no overlap. (F) The number of region (peak)-gene associations among distance stratifications of ZCWPW1 peaks in three subtypes within the TSS ± 1000 kb region.
Tables
Key resources table
| Reagent type (species) or resource | Designation | Source or reference | Identifiers | Additional information |
|---|---|---|---|---|
| Gene Mus musculus | zinc finger, CW type with PWWP domain 1(Zcwpw1) | Mouse Genome Informatics | MGI:2685899 | |
| Gene Mus musculus | PR domain containing 9 (Prdm9) | Mouse Genome Informatics | MGI:2384854 | |
| Strain, strain background Mus musculus C57BL6/J) | Mouse: C57BL/6J | Jackson laboratory | RRID:IMSR_JAX:000664 | All sexes used |
| Genetic reagent Mus musculus C57BL6/J) | Zcwpw1−/− | PMID:31453335 | Materials and methods section Generation of Zcwpw1 knockout mice | |
| Genetic reagent Mus musculus C57BL6/J) | Zcwpw1KI/KI | This study | Materials and methods section Mice | |
| Genetic reagent Mus musculus C57BL6/J) | Prdm9−/− | This study | Materials and methods section Mice | |
| Antibody | Rabbit polyclonal anti-ZCWPW1 | PMID:31453335 | IF 1:1000; WB 1:5000; ChIP 35 µg | |
| Antibody | Rabbit polyclonal anti-alpha Tubulin | Proteintech Group | 11224–1-AP RRID:AB_2210206 | WB 1:10000 |
| Antibody | Rat polyclonal anti-ZCWPW1 | This study | Materials and methods section IF 1:200 | |
| Antibody | Mouse polyclonal anti-SCP3 | Abcam | #ab97672 RRID:AB_10678841 | IF 1:500 |
| Antibody | Rabbit polyclonal anti-SCP1 | Abcam | # ab15090 RRID:AB_301636 | IF 1:2000 |
| Antibody | Rabbit polyclonal anti-RAD51 | Thermo Fisher Scientific | #PA5-27195 RRID:AB_2544671 | IF 1:200 |
| Antibody | Rabbit polyclonal anti-DMC1 | Santa Cruz Biotechnology | #sc-22768 RRID:AB_2277191 | IF 1:100 |
| Antibody | Mouse polyclonal anti-γH2AX | Millipore | #05–636 RRID:AB_309864 | IF 1:300 |
| Antibody | Mouse polyclonal anti-pATM | Sigma-Aldrich | #05–740 RRID:AB_309954 | IF 1:500 |
| Antibody | Rabbit polyclonal anti-MSH4 | Abcam | #ab58666 RRID:AB_881394 | IF 1:500 |
| Antibody | Rabbit polyclonal anti-RNF212 | this study | a gift from Mengcheng Luo, Wuhan University | Materials and methods section IF 1:500 |
| Antibody | mouse polyclonal anti-MLH1 | BD Biosciences | #550838 RRID:AB_2297859 | IF 1:50 |
| Antibody | Rabbit polyclonal anti-H3K4me3 | Abcam | #ab8580 RRID:AB_306649 | IF 1:500 ChIP 5 µg |
| Antibody | Rabbit polyclonal anti-H3K36me3 | Abcam | #ab9050 RRID:AB_30696 | IF 1:500 ChIP 5 µg |
| Antibody | Goat anti-rabbit IgG (H+L) cross-adsorbed secondary Antibody, Alexa Fluor 488 | Thermo Fisher Scientific | #A-11070 RRID:AB_142134 | IF 1:500 |
| Antibody | Goat anti-rabbit IgG H and L (Alexa Fluor 594) preadsorbed | Abcam | ab150084 RRID:AB_2734147 | IF 1:500 |
| Antibody | Goat anti-mouse IgG H and L (Alexa Fluor488) | Abcam | ab150113 RRID:AB_2576208 | IF 1:500 |
| Antibody | Goat anti-mouse IgG H and L (Alexa Fluor 594) preadsorbed | Abcam | ab150120 RRID:AB_2631447 | IF 1:500 |
| Antibody | Goat anti-rat IgG H and L (Alexa Fluor 488) preadsorbed | Abcam | ab150165 RRID:AB_2650997 | IF 1:500 |
| Sequence-based reagent | Primers used in this study | This study | All primers used in this study are shown in the methods | |
| Commercial assay or kit | NEBNext Ultra II DNA Library Prep Kit | NEB | E7645S | |
| Software, algorithm | Trimmomatic v0.32 | doi:10.1093/bioinformatics/btu170 | http://www.usadellab.org/cms/index.php?page=trimmomatic | |
| Software, algorithm | Bowtie2 v2.3.4.2 | doi:10.1038/nmeth.1923 | RRID:SCR_005476 | |
| Software, algorithm | Samtools and Picard | doi:10.1038/ng.806 | http://samtools.sourceforge.net | |
| Software, algorithm | MACS2 v2.1.0 | doi:10.1186/gb-2008-9-9-r137 | RRID:SCR_013291 | |
| Software, algorithm | Integrative Genomics Viewer | doi:10.1038/nbt.1754 | RRID:SCR_011793 | |
| Software, algorithm | Deeptools2 | doi:10.1093/nar/gkw257 | http://deeptools.ie-freiburg.mpg.de | |
| Software, algorithm | HOMER software | doi: 10.1016/j.molcel.2010.05.004 | RRID:SCR_010881 | |
| Software, algorithm | GREATER software | doi:10.1038/nbt.1630 | http://great.stanford.edu | |
| Software, algorithm | regioneR package version1.18.1 | doi: 10.1093/bioinformatics/btv562 | http://www.bioconductor.org/packages/regioneR | |
| Software, algorithm | hisat2 v2.1.0 | doi: 10.1038/nprot.2016.095 | http://github.com/infphilo/hisat2 | |
| Software, algorithm | DESeq2 v 1.18.0 | doi: 10.1186/s13059-014-0550-8 | RRID:SCR_015687 | |
| Software, algorithm | Metacape | doi: 10.1038/s41467-019-09234-6 | http://metascape.org |
Additional files
-
Supplementary file 1
Summary of all ChIP-seq experiments indicating antibodies, samples, replicates, genotype and data source.
- https://cdn.elifesciences.org/articles/53459/elife-53459-supp1-v3.xlsx
-
Supplementary file 2
ZCWPW1 peaks in WT and Prdm9 knockout mice.
- https://cdn.elifesciences.org/articles/53459/elife-53459-supp2-v3.xlsx
-
Supplementary file 3
Down-regulated and up-regulated genes in Zcwpw1−/− (vs WT) whose promoters overlap with ZCWPW1 peaks.
- https://cdn.elifesciences.org/articles/53459/elife-53459-supp3-v3.xlsx
-
Transparent reporting form
- https://cdn.elifesciences.org/articles/53459/elife-53459-transrepform-v3.docx
Download links
A two-part list of links to download the article, or parts of the article, in various formats.
Downloads (link to download the article as PDF)
Open citations (links to open the citations from this article in various online reference manager services)
Cite this article (links to download the citations from this article in formats compatible with various reference manager tools)
The histone modification reader ZCWPW1 links histone methylation to PRDM9-induced double-strand break repair
eLife 9:e53459.
https://doi.org/10.7554/eLife.53459


