The primary structural photoresponse of phytochrome proteins captured by a femtosecond X-ray laser
- Department of Chemistry and Molecular Biology, University of Gothenburg, Sweden
- Department of Biological and Environmental Science, Nanoscience Center, University of Jyvaskyla, Finland
- Department of Anatomy, Faculty of Medicine, University of Helsinki, Finland
- Physics Department, University of Wisconsin-Milwaukee, United States
- Department of Biology, Northeastern Illinois University, United States
- Department of Chemistry, Nanoscience Center, University of Jyvaskyla, Finland
- Department of Cell Biology, Graduate School of Medicine, Kyoto University, Japan
- RIKEN SPring-8 Center, Japan
- Japan Synchrotron Radiation Research Institute, Japan
- Department of Biochemistry and Molecular Biology and Institute for Biophysical Dynamics, University of Chicago, United States
Figures
Figure 1 with 5 supplements
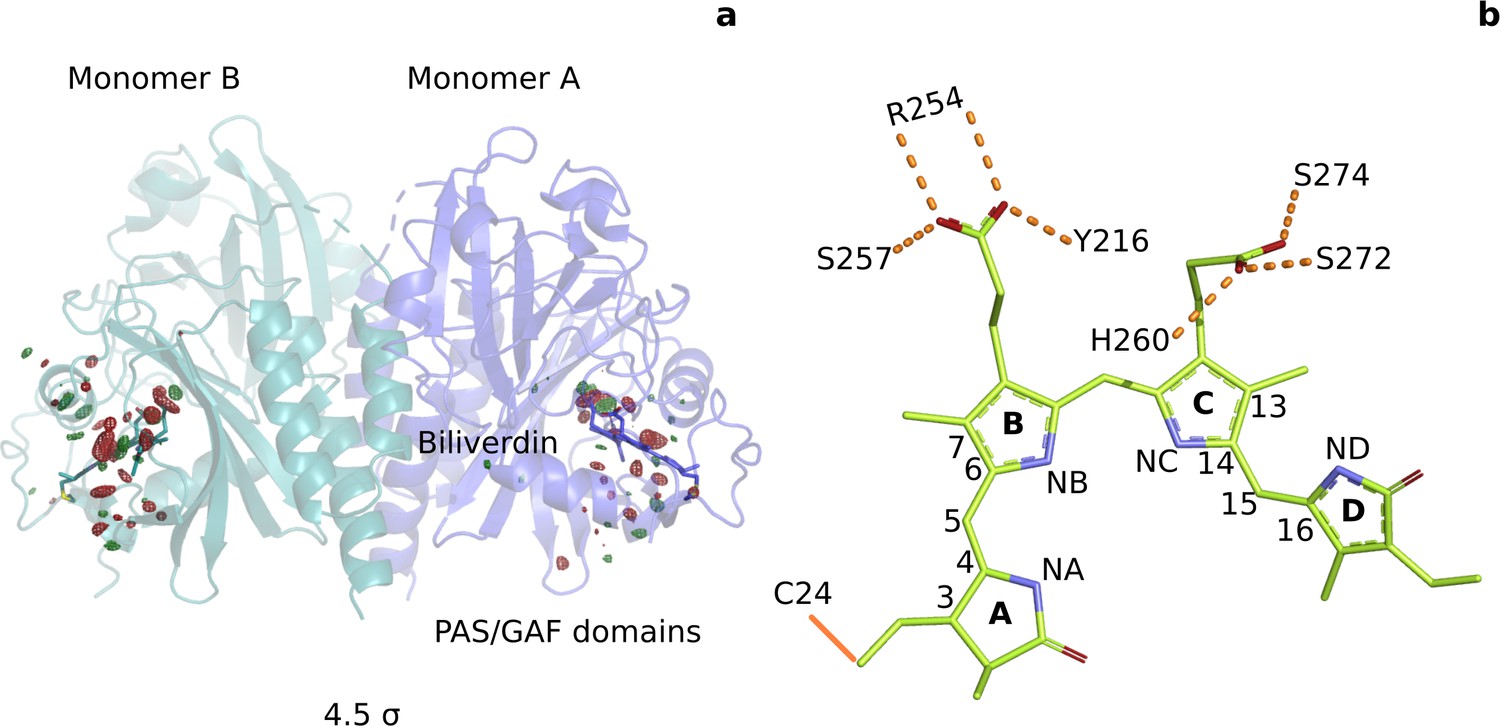
Photoinduced observed difference electron density features are focused on the chromophore binding pocket.
(a) The observed difference electron density map at 1 ps is displayed together with the DrBphPdark structure. Red and green electron density peaks, contoured at 4.5 σ, denote negative and positive densities, respectively. Monomer A is colored blue and monomer B is in aqua. (b) Schematic illustration of the biliverdin chromophore. The hydrogen-bonding networks between the propionate groups and the protein are marked with dashed lines. In DrBphP, the chromophore is covalently linked to a cysteine residue in the PAS domain (solid line).
Figure 1—figure supplement 1
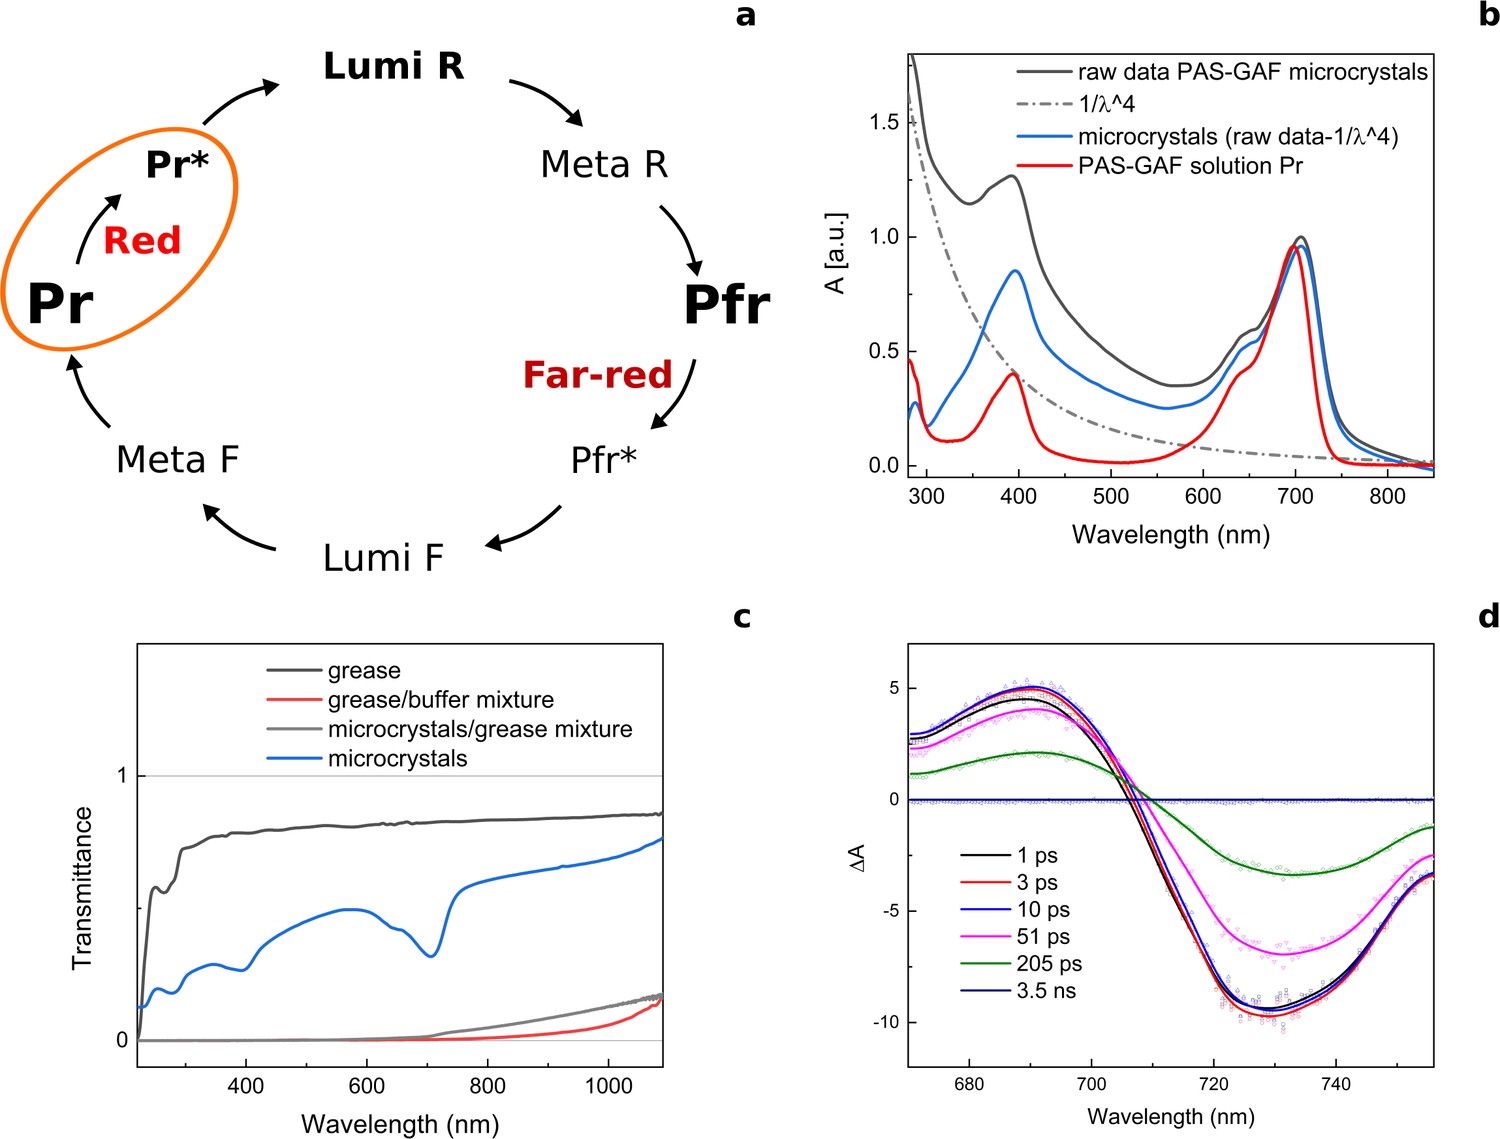
The photocycle of Deinococcus radiodurans phytochrome (DrBphP) and the spectral properties of its PAS-GAF fragment in the microcrystalline form.
(a) Schematic illustration of the photoconversion between Pr and Pfr states in DrBphP. We note that the final state of the PAS-GAF fragment (also referred to as chromophore-binding domain, CBD) does not have the same spectral shape as in full-length phytochromes. (b) Raw absorption spectra of the DrBphPCBD microcrystals in buffer (black), scattering correction (1/λ4, dash dot), scattering corrected absorption spectra of the DrBphPCBD microcrystals (blue), and DrBphPCBD in solution in the Pr-state (red). (c) Transmission spectra of the grease (black), grease mixed with crystallization buffer (red), DrBphPCBD microcrystals in the grease matrix (measured in the 50 µm path length), and DrBphPCBD microcrystals in buffer. The microcrystals delivered to the beam are mixed with a viscous grease media. Although the Super Lube grease used in SFX experiments has a low background for X-rays, once it is mixed with the aqueous crystal buffer, the microcrystal/grease mixture exhibits significant scattering of visible light. The scattering varied with the mixing procedure. For the optical measurements, we reproduced the mixing procedure used at the XFEL as closely as possible. We estimate that the light intensities inside the grease jet are attenuated by at least two orders of magnitude. (d) Transient absorption spectra of DrBphPCBD microcrystals in buffer taken at different time delays after excitation. The spectra show a typical excited state signal of phytochromes (Toh et al., 2010). A Lumi-R signal was not observed, which is typically present on the ns-timescale after the excitation in the transient optical absorption data of phytochromes in solution.
Figure 1—figure supplement 2
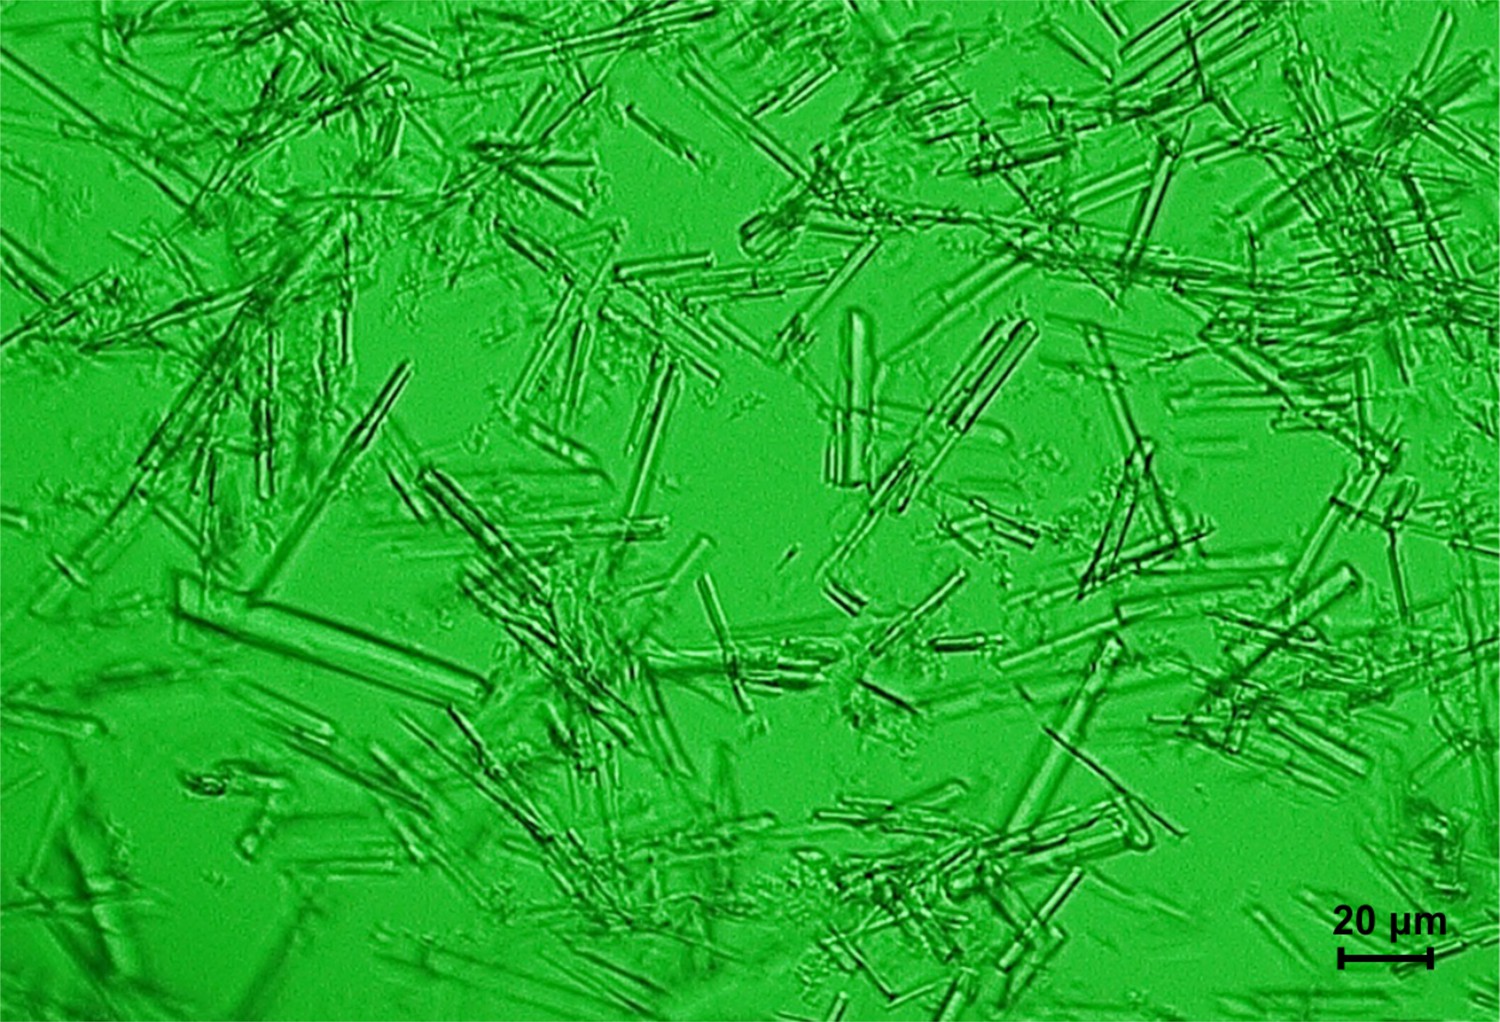
Microcrystals used for SFX data acquisition in SACLA.
The crystals reported here were shaped as needles of 20–70 µm.
Figure 1—figure supplement 3
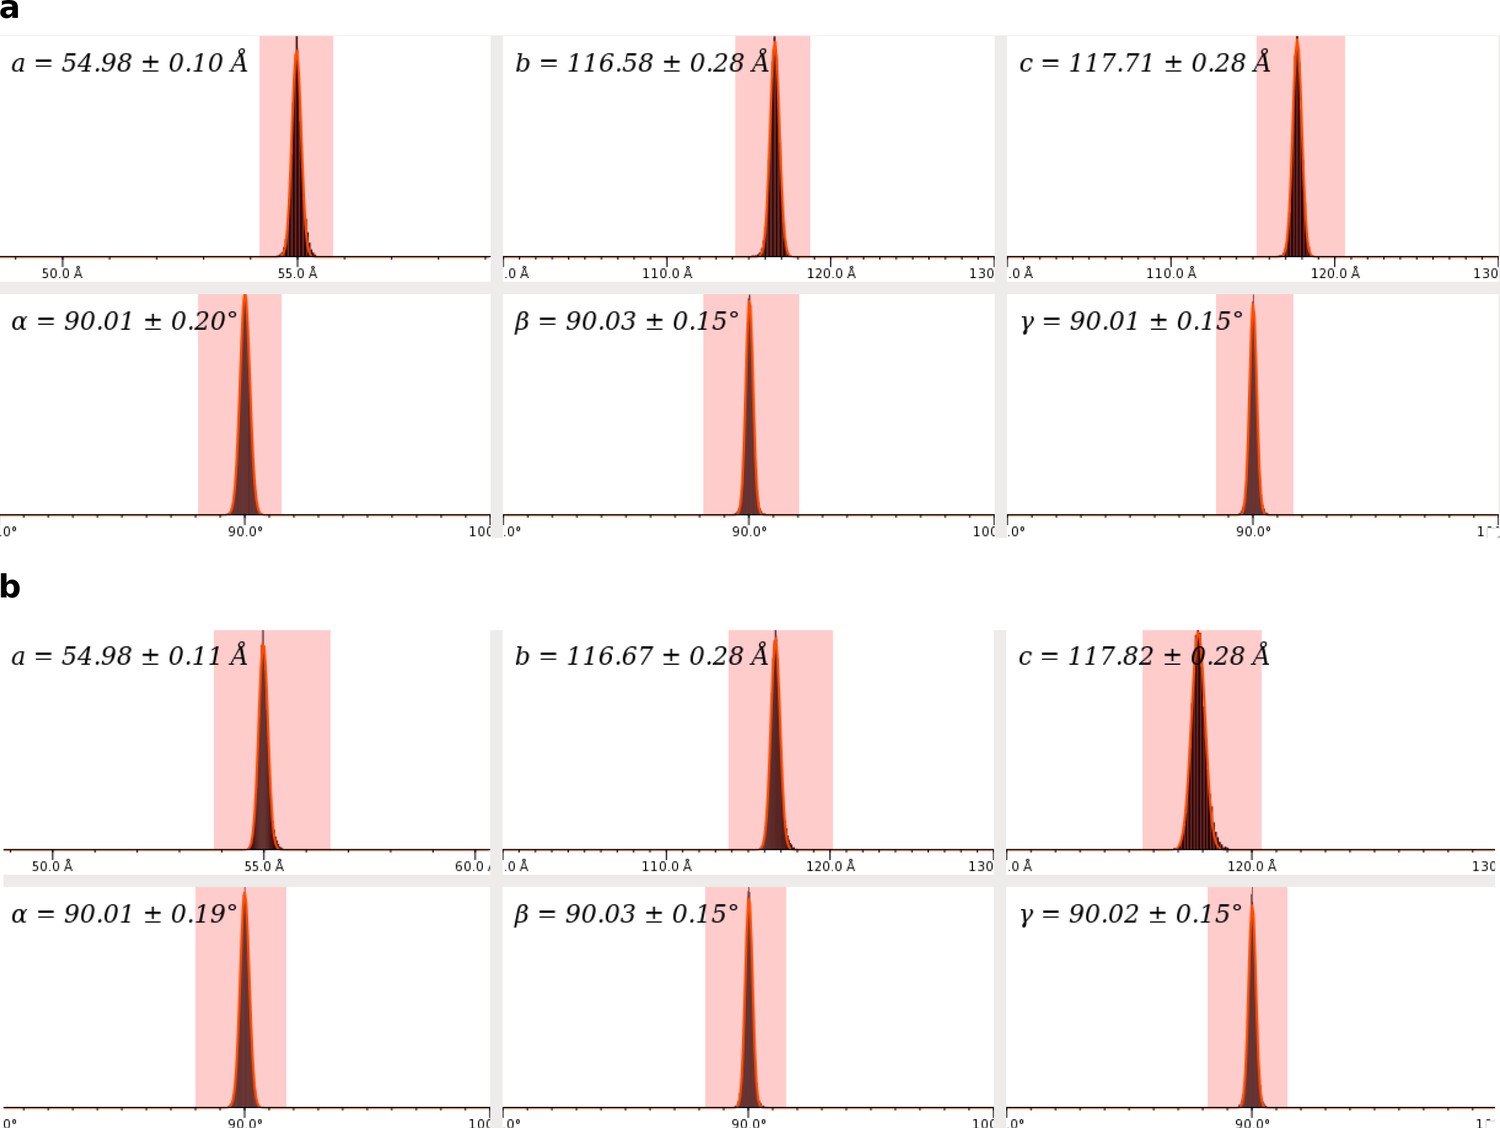
Unit cell parameters distribution of SFX data sets.
(a) Unit cell parameters for dark data set. (b) Unit cell parameters for 1 ps data set. Both data sets indicate orthorhombic crystals.
Figure 1—figure supplement 4
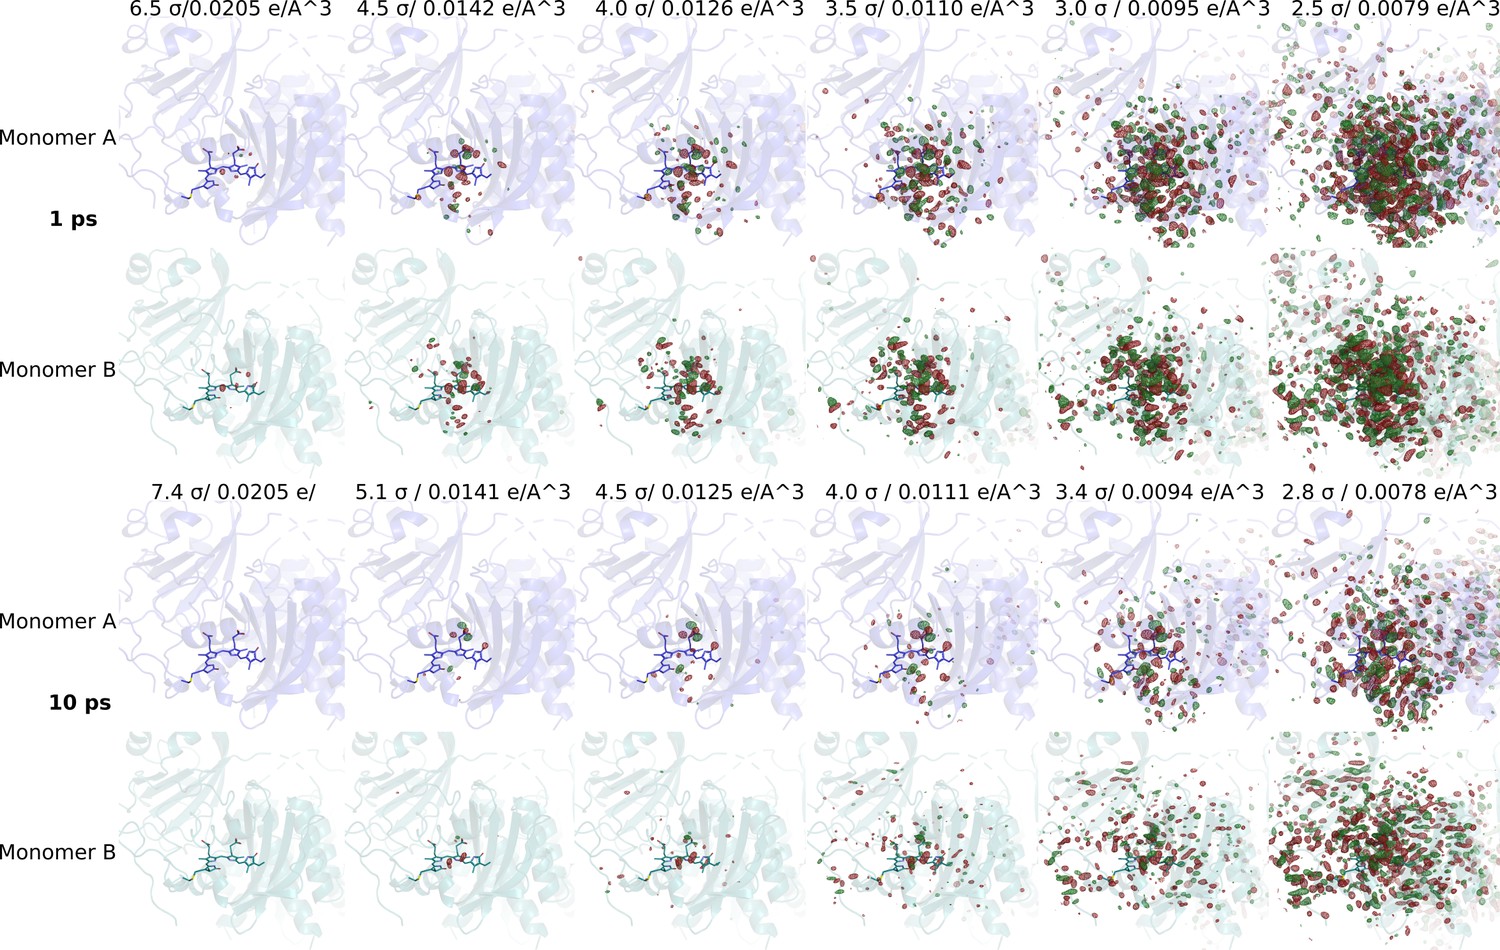
Significant difference electron density features observed.
Difference electron density maps at 1 ps and 10 ps for monomer A and B are shown together with the DrBphPdark structure (monomer A: blue, monomer B: aqua). Red and green contour surfaces denote negative and positive densities, respectively. The maps are contoured at electron density levels as indicated. We determine the background level to be at 3σ for 1 ps and at 3.4σ for 10 ps, since below these levels random signals outside the chromophore region appear.
Figure 1—figure supplement 5
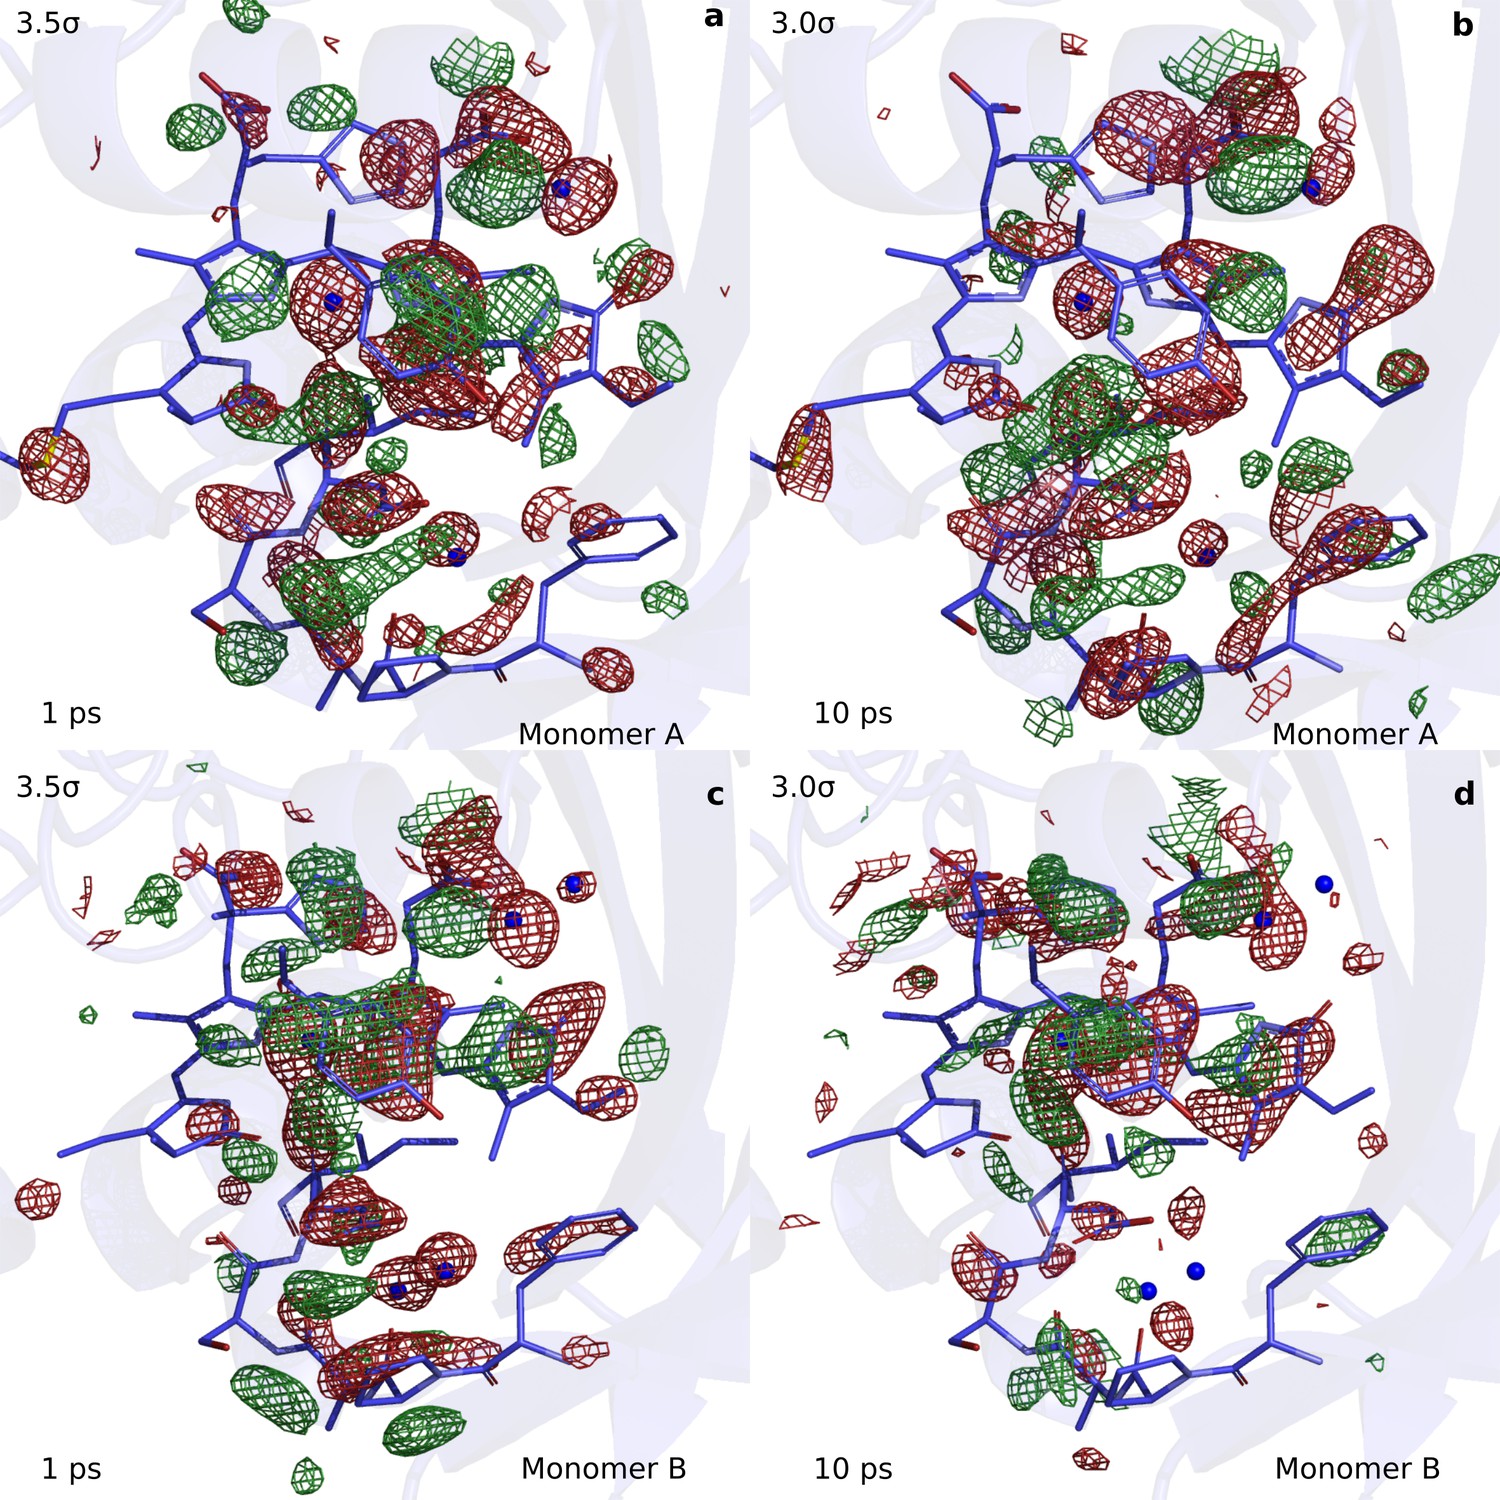
Comparison of the observed difference electron density maps at 1 ps and 10 ps.
The observed difference electron density map at (a) 1 ps plotted for monomer A, (b) at 10 ps for monomer A, (c) at 1 ps monomer B, and (d) at 10 ps for monomer B. The maps are plotted at 3.5σ and 3σ for 1 ps and 10 ps, respectively. Most off the difference features discussed here are present in both maps, although at a lower signal strength in the 10 ps map.
Figure 2
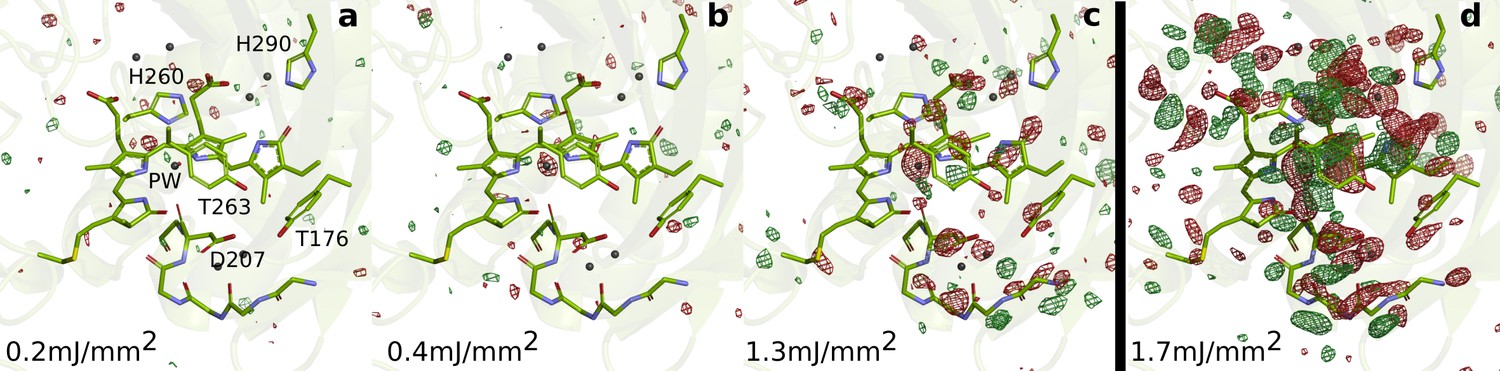
SFX data as a function of excitation fluence.
The DrBphPdarkstructure (green) is shown together with the observed difference electron density, contoured at 3.5 σ, at 1 ps collected using (a) 0.2 mJ/mm2, (b) 0.4 mJ/mm2, (c) 1.3 mJ/mm2, and (d) 1.7 mJ/mm2. All spot sizes were computed assuming Gaussian line shapes with the convention. The data shown in panel A-C were collected at SACLA in May 2019, whereas the data shown in panel D was collected in October 2018. The same experimental setup was used in both occasions. The laser energy of the experiment in 2018 can be found in the Materials and methods section. The energies for the experiment in 2019 were 16 µJ, 42 µJ, and 106 µJ (panels A-C, respectively). During the experiment in 2019, the femtosecond laser beam was misaligned by 50 µm distance from the interaction spot between X-rays and jet in the direction of flow. The laser intensities were corrected for this displacement assuming a Gaussian line shape. The excitation fluence is similar to previous femtosecond time-resolved SFX experiments (Nogly et al., 2018; Pande et al., 2016; Barends et al., 2015; Coquelle et al., 2018); however, we found high scattering in the grease/buffer mixture (Figure 1—figure supplement 1). Since the crystallographic signals were reduced when lowering the excitation fluence and disappeared completely when reaching 1/10 of the maximum value, we conclude that the excitation fluence that actually reaches the crystals in the grease matrix is much lower than the incoming photon fluence and that the photoexcitation is in the single-photon regime.
Figure 3 with 4 supplements
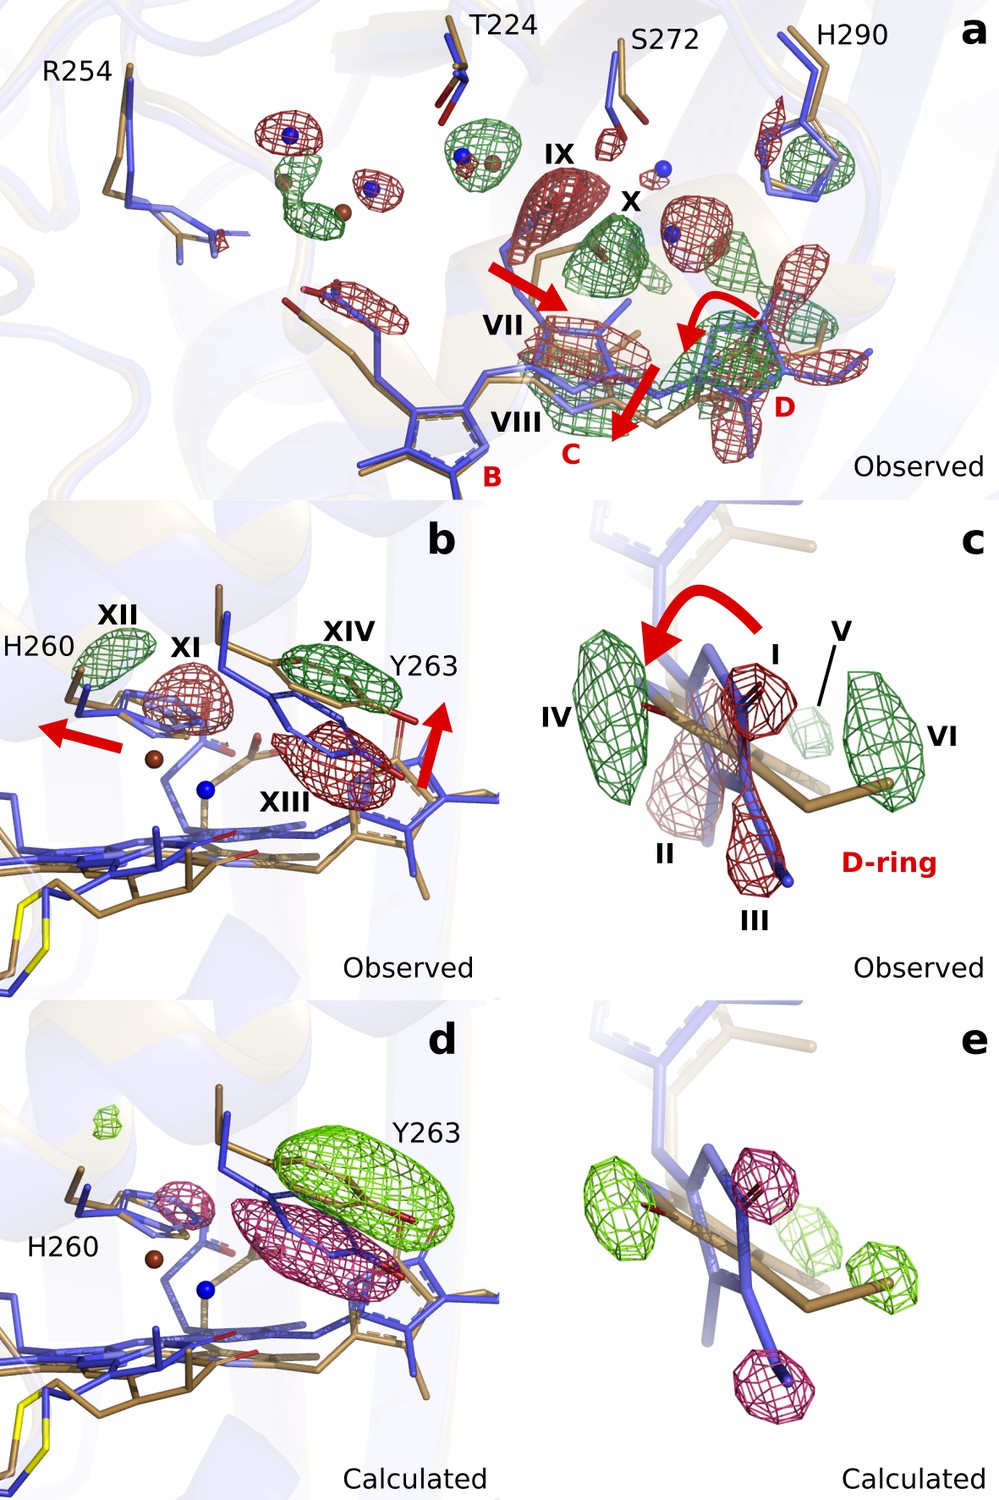
Observed and calculated difference electron densities reveal a twist of the D-ring and significant protein rearrangements.
The observed difference electron density with the refined DrBphPdark(blue) and DrBphP1ps(beige) structures, shown for (a) the B-, C-, and D-ring surroundings, (b) the strictly conserved His260 and Tyr263, and (c) the D-ring. The calculated difference electron density shown for (d) His260 and Tyr263 and (e) the D-ring. The D-ring twists counter-clockwise when viewed along C15-C16 bond toward the C-ring. The observed difference electron density is contoured at 3.3 σ. And the calculated difference electron density is contoured at 3.5 and 5.0 σ for panel d and e, respectively. Monomer A is shown in this figure.
Figure 3—figure supplement 1
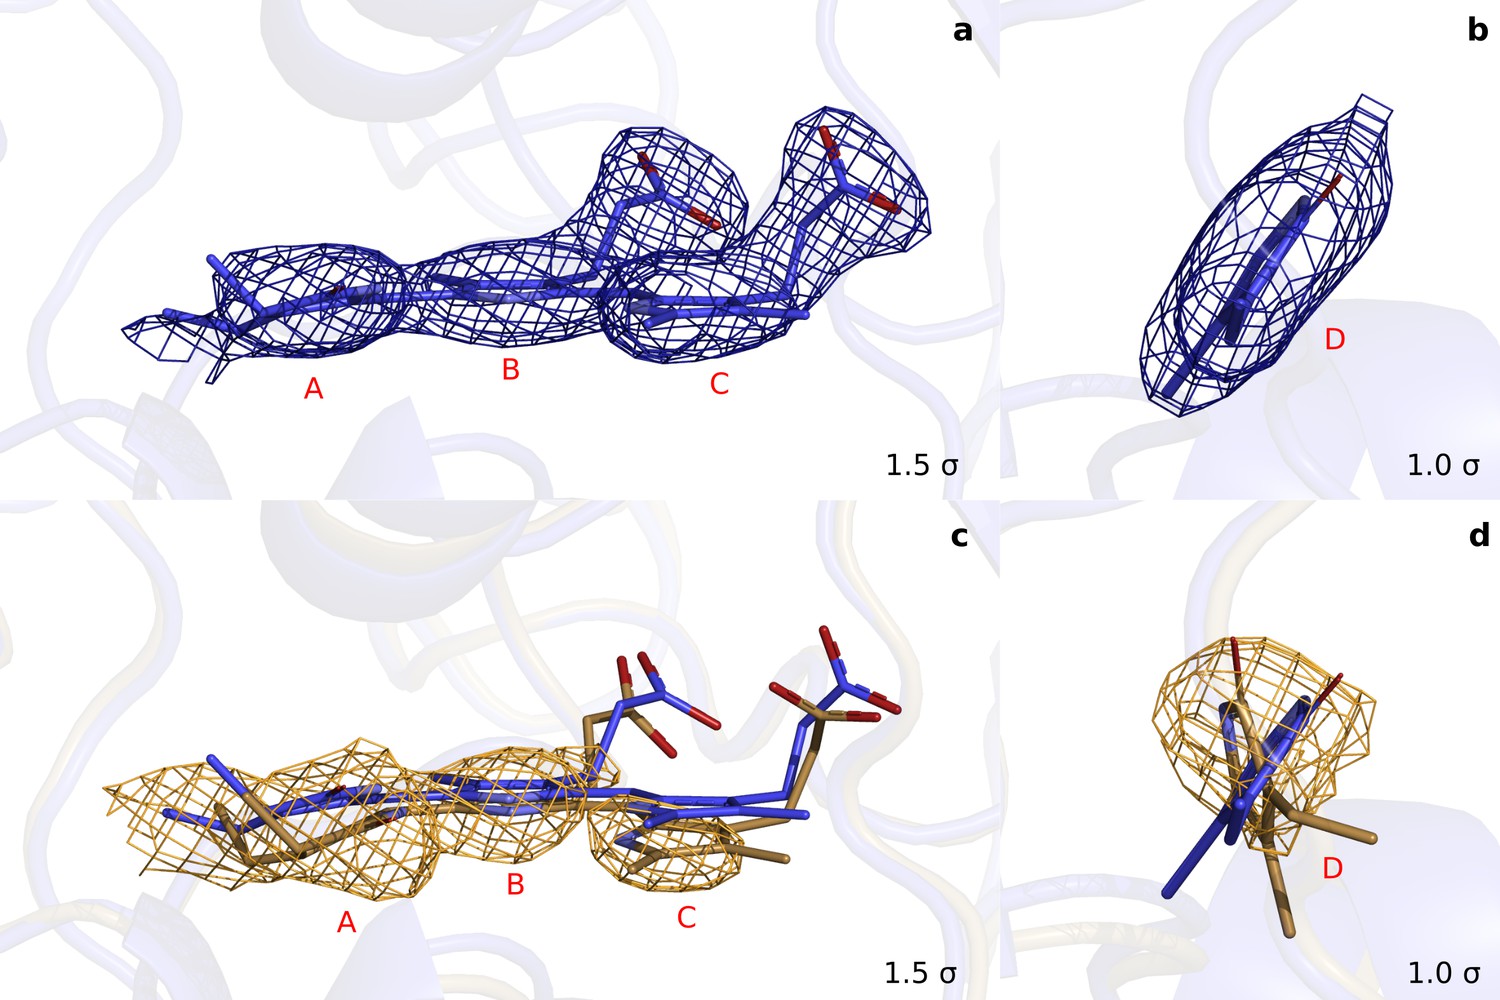
Extrapolated maps at demonstrate that the D-ring twists in the photoactivated state.
(a). Rings A to C of monomer A together with the maps of the refined dark structure (DrBphPdark: blue). (b). The same data for the D-ring in a different orientation. (c) and (d). Equivalently, the refined structure (DrBphP1ps: beige) of the chromophore in monomer A together with the extrapolated map at 1 ps. (, phases from the dark structure). We observed a round-shape feature for the D-ring, but flat densities for C-ring (downward shift) and B-ring (almost unshifted). This suggests that the D-ring twists significantly. For the A-ring we observe a broad density, with the strongest contribution indicating a twisted or tilted ring.
Figure 3—figure supplement 2
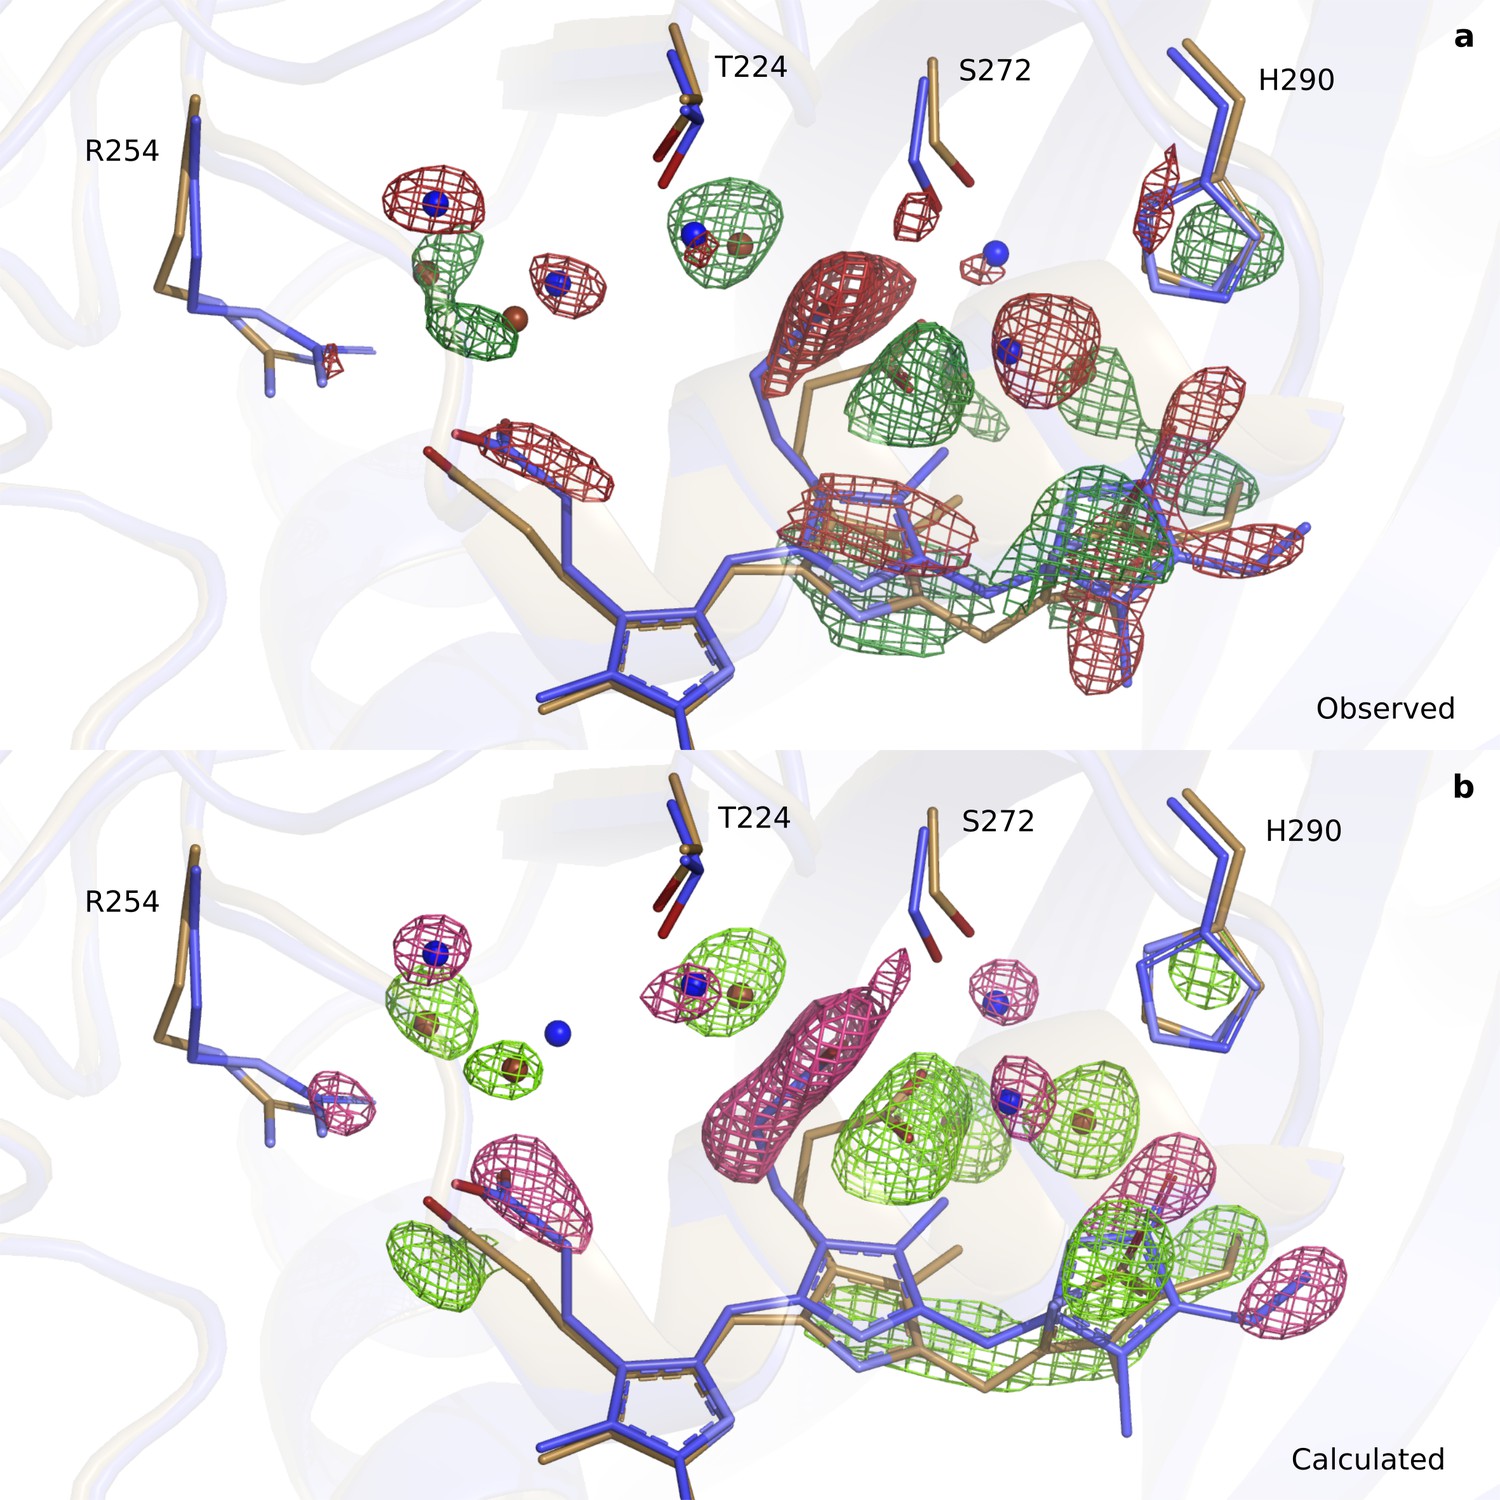
Comparison of observed (upper panel) and calculated (lower panel) difference electron densities indicate good agreement around the B-D rings.
(a). The observed difference electron density map (3.3 σ) is displayed for the B-D ring surroundings of the DrBphPdark (blue) and the DrBphP1ps structure (beige) for monomer A. (b). The same view and structures displayed with the calculated difference electron density map contoured at 4.5 σ.
Figure 3—figure supplement 3
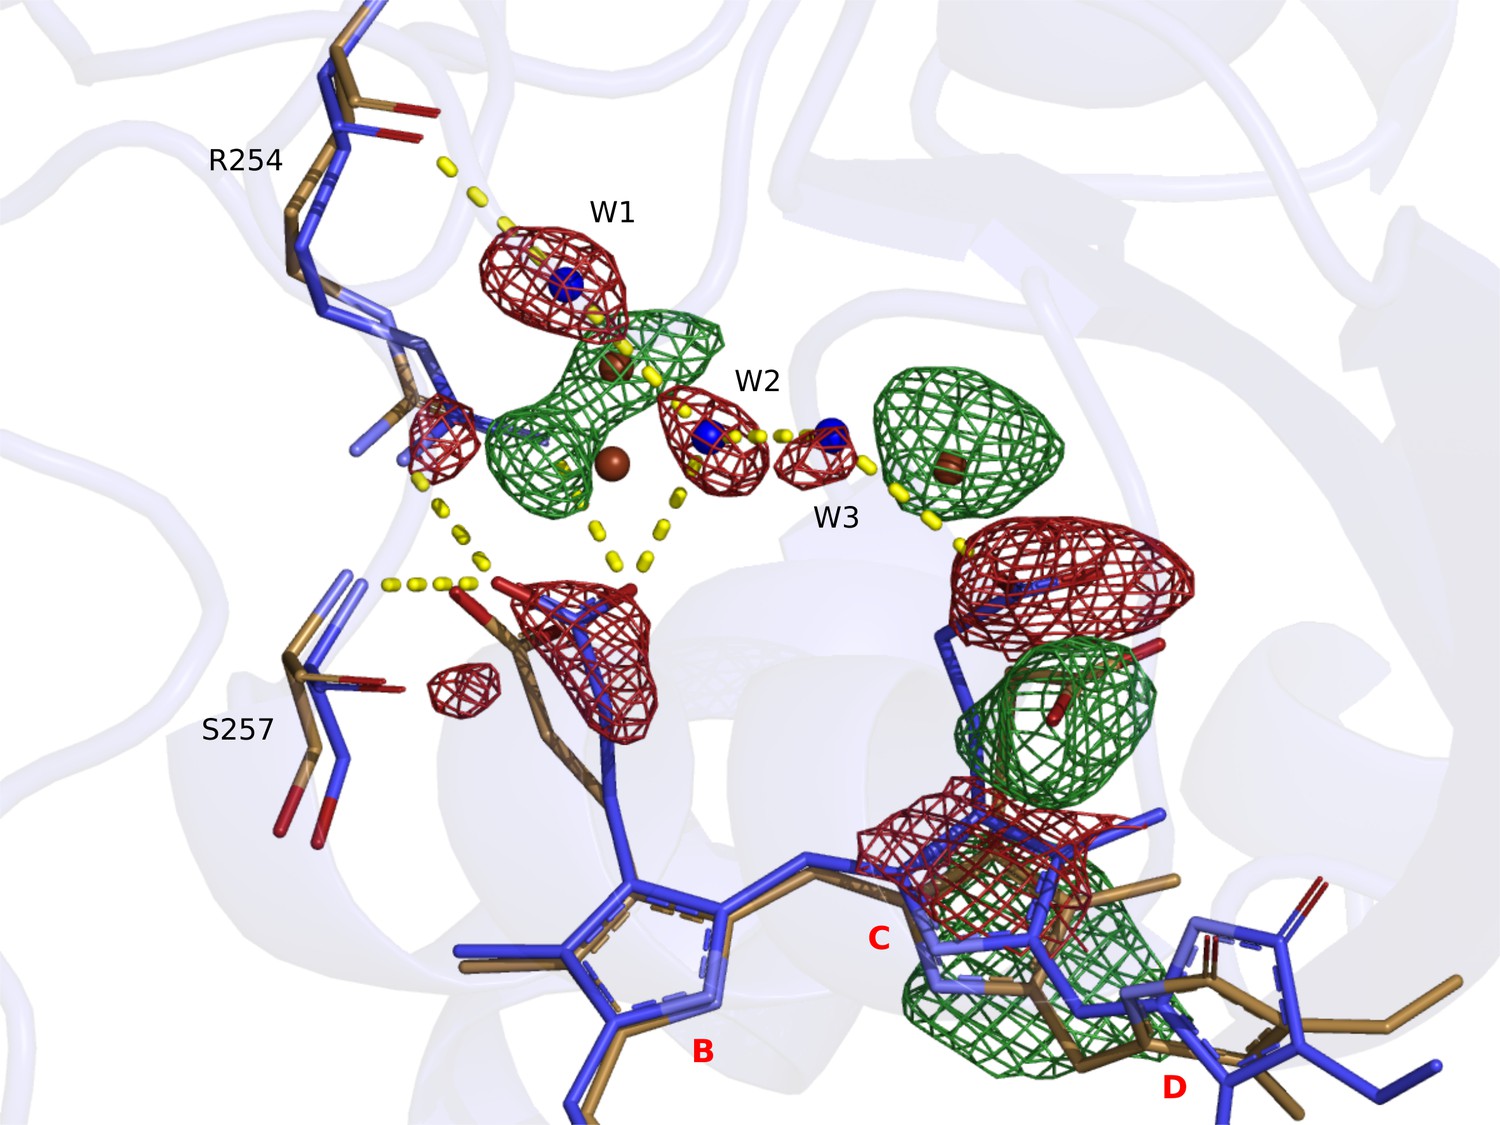
Hydrogen bonding network between the chromophore propionate groups is disrupted at 1 ps delay time.
Correlating negative and positive density features indicate that the C-ring moves downwards, together with the C-ring propionate. The negative density features located on the propionate groups, three waters (W1, W2 and W3), Arg254, and Ser257 collectively indicate that the hydrogen bonding network is resolved at 1 ps. Difference electron density features are not observed on the B-ring. DrBphPdark is shown in blue and DrBphP1ps in beige. The chromophore is shown for monomer A together with the observed difference map at 1 ps delay time, contoured at 3.0 σ.
Figure 3—figure supplement 4
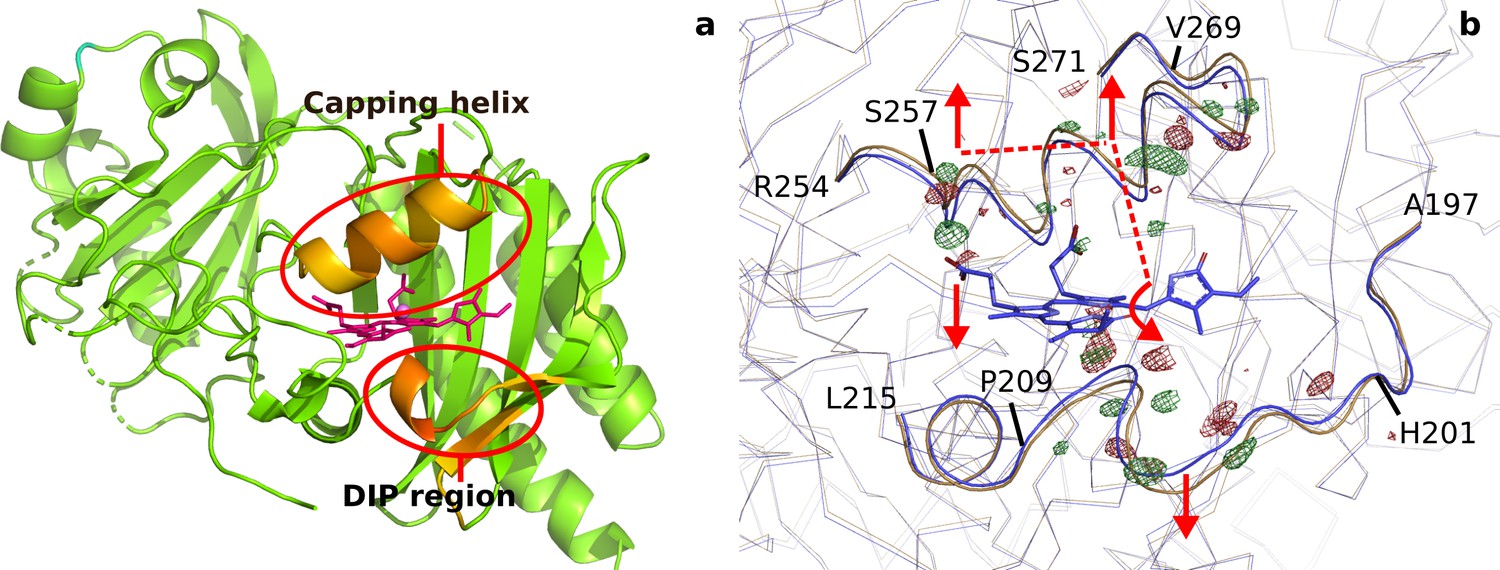
Backbone movements at 1 ps.
(a). Difference (DrBphP1ps-DrBphPdark) in distances between each Cα and the pyrrole water (DrBphPdark) plotted for all differences that are larger than 0.45 Å for monomer B. Longer distances are colored red and biliverdin is shown as pink sticks. The regions that move the most, the ’DIP region’ and the ’capping helix’ above the chromophore are marked with red circles. (b). The observed difference electron densities indicate backbone movements away from the chromophore for residues 201–209 and 257–269, and an expansion of the chromopore-binding pocket. The DrBphPdark structure is colored blue and the DrBphP1ps structure is colored beige. The observed electron density map is contoured at 4.0 σ. The dashed lines indicate the proposed signal transduction pathway from D-ring to B-ring propionate.
Figure 4 with 1 supplement
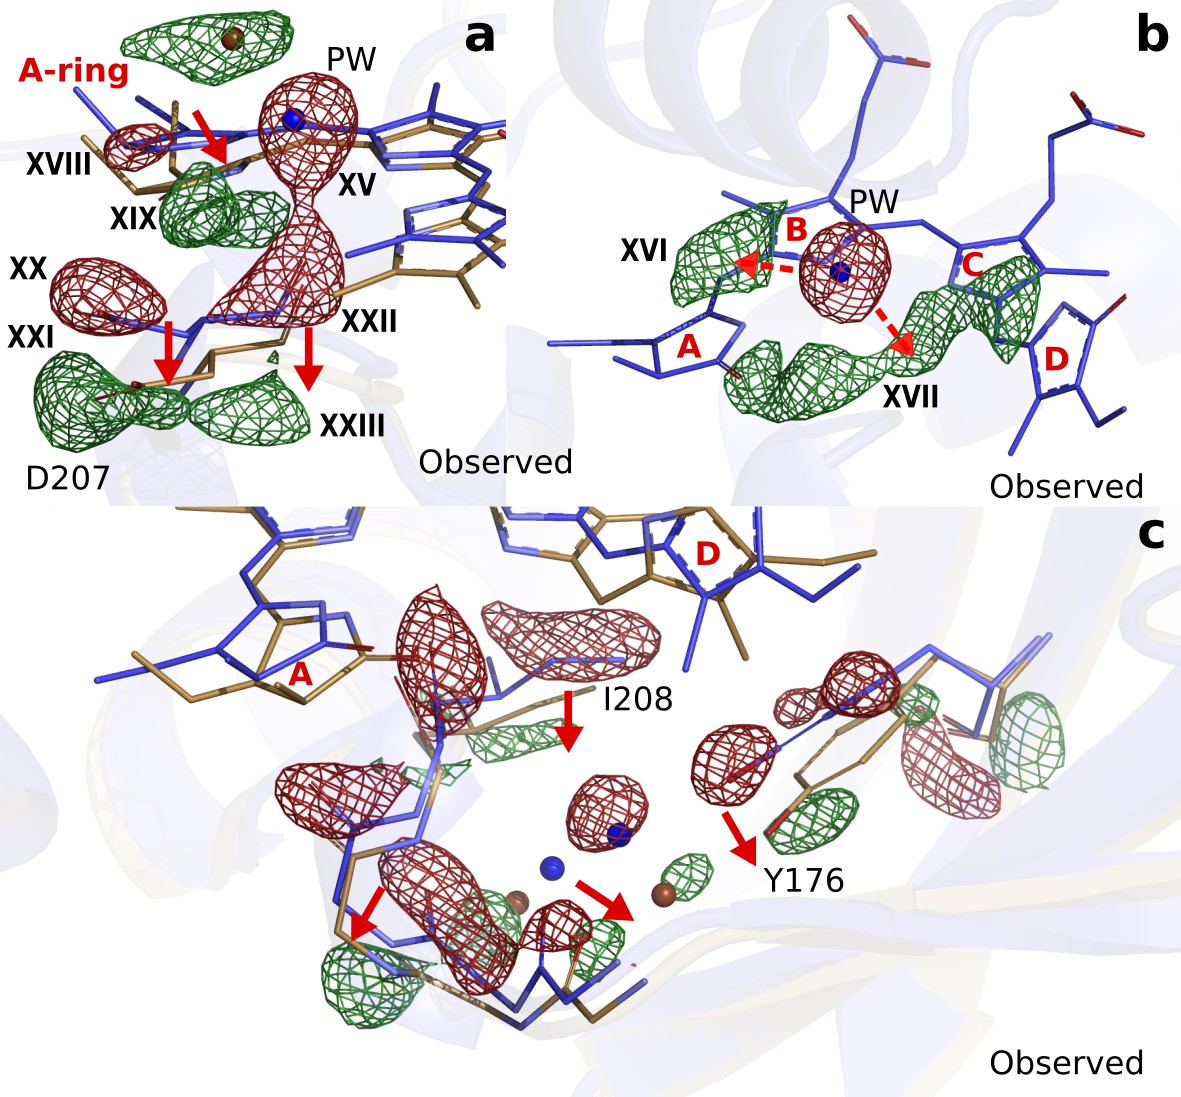
Photodissociation of the pyrrole water, displacement of the A-ring and its effect on the proteins scaffold.
(a). The observed difference electron density displayed with the DrBphPdark (blue) and DrBphP1ps (beige) structures around the A-ring, Asp207 and pyrrole water (PW). The structural model was inconclusive as to whether the A-ring twists around the double bond between the B- and A-ring, or whether it tilts downward hinged on the connection between C- and B-ring. (b). The regions of the pyrrole water (PW) and the area between the pyrrole rings show negative and positive densities, respectively. The observed difference electron density is contoured at 3.3σ. (c). Density displayed for the backbone below the A-ring, including side chains of the strictly conserved Ile208 and Tyr176 as well as the surrounding water network. Monomer A is shown in this figure.
Figure 4—figure supplement 1
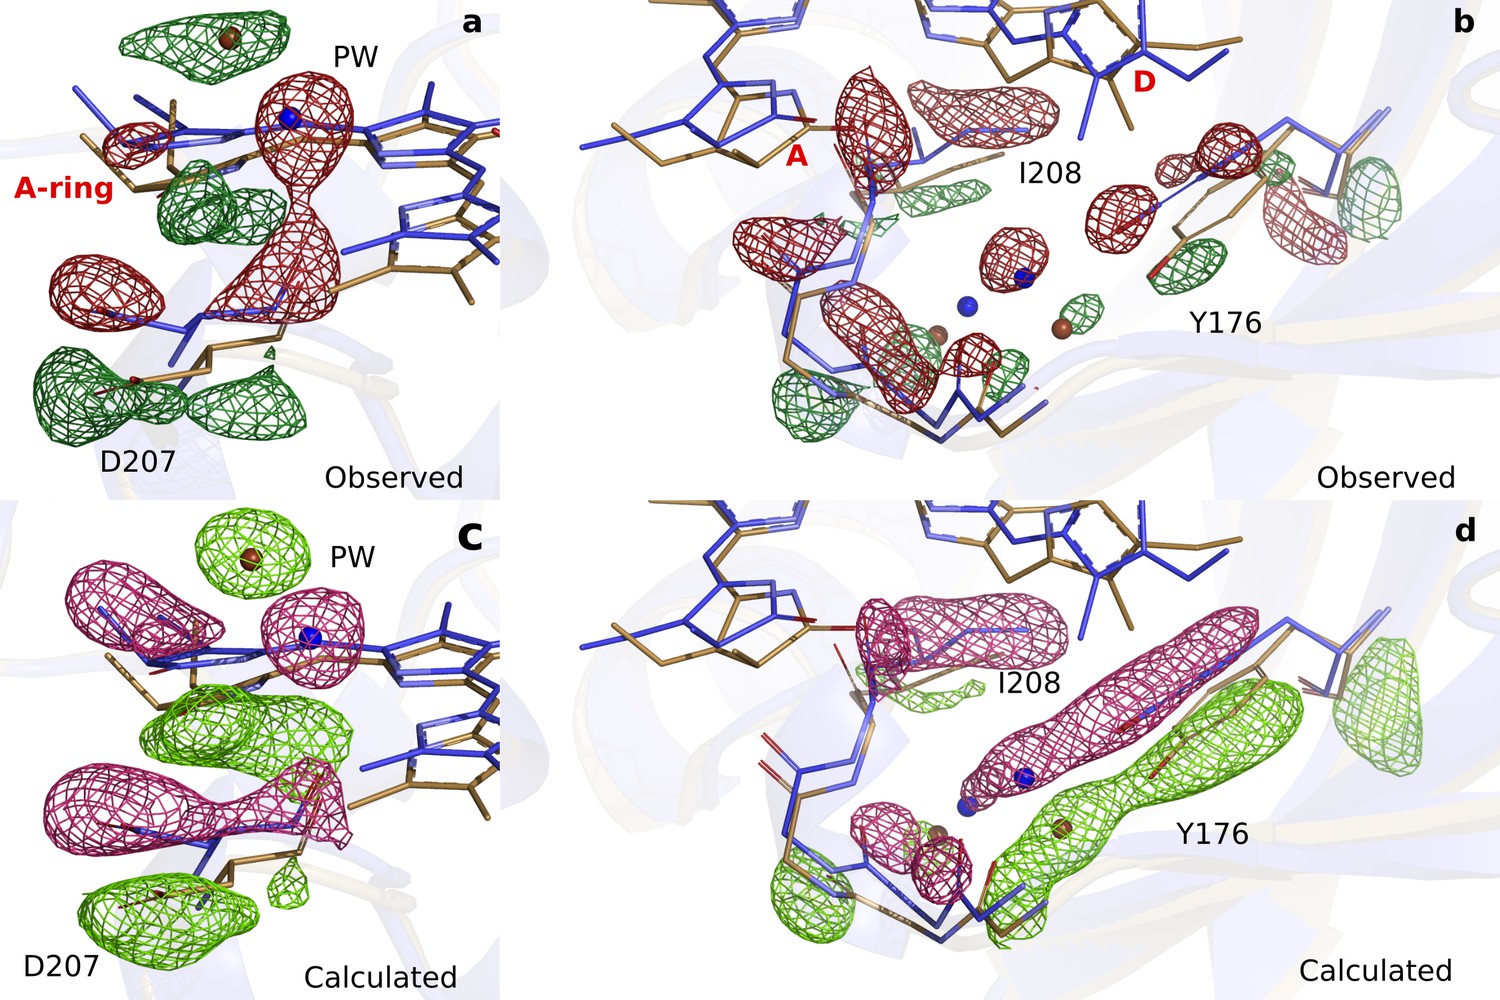
Comparison of observed and calculated difference electron densities in the A-ring region.
(a). The observed difference electron density is displayed together with the DrBphPdark (blue) and the DrBphP1ps (beige) structures for monomer A. The data is shown around the A-ring, Asp207 and pyrrole water (PW). (b). For the backbone below the A-ring, side chains shown for the strictly conserved Ile208 and Tyr176 as well as the surrounding water network. (c). The same view as panel A displayed together with the calculated difference electron density. (d). The same view as panel B displayed together with the calculated difference electron density. The observed and calculated difference electron density maps are contoured at 3.3 σ and 3.5 σ, respectively.
Figure 5

Two correlated photochemical events guide the primary photorespone of phytochrome proteins.
(a). The structures (DrBphPdark, blue and DrBphP1ps, beige) indicate that rotation of the D-ring initiates breakage of non-covalent bonds of the propionates to the protein scaffold. Even the C- and A-rings are displaced significantly and the pyrrole water is dislocated from its original location at 1 ps (shade). (b). The same structures are overlayed with the complete photosensory core in Pr state (PDB ID 4O0P, pink) (Takala et al., 2014). The scissor-like separation of Asp207 and Tyr263 could result in breakage of the hydrogen bonds to Arg466 of the conserved PRXSF motif located in the PHY-tongue region.
Tables
Table 1
Crystallographic table.
| Dark | one ps | 10 ps | |
|---|---|---|---|
| PDB code | 6T3L | 6T3U | |
| Data collection | |||
| Temperature (K) | 293 | 293 | 293 |
| Space Group | P212121 | P212121 | P212121 |
| Cell dimensions (a, b, c) | |||
| a, b, c (Å) | 54.98 116.69 117.86 | 54.98 116.69 117.86 | 54.98 116.69 117.86 |
| , , () | 90.0 90.0 90.0 | 90.0 90.0 90.0 | 90.0 90.0 90.0 |
| Data resolution overall (Å)‡ | 45.77–2.07 | 41.46–2.21 | 45.77–2.14 |
| (2.10–2.07) | (2.25–2.21) | (2.17–2.14) | |
| (%) | 5.79 (120.05) | 10.59 (114.64) | 5.70 (121.86) |
| SNR (I/ | 9.21 (0.83) | 6.10 (0.88) | 10.11 (0.99) |
| CC(1/2) | 0.99 (0.33) | 0.98 (0.38) | 0.99 (0.344) |
| Completeness (%)‡ | 100 (100) | 100 (100) | 100 (100) |
| Multiplicity‡ | 461.35 (65.9) | 106.11 (34.3) | 347.36 (62.1) |
| Number of hits | 149074 | 42853 | 159997 |
| Number of indexed patterns | 70726 | 21150 | 70335 |
| Indexing rate(%) | 47.44 | 49.35 | 43.96 |
| Number of total reflections | 24017763 | 5310179 | 17823530 |
| Number of unique reflections | 52060 | 39316 | 43279 |
| Refinement | |||
| Resolution (Å) | 45.82–2.07 | 36.94–2.21 | |
| (2.12–2.07) | (2.27–2.21) | ||
| / | 0.162/0.191 | 0.230/0.256 | |
| (0.317/0.346) | (0.411/0.443) | ||
| Number of atoms | 5123 | 5135 | |
| Average B factor (Å2) | 76.44 | 78.63 | |
| R.m.s deviations | |||
| Bond lengths (Å) | 0.007 | 0.006 | |
| Bond angles () | 1.251 | 1.152 |
-
† Rsplit = .
‡ Highest resolution shell is shown in parentheses.
-
§ Ratio of the number of indexed images to the total number of hits.
Table 2
Difference electron density features listed for certain atoms.
| Object | Label | 1ps | 1ps | 10ps | 10ps |
|---|---|---|---|---|---|
| A | B | A | B | ||
| Pyrrole Water | |||||
| Pyrrole Water (-) | XV | −8.2σ | −9.4σ | −5.0σ | −6.5σ |
| Pyrrole Water (+) Alt. 1 | XVI | 4.8σ | 4.2σ | 3.0σ | 3.4σ |
| Pyrrole Water (+) Alt. 2 | XVII | 4.4σ | 5.8σ | 3.0σ | 3.3σ |
| D-ring | |||||
| D-ring N-H/C = O (-) | I | −4.2σ | −7.3σ | −6.4σ | −5.1σ |
| D-ring Methyl (-) | II | −4.3σ | −3.5σ | −2.9σ | −4.9σ |
| D-ring Vinyl (-) | III | −4.0σ | −4.8σ | −3.5σ | −3.4σ |
| D-ring N-H/C = O (+) | IV | 4.6σ | 6.4σ | 4.6σ | 4.1σ |
| D-ring Methyl (+) | V | 3.5σ | 3.4σ | - | - |
| D-ring Vinyl (+) | VI | 4.1σ | 4.6σ | 3.4σ | 2.6σ |
| C-ring | |||||
| C-propionate (-) | IX | −6.4σ | −5.8σ | −5.9σ | −4.7σ |
| C-ring (-) | VII | −5.5σ | −4.4σ | −5.1σ | −3.2σ |
| C-propionate (+) | X | 6.9σ | 6.4σ | 7.4σ | 4.9σ |
| C-ring (+) | VIII | 4.9σ | 5.2σ | 3.2σ | 5.4σ |
| A-ring | |||||
| A-ring C = O (-) | XVIII | −4.3σ | −4.7σ | −3.6σ | −2.9σ |
| A-ring C = O (+) | XIX | 5.2σ | 5.0σ | 5.7σ | 4.7σ |
| His260 | |||||
| His260 Sidechain(-) | XI | −6.7σ | −5.2σ | −6.3σ | −4.1σ |
| His260 Sidechain(+) | XII | 4.3σ | 4.5σ | 3.5σ | 3.2σ |
| Tyr263 | |||||
| Tyr263 Sidechain(-) | XIII | −6.9σ | −7.0σ | −4.7σ | −6.2σ |
| Tyr263 Sidechain(+) | XIV | 4.8σ | 4.9σ | 3.0σ | 4.3σ |
| Asp207 | |||||
| Asp207 Sidechain (-) | XX | −6.2σ | −6.7σ | −5.6σ | −3.4σ |
| Asp207 Sidechain(+) | XXI | 5.7σ | 5.0σ | 4.2σ | - |
| Asp207 Backbone (-) | XXII | −6.2σ | −5.4v | −5.1σ | −4.5σ |
| Asp207 Backbone (+) | XIII | 4.6σ | 4.4σ | 4.5σ | 3.5σ |
| Tyr176 | |||||
| Tyr176 Sidechain(-) | −4.9σ | −3.9σ | −5.1σ | −3.8σ | |
| Phe203 | |||||
| Phe203 Sidechain(-) | −4.1σ | −4.6σ | −4.6σ | - |
Additional files
Download links
A two-part list of links to download the article, or parts of the article, in various formats.
Downloads (link to download the article as PDF)
Open citations (links to open the citations from this article in various online reference manager services)
Cite this article (links to download the citations from this article in formats compatible with various reference manager tools)
The primary structural photoresponse of phytochrome proteins captured by a femtosecond X-ray laser
eLife 9:e53514.
https://doi.org/10.7554/eLife.53514


