New approach for membrane protein reconstitution into peptidiscs and basis for their adaptability to different proteins
- Laboratory of Molecular Electron Microscopy, Rockefeller University, United States
- Department of Biochemistry and Molecular Biology, University of British Columbia, Canada
Figures
Figure 1 with 2 supplements
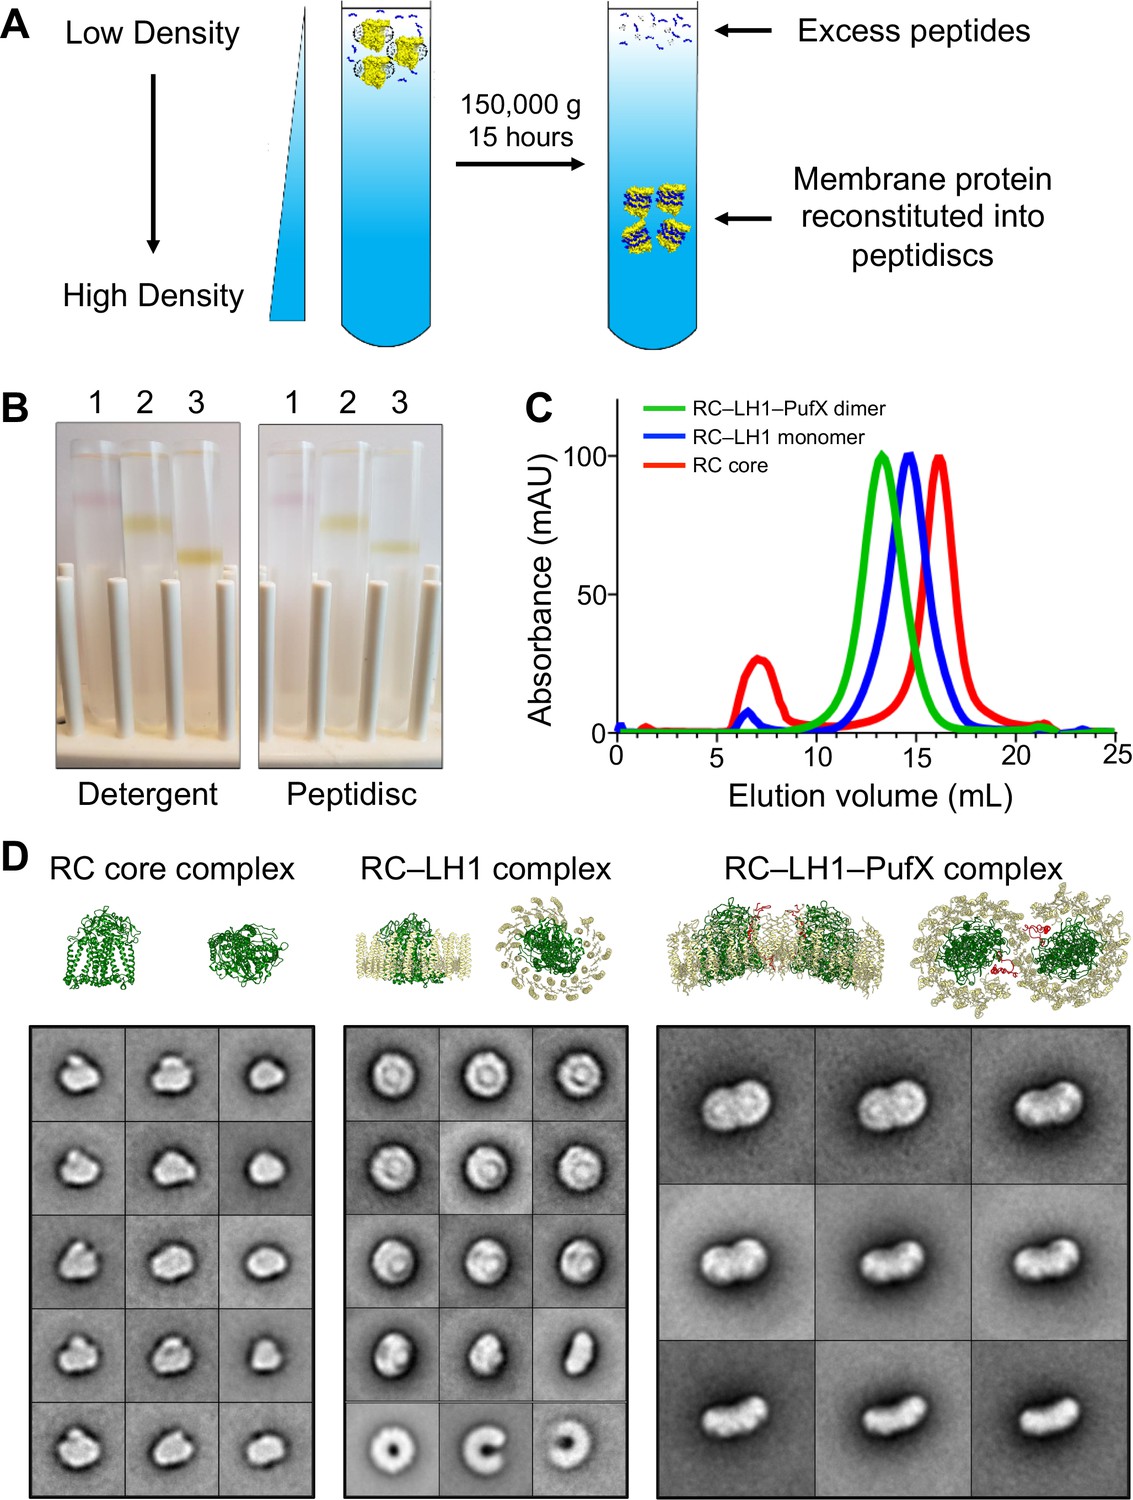
Reconstitution of Rhodobacter spheroides reaction center (RC) complexes into peptidiscs by using the ‘on-gradient’ method.
(A) Schematic drawing showing the principle of the on-gradient reconstitution method: detergent-solubilized membrane protein is mixed with an excess of peptidisc peptide and the mixture is overlaid onto a detergent-free linear sucrose gradient. Upon centrifugation, the protein reconstitutes into peptidiscs and localizes to a discrete band in the gradient, whereas excess peptides and detergent micelles stay at the top. (B) Gradients of the colored R. sphaeroides RC complexes showing their migration in the presence of detergent (left panel) and after reconstitution into peptidiscs (right panel). 1: RC core complex (99 kDa), 2: monomeric RC–LH1 complex (258 kDa), and 3: dimeric RC–LH1–PufX complex (521 kDa). (C) Size-exclusion chromatography profiles of RC complexes reconstituted into peptidiscs. Traces are normalized to 100 mAU. (D) Selected 2D-class averages of the three RC complexes (see Figure 1—figure supplement 1 for all 100 class averages). For comparison, ribbon representations are shown for the R. sphaeroides RC (PDB: 1K6L; Pokkuluri et al., 2002), the Rhodopseudomonas palustris RC–LH1 complex (PDB: 1PYH; Roszak et al., 2003) and the R. sphaeroides RC–LH1–PufX complex (PDB: 4V9G; Qian et al., 2013). RC: green, LH1: yellow, and PufX: red. The bottom row of the class averages for the RC–LH1 complex show empty LH1 rings that were present in the preparation. The side lengths of the individual class averages are 24.4 nm for the RC core complex, 32.5 nm for the monomeric RC–LH1 complex, and 48.8 nm for the dimeric RC–LH1–PufX complex.
Figure 1—figure supplement 1
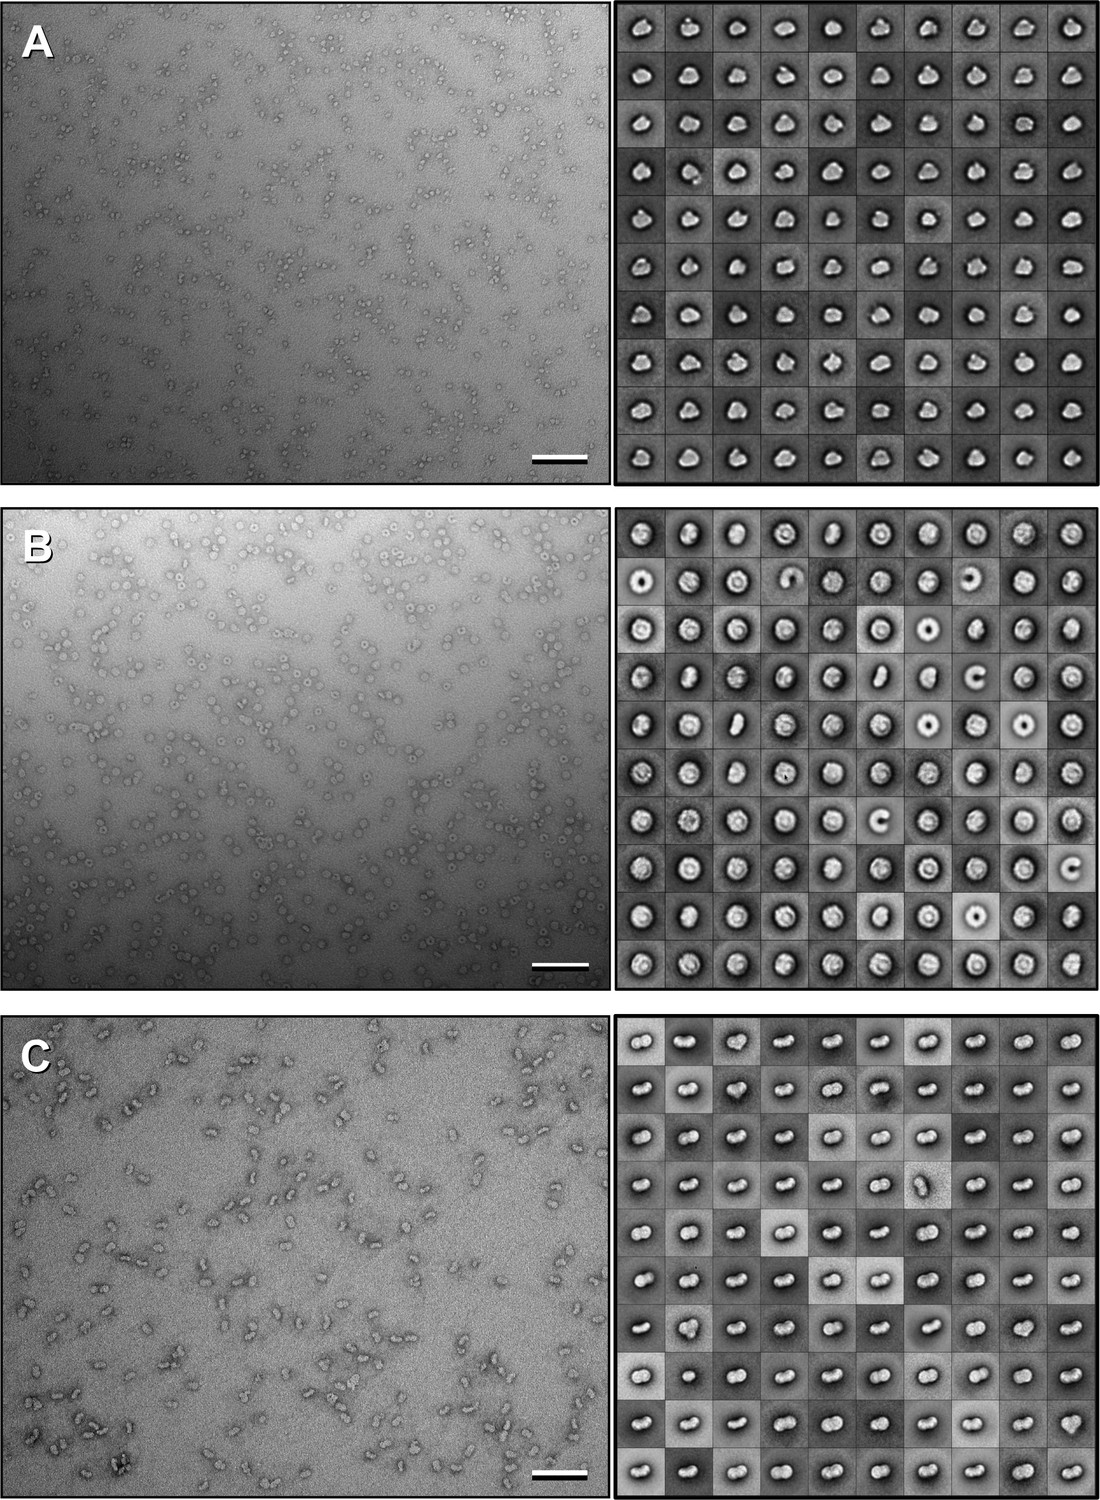
Negative-stain electron microscopy analysis of RC complexes.
Raw images (left panels) and 100 class averages obtained by K-means classification for (A) the RC core complex, (B) the monomeric RC–LH1 complex, and (C) the dimeric RC–LH1–PufX complex. Scale bars are 100 nm. The side lengths of the individual class averages are 24.4 nm for the RC core complex, 32.5 nm for the monomeric RC–LH1 complex, and 48.8 nm for the dimeric RC–LH1–PufX complex.
Figure 1—figure supplement 2
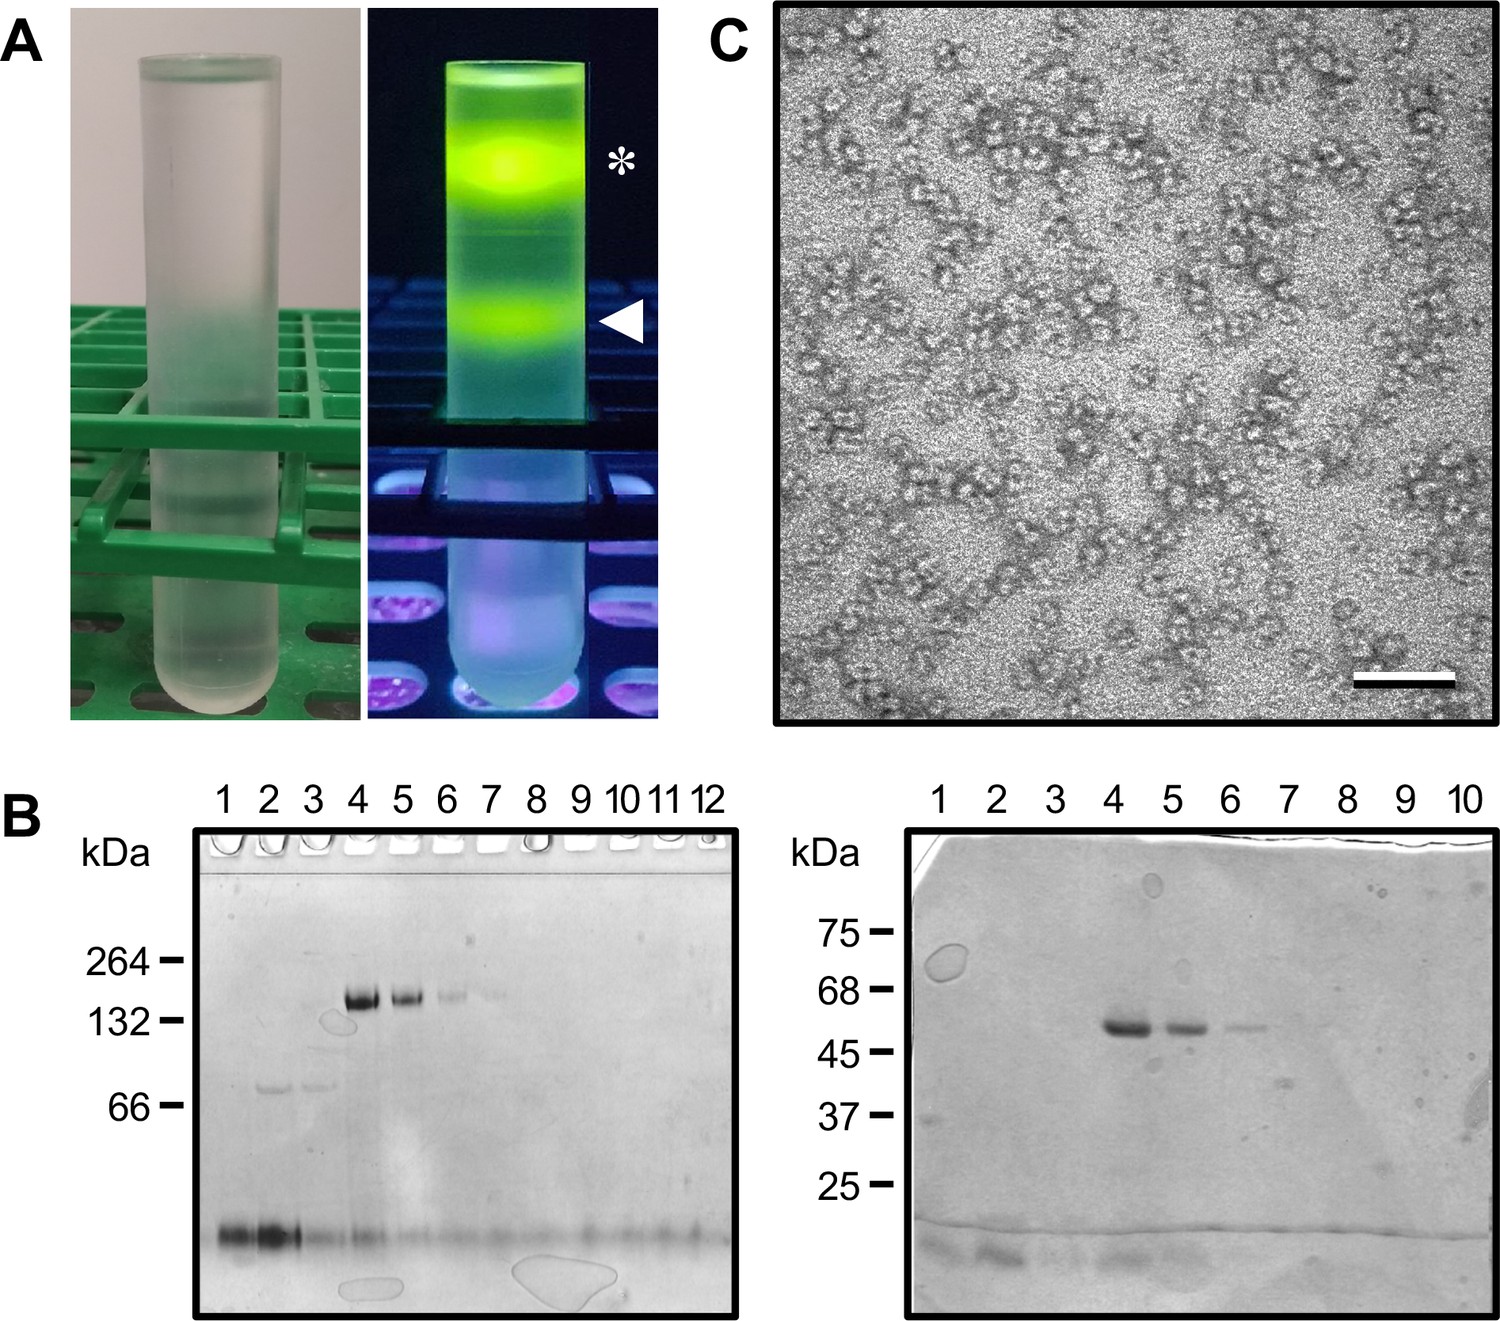
Reconstitution of MsbA with fluorescent peptidisc peptide using the ‘on-gradient’ method.
A) Detergent-solubilized MsbA was mixed with a 10-fold excess of 5-carboxyfluoresceine-labeled peptidisc peptides and the mixture was overlaid onto a detergent-free linear sucrose gradient (15–35%). After centrifugation at 210,000 xg for 18 hr, the tube was imaged in ambient light (left panel) and using UV light at 365 nm (right panel). UV light reveals two bands that show the location of MsbA reconstituted into peptidiscs (arrowhead) and excess peptides at the top of the gradient (asterisk). (B) Fractions were collected from the top of the gradient and analyzed by native PAGE using a 4–16% gradient gel (left panel) and SDS-PAGE using a 15% gel (right panel), verifying the fluoresecent band in the gradient contains MsbA. (C) Negative-stain EM image of fraction four harvested from the gradient, showing that it contains MsbA. Scale bar is 100 nm.
Figure 2 with 8 supplements
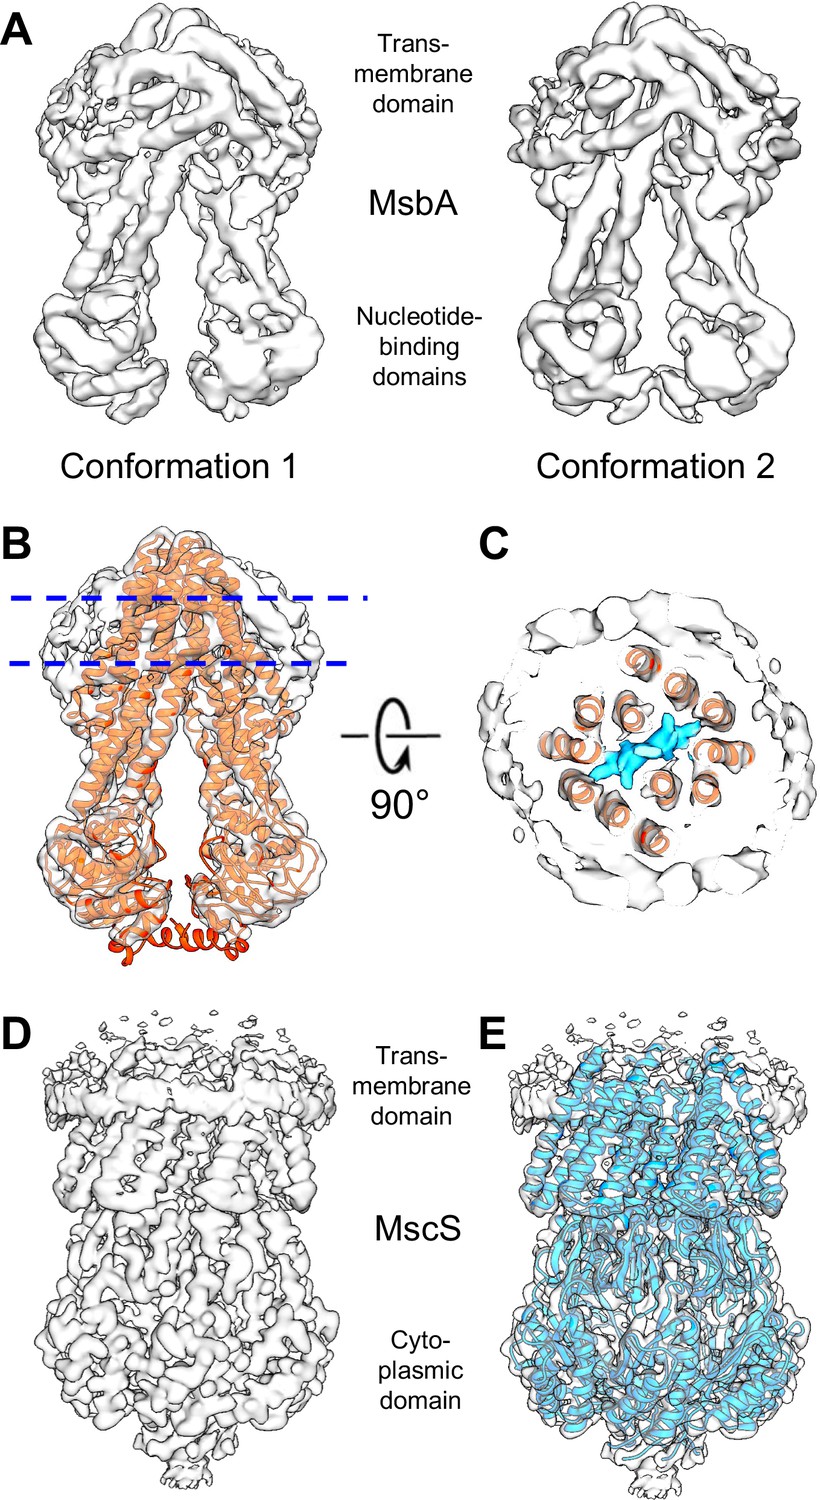
Cryo-EM maps for the E. coli lipid transporter MsbA and the E. coli mechanosensitive channel MscS reconstituted into peptidiscs.
(A) Two density maps for MsbA in peptidiscs that differ slightly in the relative position of the two nucleotide-binding domains). The resolution of the density map of MsbA in conformation 1, in which the NBDs are slightly more separated, is 4.2 Å and that of the density map of MsbA in conformation 2 is 4.4 Å. (B) Density map of MsbA in conformation 1 with the cryo-EM structure of MsbA in nanodiscs refined into the map (PDB: 5TV4; Adams et al., 2010). (C) Section through the map of MsbA in conformation 1 at the position indicated in panel B. In addition to MsbA (red ribbon representation) and density for peptidisc peptides (light gray surface), the map reveals density for a bound lipopolysaccharide (LPS) molecule (cyan surface). (D) Density map of MscS in a peptidisc at a resolution of 3.3 Å. (E) Density map of MscS with the crystal structure refined into the map (PDB: 2OAU; Bass et al., 2002).
Figure 2—figure supplement 1
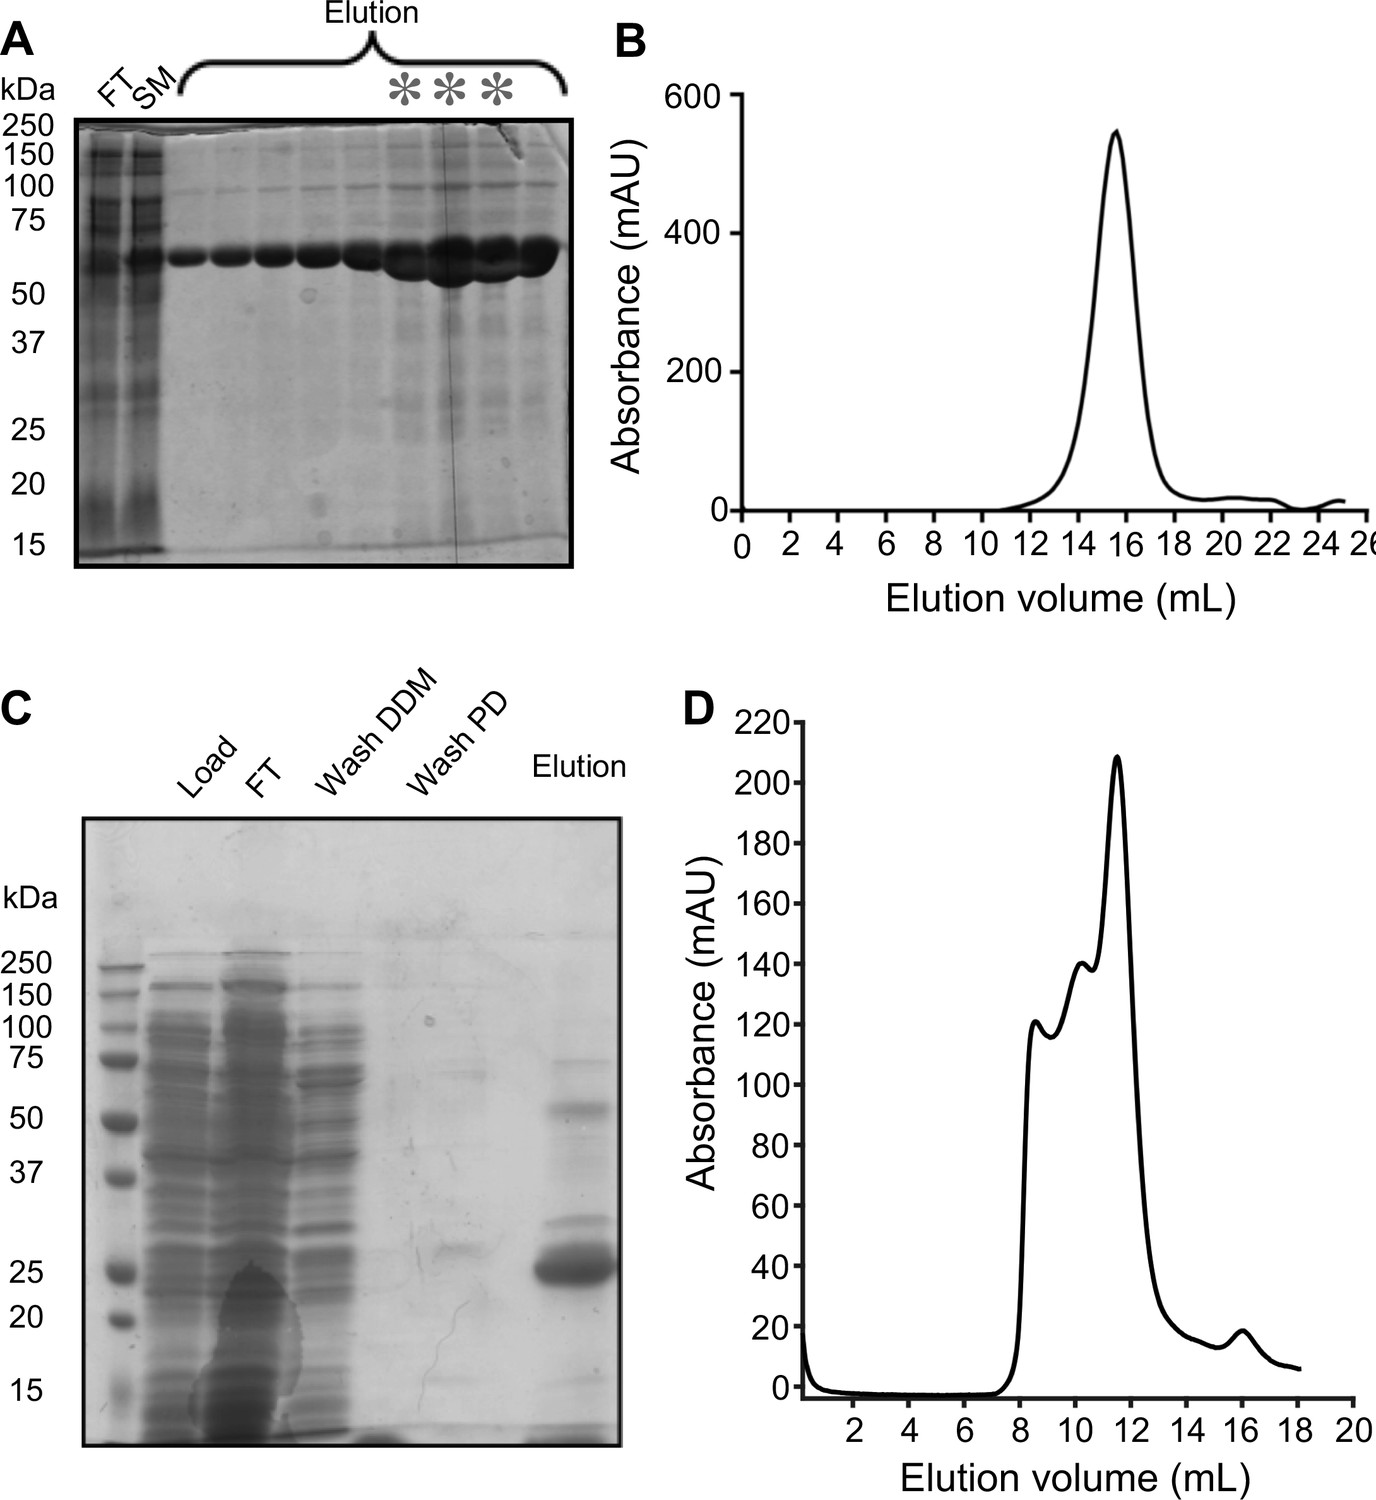
Purification of MsbA and MscS in peptidiscs.
(A) 15% SDS-PAGE gel of the purification of MsbA reconstituted into peptidiscs by nickel-affinity chromatography. FT: flow through; SM: starting material; asterisks: fractions that were pooled for subsequent size-exclusion chromatography (SEC). (B) SEC profile for peptidisc-embedded MsbA. (C) 12% SDS-PAGE gel of the purification of MscS reconstituted into peptidiscs by nickel-affinity chromatography. (D) SEC profile for peptidisc-embedded MscS.
Figure 2—figure supplement 2

Characterization of MsbA and MscS in peptidiscs.
(A) Negative-stain EM image of nucleotide-free MsbA in peptidiscs. Scale bar is 50 nm. (B) ATPase activity of MsbA in dodecyl maltoside (DDM) was measured to be 93.2 ± 14.0 nmol/min/mg (mean ± standard deviation; n = 3) and that of MsbA in peptidisc (PD) as 560 ± 19.5 nmol/min/mg (mean ± standard deviation; n = 3). (C) The 100 2D-class averages of negatively stained MsbA in peptidiscs obtained by K-means classification. The side length of the individual averages is 29.7 nm. (D) Negative-stain EM image of MscS in peptidiscs. Scale bar is 50 nm.
Figure 2—figure supplement 3
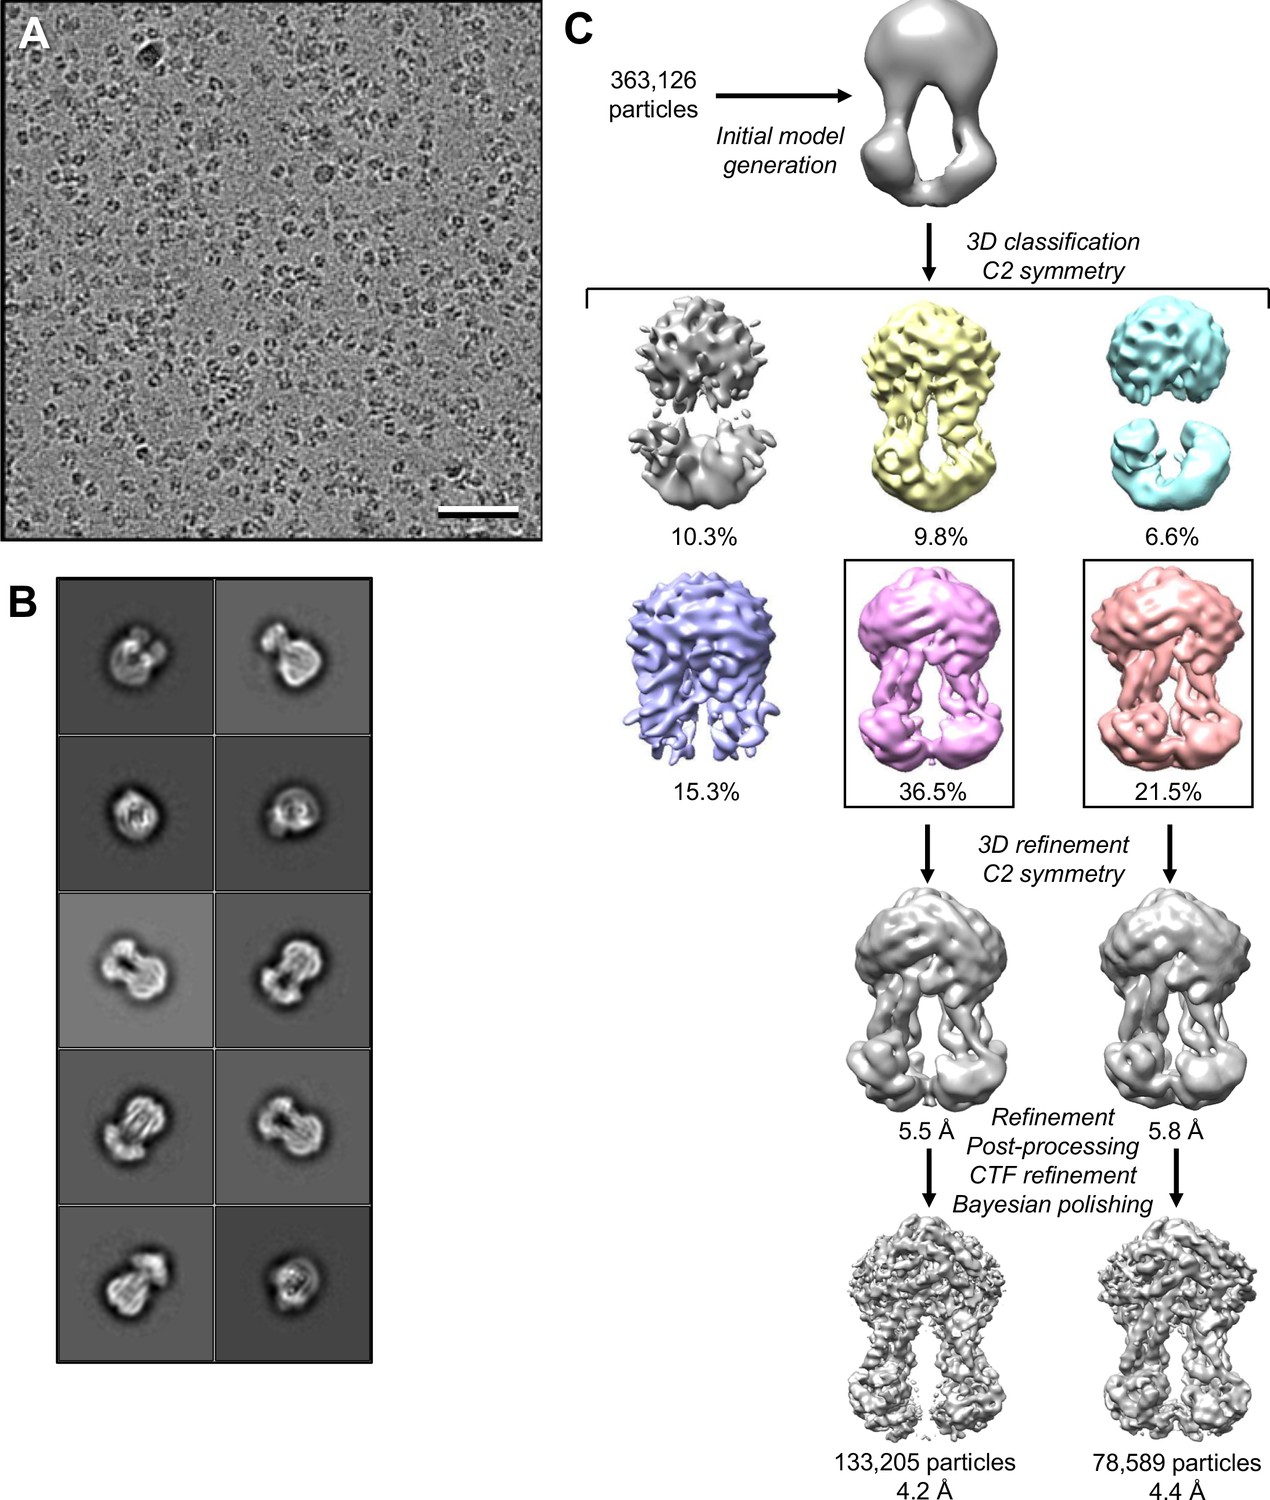
Cryo-EM analysis of MsbA in peptidiscs.
(A) Selected cryo-EM image of vitrified nucleotide-free MsbA in peptidiscs. Scale bar is 50 nm. (B) 2D-class averages of nucleotide-free MsbA in peptidiscs. The side length of the individual averages is 25.6 nm. (C) Image-processing workflow for nucleotide-free MsbA in peptidiscs. After the initial 3D classification, two classes were selected and refined independently, yielding final density maps at 4.2 and 4.4 Å resolution, respectively. See Materials and methods for further details.
Figure 2—figure supplement 4
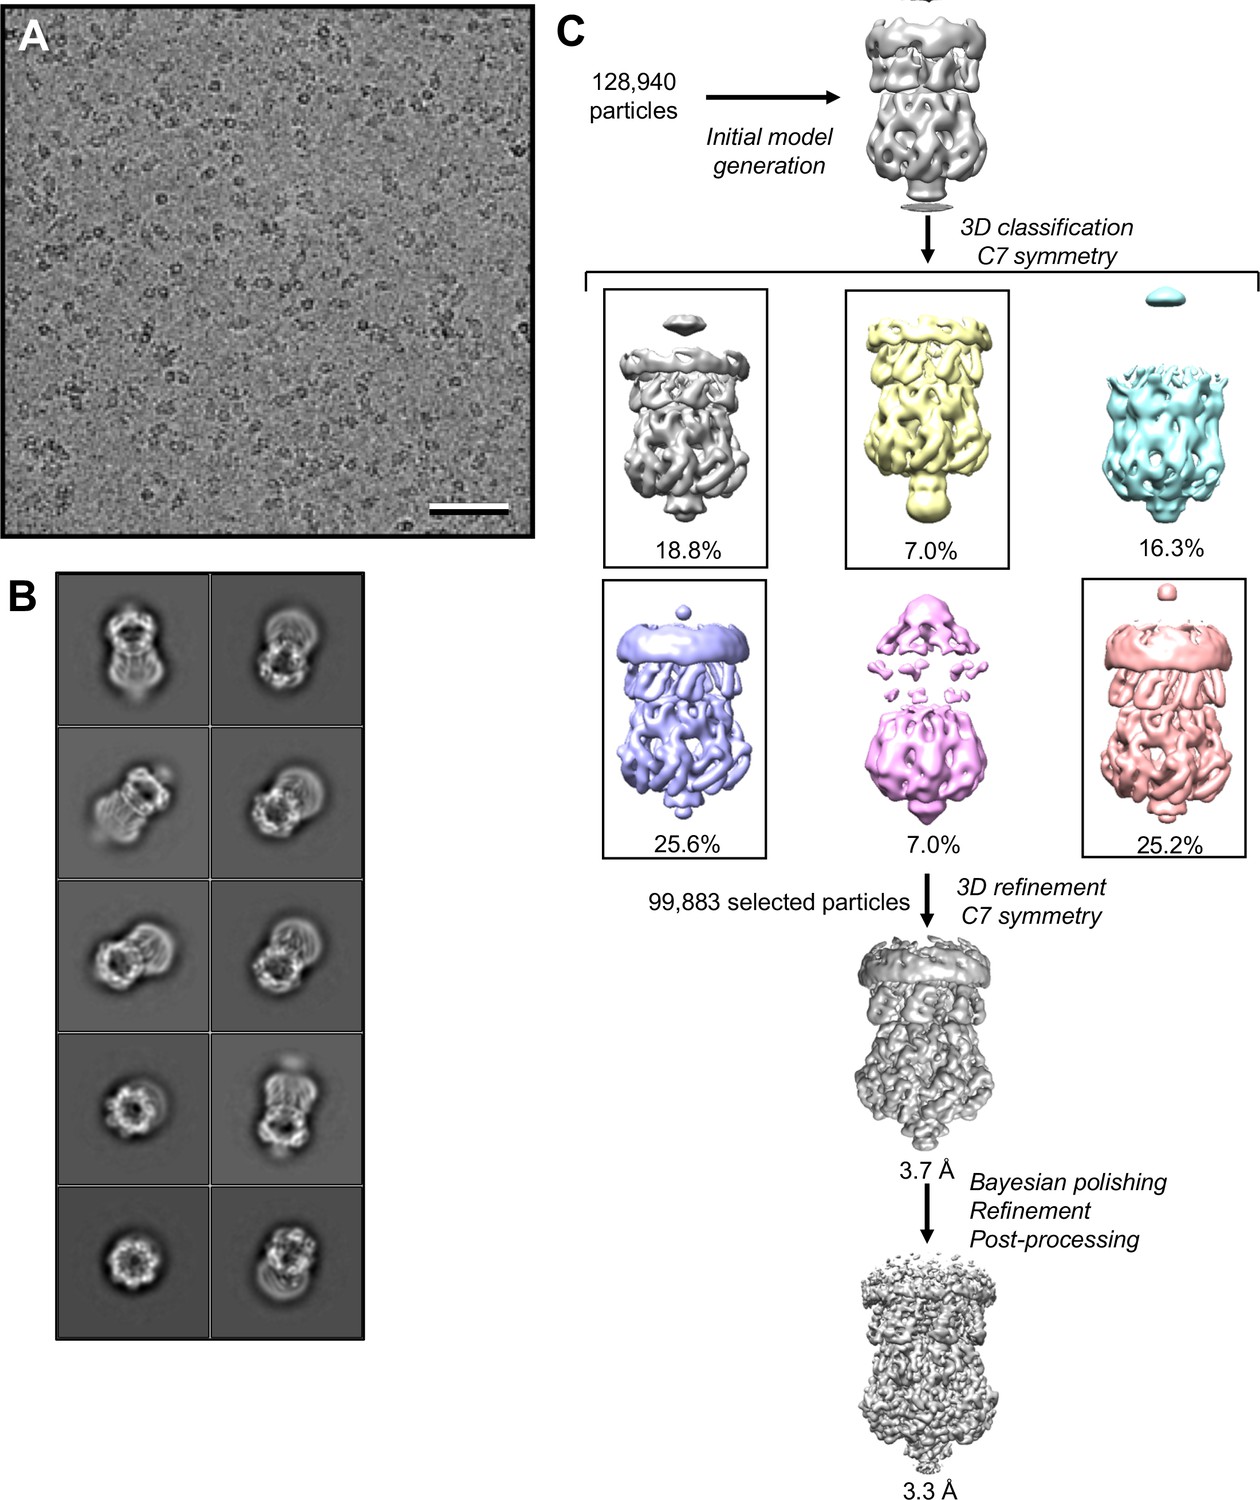
Cryo-EM analysis of MscS in peptidiscs.
(A) Selected cryo-EM image of vitrified MscS in peptidiscs. Scale bar is 50 nm. (B) 2D-class averages of MscS in peptidiscs. The side length of the individual averages is 24 nm. (C) Image-processing workflow for MscS in peptidiscs. After the initial 3D classification, four classes were combined and refined, yielding a final density map at 3.3 Å resolution. See Materials and methods for further details.
Figure 2—figure supplement 5

Local resolution of the cryo-EM maps of MsbA and MscS in peptidiscs.
Local-resolution maps of (A) MsbA in conformation 1, (B) MsbA in conformation 2, and (C) MscS are shown at different contouring thresholds. Note that the density representing the peptidisc peptides have lower resolution and also disappear quicker upon increasing the contouring threshold than the transmembrane domains.
Figure 2—figure supplement 6
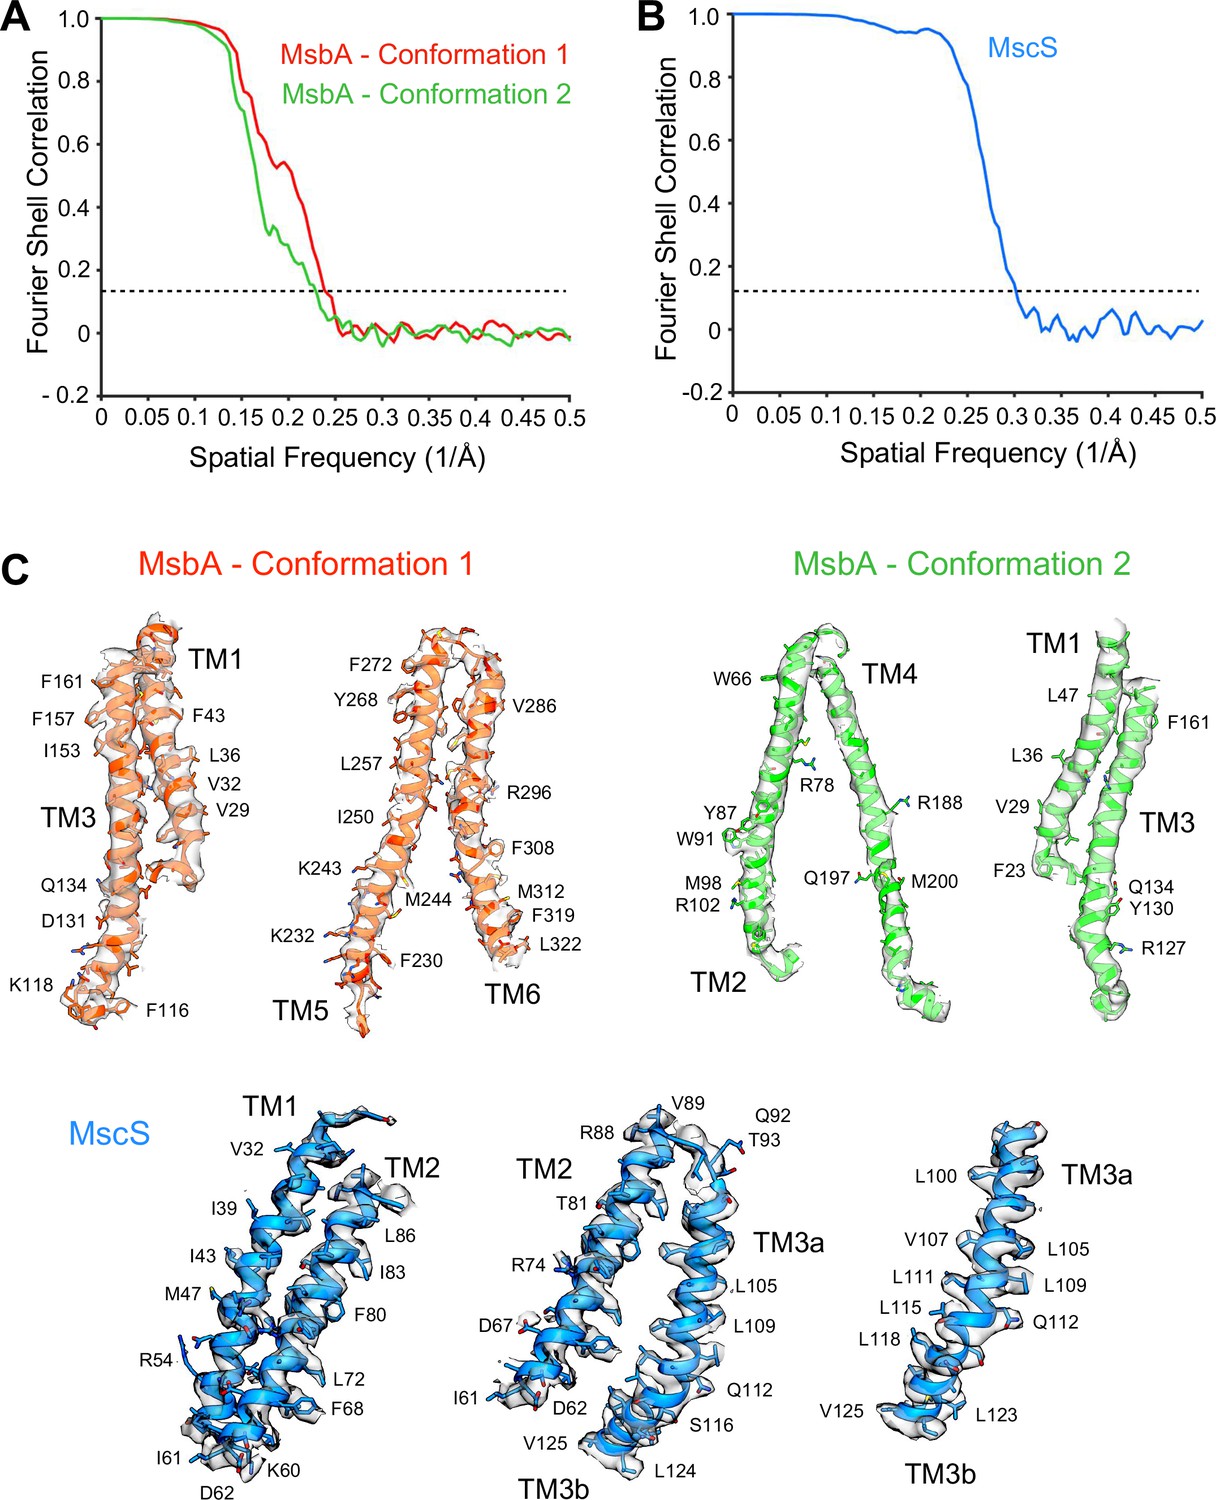
Characterization of the density maps of MsbA and MscS in peptidiscs.
Fourier shell correlation curves calculated between independently refined half maps for the density maps of (A) MsbA in conformations 1 and 2, and (B) MscS. (C) Representative cryo-EM densities for the transmembrane regions of MsbA in conformations 1 and 2 and MscS.
Figure 2—figure supplement 7
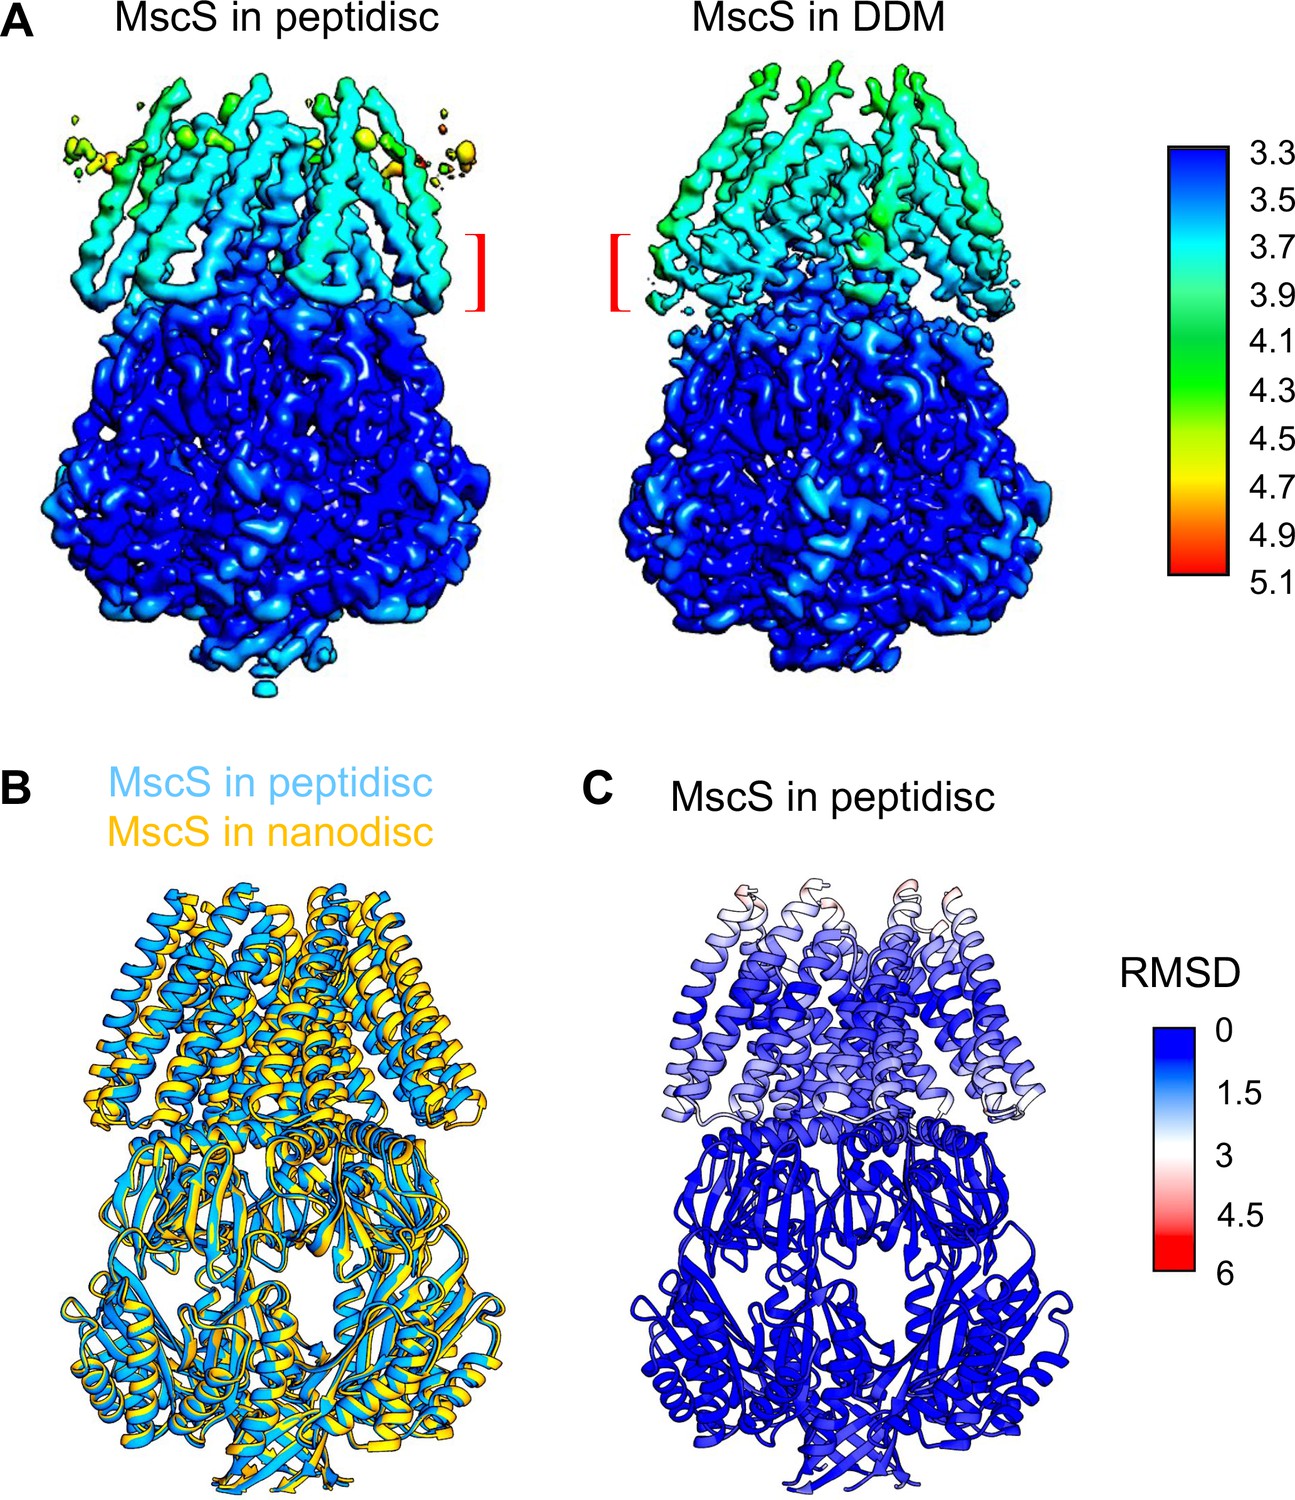
Comparison of MscS in different membrane mimetics.
(A) Local resolution maps of MscS in peptidiscs (this study) and in DDM (PDB ID: 6PWO; Reddy et al., 2019). The brackets indicate the connections between transmembrane helices 1 and 2 that are better resolved in our map of MscS in peptidiscs. (B) Overlay of the single-particle cryo-EM structures of MscS in peptidiscs (blue; this study) and MscS in nanodiscs (gold; PDB ID: 6PWN; Reddy et al., 2019). (C) Root-mean-square deviations (RMSDs) between corresponding Cα atoms of the MscS structures in peptidiscs and nanodiscs mapped onto the structure of MscS in peptidiscs, showing that the two structures are very similar.
Figure 2—figure supplement 8

Comparison of density maps generated with and without imposing symmetry.
(A) Density map of MsbA in conformation 1 generated with C2 symmetry imposed at a resolution of 4.2 Å (left panel) and with no symmetry imposed at a resolution of 4.5 Å (right panel). (B) Density map of MsbA in conformation 2 generated with C2 symmetry imposed at a resolution of 4.4 Å (left panel) and with no symmetry imposed at a resolution of 4.7 Å (right panel). (C) Density map of MscS generated with C7 symmetry imposed at a resolution of 3.3 Å (left panel) and with no symmetry imposed at a resolution of 3.9 Å (right panel).
Figure 3
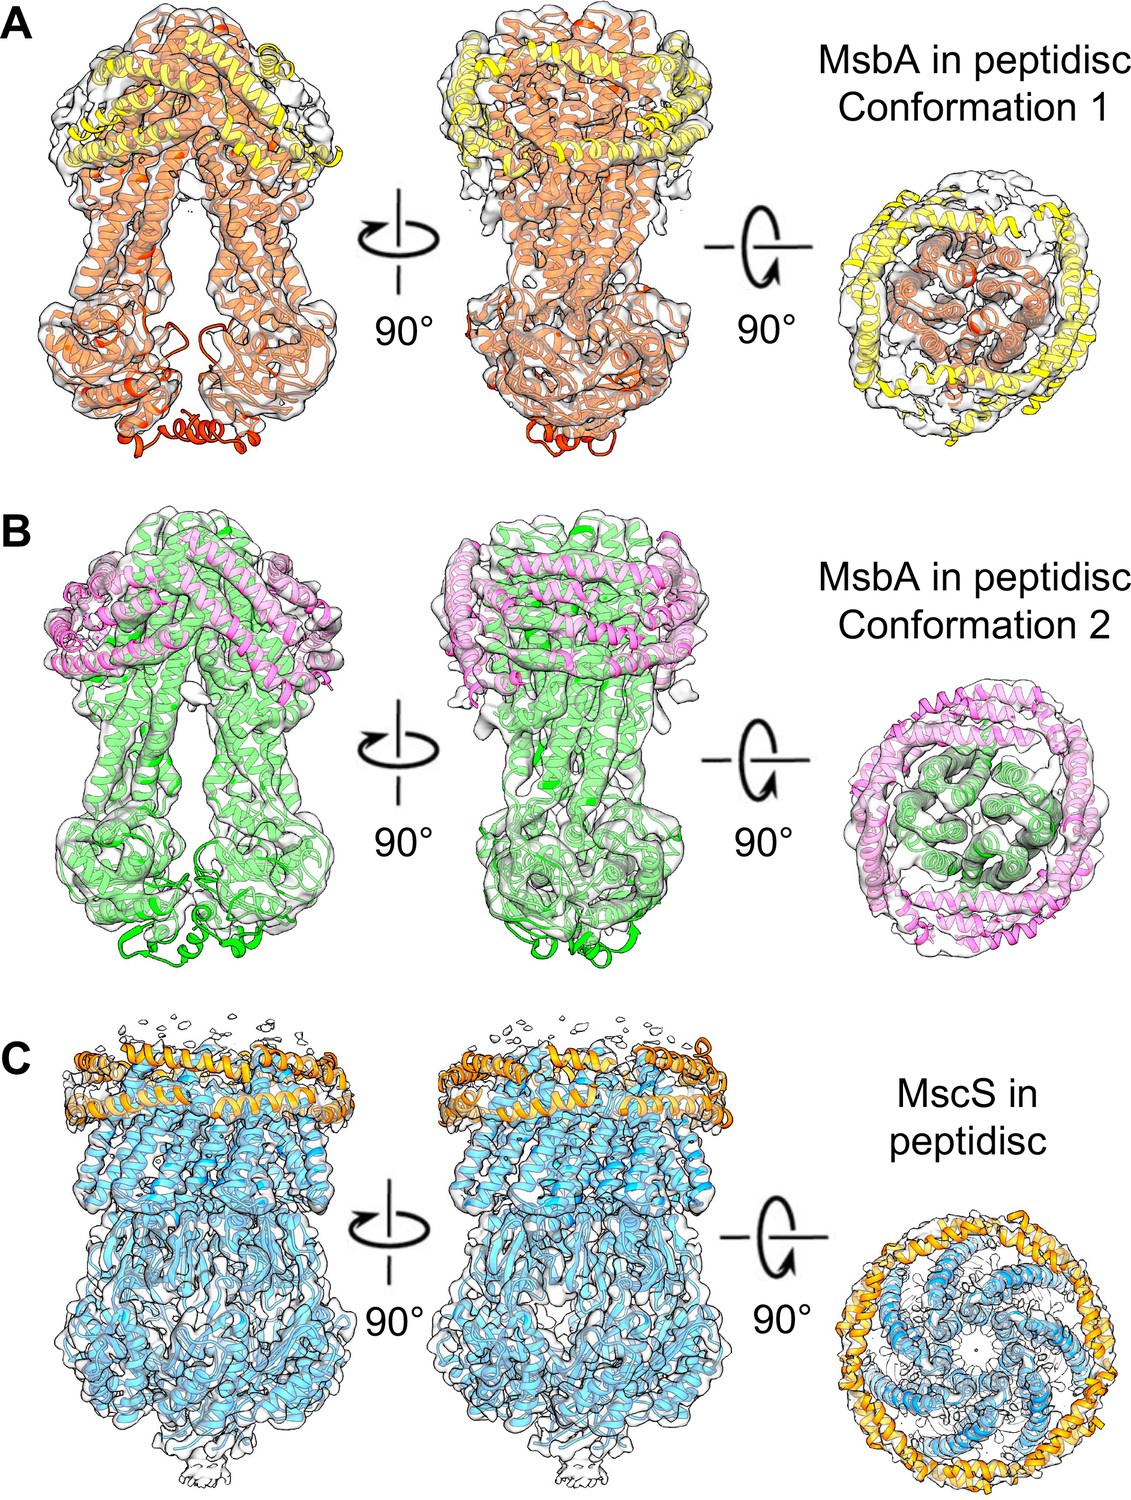
The peptidisc densities surrounding MsbA and MscS.
Different views of the density maps of (A) MsbA in conformation 1 (red ribbon representation), (B) MsbA in conformation 2 (green ribbon representation), and (C) MscS (blue ribbon representation). Densities consistent with helical segments surrounding the membrane proteins and representing peptidisc peptides were fit with poly-alanine models (yellow ribbon representation).
Figure 4
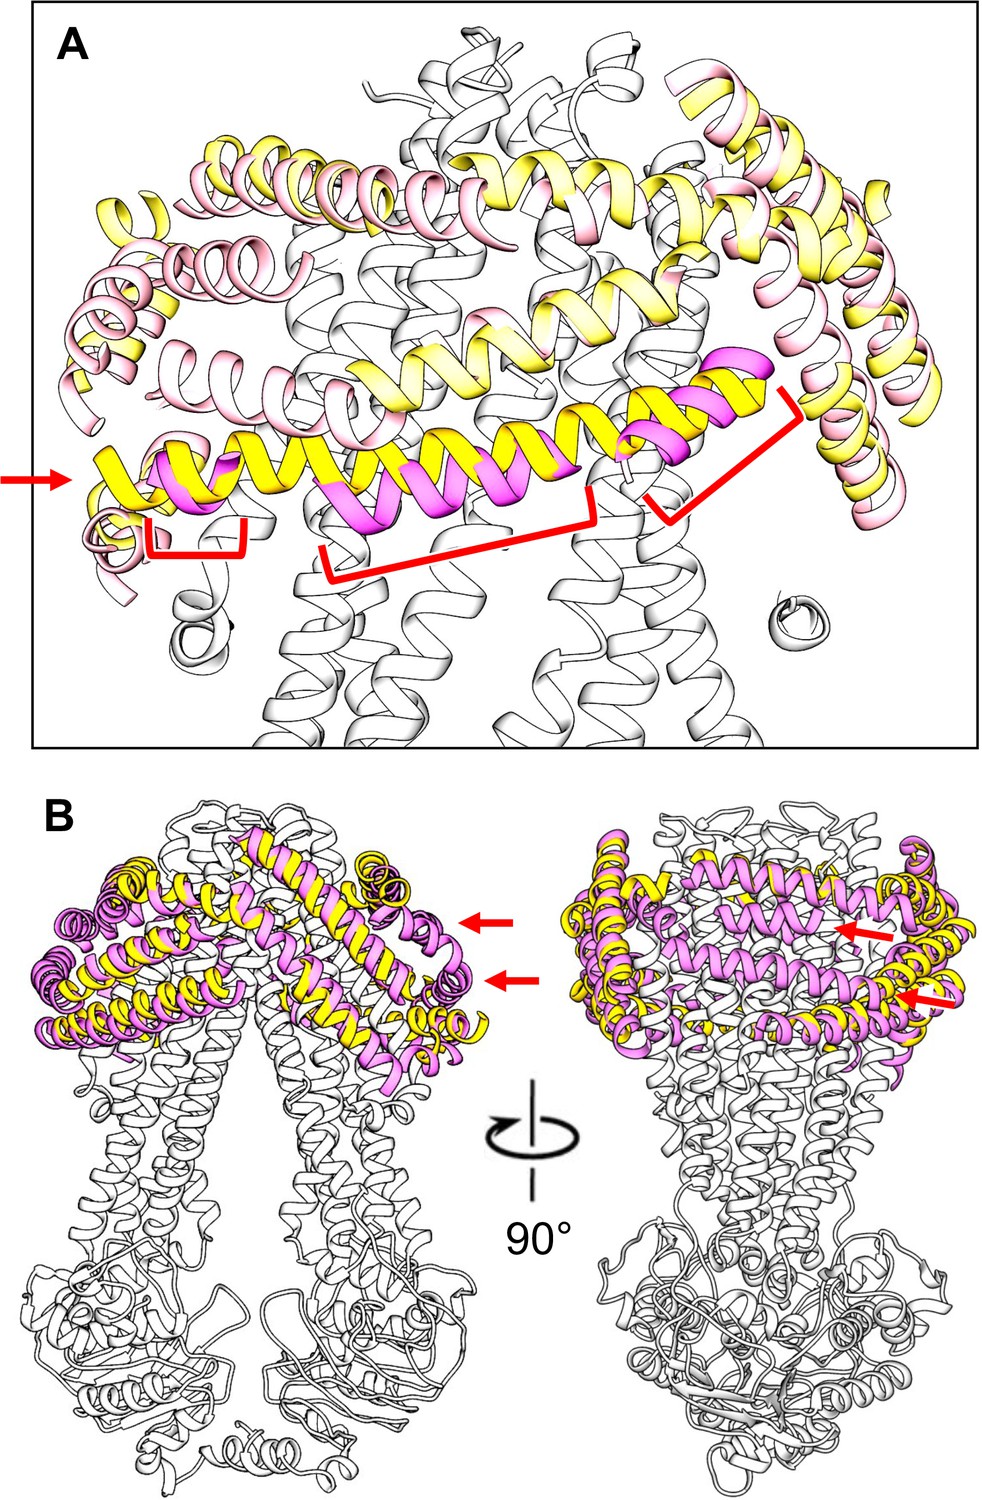
Comparison of modeled peptide helices surrounding MsbA in conformations 1 and 2.
(A) The longest helical segment found in the peptidisc density surrounding MsbA in conformation 1 (yellow helix indicated with red arrow) overlaps with three helical segments found in the peptidisc density surrounding MsbA in conformation 2 (magenta helices indicated with red brackets). (B) Orthogonal views of the superimposition of the modeled peptidisc peptide helices in the map of MsbA in conformation 1 (yellow helices) with those in the map of MsbA in conformation 2 (magenta helices) showing that many helices in the two maps overlap. The map of MsbA in conformation 2 shows two helical segments that are not present in the map of MsbA in conformation 1 (indicated by red arrows).
Tables
Key resources table
| Reagent type (species) or resource | Designation | Source or reference | Identifiers | Additional information |
|---|---|---|---|---|
| Gene (Escherichia coli) | mscS | Bass et al., 2002 | 83333 (NCBI) | Kind gift from Dr. Douglas Rees |
| Strain, strain background (Escherichia coli) | BL21(DE3) | Agilent (Stratagene) | #200131 | Competent cells |
| Strain, strain background (Escherichia coli) | C43 (DE3) | Miroux and Walker, 1996 | Kind gift from Dr. Bruno Miroux | |
| Strain, strain background (Rhodobacter sphaeroides) | RCxR | Jun et al., 2018 | ΔpuhA, ΔpufQBALMX, ΔrshI, ΔppsR | Kind gift from Dr. Tom Beatty |
| Recombinant DNA reagent | pET28b (Plasmid) | Addgene | 69865–3 | - |
| Recombinant DNA reagent | pIND4-RC (Plasmid) | Carlson et al., 2018; Jun et al., 2018 | ||
| Recombinant DNA reagent | pIND-RC1 (Plasmid) | Jun et al., 2018; Carlson et al., 2018 | ||
| Recombinant DNA reagent | pBAD-His6-MsbA (Plasmid) | Carlson et al., 2018 | ||
| Peptide, recombinant protein | Peptidiscs | Peptidisc Biotech. | Bulk-Peptidisc Glo-Peptidisc | - |
| Chemical compound, drug | Uranyl formate | Pfaltz and Bauer | Cat# U01000 | - |
| Chemical compound, drug | LB broth miller powder | Affymetrix/USB | 4340023 | Media |
| Chemical compound, drug | kanamycin | Teknova | K2150 | antibiotic |
| Chemical compound, drug | Isopropyl β-D-thiogalactoside (IPTG) | Gold Biotechnology | Cat# I2481C | - |
| Chemical compound, drug | Roche cOmplete, EDTA-free protease inhibitor | Sigma-Aldrich | Cat# 11873580001 | - |
| Chemical compound, drug | 1,4-dithiotreitol (DTT) | Gold Biotechnology | Cat# DTT25 | - |
| Chemical compound, drug | Tris base | Chemcruz | sc-3715B | - |
| Chemical compound, drug | N,N-dimethyldodecylamine N-oxide | Sigma | Cas# 1643-20-5 | |
| Chemical compound, drug | Triton X-100 | BioShop | Cat# TRX 777.500 | |
| Chemical compound, drug | n-dodecyl-β-D-maltoside | Anatrace | Cas# 69227-93-6 | |
| Chemical compound, drug | octyl-β-D-glucoside | Anatrace | Cas# 29836-26-8 | |
| Chemical compound, drug | Arabinose | GoldBio | Cat# A-300–1 | |
| Chemical compound, drug | Imidazole | Bioshop | Cat# IMD508.1 | |
| Chemical compound, drug | Acrylamide | BioShop | Cat# ACR005.502 | |
| Chemical compound, drug | Ampicillin | Bioshop | Cat# AMP201.25 | |
| Chemical compound, drug | Malachite Green | Sigma | Cas# 569-64-2 | |
| Chemical compound, drug | Sucrose | Bioshop | Cat# SUC507.5 | |
| Software, algorithm | RELION-3.0 | Zivanov et al., 2018 | http://www2.mrc-lmb.cam.ac.uk/relion | |
| Software, algorithm | MotionCor2 | Zheng et al., 2017 | http://msg.ucsf.edu/em/software/motioncor2.html | - |
| Software, algorithm | CtfFind4.1.8 | Rohou and Grigorieff, 2015 | http://grigoriefflab.janelia.org/ctffind4 | - |
| Software, algorithm | Gautomatch | N/A | https://www.mrc-lmb.cam.ac.uk/kzhang/Gautomatch | - |
| Software, algorithm | SPIDER2 | Yang et al., 2017 | http://sparks-lab.org/yueyang/server/SPIDER2/ | - |
| Software, algorithm | COOT | Emsley et al., 2010 | http://www2.mrc-lmb.cam.ac.uk/personal/ pemsley/coot | - |
| Software, algorithm | PHENIX | Adams et al., 2010 | https://www.phenix-online.org | - |
| Software, algorithm | Chimera | Pettersen et al., 2004 | https://www.cgl.ucsf.edu/chimera/download.html | - |
| Software, algorithm | Serial EM | Mastronarde, 2005 | http://bio3d.colorado.edu/SerialEM | - |
| Other | R 2/2 400 mesh Cu Holey carbon grids | Quantifoil | Q450CR2 | Cryo-EM grids |
| Other | R 1.2/1.3 400 mesh Cu Holey carbon grids | Quantifoil | Q4100CR1.3 | Cryo-EM grids |
Additional files
Download links
A two-part list of links to download the article, or parts of the article, in various formats.
Downloads (link to download the article as PDF)
Open citations (links to open the citations from this article in various online reference manager services)
Cite this article (links to download the citations from this article in formats compatible with various reference manager tools)
New approach for membrane protein reconstitution into peptidiscs and basis for their adaptability to different proteins
eLife 9:e53530.
https://doi.org/10.7554/eLife.53530


