ER-luminal [Ca2+] regulation of InsP3 receptor gating mediated by an ER-luminal peripheral Ca2+-binding protein
- Department of Physiology, Perelman School of Medicine, University of Pennsylvania, United States
- Department of Statistics, University of Pittsburgh, United States
- Department of Neurobiology and Behavior, University of California, United States
- Proteomics Core Facility, The Children’s Hospital of Philadelphia, United States
- Department of Physiology and Biophysics, University of California, United States
- Department of Cell and Developmental Biology, Perelman School of Medicine, University of Pennsylvania, United States
Figures
Figure 1
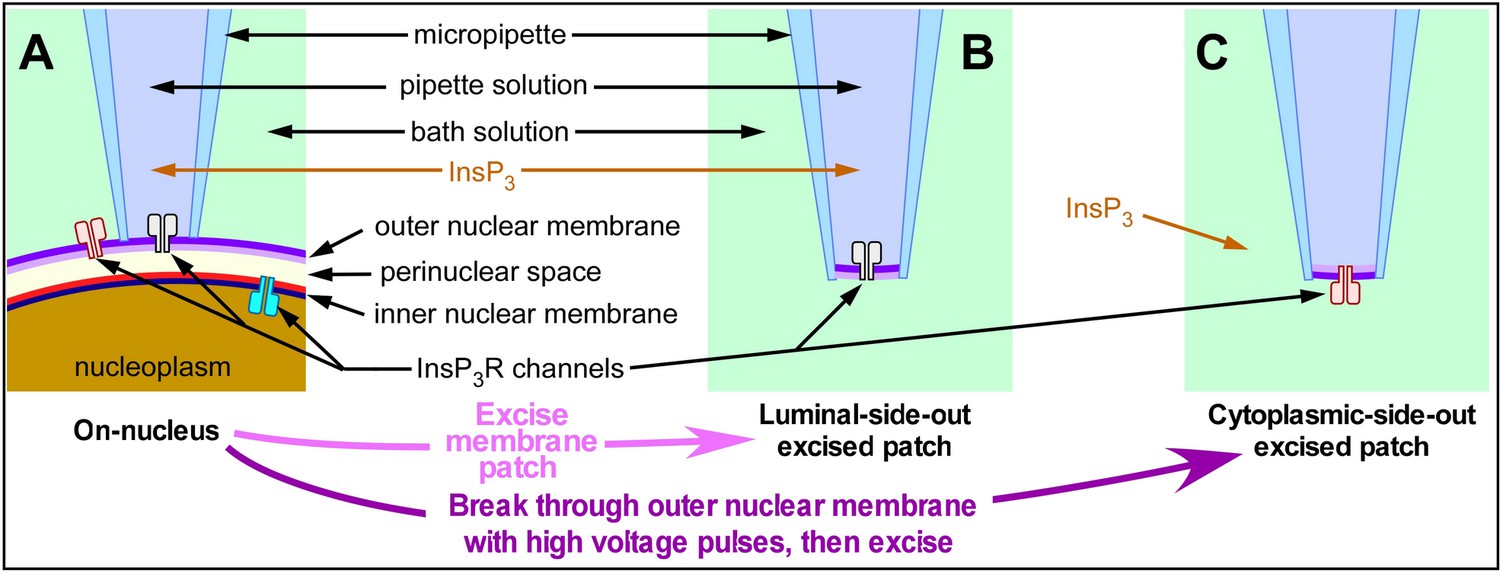
Schematic diagram illustrating the orientation of InsP3R channels in isolated nuclear membrane patches and InsP3-containing solution relative to the micropipette in various configurations of nuclear patch-clamping.
(A) On-nucleus configuration with outer nuclear membrane intact, (B) excised luminal-side-out configuration, (C) excised cytoplasmic-side-out configuration.
Figure 2
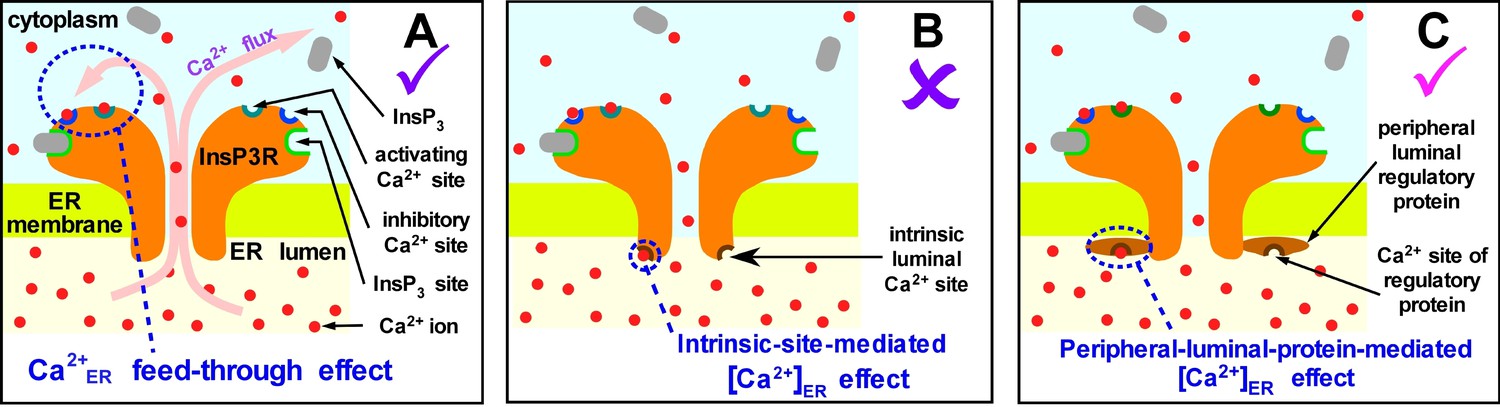
Possible mechanisms of [Ca2+]ER regulation of InsP3R channel activity.
(A) Ca2+ flux through an open InsP3R channel driven by high [Ca2+]ER raises local [Ca2+]i in the pore vicinity to regulate the channel through its cytoplasmic activating and inhibitory Ca2+-binding sites. (B) Ca2+ binds directly to an intrinsic site on the luminal side of the channel to regulate its activity. (C) Ca2+ binding to a peripheral protein in the ER lumen regulates channel activity indirectly, by promoting interaction of the peripheral protein with the InsP3R.
Figure 3 with 1 supplement
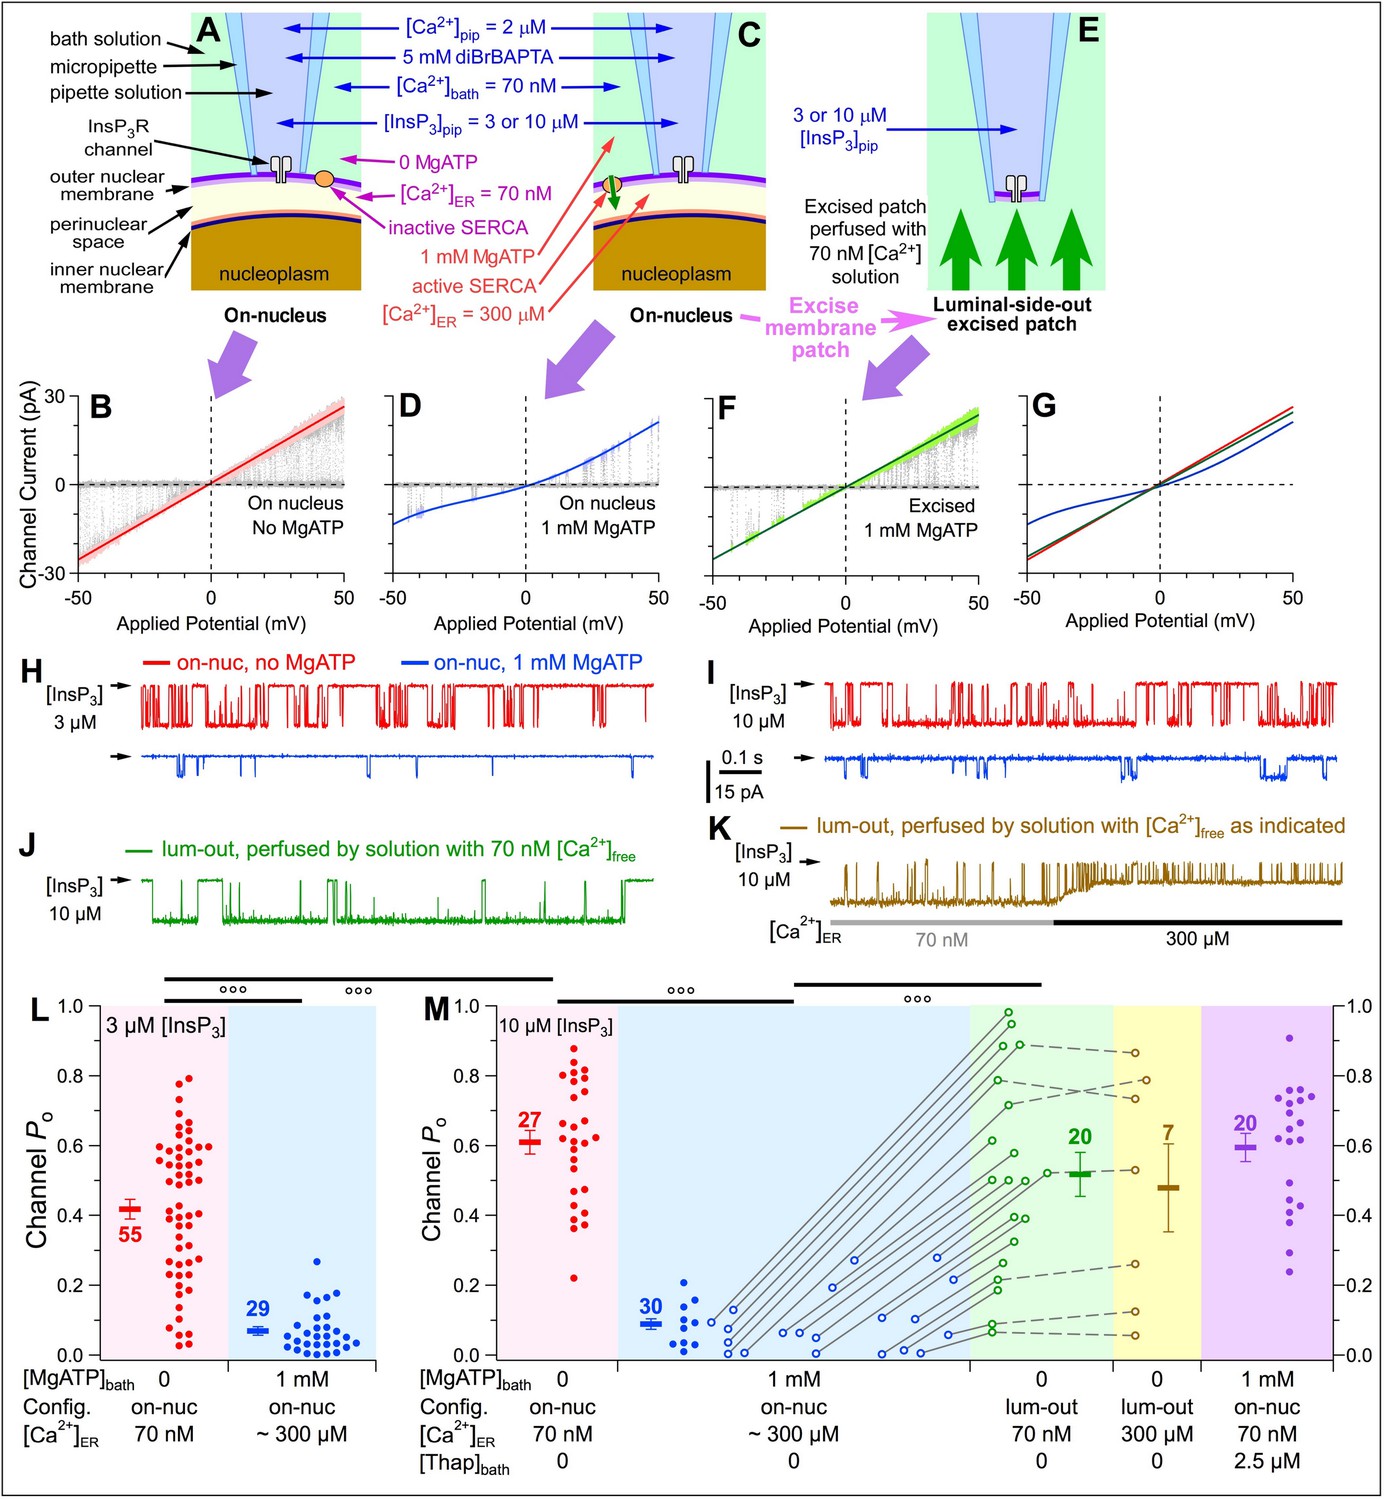
Raising [Ca2+]ER in intact isolated nuclei affects activities of InsP3R channels.
(A and B) On-nucleus (on-nuc) patch-clamp configuration and single-channel current-voltage (ich-Vapp) plot of InsP3R channels in bath solution with 0-MgATP so SERCA was not active and [Ca2+]ER equilibrated with [Ca2+]bath. (C and D) On-nuc configuration and ich-Vapp plot of InsP3R channels in bath solution with 1 mM MgATP to activate SERCA to move Ca2+ from the bath into the perinuclear space, raising [Ca2+]ER to ~300 μM. ([Ca2+]ER was estimated from the magnitude of the InsP3R channel current size [Vais et al., 2010a]). (E and F) Excised luminal-side-out (lum-out) configuration and ich-Vapp plot of InsP3R channels in isolated membrane patch perfused with 70 nM [Ca2+]ER and 0-MgATP bath solution. The baseline closed-channel currents were subtracted from the ich-Vapp plots. Cytoplasmic [InsP3] in the pipette solution = 3 μM for sub-saturating level, and 10 μM for saturating level. Vapp ramped from –50 to 50 mV (w.r.t. ground electrode in the bath) in 2 s. 10–20 ramps were averaged for each graph. Colored lines: linear (B, F) and 4th order polynomial (D) fits to open-channel data points in graphs. In this and all subsequent patch-clamp experiments, optimal cytoplasmic [Ca2+]free (2 μM) was used. In experiments shown here, [Ca2+]free in bath solution = 70 nM. (G) Overlay of three fitted curves in (B, D and F). (H) Typical single-channel current traces recorded under constant Vapp (–30 mV) in on-nuc configuration, with pipette solution containing sub-saturating 3 µM InsP3, and bath solutions containing 0- (red) or 1 mM-MgATP (blue). In this and all subsequent current traces, arrow on left of trace indicates closed-channel current level. (I) Corresponding current traces recorded with pipette solution containing saturating 10 µM InsP3. (J) Typical current trace recorded in lum-out configuration with constant Vapp = –30 mV. (K) Typical current trace recorded as lum-out patch was perfused by solution with 70 nM Ca2+free (grey bar) and then switched to one with 300 μM Ca2+free (black bar). (L) Po from individual current traces (filled circles), and their averages (thick horizontal bars) and s.e.m. (error bars) observed in on-nuc patch-clamp configuration with 3 µM InsP3 in pipette solution, and with 0- (red) or 1 mM (blue) MgATP in bath solutions. [Ca2+]free on luminal side tabulated at x-axis. Numbers of current traces tabulated next to corresponding averages. In this and all subsequent data plots, symbols °, °° and °°° indicate t-test p value < 0.05, 0.005 and 0.001, respectively. (M) Po from individual current traces (circles), averages (thick bars) and s.e.m. (error bars) observed with 10 µM InsP3 in pipette solution. Red symbols: Po in on-nuc configuration with 0-MgATP in bath so [Ca2+]ER = [Ca2+]bath = 70 nM. Blue symbols: Po in on-nuc configuration with 1 mM MgATP in bath so [Ca2+]ER ~300 μM. Filled circles: Po from experiments in which only the on-nuc configuration was achieved. Open circles: Po from experiments in which lum-out configuration was achieved after on-nuc channel activity had been recorded. Green symbols: Po observed in lum-out patches whose luminal side was perfused with solution containing 70 nM Ca2+free. Open circles connected with grey lines: Po observed in same patch before and after membrane excision. Brown symbols: Po observed in lum-out membrane patches after switching to perfusing solution containing 300 μM Ca2+free, as in (K). Open circles connected with dashed grey lines: Po observed in same lum-out membrane patch before and after perfusion-solution switching. Purple symbols: Po in on-nuc configuration with 1 mM bath MgATP and 2.5 μM thapsigargin.
Figure 3—figure supplement 1

Thapsigargin abrogated SERCA activity despite the presence of bath MgATP.
[Ca2+]ER in intact isolated DT40-r3 nuclei equilibrated with [Ca2+]bath. InsP3R channel Po of thapsigargin-treated nuclei were high, indistinguishable from Po of nuclei exposed to no bath MgATP or thapsigargin. Channel Po of individual current traces (circles) and their averages and s.e.m. (horizontal bars) are plotted for on-nuc patch-clamp experiments performed with bath solution containing 70 nM [Ca2+]bath. There is significant difference between Po of channels in solutions with and without MgATP (both with no thapsigargin); and between Po of channels in in solutions with and without thapsigargin (both with 1 mM MgATP). The controls (0 MgATP and 0 thapsigargin; 1 mM MgATP and 0 thapsigargin) and experiments (with thapsigargin and MgATP) were performed using cells harvested within at most one day apart to ensure that the qualities of the cells were similar.
Figure 4
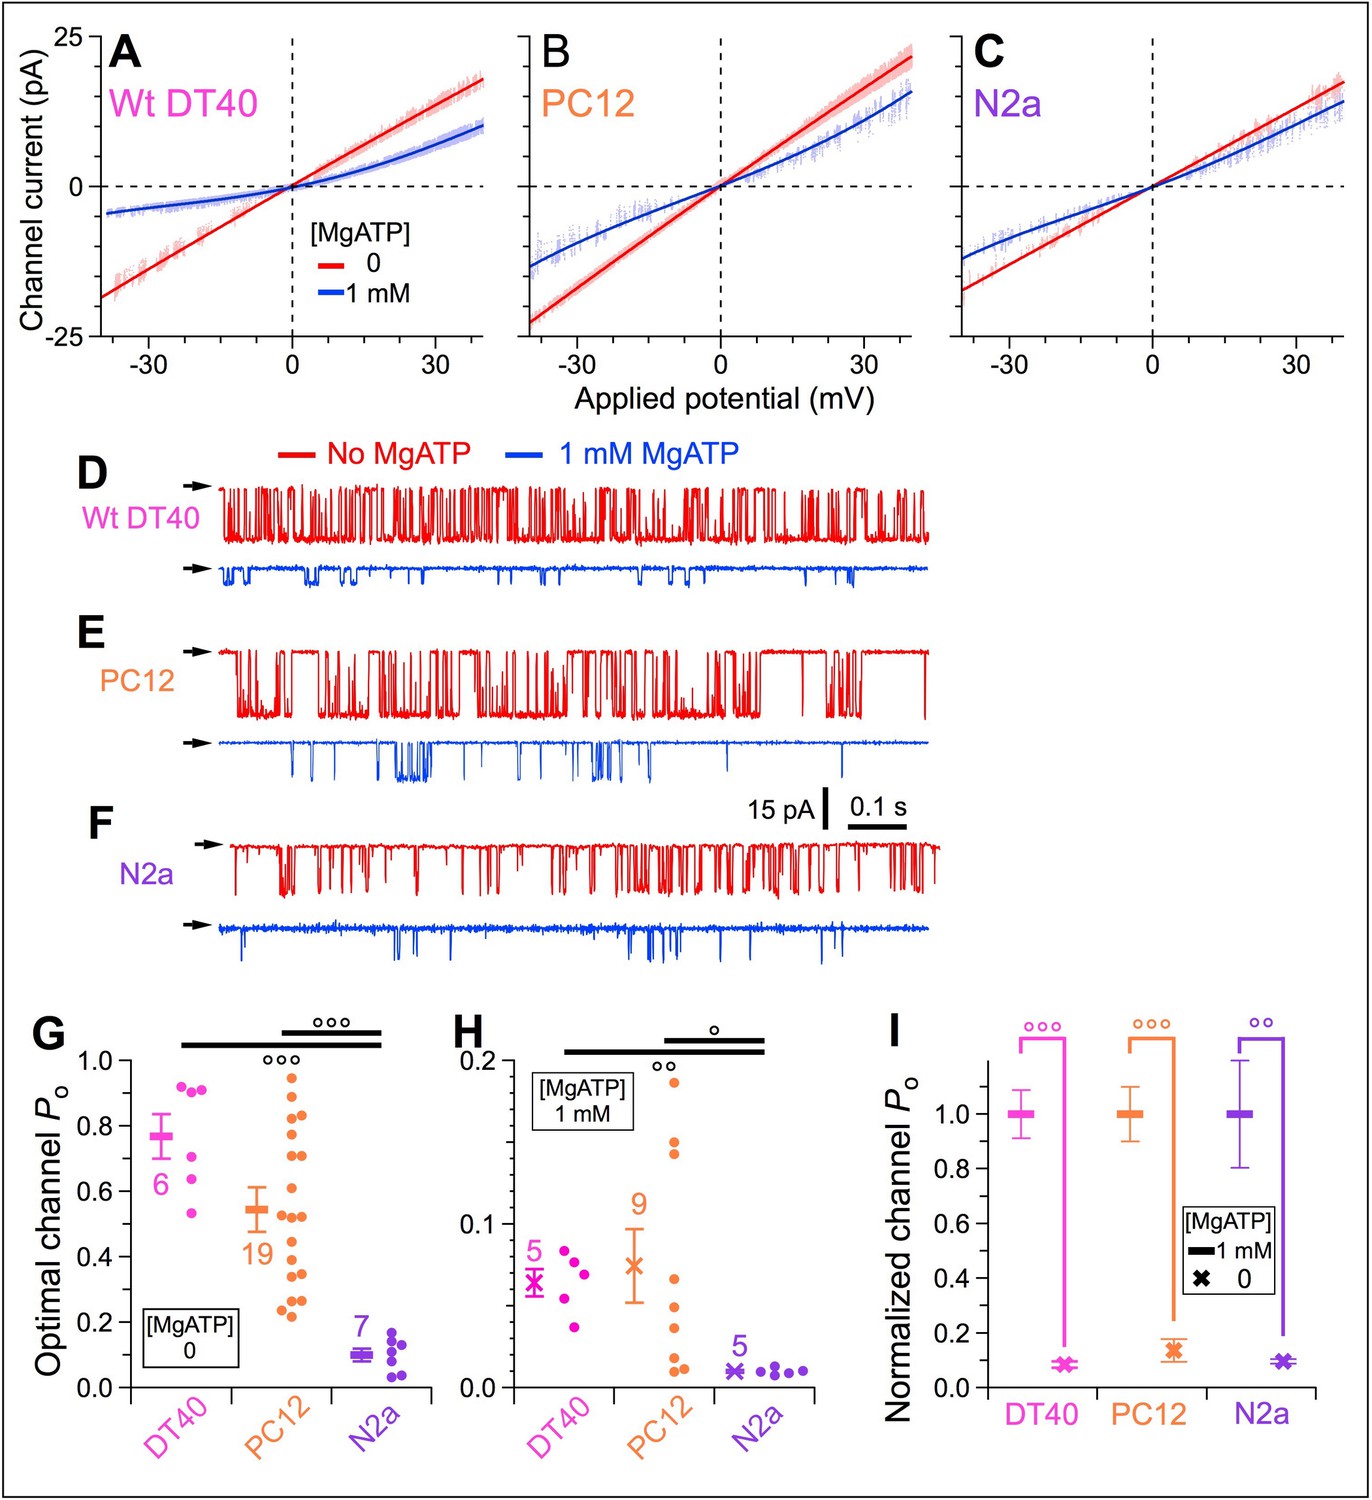
Activities of InsP3R channels from a number of cell lines expressing various InsP3R isoforms in different proportions are similarly affected by rise in [Ca2+]ER in intact isolated nuclei.
(A–C) Single-channel I-Vapp plots of on-nuc patch-clamp experiments of endogenous InsP3R channels from WT DT40 (A), PC12 (B), and N2a (C) cells. Channels activated by 10 μM InsP3 with (blue) or without (red) 1 mM MgATP. Data obtained using protocol as in Figure 3 with Vapp ramped from –40 to 40 mV in 2 s. Lines: linear (red) and 4th order polynomial (blue) fits to open-channel data points. (D–F) Typical current traces for endogenous InsP3R channels from WT DT40 (D), PC12 (E), and N2a (F) cells, in presence (blue) and absence (red) of 1 mM MgATP in bath with Vapp = –40 mV. (G) Optimal Po activated by 10 μM InsP3 and 2 μM Ca2+i in individual experiments (circles) and averages and s.e.m. (bars) for endogenous WT DT40 (magenta), PC12 (orange) and N2a (purple) InsP3R channels in bath without MgATP. (H) Optimal Po in bath with 1 mM bath MgATP activated by the same ligand conditions as (G) for the same endogenous InsP3R channels. (I) Normalized Po, their averages and s.e.m. for endogenous InsP3R channels in bath with 1 mM MgATP, relative to respective average optimal Po in (G).
Figure 5
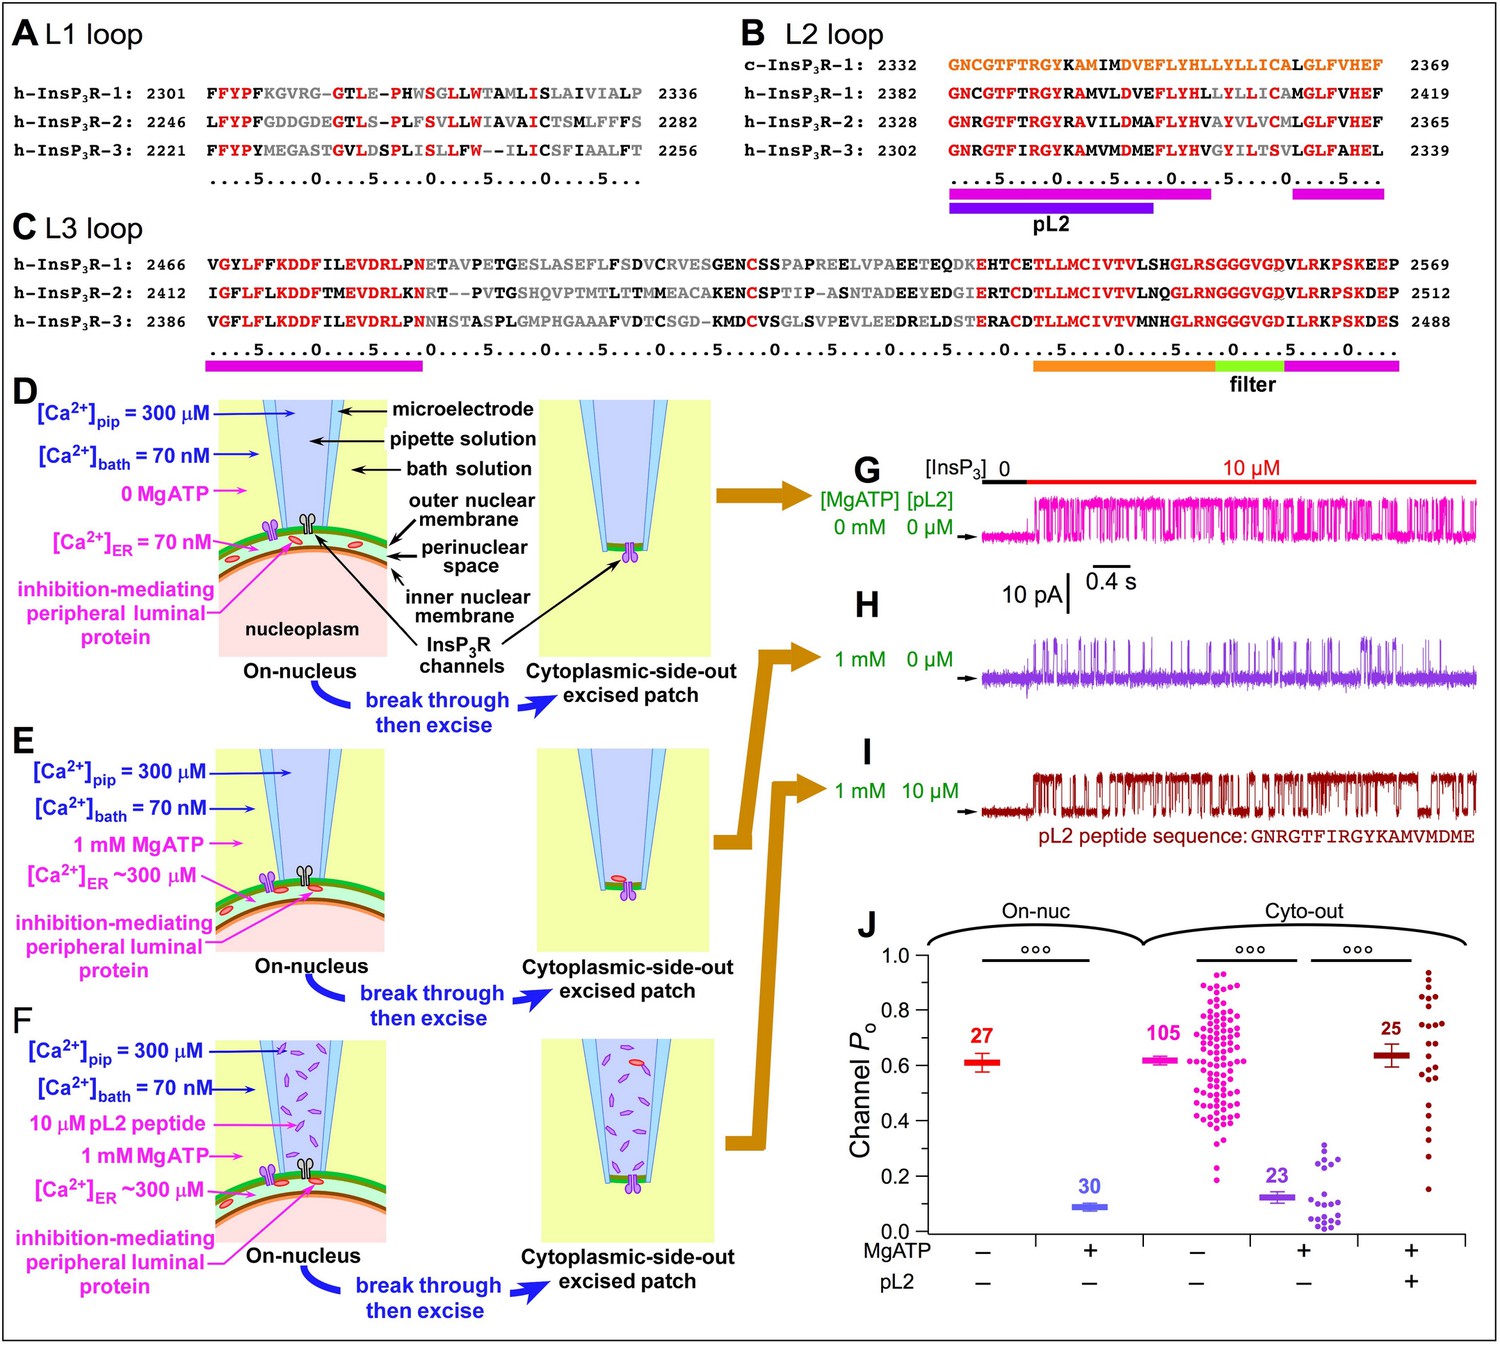
Identification of the InsP3R region involved in [Ca2+]ER regulation of channel activity.
(A–C) Sequences of L1 (A), L2 (B) and L3 (C) loops of human InsP3R isoforms exposed to ER lumen according to h-InsP3R-1 cryo-EM structure in Fan et al., 2015. Residues conserved over all three InsP3R isoforms are in red; similar residues in black; and different residues in grey. Highly-conserved sequences: magenta stripes. Sequence of pL2 (partial L2) peptide used in experiments is from h-InsP3R-3: purple stripe. L2 loop sequence of chicken InsP3R-1 also shown (B, top line) revealing highly-conserved L2 loop sequence. (D–F) Cartoons showing [Ca2+]ER-dependent interaction between luminal part of InsP3R and a peripheral protein in ER lumen in various pipette and bath solutions, during on-nuc or cyto-out nuclear patch-clamp experiments, as labeled. (G–I) Typical InsP3R-3 current traces in cyto-out experiments with 0- or 1 mM MgATP in bath, and 0- or 10 μM pL2 peptide in pipette solution, as tabulated. Traces in (G), (H) and (I) recorded in experiments depicted in (D), (E) and (F), respectively. In this and all subsequent cyto-out experiments, Vapp = +30 mV and channels were activated by perfusion solutions containing optimal 2 μM Ca2+i, saturating 10 μM InsP3 and 0.5 mM ATP4–. (J) Po of individual current traces (circles) and averages and s.e.m. (horizontal bars) observed under conditions as tabulated. For comparison, averages and s.e.m. of Po in on-nuc experiments (red and blue horizontal bars) from Figure 3J are shown.
Figure 6 with 1 supplement

Localization of AnxA1 in the ER lumen.
(A–B) Confocal images of permeablized A549 (A) and HeLa (B) cells. Native ANXA1 (red), calnexin (green), nuclei (blue). ANXA1 co-localized with calnexin in nuclear envelope (white arrow). ANXA1 also found in puncta without (white arrowhead) or with (cyan arrowhead) calnexin. (C–D) Confocal images of intact (C) and digitonin permeabilized (D) Panc-1 cells. Native ANXA1 (red), nuclei (blue). White arrow in (D) indicates nuclear envelope labeled with ANXA1. (E) ANXA1-(red) and β-actin-(blue) capture ELISA of supernatant (left) and whole-cell lysate (right). Dots: signals detected in individual assays (n = 6); horizontal bars: mean, s.e.m.
-
Figure 6—source data 1
Abundance of annexin proteins (quantified as total spectral counts by mass spectrometry analysis) detected in experiment eluates collected from magnetic beads covalently linked to peptides with modified pL2 sequence, and in control eluates collected from beads linked to peptide with scrambled modified pL2 sequence.
The spectral count entry is black when the count ratio (experiment count/control count) is ≥1.2; grey when 1.2 > count ratio≥1.0; and grey italics when count ratio <1.0. lfsr is the local false sign rate (see Statistical analysis of mass spectrometry output in the Materials and methods section). The lfsr ≤0.2 (corresponds to a global false discovery rate ≤5%) are bolded.
- https://cdn.elifesciences.org/articles/53531/elife-53531-fig6-data1-v2.docx
Figure 6—figure supplement 1
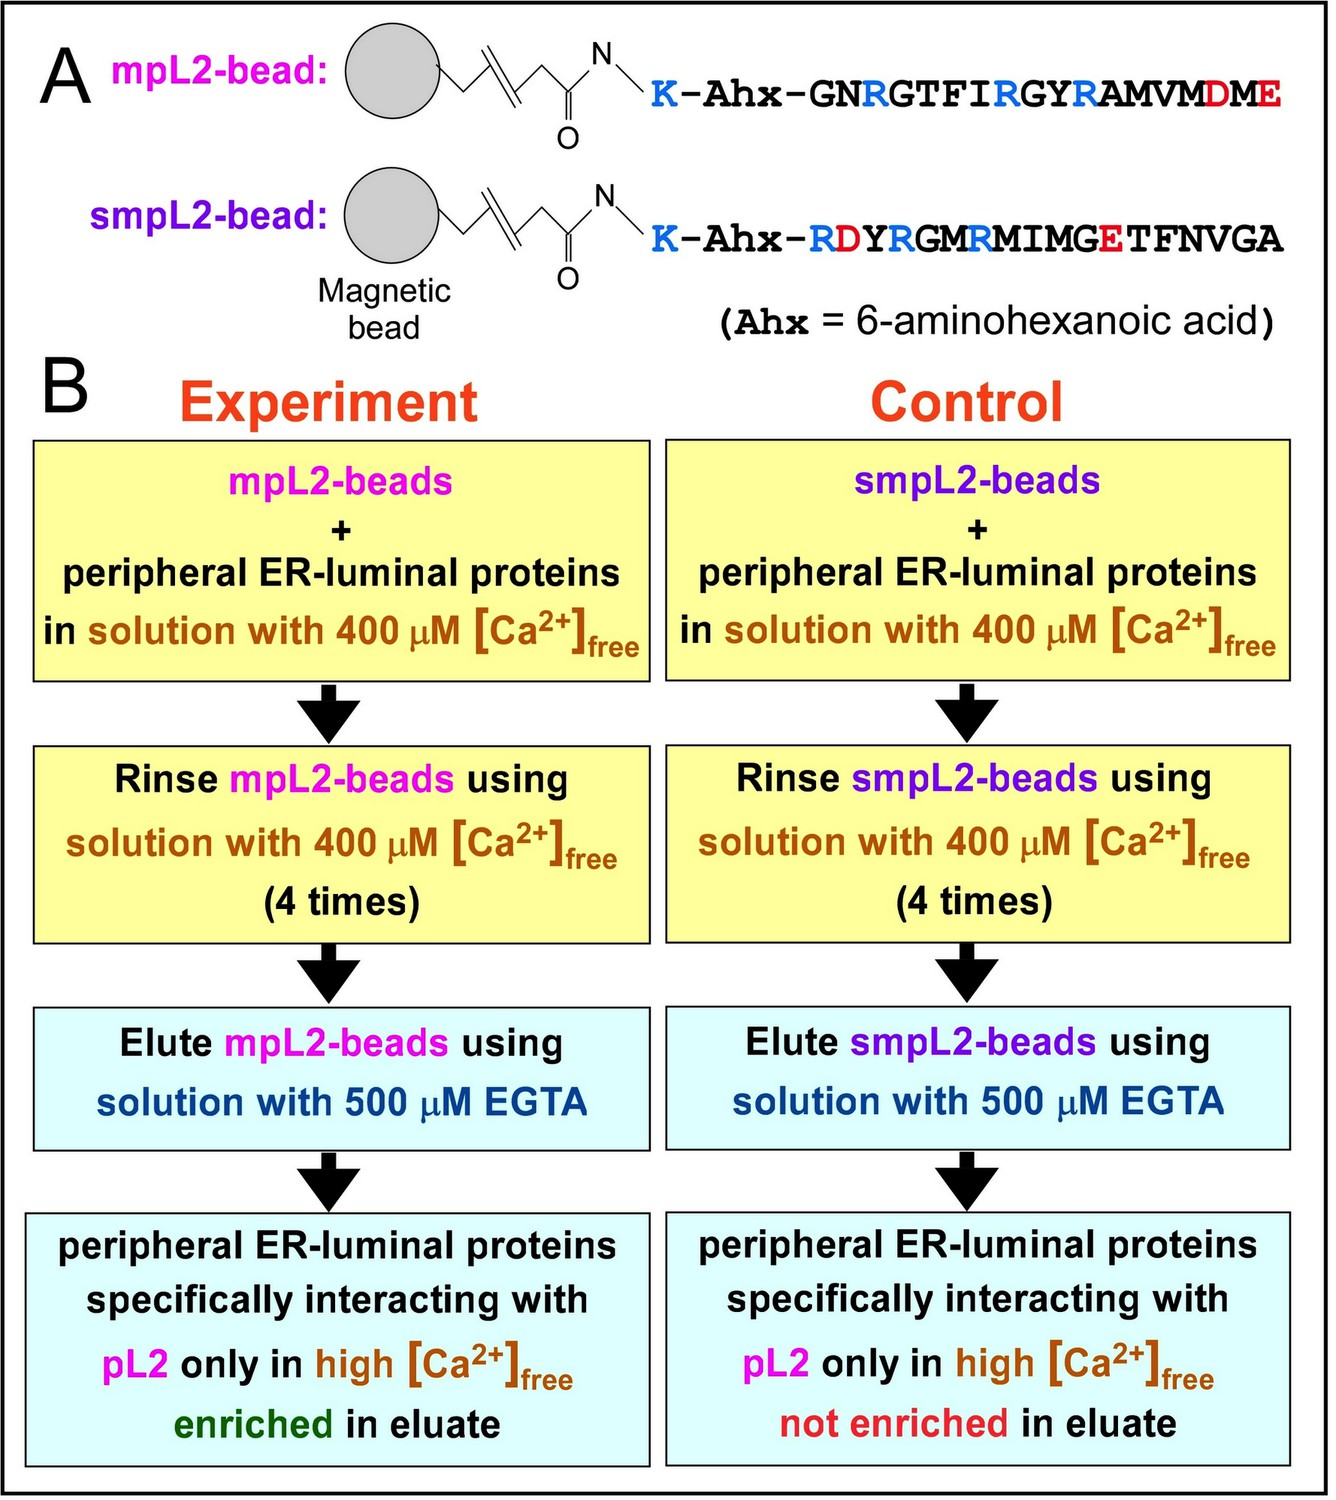
Pull-down of peripheral luminal proteins that interact with IP3R-3 L2 loop.
(A) Peptides with modified pL2 (mpL2) or scrambled modified pL2 (smpL2) sequences were immobilized on magnetic beads. (B) Protocol to enrich soluble proteins from bovine ER-microsome fractions that interact with pL2 peptide in presence of high physiological [Ca2+].
Figure 7 with 1 supplement
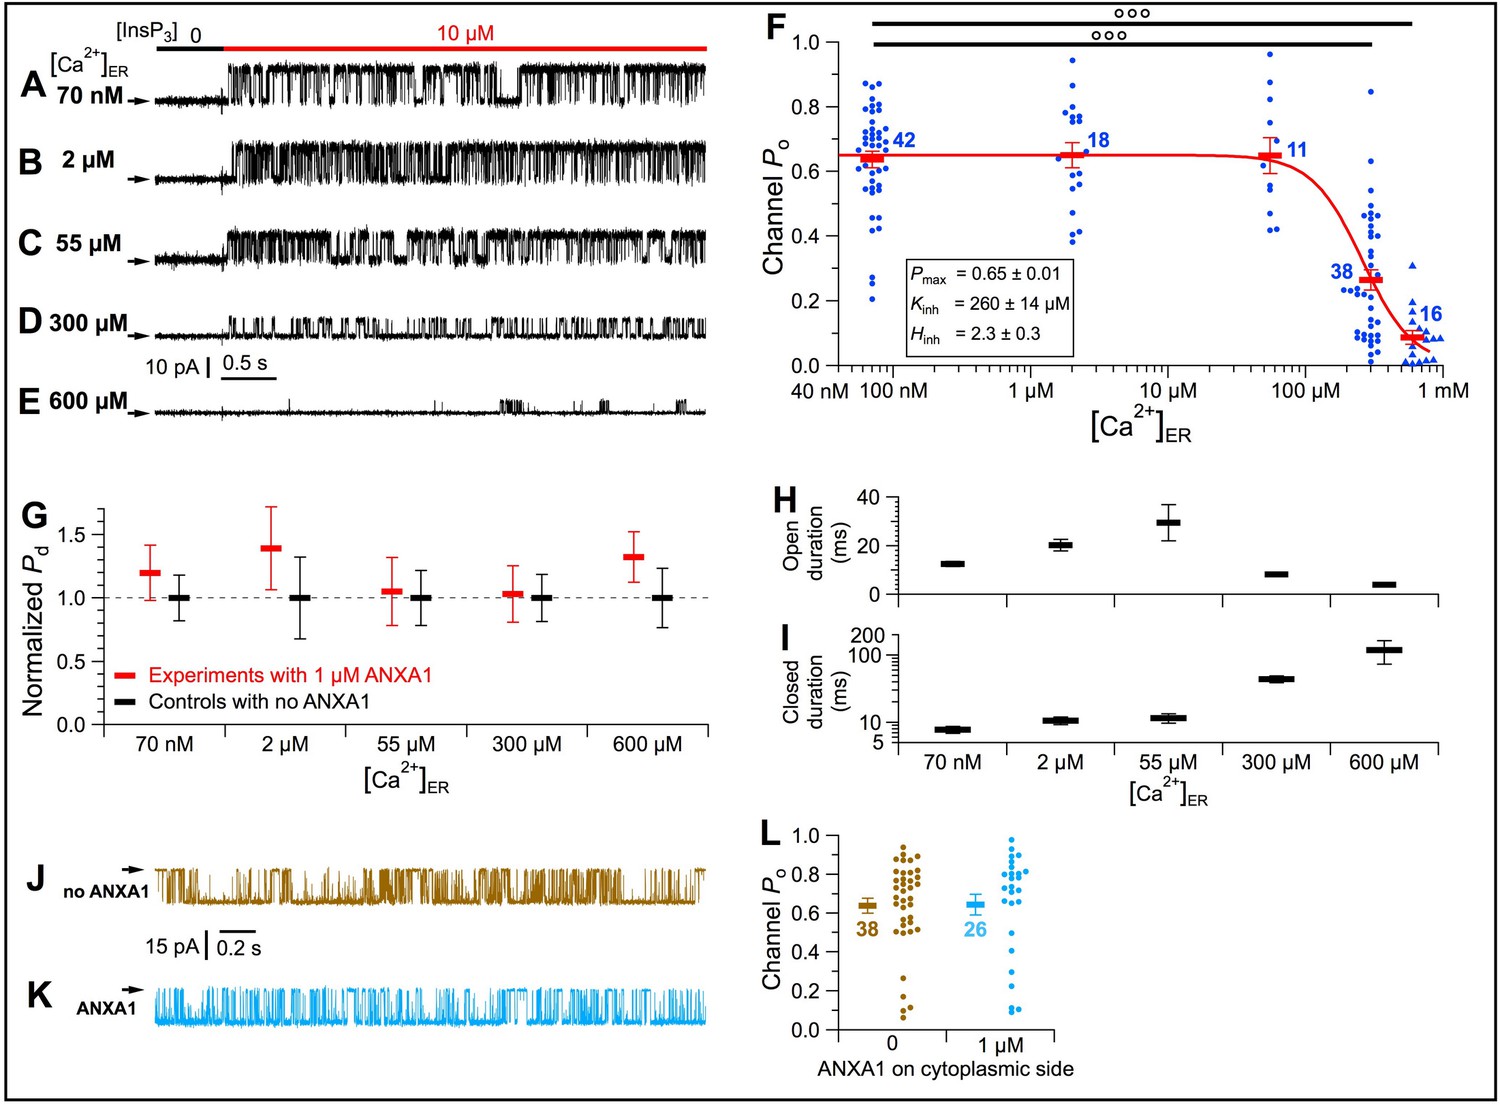
[Ca2+]ER inhibition of InsP3R-3 channel activity is mediated by a specific interaction between the channel and ANXA1 in the ER lumen.
(A–E) Typical current traces of InsP3R-3 channels in cyto-out configuration with 1 μM ANXA1 and various [Ca2+]ER in pipette solution. In C–E with [Ca2+]ER >40 μM, channel conductance reduced due to permeant-ion block. (F) Po of individual current traces (blue symbols) and averages and s.e.m. (red horizontal bars) observed under conditions in (A–E). Red curve: least-squares fit to average Po at various [Ca2+]ER using simple inhibitory Hill equation with parameters tabulated. (G) Averages and s.e.m. of normalized probability of detection of InsP3R channels (Pd) in cyto-out experiments with 0 (black) or 1 μM (red) ANXA1 in pipette solutions with various [Ca2+]ER. (H–I) Averages and s.e.m. of InsP3R-3 channel open (H) and closed (I) durations in cyto-out patch-clamp experiments in (F). (J–K) Typical current traces in on-nuc patches with pipette (cytoplasmic) solutions containing 2 μM Ca2+i and 10 μM InsP3, with 0 (J) or 1 μM (K) ANXA1. Bath solution: 70 nM Ca2+ER with 0-MgATP. (L) Po of individual current traces (brown: no ANXA1; light blue: 1 μM ANXA1 on cytoplasmic side) and averages and s.e.m. (respective horizontal bars) observed under conditions in (J–K).
Figure 7—figure supplement 1
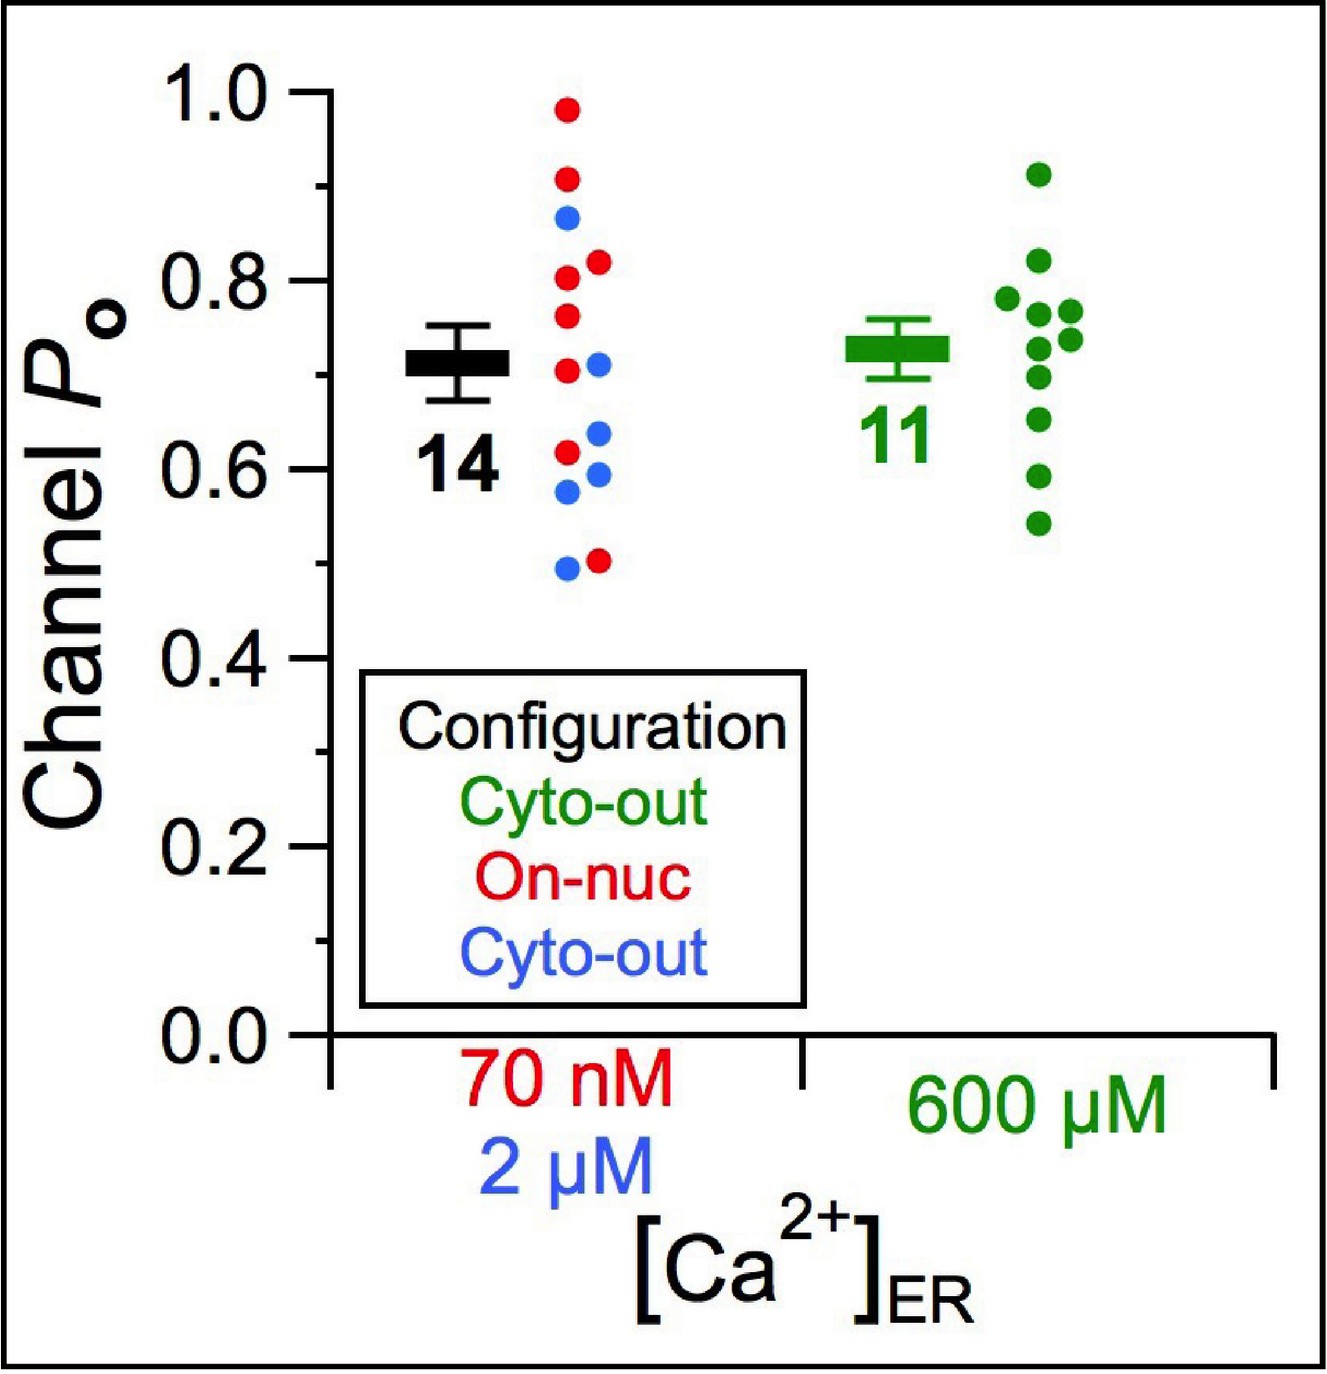
Abrogation of Ca2+ feed-through effect on InsP3R channel activity by buffering [Ca2+]i with a high concentration (10 mM) of the Ca2+ chelator HEDTA in the cytoplasmic solution.
Channel Po of individual current traces (circles) and their averages and s.e.m. (horizontal bars) are plotted for cyto-out (green and blue circles) and on-nuc (red circles) patch-clamp experiments performed. There is no significant difference in channel Po observed in the presence (green data) and absence (data in other colors) of Ca2+ flux driven through the active channel by high [Ca2+]ER. Channels were activated by perfusion solutions containing optimal 2 μM [Ca2+]i, saturating 10 μM [InsP3] and 0.5 mM [ATP4-].
Figure 8

L2 peptide, but not scrambled L2 peptide, was able to compete ANXA1 from the InsP3R channel and restore high channel activity.
(A–B) Typical current traces in cyto-out experiments with pipette solutions containing 300 Ca2+ER, 1 μM ANXA1, and 40 μM of L2 (A) or scrambled L2 (sL2) (B) peptides. Peptide sequences shown below corresponding traces. (C) Po of individual current traces (orange: L2 peptide; yellow: sL2 peptide) and averages and s.e.m. (horizontal bars) observed under conditions in (A–B). For comparison, averages and s.e.m. of Po in similar cyto-out experiments without peptide, and without (magenta bars) and with (light green bars) ANXA1, from Figures 4J and 6F, respectively.
Figure 9
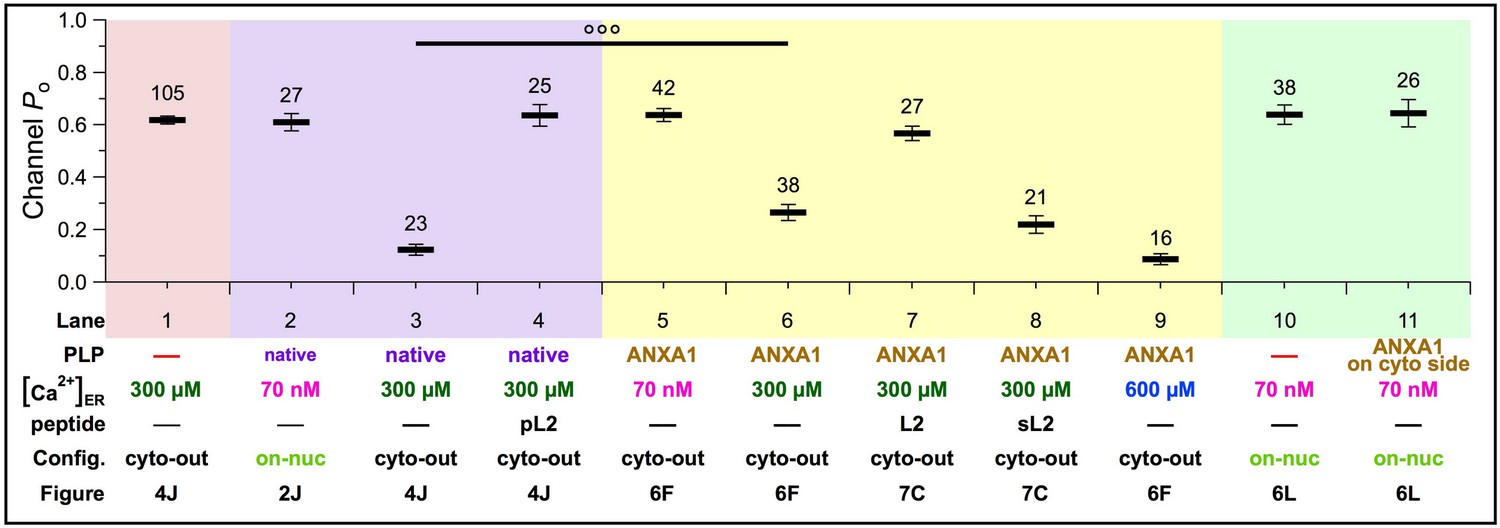
Modulation of homotetrameric InsP3R channel activity by native inhibitory peripheral luminal protein or ANXA1 under various experimental conditions: 70 nM, 300 or 600 μM Ca2+ER; in the absence or presence of peptides with L2 sequences (pL2, L2 or sL2); and in on-nuc or cyto-out patch-clamp configurations.
Averages and s.e.m. of InsP3R-3 Po are shown as tabulated.
Figure 10 with 1 supplement
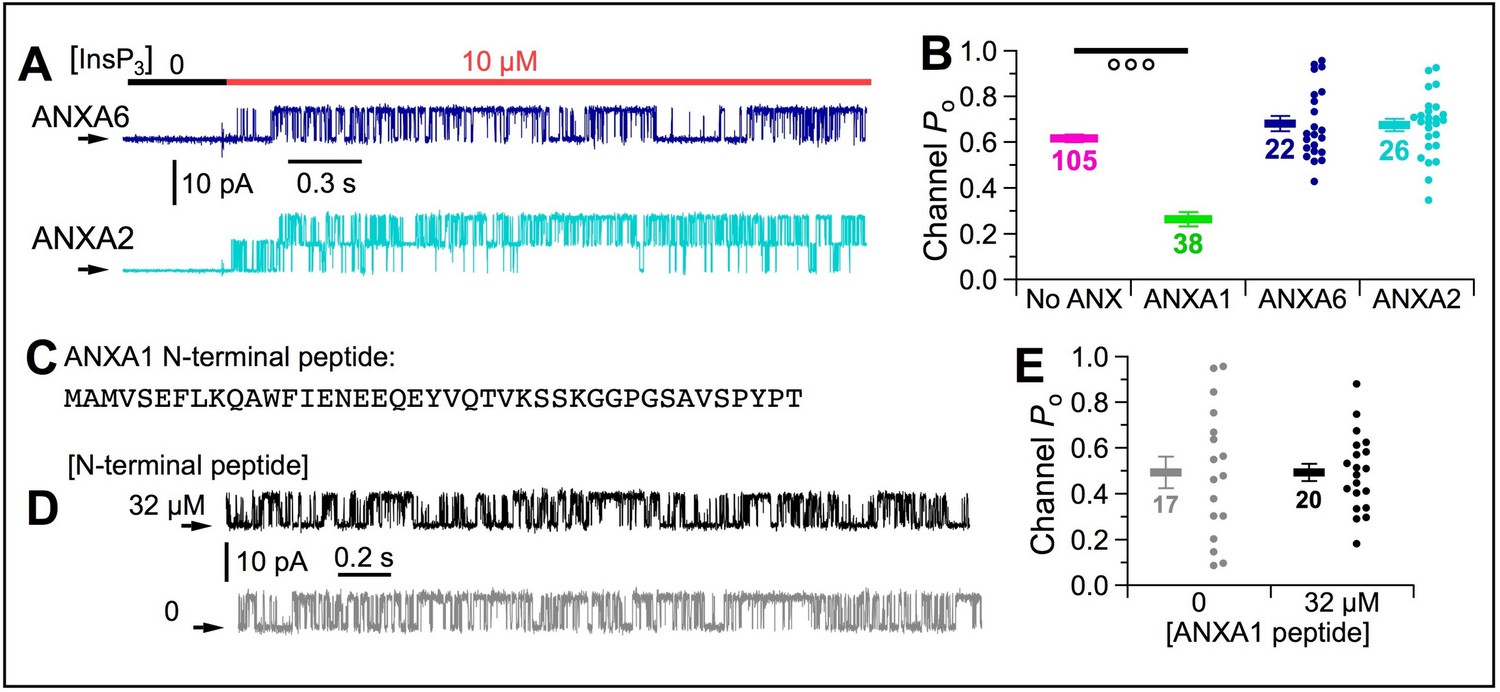
[Ca2+]ER inhibition of InsP3R channel activity is specifically mediated by ANXA1 through interaction with the L2 loop of InsP3R.
(A) Typical current traces of InsP3R-3 in cyto-out experiments with pipette containing 300 μM Ca2+ER and 1 μM ANXA6 or A2. Isolated patches perfused with 2 μM Ca2+free, 0.5 mM ATP4– with 0 or 10 μM InsP3 as indicated. (B) Po of individual current traces (circles) and average and s.e.m. (horizontal bars) for cyto-out experiments with ANXA6 (blue) or ANXA2 (cyan). For comparison are averages and s.e.m. of Po in similar experiments with no ANXA1 (magenta bars) and ANXA1 (green bars), from Figures 5J and 6F, respectively. (C) Synthetic peptide with 41 residues of N-terminal domain of ANXA1. (D) Typical current traces of InsP3R-3 in cyto-out configuration with pipette containing 300 μM Ca2+ER, with or without 32 μM ANXA1 N-terminal peptide. Isolated patches perfused with solution containing 2 μM Ca2+i, 10 μM InsP3 and 0.5 mM ATP4–. (E) Po of individual current traces (circles) and average and s.e.m. (horizontal bars) for cyto-out experiments with (black) or without (grey) 32 μM ANXA1 N-terminal peptides.
Figure 10—figure supplement 1
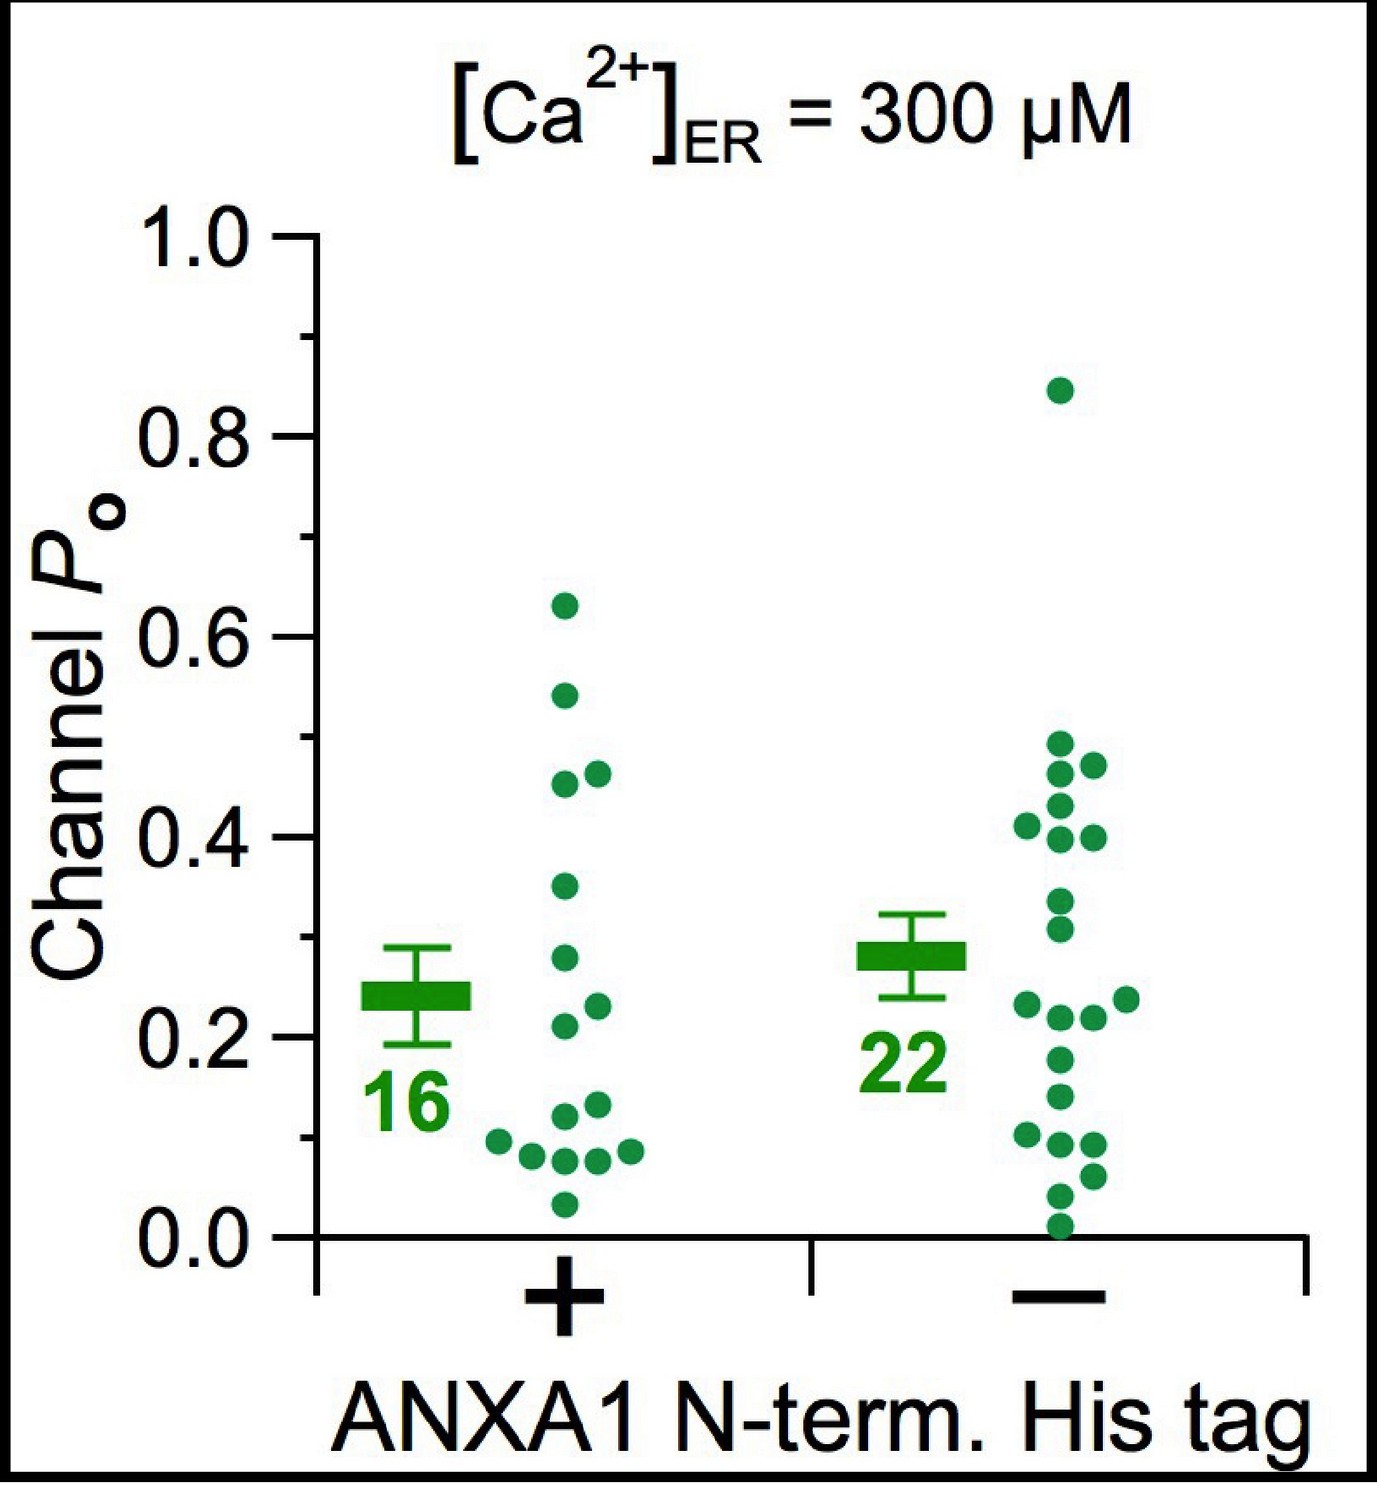
Presence of a His tag at the N-terminus of the ANXA1 has no effect on its ability to inhibit InsP3R channel activities in 300 μM [Ca2+]ER.
InsP3R-3 channel Po of individual current traces (green circles), the averages and s.e.m. of Po (green horizontal bars) for cyto-out experiments performed using ANXA1 with or without His tag at its N-terminal are plotted as indicated. Channels in the cyto-out patch-clamp configuration were activated by perfusion solutions containing optimal 2 μM [Ca2+]i, saturating 10 μM [InsP3] and 0.5 mM [ATP4-].
Figure 11

Endogenous ANXA1 inhibits InsP3R-mediated Ca2+ release.
(A) Western blot of ANXA1 and β-actin in lysates from HEKtsA201 cells treated with transfection medium (left) or ANXA1 siRNA (right) (one of four similar blots shown). (B) Summary of ANXA1 protein knockdown. HEKtsA201 cells treated with ANXA1 siRNA (four samples), transfection medium only (two samples) or with non-targeting (N-T) siRNA (two samples). (C) Typical trace of fura-2 fluorescence ratio (ΔR) observed in population of intact HEKtsA201 cells stimulated by 10 μM carbachol (CCH). Maximal rise in ΔR (ΔRmax): blue double arrow; time constant (τ) of single exponential fit to rising phase of fluorescence ratio (red curve) is time for ΔR to rise to [1–1/e] of ΔRmax: red double arrow. (D) Normalized ΔRmax of individual ΔR traces (circles) and averages and s.e.m. (horizontal bars) for ANXA1 siRNA-treated (right) and control cells (left). Number of traces tabulated next to horizontal bars. (E) Normalized rate of change of ΔR (1/τ) for ΔR traces using convention as (D). (F) ANXA1 immunofluorescence intensity of HeLa cells treated with non-targeting (N-T) or ANXA1 siRNA. Number of cells tabulated below corresponding circles. (G) Fractions of N-T or ANXA1 siRNA-treated HeLa cells that responded by ER Ca2+ release through InsP3R when stimulated by sub-saturating 10 (red) or saturating 100 (blue) μM histamine. (H–I) Traces of mean normalized ER Ca2+ release from N-T (red) or ANXA1 (black) siRNA-treated HeLa cells responding to 100 μM (H) or 10 μM (I) histamine. (J) Fractions of N-T or ANXA1 siRNA-treated HeLa cells that oscillated in response to 10 (red) or 100 (blue) μM histamine. (K) Selected traces showing different kinds of Ca2+ signals in AnxA1 siRNA-treated HeLa cells responding to sub-saturating 10 μM histamine. (L) Typical fluorescence amplitude (ΔF/F0) traces showing local Ca2+ release events (puffs) in HEK293 cells treated with N-T (black) or ANXA1 (red) siRNA. Cells stimulated by photolysis of caged i-InsP3 using sub-maximal 50 ms UV flash. (M–P) Puffs generated by 50 ms UV flash were subsequently observed for 30 s in eight imaging fields (M); puffs generated by maximal 150 ms UV flash and subsequently observed for 10 s in six imaging fields (N). Dots indicate numbers of puffs observed for N-T (black) and ANXA1 (red) siRNA-treated cells. Means and s.e.m. indicated by bars. (O–P) Dot plots of ΔF/F0 of individual Ca2+ puffs observed in N-T (black) and ANXA1 (red) siRNA-treated cells, generated by 50 ms (O) and 150 ms (P) UV flashes, respectively. Means and s.e.m. indicated by diamonds and bars, respectively.
Tables
Key resources table
| Reagent type (species) or resource | Designation | Source or reference | Identifiers | Additional information |
|---|---|---|---|---|
| Peptide, recombinant protein | Anx A1 | Abcam | ab86446 | |
| Peptide, recombinant protein | Anx A1 with N-terminal His tag | Abcam | ab184588 | |
| Peptide, recombinant protein | Anx A2 | Abcam | ab93005 | |
| Peptide, recombinant protein | Anx A6 | Abcam | ab92934 | |
| Peptide, recombinant protein | L2 peptide (GNRGTFIRGYKAMVMDMEFLYHVGYILTSVLGLFAHEL) | Peptide 2.0 | custom | |
| Peptide, recombinant protein | sL2 peptide (DVVIALHGNAMMYLLVFEHTSTGIGKFLRFYGERLMYG) | Peptide 2.0 | custom | |
| Peptide, recombinant protein | pL2 peptide (GNRGTFIRGYKAMVMDME) | Peptide 2.0 | custom | |
| peptide, recombinant protein | mpL2 peptide (K-Ahx-GNRGTFIRGYRAMVMDME, Ahx stands for 6-aminohexanoate residue) | Peptide 2.0 | custom | |
| Peptide, recombinant protein | smpL2 peptide (K-Ahx-RDYRGMRMIMGETFNVGA, Ahx stands for 6-aminohexanoate residue) | Peptide 2.0 | custom | |
| Peptide, recombinant protein | ANXA1 N-terminal peptide (MAMVSEFLKQAWFIENEEQEYVQTVKSSKGGPGSAVSPYPT) | Peptide 2.0 | custom | |
| Chemical compound, drug | siRNA buffer | Dharmacon | B-002000-UB-100 | |
| Chemical compound, drug | siRNA transfection reagent | Dharmacon | T-2001–02 | |
| Chemical compound, drug | diBrBAPTA (5,5′-dibromo1,2-bis(o-amino phenoxy)ehane -N,N,N′,N′-tetraacetic acid) | Invitrogen | D-1211 | |
| Chemical compound, drug | diBrBAPTA (5,5′-dibromo1,2-bis(o-amino phenoxy)ehane -N,N,N′,N′-tetraacetic acid) | Santa Cruz Biotechnology | sc-2273516 | |
| Chemical compound, drug | 2Hydroxyethyl)ethylenediaminetriacetic acid (HEDTA) | Sigma | H7154 | |
| Chemical compound, drug | inositol 1,4,5-trisphosphate | Invitrogen | I-3716 | |
| Chemical compound, drug | inositol 1,4,5-trisphosphate | Santa Cruz Biotechnology | sc-201521 | |
| Chemical compound, drug | NHS-activated magnetic beads | Pierce | 88826 | |
| Chemical compound, drug | Protein A Dynabeads | ThermoFisher | 10006D | |
| Chemical compound, drug | Anti-Flag M2 agarose beads | Sigma | A2220 | |
| Chemical compound, drug | Fura-2 AM | Molecular Probes | I-1225 | |
| Chemical compound, drug | siGLO Red transfection indicator | Dharmacon | D-001630-02-05 | |
| Chemical compound, drug | Cal-520/AM | AAT Bioquest | 21130 | |
| Chemical compound, drug | Caged Ins(1,4,5)P3/PM (caged InsP3) | Sirius Fine Chemical SiChem GmbH | cag-iso-2–145- | |
| Chemical compound, drug | EGTA/AM | ThemoFisher | E1219 | |
| Cell line (Gallus gallus) | DT40 cells (wild-type) | Riken Bioresource Center | RCB1464; RRID:CVCL_0249 | |
| Cell line (Gallus gallus) | DT40-KO cells (with all three InsP3R genes disrupted) | Riken Bioresource Center | RCB1467; RRID:CVCL_4634 | |
| Cell line (Gallus gallus) | DT40-r3 cells | ref. (Mak et al., 2013b) in this study | NA | |
| Cell line (Homo-sapiens) | HEK293 cells | ATCC | CRL-1573; RRID:CVCL_0045 | |
| Cell line (Homo-sapiens) | HEK-3KO cells | Kerafast | EUR030; RRID:CVCL_HB82 | |
| Cell line (Homo-sapiens) | HEK293-3KO-r InsP3R-3 cells | this study | NA | |
| Cell line Mus musculus | N2a cells | ATCC | CCL-131; RRID:CVCL_0470 | |
| Cell line (Rattus rattus) | PC12 cells | ATCC | CRL-1721; RRID:CVCL_0481 | |
| Cell line (Homo-sapiens) | tsA201 cells | Sigma-Aldrich | 96121229; RRID:CVCL_2737 | |
| Cell line (Homo-sapiens) | A549 cells | ATCC | CCL-185; RRID:CVCL_0023 | |
| Genetic reagent (Homo sapiens) | Anx A1 siRNA | Dharmacon | M-011161-01-0005 | |
| Genetic reagent (Homo sapiens) | Non-targeting siRNA | Dharmacon | D-001206-13-05 | |
| Antibody | rabbit polyclonal anti-AnxA1 antibody | Proteintech | 21990–1-AP; RRID:AB_11182596 | WB: 1:1000-1:4000 IP: 1:1000-1:10000 IHC: 1:50-1:500 IF: 1:20-1:200 |
| Antibody | mouse monoclonal anti-AnxA1 antibody | ECM Biosciences | AM0211 | ELISA 1:1000 ICC 1:100 IP 1:100 WB 1:1000 |
| Antibody | rabbit polyclonal anti-FLAG antibody | Cell Signaling | 14793S; RRID:AB_2572291 | WB: 1:1000 IP: 1:50 IHC: 1:800 IF: 1:800 FC: 1:1600 Chromatin IP: 1:50 |
| Antibody | goat anti-rabbit IgG (H+L) Cross-Adsorbed Secondary Antibody, Alexa Fluor 568 | Invitrogen | A-11011; RRID:AB_143157 | FC: 1–10 µg/mL ICC: 2 µg/mL IF: 2 µg/mL |
| Antibody | mouse monoclonal anti-calnexin antibody | Chemicon | MAB3126 RRID:AB_143157 | ICC: 1:100-1:250 WB: 1:200-1:2000 IP: 1:200-1:1000 |
| Antibody | rabbit polyclonal anti-β actin antibody | Cell Signaling | 7881S; RRID:AB_1549731 | capture Elisa: 1:100 |
| Antibody | goat polyclonal anti-mouse IgG-HRP antibody | Cell Signaling | 7074S; RRID:AB_2099233 | capture Elisa: 1:1000-1:3000 |
| Antibody | horse polyclonal anti-mouse IgG-HRP antibldy | Cell Signaling | 7076S; RRID:AB_330924 | capture Elisa: 1:1000-1:3000 |
| Antibody | mouse monoclonal anti-βactin antibody | Cell Signaling | 8H10D10; RRID:AB_2242334 | WB: 1:1000 IHC: 1:8000-1:32000 IF: 1:2500-1:10000 FC: 1:200-1:800 |
| Antibody | mouse monoclonal anti-type 3 InsP3R antibody | BD Transduction Laboratories | 610312; RRID:AB_397704 | WB: 1:2000-1:4000 |
| Software, algorithm | QuB | refs. (Qin et al., 2000) and (Bruno et al., 2013) in this study | Quantitative single-channel analysis | |
| Software, algorithm | IGOR Pro | Wavemetrics | Figure production and data fitting | |
| Software, algorithm | Metamorph v7.7 | Universal Imaging/Molecular Devices | Image analysis | |
| Software, algorithm | Flika | Ellefsen et al., 2014 | Image processing | |
| Software, algorithm | Microcal Origin v6.0 | OriginLab | Data analysis and graphing | |
| Software, algorithm | Max Chelator | online freeware | Calculation of ion concentrations | |
| Software, algorithm | MaxQuant, version 1.6.1.0 | online freeware | Database search |
Additional files
Download links
A two-part list of links to download the article, or parts of the article, in various formats.
Downloads (link to download the article as PDF)
Open citations (links to open the citations from this article in various online reference manager services)
Cite this article (links to download the citations from this article in formats compatible with various reference manager tools)
ER-luminal [Ca2+] regulation of InsP3 receptor gating mediated by an ER-luminal peripheral Ca2+-binding protein
eLife 9:e53531.
https://doi.org/10.7554/eLife.53531


