Separable gain control of ongoing and evoked activity in the visual cortex by serotonergic input
- Optical Imaging Group, Institut für Neuroinformatik, Ruhr University Bochum, Germany
- International Graduate School of Neuroscience (IGSN), Ruhr University Bochum, Germany
- Department of General Zoology and Neurobiology, Ruhr University Bochum, Germany
Figures
Figure 1 with 1 supplement
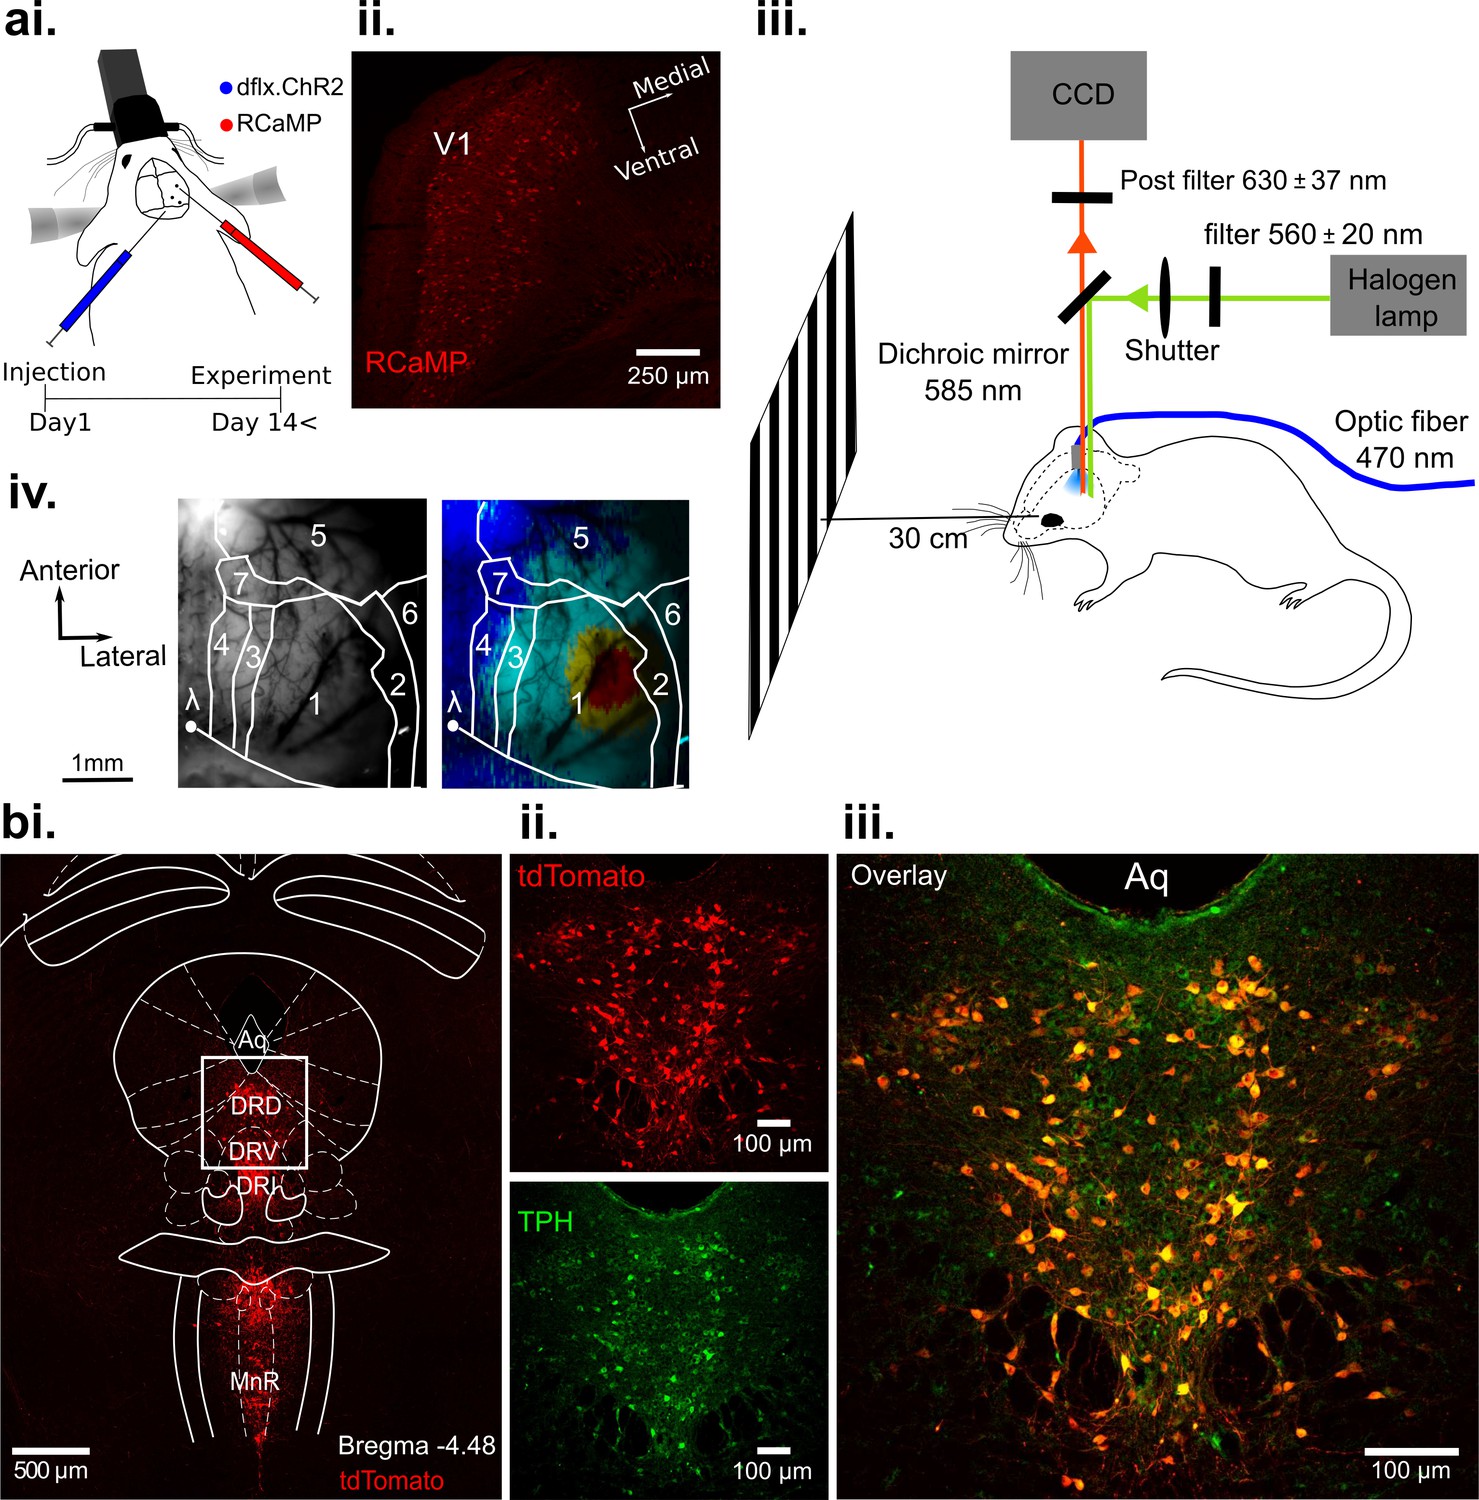
Optogenetic activation of DRN 5-HT neurons and concurrent RCaMP imaging in V1 in vivo.
(ai) Viral injection of RCaMP in V1 and adjacent cortical areas and injection of ChR2-mCherry into DRN of ePet-Cre mice. (aii) Coronal section of V1, showing expression of RCaMP. (aiii) Schematic of the experimental setup. DRN photostimulation was performed via an implanted optic fiber and wide-field imaging was achieved through the thinned skull. Stimuli were displayed on a monitor at 30 cm distance to the eye contralateral to the recorded hemisphere. Animals were anesthetized and head-fixed. (aiv) Vascular pattern (left) of the imaged cortical region showing activation across V1 and neighboring visual areas after visual stimulation (right). 1: V1; 2: V2Lateral; 3: V2Medio-Lateral; 4: V2Medio-Medial; 5: somatosensory cortex; 6: auditory cortex; 7: PtA (parietal association area). (bi) Coronal section at the DRN injection site after expression of Cre-dependent tdTomato (red). Most subnuclei including dorsal (DRD), ventral (DRV), and interfascicular (DRI) parts of the DRN, and the median raphe nucleus (MnR) show fluorescent labeling of serotonergic cells. (bii-iii) Magnified view of the area outlined in (bi). Labeling with fluorescent reporter tdTomato (bii, top), antibody labeling against tryptophan hydroxylase (TPH, (bii), bottom), and their co-localization (biii); Aq: aquaduct.
Figure 1—figure supplement 1
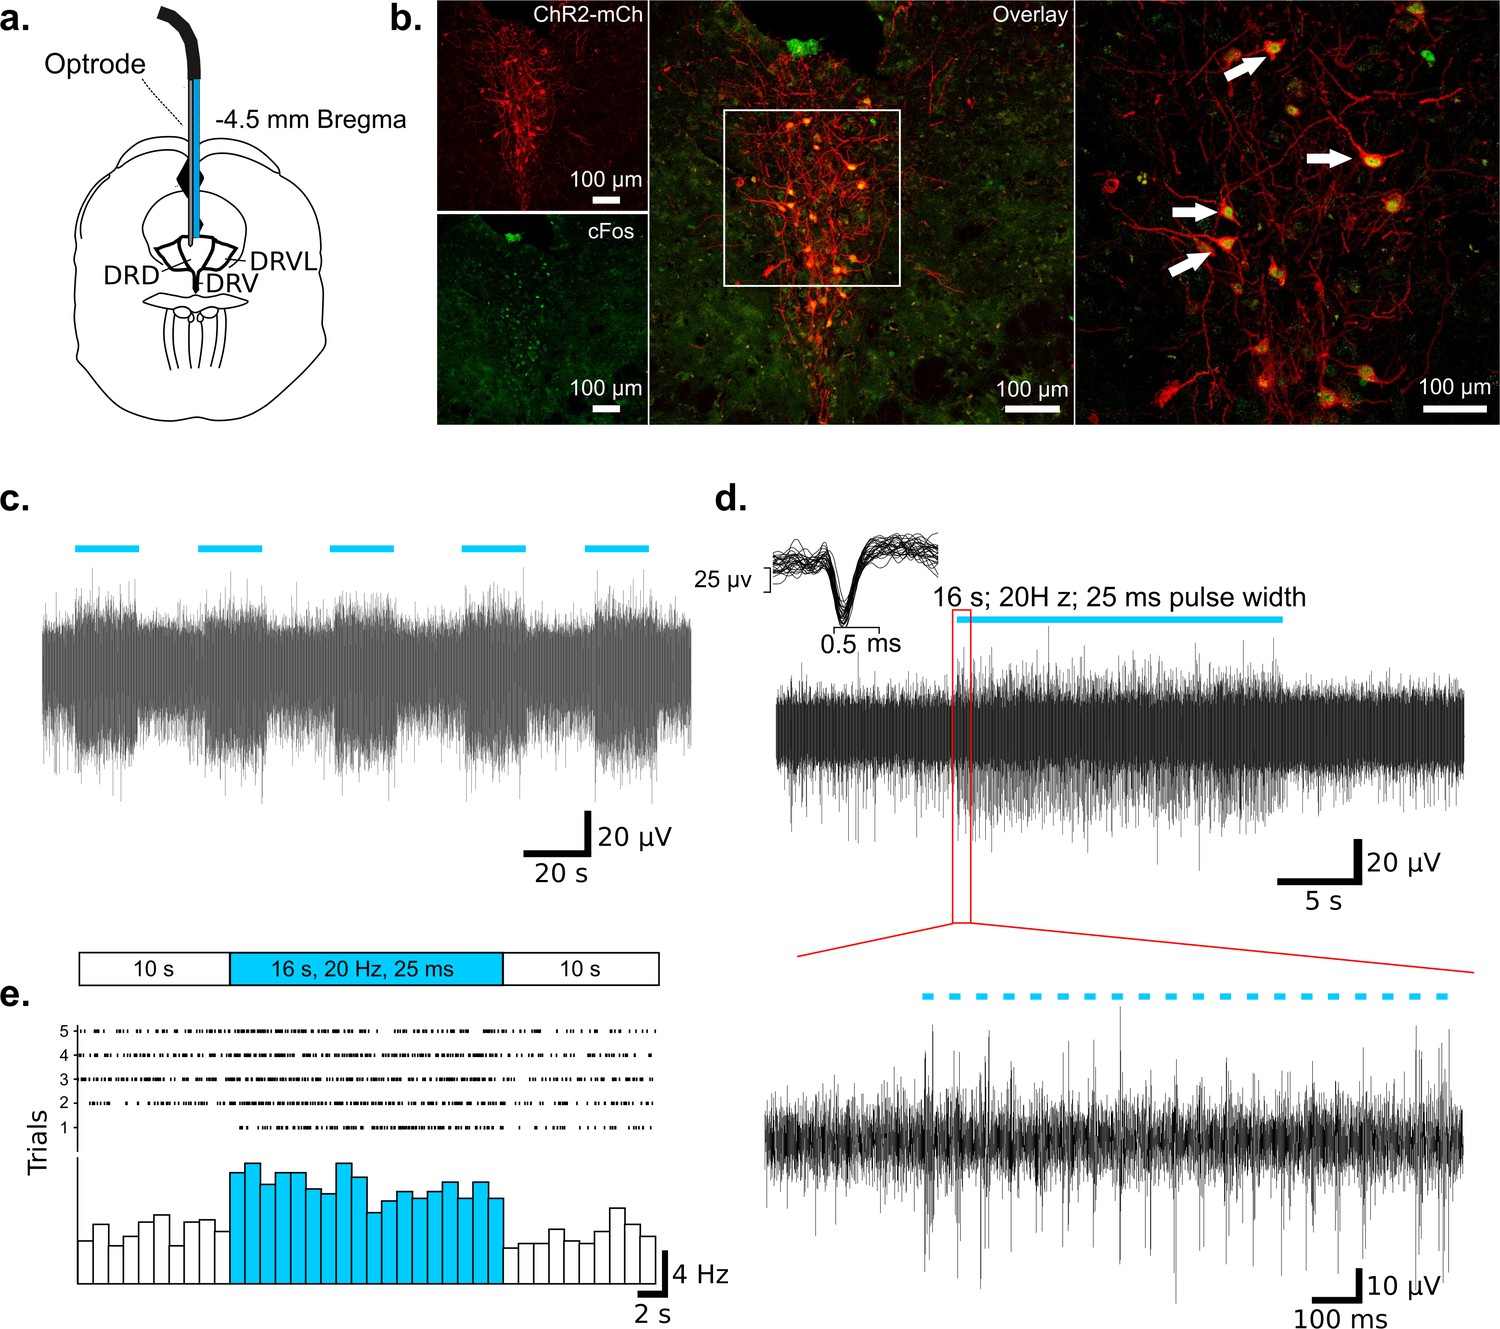
Example extracellular MUA recording in the DRN during photostimulation in an ePet-Cre mouse.
(a) Schematic of optrode placement in the DRN. (b) Immunohistochemical identification of ChR2-expressing 5-HT neurons in the DRN (red) co-labeled for cFos (green). Higher magnification picture of the boxed region indicates that ChR2-expressing neurons were positive for cFos after optical stimulation. (c) MUA, showing activation following onset of photostimulation (16 s of 20 Hz, blue light pulses of 25 ms pulse width). (d) Upper: Representative trial of one photostimulation period (blue bar). Corresponding spike waveforms (25 overlaid spikes) are shown at upper left. Lower: Magnified picture of the boxed region in the upper panel. Blue bars indicate individual 25 ms light pulses. (e) Peristimulus time histograms (bin size 1 s) and raster plots of five trials.
Figure 2
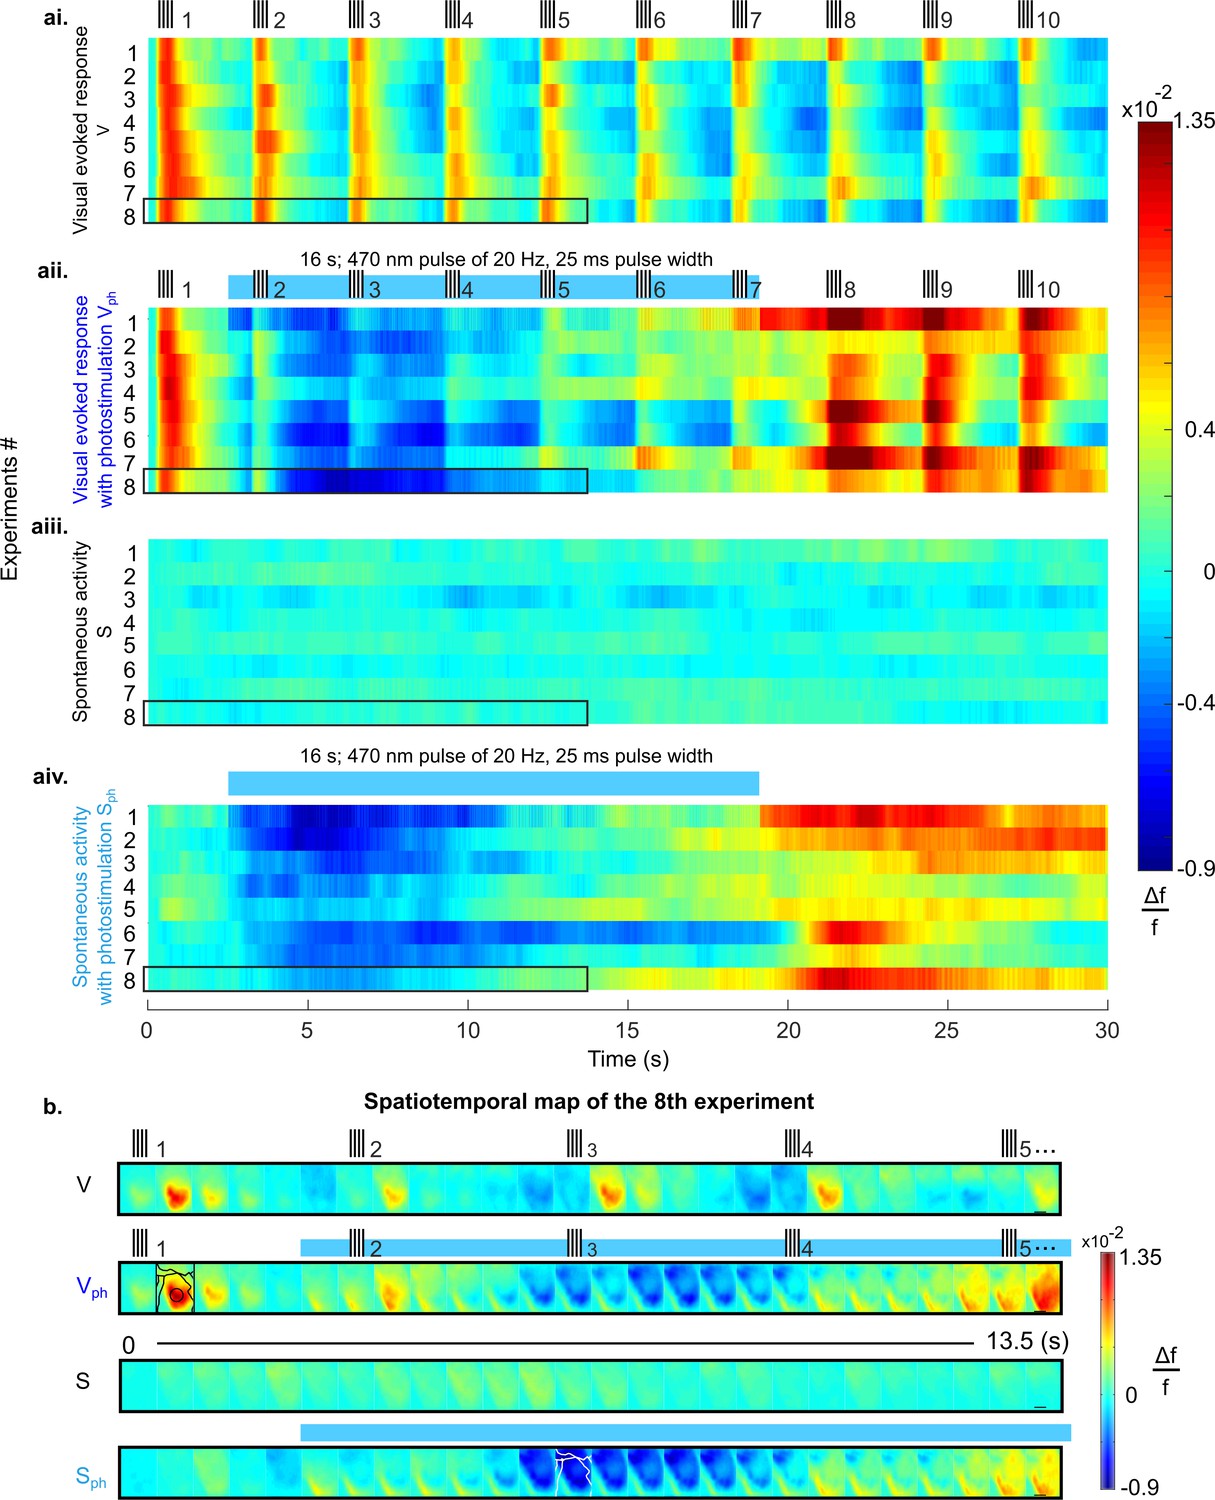
Suppression of cortical population activity after photostimulation of 5-HT neurons in the DRN.
(ai-aiv) Spatial averages of changes in fluorescence (Δf/f, cf. colorbars) across V1 of 8 different mice in response to four experimental conditions. (ai) Repeated visual stimulation with drifting gratings (V, icons on top show on/offsets of visual stimulus). (aii) Visual stimulation and concurrent photostimulation of the DRN (Vph, blue bar on top marks photostimulation time). (aiii) Spontaneous activity (S). (aiv) Spontaneous activity and concurrent photostimulation of the DRN (Sph). (b) Example spatiotemporal map of experiment #8 (encircled black in ai-aiv) depicting recording across the cortical surface before spatial averaging (image frames were 500 ms time binned) over 13.5 s. Horizontal black lines in right frames delineate 1 mm. Conditions are denoted as in a. Different cortical areas (as specified in Figure 1aiv, caption) are outlined black and white (see frames within rows two and four, respectively). Small signal increases at lower left corners of image frames simultaneous with onset of photostimulation indicate artifacts due to partial interference with fluorescent signals.
Figure 3 with 1 supplement
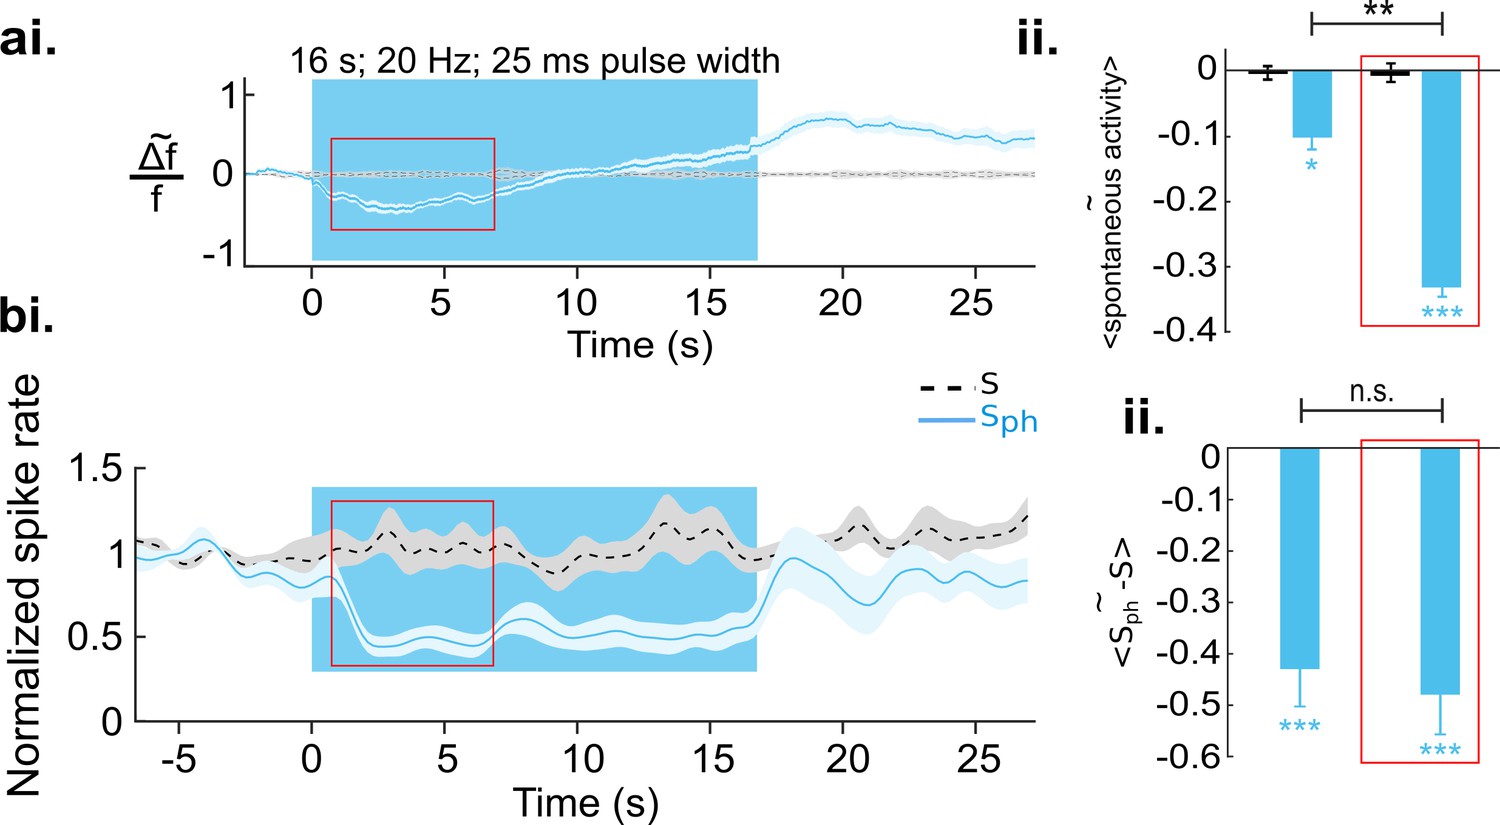
Increased serotonergic input suppresses spontaneous cortical activity.
(ai) Ca2+ imaging of spontaneous activity. Traces were derived after spatial averaging and depict mean across eight animals, each experiment comprising 25–50 trials (light blue area marks SEM). Black stippled lines indicate spontaneous activity without photostimulation (S). Blue solid line shows spontaneous activity with concurrent DRN photostimulation (Sph). Blue background marks time window of photostimulation. Red rectangle encircles a time window in which Sph is significantly lower than S (see main text). (aii) Average of S (black bar) and Sph (light blue bar) over the entire time of photostimulation and over the time window marked by the red rectangle in ai. (bi) MUA recordings, same conditions as shown in a. Data are based on 104 multi-units over 25 different recordings (10–20 trials) in nine animals at cortical depths between 250 and 750 µm. (bii) Similar quantification as in aii (for details see Methods). All values in the panels are mean ± SEM. Color legend in bi applies to all panels. ***p<0.001, **p<0.01, and *p<0.05, one-sample and paired t test. For a single example of MUA recording see Figure 3—figure supplement 1.
Figure 3—figure supplement 1
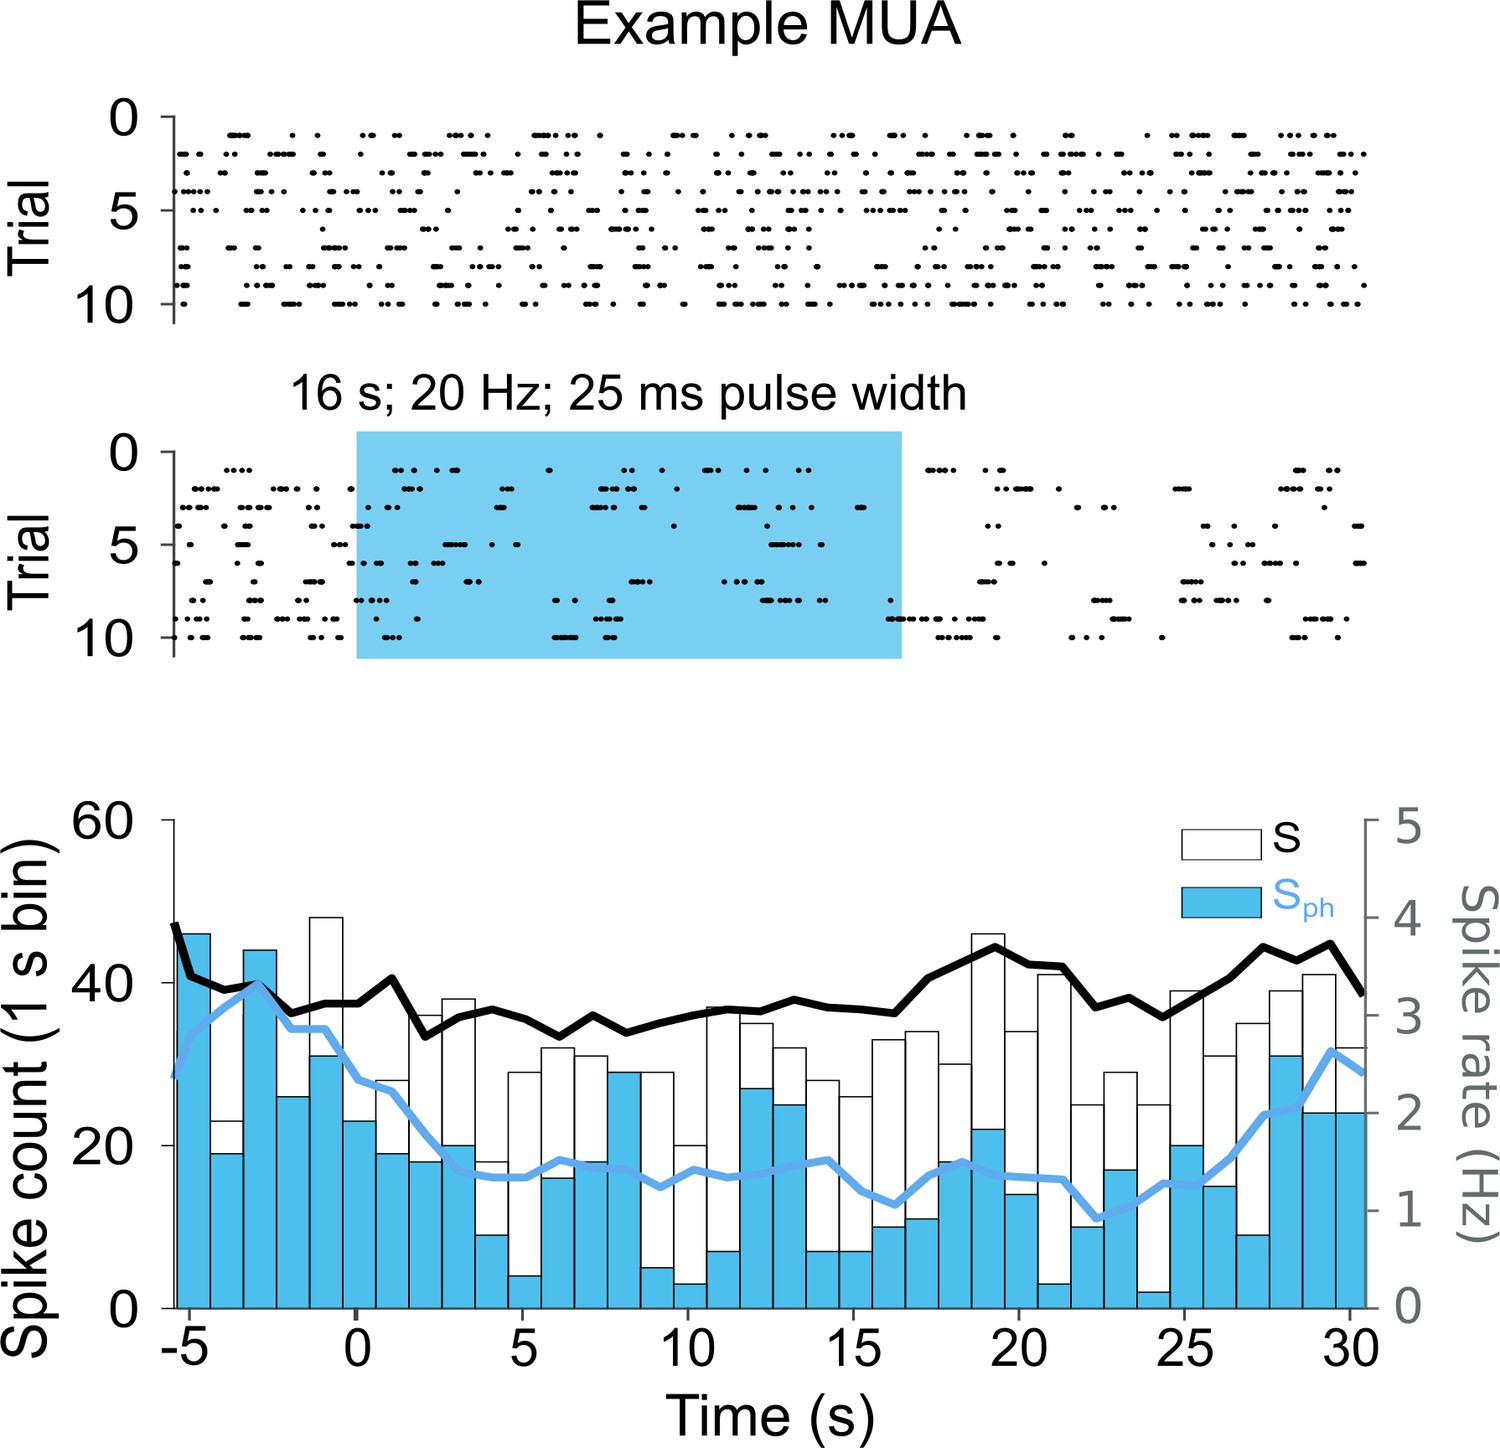
Multi-unit recording example of spontaneous activity without and with DRN photostimulation.
Upper: Raster plot of MUA in V1 across 10 trials for the S control condition. Middle: Same as S with photostimulation of the DRN (Sph). Bottom: Histograms of the raster plots depicted above. The overlaid traces (smoothed with a moving average filter of length 5) show the spike rate (right y-axis).
Figure 4
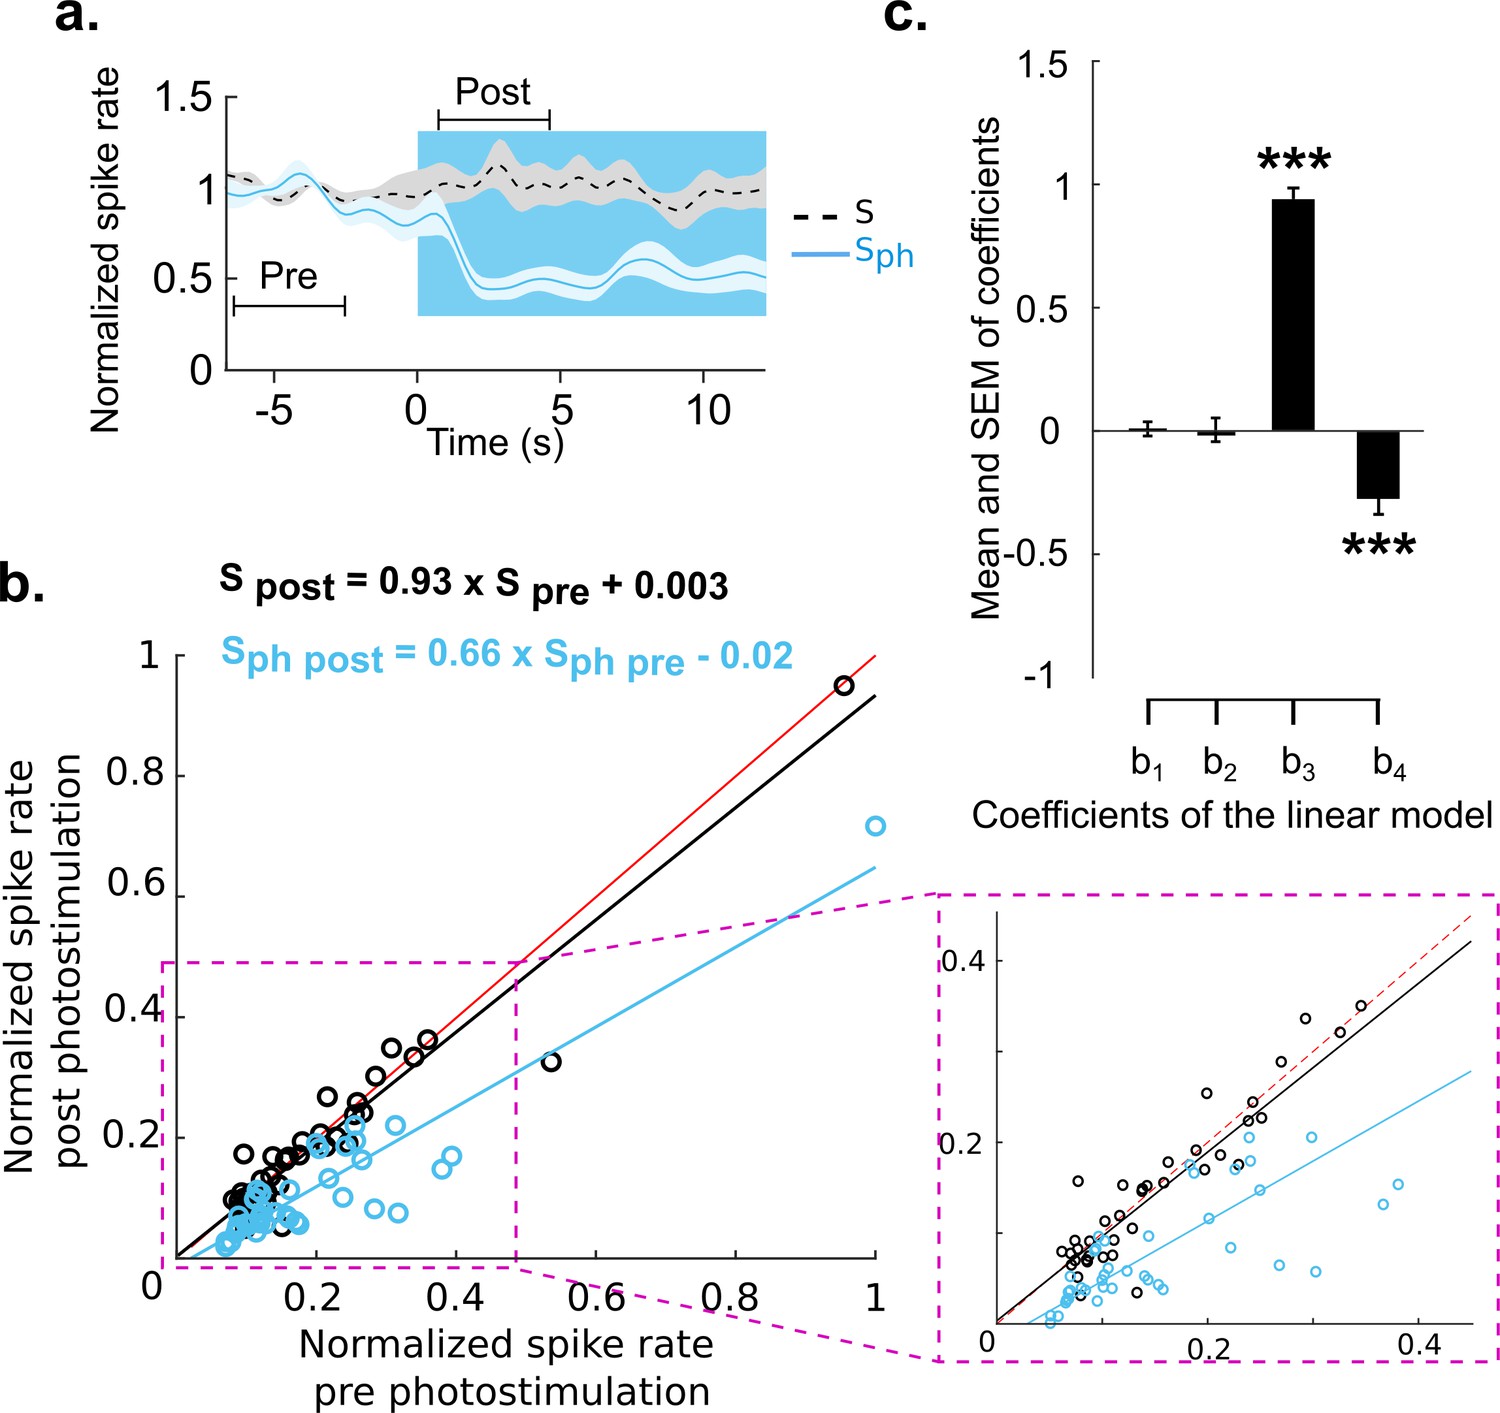
Divisive suppression of spontaneous activity following photostimulation of the DRN.
(a) Average of spontaneous activity across MUA recordings (41, MUA with pre photostimulation firing rates between 1 and 20 Hz). Pre- and post-photostimulation time windows used for analysis are marked (the length of each window is 4 s). Both traces are normalized to pre-stimulus firing rate, for details see Materials and methods. (b) Comparison between the mean of Sph pre and Sph post photostimulation for each unit (light blue circles) and the same comparison for S (black circles); data points normalized over all units. Solid lines represent the linear regression for Sph (blue) and S (black) and red lines show x=y. Equations of the regressor lines are shown with corresponding colors. The boxed region is a zoom in of the outlined area shown in left panel. (c) Bars show the regression coefficients (mean ± SEM); ***p<0.001, one-sample t test.
Figure 5 with 3 supplements

Increased serotonergic input suppresses the gain of evoked responses.
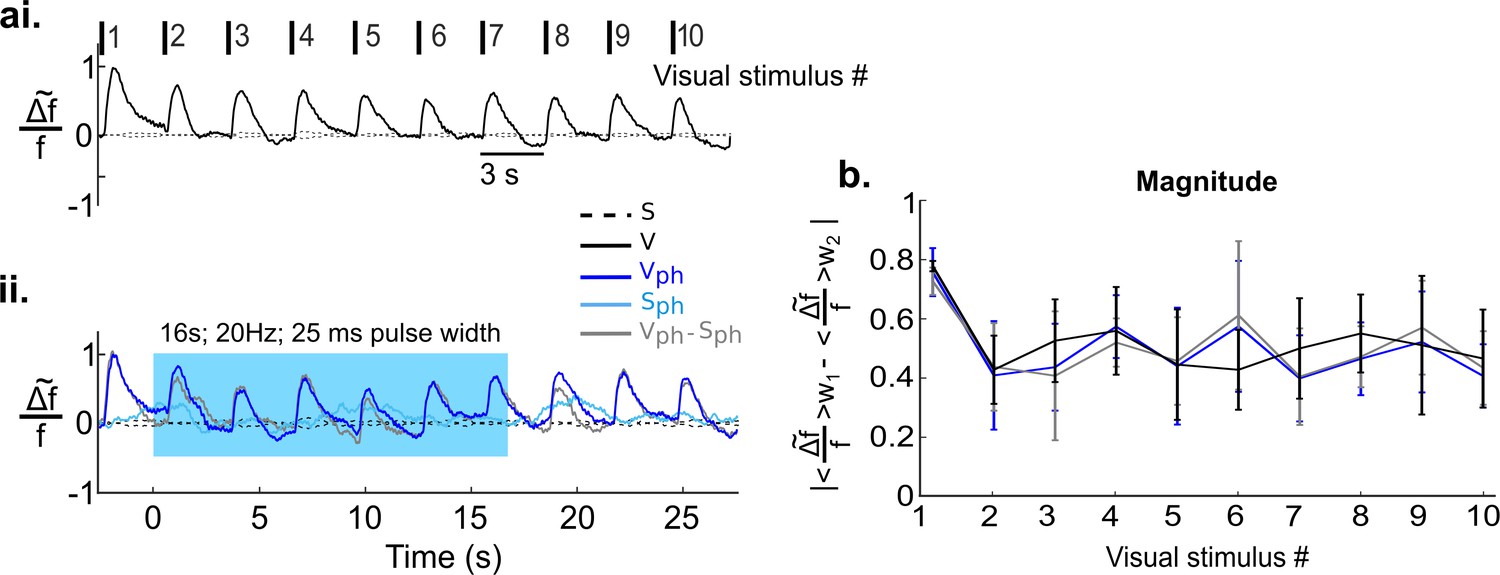
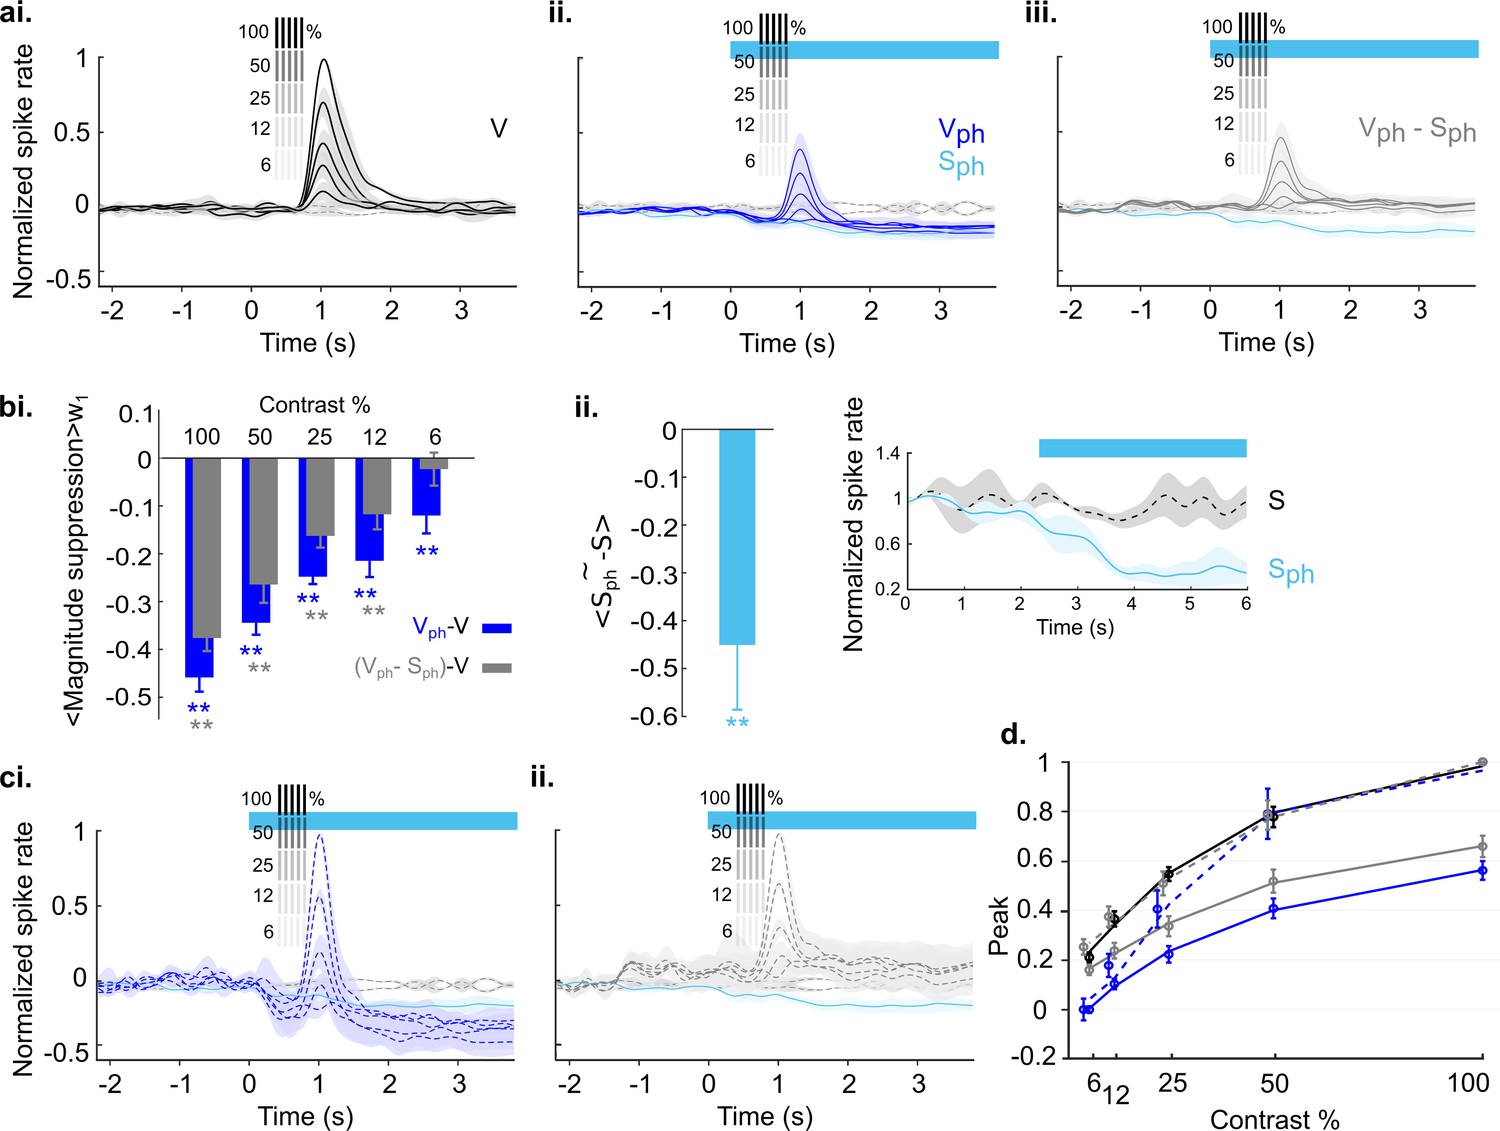
(ai) Visually evoked responses in the control condition (V). Traces show spatial averages across the center of activity in V1 (see black circle in Figure 2b, second row) after repetitive visual stimulation (onsets and numbering at top; n=8 animals, each experiment comprises 25–50 trials). Traces are normalized to the maximum of the first visual response. Inset: w1 refers to 400 ms time window around peak value and w2 marks 200 ms time window before the onset of each visual stimulus. Stippled black lines show spontaneous activity without visual input and without photostimulation. (aii) Visually evoked response with concurrent DRN photostimulation (Vph, blue trace) and evoked component (i.e. after subtraction of spontaneous activity (Sph) from Vph, gray trace). (bi) Amplitude values: average of activity in w1 for each visual stimulus. (bii) Baseline values: average of activity over w2 for each visual stimulus. Light blue curve shows the same calculation for Sph shown in Figure 3ai. (biii) Magnitude values: absolute difference between baseline values bii and amplitude values bi for each visual stimulus. (ci) Summary of amplitude differences between photostimulated conditions (Vph [blue] and Vph-Sph [gray]) and control condition (V), see legend. Bars show the average of amplitude difference during the time of photostimulation (stimulus interval #2–7, shown in bi). Ca2+ imaging: left blue and gray bars, mean ± SEM, n=8 animals. Extracellular recordings: right blue and gray bars, mean ± SEM, n=9 animals, 104 MUA. (cii) Same as ci for magnitude values shown in biii. All the traces depict mean values across animals, shaded areas (in ai and aii) as well as error bars (in bi-biii) represent SEM. Color legend in ai applies to all panels. ***p<0.001, **p<0.01, and *p<0.05, paired t test with permutation correction for multiple comparisons (bi-biii) and one-sample and paired t test (ci and cii). For sham control see Figure 5—figure supplement 3.
Figure 5—figure supplement 1
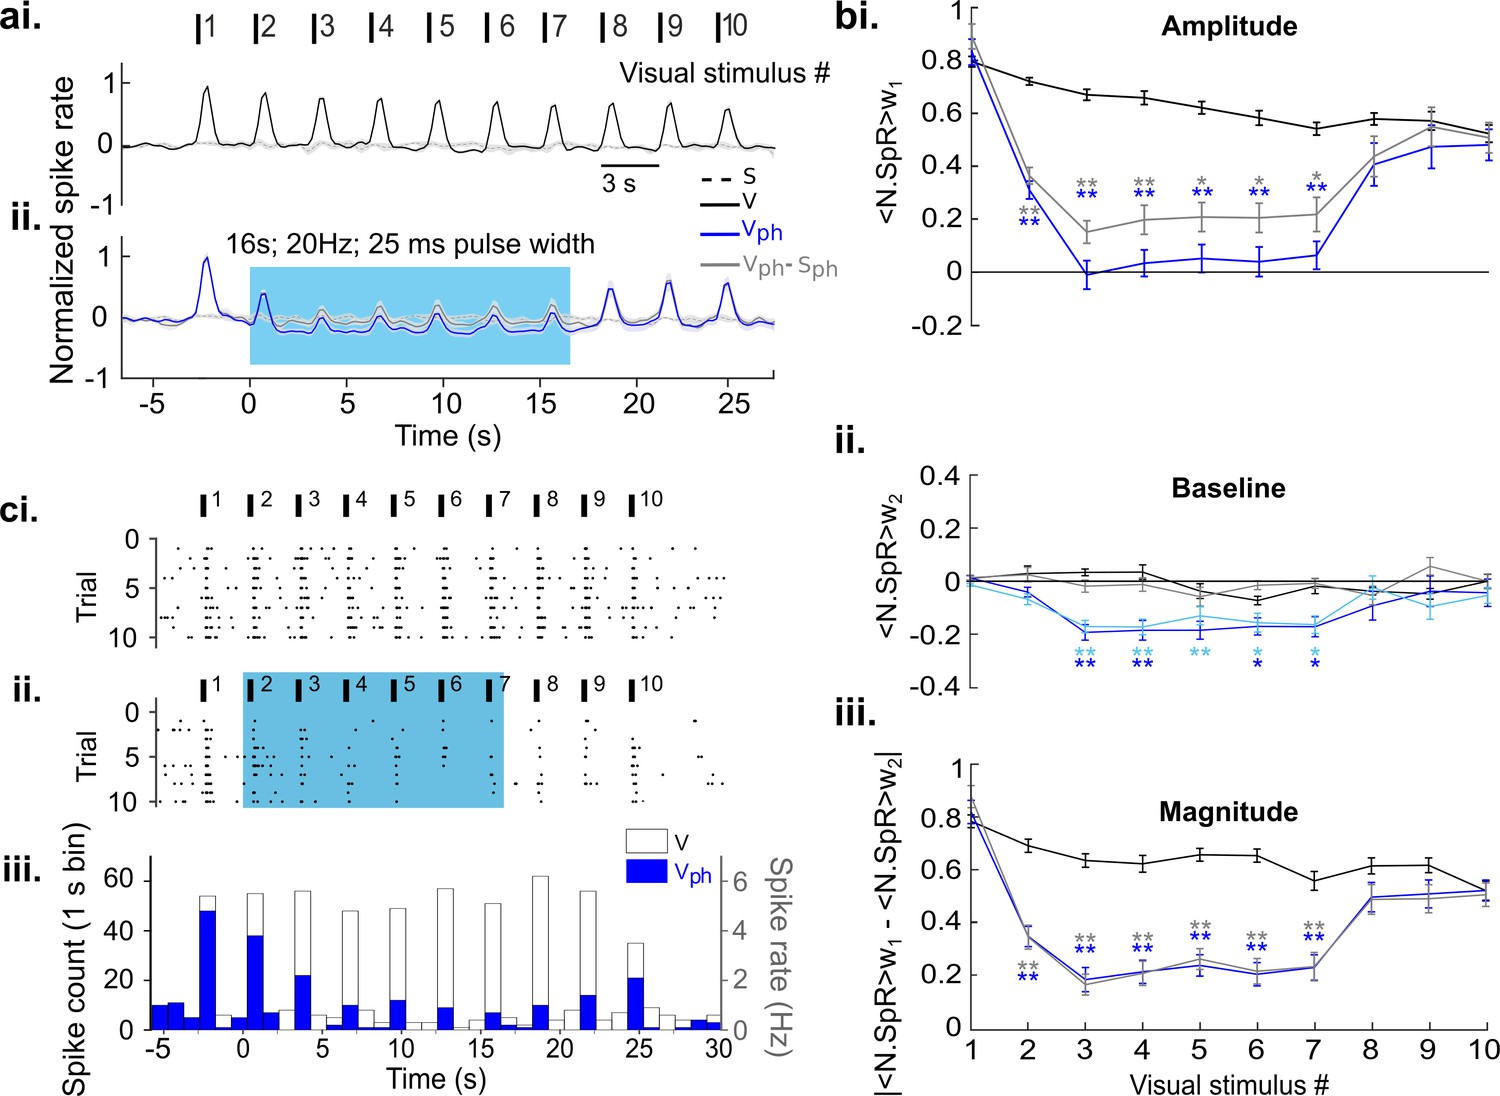
Extracellular recordings confirm suppressive effects observed with Ca2+ imaging.
Identical paradigms, calculations, and color codes as used in Figure 5. Same database as in Figure 3b. (ai) Control condition (V). (aii) Same as ai with concurrent DRN photostimulation (Vph, blue). Evoked component (Vph-Sph,) is shown as gray trace. (bi) Amplitude values (N.SpR = Normalized Spike Rate). (bii) Baseline values. The close overlap of both dark and light blue traces indicates that baseline suppression of the evoked response (Vph, dark blue) is largely explained by suppression of spontaneous activity (Sph, light blue). Note that the traces are normalized to maximum activity in response to visual stimulation, including large changes in evoked firing rates from baseline. Therefore, the relative scale of suppression in the spontaneous component appears less prominent as when normalizing to pre photostimulation level (Figure 3). The averaging window for baseline calculation (w2) is 1 s to include more samples (bin size 200 ms). (biii) Magnitude values. (ci), Raster plot of MUA of an example recording across 10 trials for the control condition. Vertical bars on top depict the timing of visual stimulation. (cii) Same as ci, with photostimulation of the DRN. (ciii) Histograms for the raster plots depicted above for each condition (see legend). **p<0.01 and *p<0.05, paired t test with permutation correction for multiple comparisons.
Figure 5—figure supplement 2
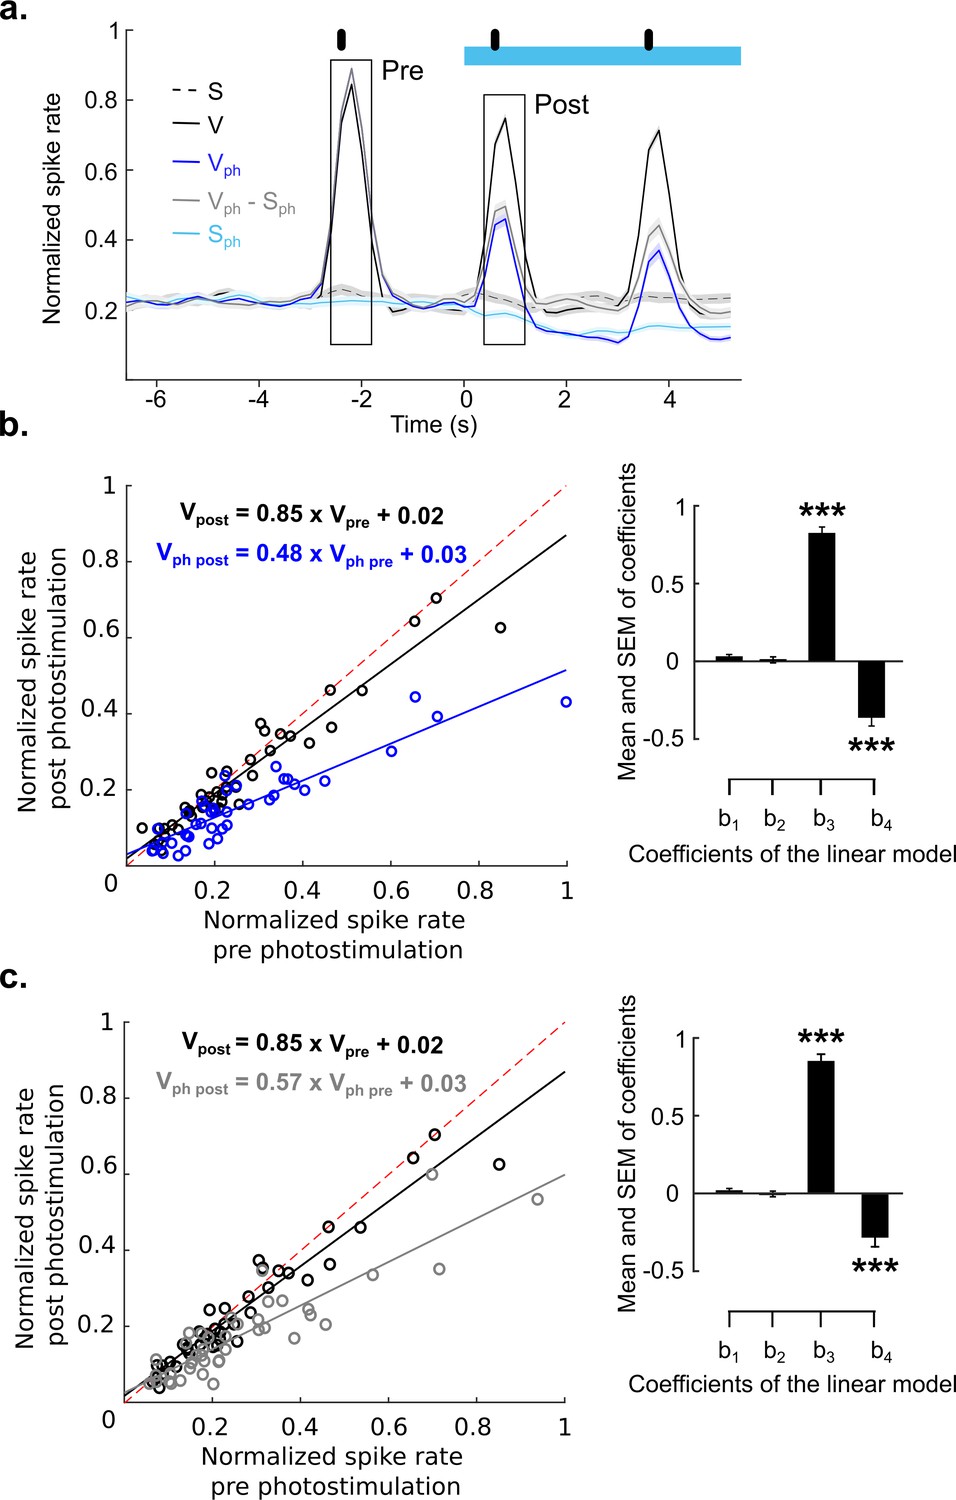
Divisive suppression of evoked activity following photostimulation of the DRN.
(a) Identical paradigms and color codes as used in Figure 5. Traces show normalized activity across recordings of 41 MUAs (same database as in Figure 4). The black rectangles, mark pre- and post-photostimulation averaging time windows, each lasting 400 ms. (b) Left: Comparison between the mean of visually evoked activity in the pre- and post-averaging windows for each unit (Vph, dark blue circles); data points are normalized over all units. Black circles depict the same comparison for the control condition (V, i.e., visual stimulation without photostimulation). Solid lines represent the linear regression for V and Vph, coloring of equations refers to conditions. (b) Right: Mean of regression coefficients (± SEM). (c) Same as b for evoked component (Vph-Sph). ***p<0.001, one- sample t test.
Figure 5—figure supplement 3
Photostimulation of control ePet-Cre mice injected with NaCl solution does not affect visually evoked and spontaneous activity.
Traces show mean responses of 4 ePet-Cre mice injected with saline solution (see Materials and methods). Same paradigms and analysis as depicted in Figure 5a and b was used. (ai) Visually evoked responses. (aii) The same as ai with concurrent DRN photostimulation (Vph, dark blue trace). Evoked component (gray trace), i.e. after subtraction of spontaneous activity (Sph, light blue trace) from Vph. (b) Magnitude values (see main text).
Figure 6

Independent and distinct suppressive effects of 5-HT2A and 5-HT1A receptors on activity in the visual cortex.
(ai) Visual cortical response after DRN photostimulation and additional blocking of 5-HT2A receptors via microiontophoresis of MDL (magenta horizontal bar shows timing of MDL administration, 18 s; mean ± SEM, n=6 animals). Vph and Sph depicted as dark and light blue traces, respectively. (aii) Control visual response (V) and evoked component (Vph-Sph). (bi-ii) Quantification of the traces shown in ai and aii, values were derived as described in Figure 5bii (baseline) and Figure 5biii (magnitude). (ci-ii) Same as ai and aii with blocking of 5-HT1A receptors via microiontophoresis of WAY (green horizontal bar shows timing of WAY administration, 18 s; mean ± SEM, n=4 animals). (di-ii) Same analysis as applied in bi and bii for the traces shown in ci and cii. **p<0.01 and *p<0.05, paired t test with permutation correction for multiple comparisons.
Figure 7
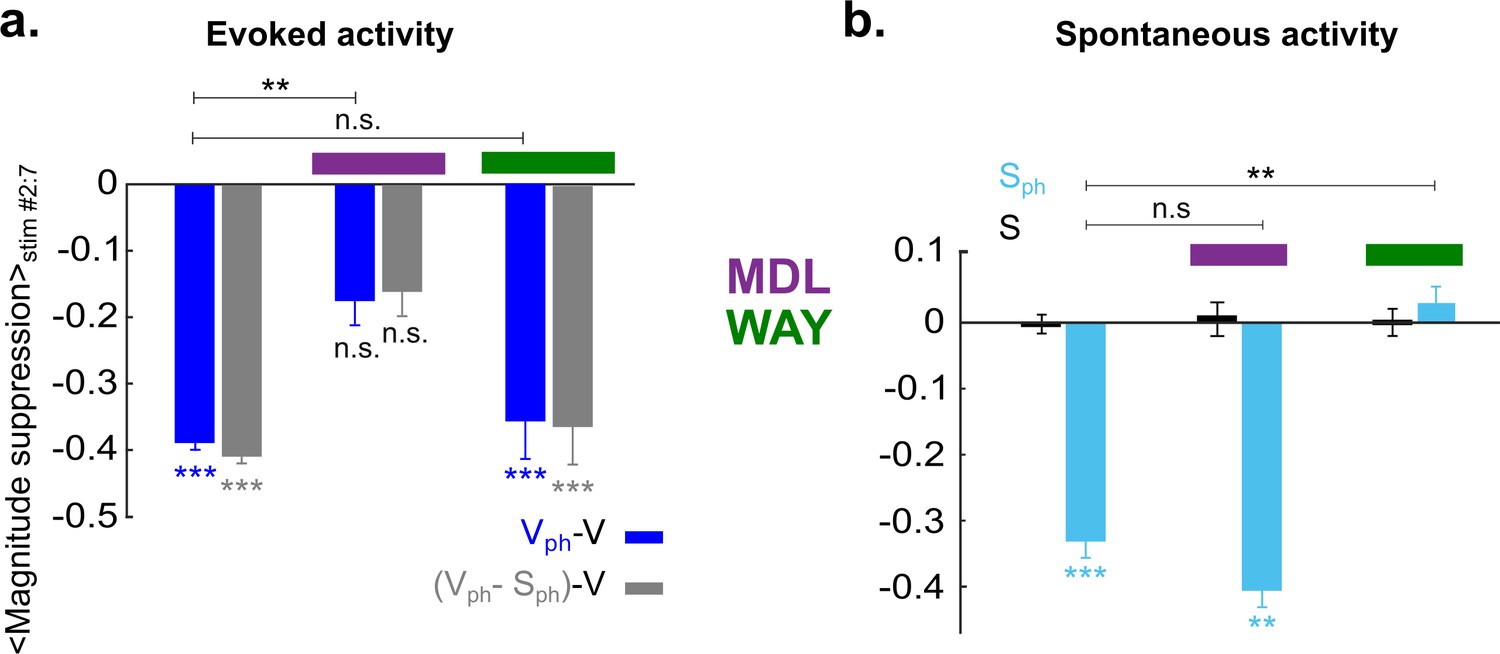
5-HT2A and 5-HT1A receptors act independently on suppression of evoked and spontaneous components, respectively.
(a) Summary of magnitude differences between photostimulated conditions (Vph [blue] and Vph-Sph [gray]) and control condition (V). Bars show magnitude difference during the time of photostimulation (shown in Figure 5biii, stimulus interval #2–7). The two bars at left depict values obtained without 5-HT receptor antagonists, bars at right with use of antagonists. (b) Comparison of spontaneous activity with (blue) and without (black) photostimulation. Spontaneous activity is averaged over the time window shown by the red rectangle (wred) in Figure 3ai. First two bars at left depict spontaneous activity without application of 5-HT antagonists. Experiments with application of MDL and WAY are marked with magenta and green bars, respectively. ***p<0.001 and **p<0.01, one-sample t test and two-sample t test for comparison between groups.
Figure 8 with 2 supplements
Effects of serotonergic modulation response normalization.
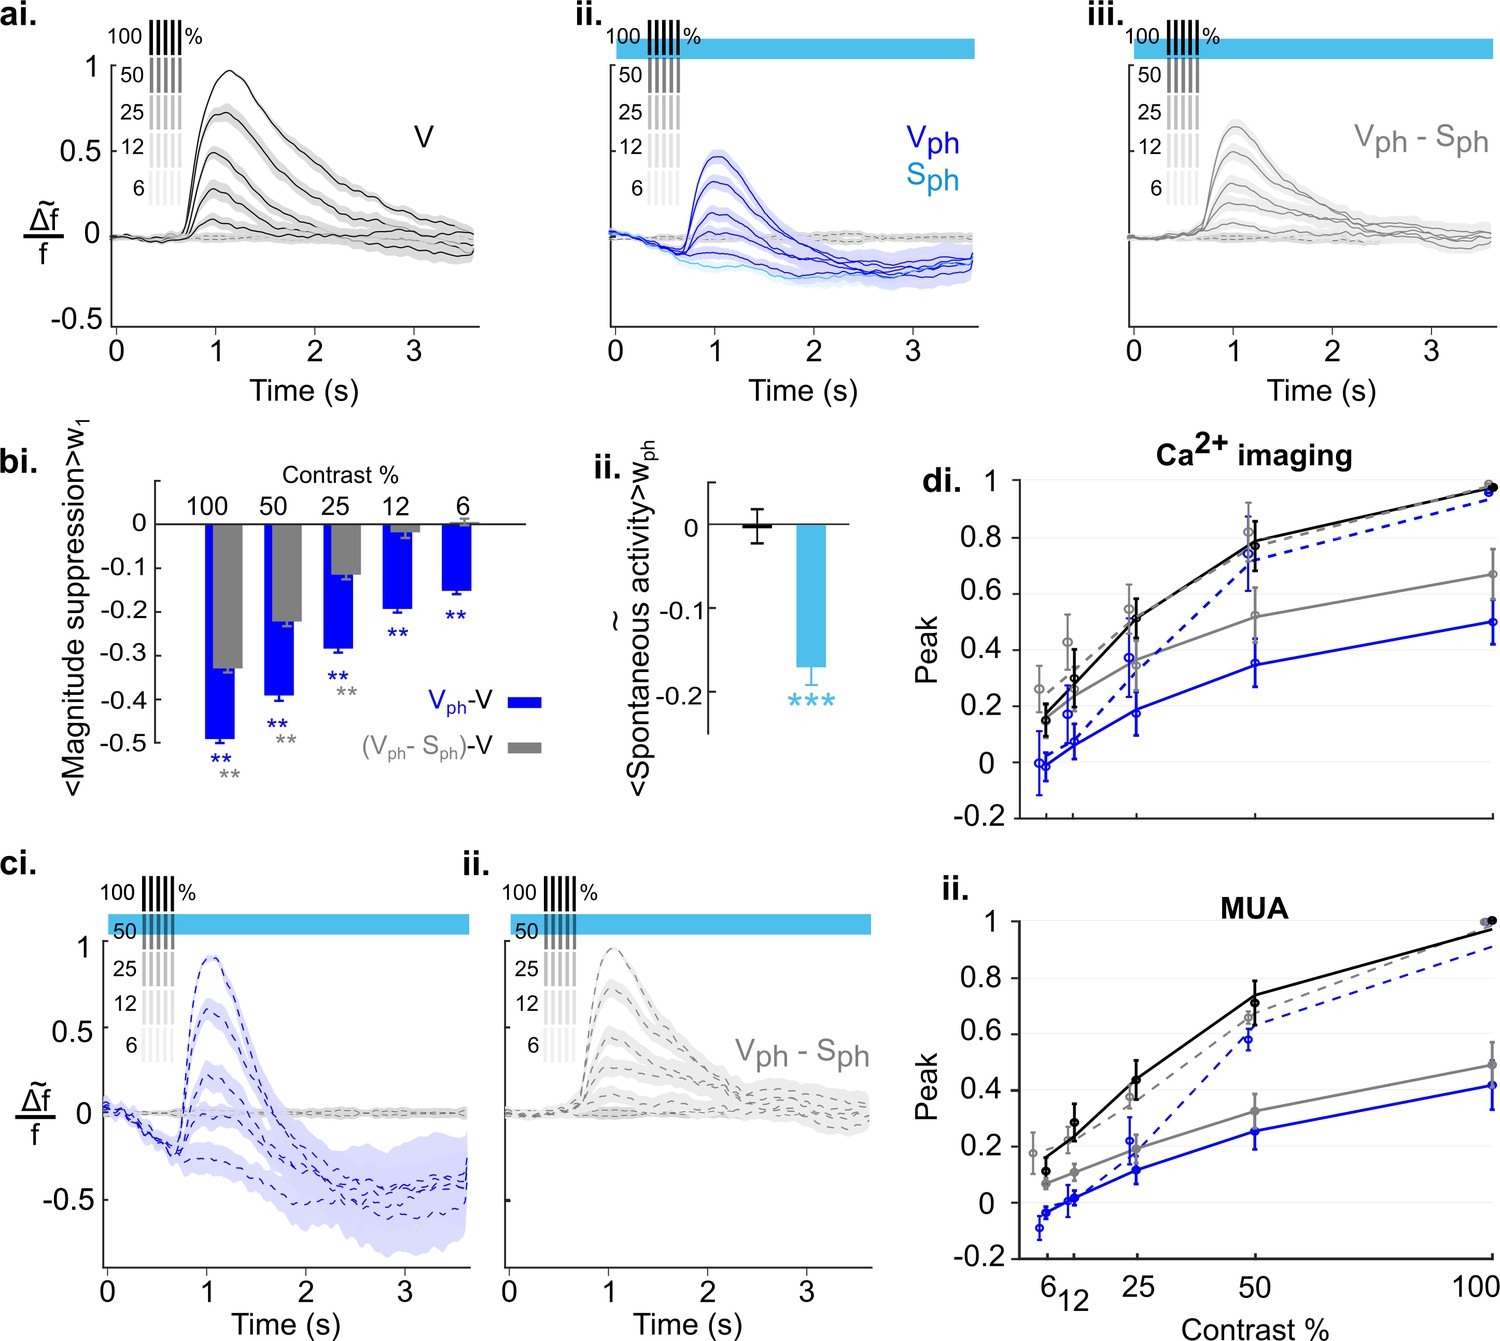
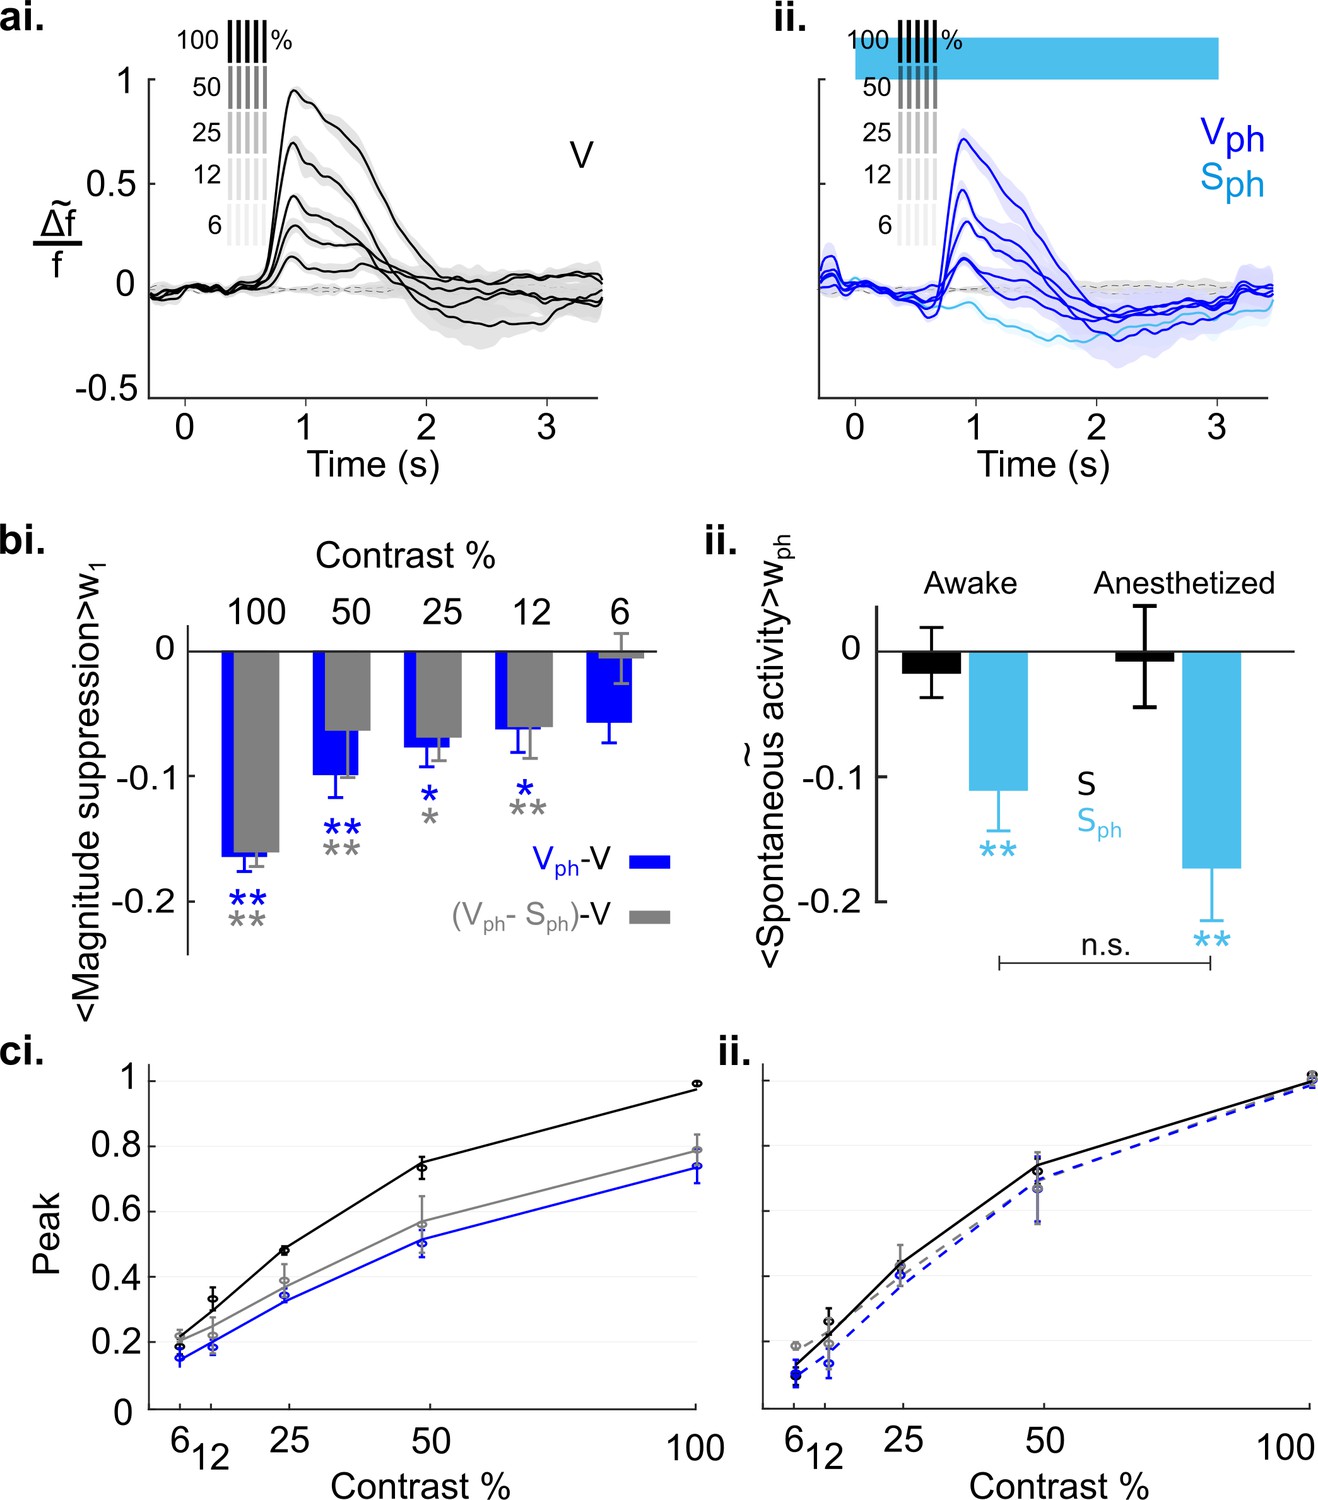
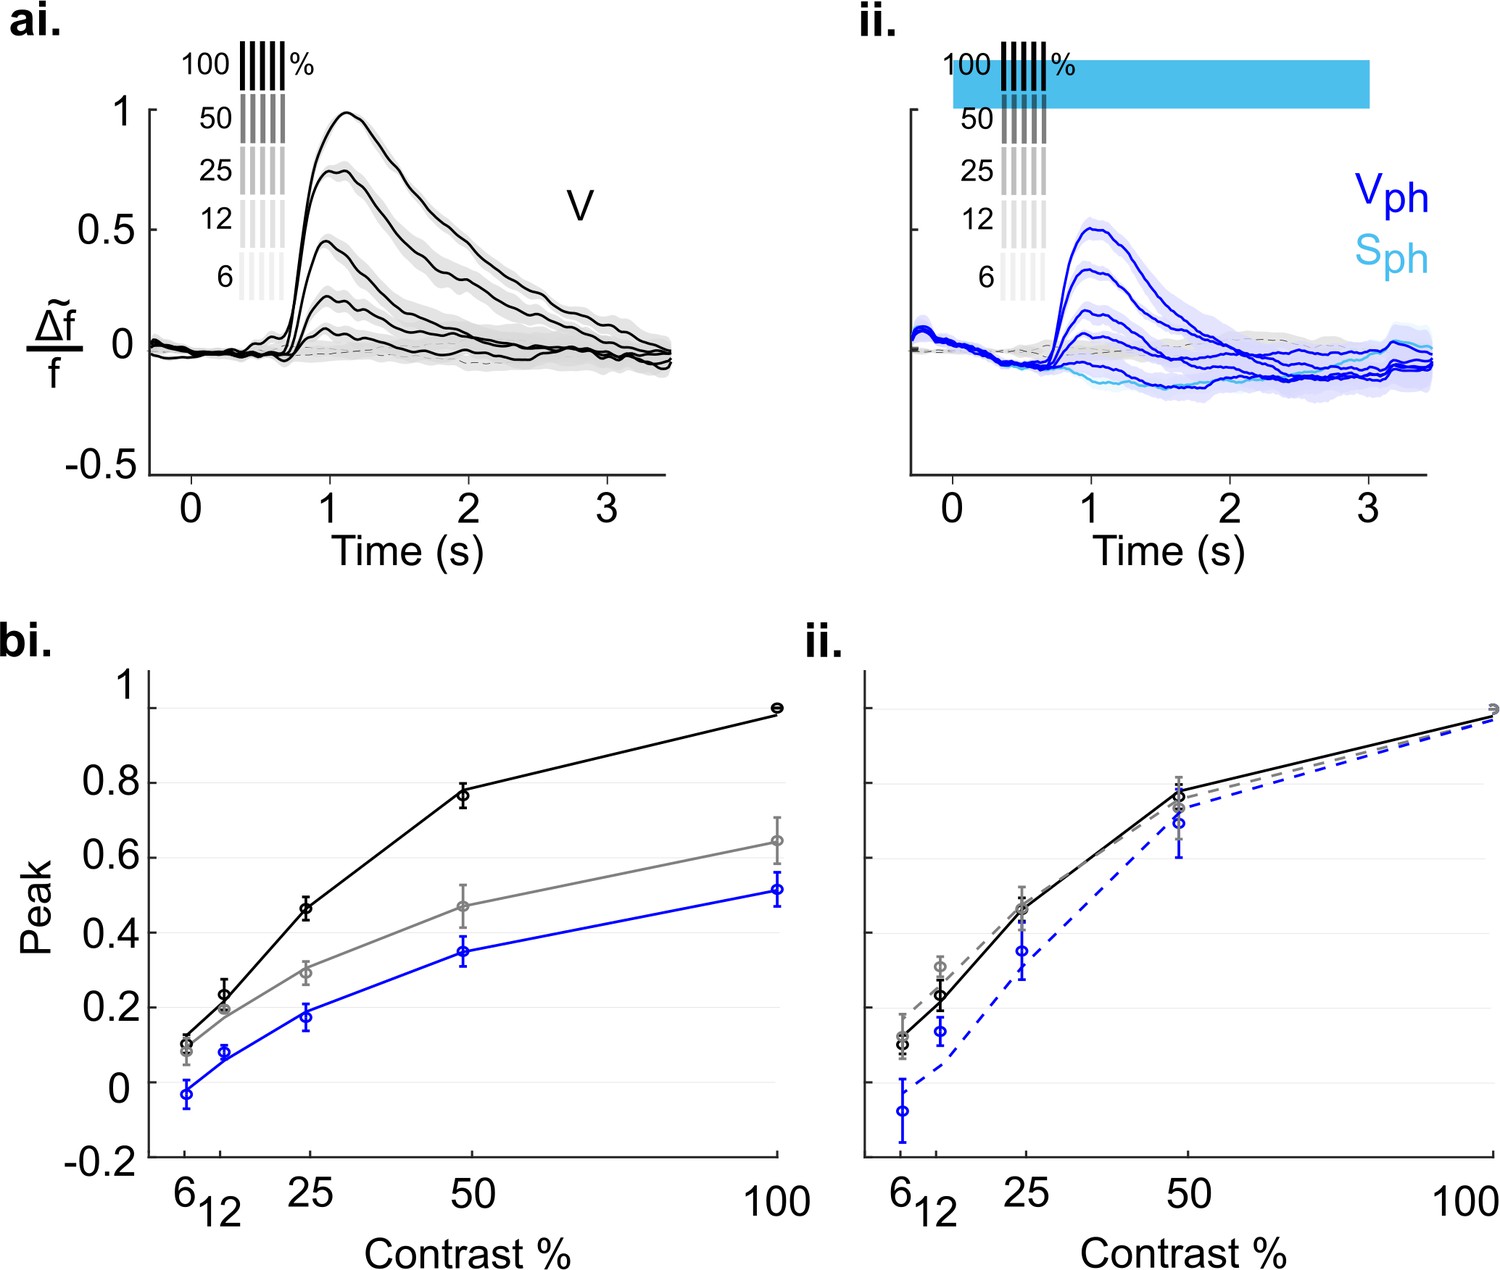
(ai) Control conditions (V): visually evoked response to stimulation with gratings of different contrast. Values are scaled to the maximum amplitude at 100% contrast (n=18 animals). Grating icons identify the timing of visual stimulation and its corresponding contrast. Black dashed lines show activity devoid of photostimulation and visual input. (aii) Same as ai with concurrent DRN photostimulation. Dark blue trace depicts visually evoked response (Vph), light blue trace is for spontaneous activity (Sph). (aiii) Evoked component (Vph-Sph) of the traces shown in aii. (bi) Magnitude differences between photostimulated conditions (Vph [blue] and Vph-Sph [gray]) and control condition (V) for each grating contrast. (bii) Average of spontaneous activity (S, black) and Sph (light blue) over the entire time window of photostimulation (wph). (ci) Scaling the traces in aii to the maximum of the trace at 100% contrast. (cii) Same as ci for the evoked component as shown in aiii. (di) Solid lines: Peak values of traces shown in ai-aiii fitted to the Naka-Rushton function (see Methods). Stippled lines: Fit of the peak values of the normalized traces shown in ci and cii to the Naka-Rushton function. (dii) Contrast tuning obtained from extracellular recordings (3 animals, 108 MUA). Similar to di, the peak values of traces for each contrast and condition are fitted to Naka-Rushton function (all traces are shown in Figure 8—figure supplement 2ai—aiii, ci and cii). **p<0.01 and ***p<0.001, one-sample t test.
Figure 8—figure supplement 1
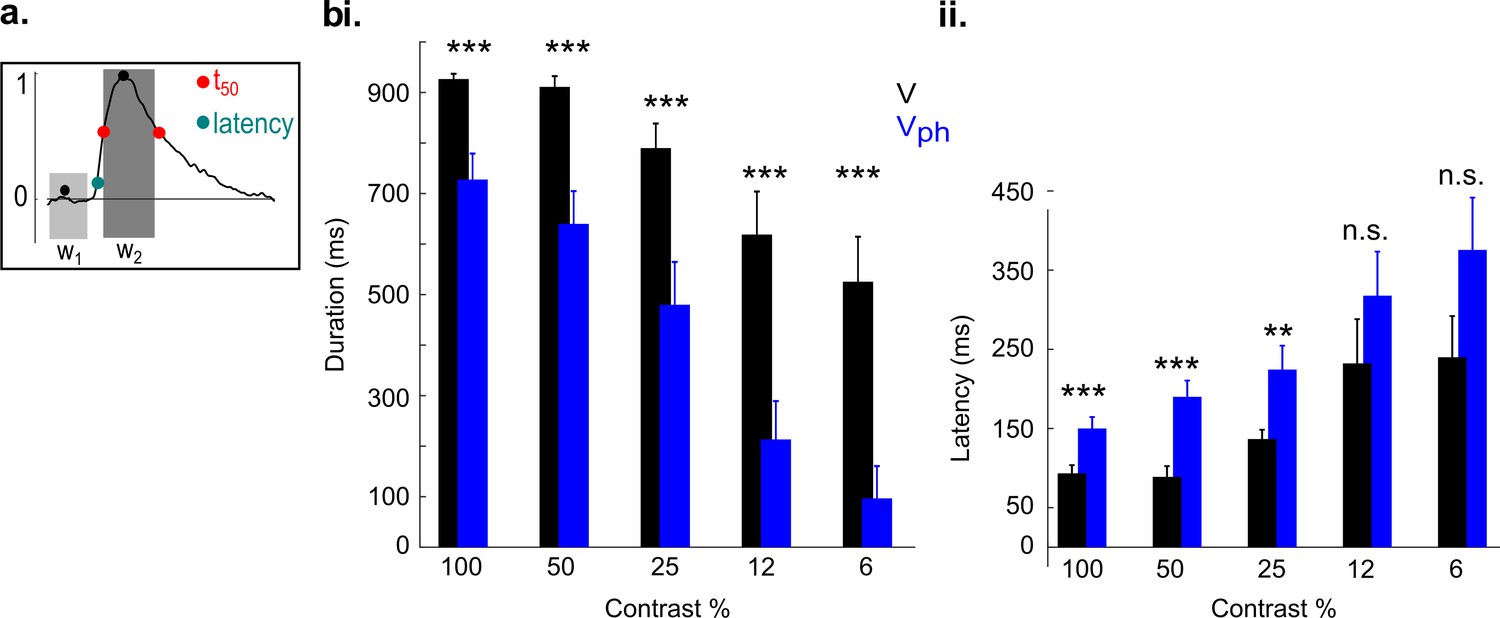
Influence of serotonergic input on latency and duration of evoked responses.
(a) Schematic of the calculation used to determine latency and duration (for details see Materials and methods, Data analysis). (bi) Response duration as a function of contrast. (bii) Latency as a function of contrast. Black: Controls. Blue: Evoked responses during photostimulation (mean ± SEM, n=18 animals). ***p<0.001 and **p<0.01, two-sample t test.
Figure 8—figure supplement 2
MUA revealed the same signatures of 5-HT-induced response normalization as RCaMP imaging.
Identical paradigms, calculations, and color codes as used in Figure 8. (ai) Control conditions (V). (aii) same as ai with concurrent photostimulation of DRN. (aiii) Evoked component of traces in aii (Vph-Sph). (bi) Magnitude differences between photostimulated conditions (Vph [blue] and Vph-Sph [gray]) and control condition (V) for each grating contrast. (bii) Difference of Sph and S over the entire time of photostimulation (wph). Traces of S and Sph are shown at right side. (ci) Scaling the traces in aii to the maximum of the trace at 100% contrast. (cii) Scaling the traces in aiii. to the maximum of the trace at 100% contrast. (d) Similar to Figure 8dii, here using data that include MUA with average spontaneous firing rate in the pre photostimulation window above 1 Hz (n=3 animals, 41 units) to account for possible floor effects. **p<0.01, one-sample t test.
Figure 9 with 2 supplements
Serotonergic normalization effects in the awake state.
Same conventions as in Figure 8: (a) Visually evoked responses (ai) Control conditions (V). (aii) same as ai with concurrent photostimulation of the DRN (Vph, dark blue). Light blue trace shows spontaneous activity during photostimulation (Sph). (bi) Magnitude differences between photostimulated conditions (Vph [blue] and Vph-Sph [gray]) and control condition (V) for each grating contrast. (bii) Average of spontaneous activity (S, black) and spontaneous activity with photostimulation (Sph, light blue) in awake and anesthetized state. Values are averaged across the time window of photostimulation (wph). **p<0.01, and *p<0.05, one-sample t test. (ci) Peak values of traces shown in ai and aii fitted to the Naka-Rushton function. Line colors correspond to colors of traces in ai and aii, gray depicts peak values and fit of the evoked component (traces not shown). (cii) Same as ci with normalized peak values. All data summarize recordings in five awake mice. Traces of matched animals in the anesthetized state are shown in Figure 9—figure supplement 1. For differences in the contribution of evoked and baseline components in normalization see Figure 9—figure supplement 2.
Figure 9—figure supplement 1
Recordings of the same mice shown in Figure 9, here under anesthesia (n=5 animals).
Same conventions as in Figure 9. (a) Visually evoked responses. (b) Peak values fitted to the Naka-Rushton function: in (bi) for the traces shown in a (gray curve depicts evoked component, data not shown) and in (bii) for normalized values (traces are not shown). Note that 5-HT-induced contrast normalization is almost identical to the group of anesthetized animals (18) that were measured in a separate row of experiments (Figure 8), indicating high reproducibility of the obtained results.
Figure 9—figure supplement 2
Weights of evoked and baseline components in normalization depend on cortical state.
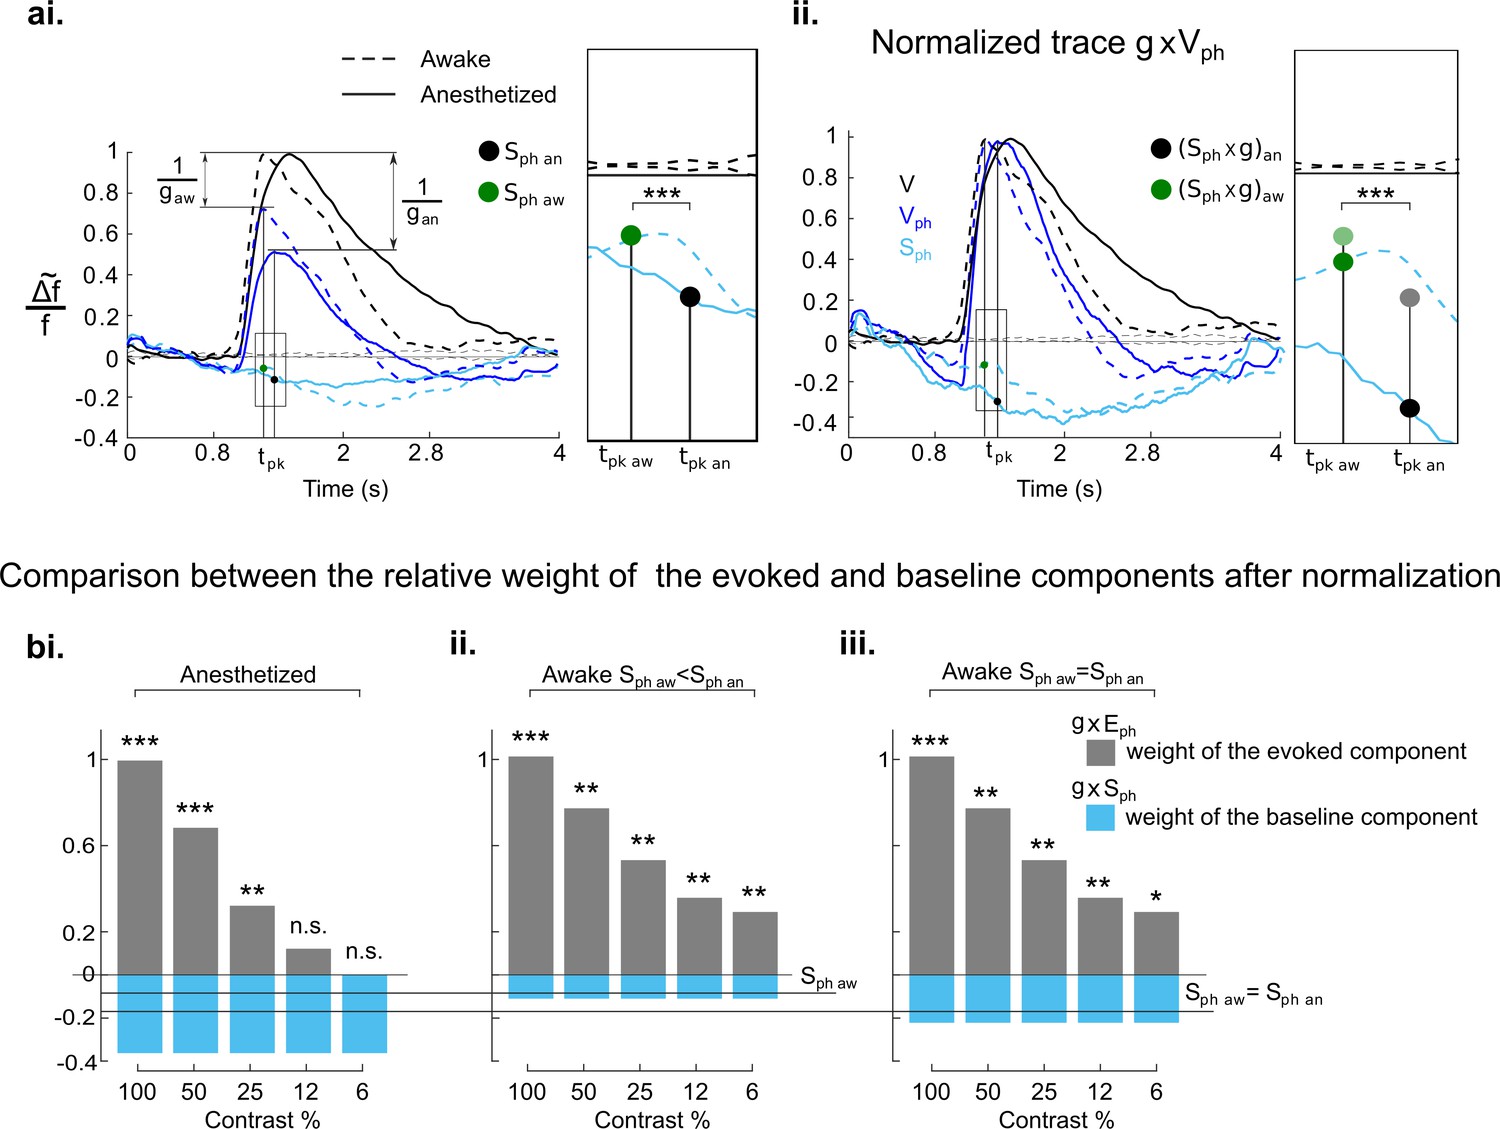
(ai) Evoked visual responses to gratings (100% contrast) in anesthetized (solid traces) and awake mice (stippled traces). Control condition (V, black), condition with concurrent photostimulation of the DRN (Vph, dark blue). Light blue traces depict spontaneous activity with photostimulation (Sph), dotted black traces around zero show baselines without any input. Green and black circles mark the amount of Sph at time to peak (tpk), i.e. the time where Vph reaches maximum values (green = awake (aw): -0.09±0.03, n=5, p<0.01, one-sample t test); black = anesthetized (an): -0.17±0.03, n=18, p<0.001, one-sample t test); g refers to the 5-HT-induced gain (i.e. the inverse of c, ); gaw<gan with gaw : 1.35±0.2, n=5 and gan : 2.20±0.7 n=18, p<0.01, two-sample t test. Rectangle at right is a magnified view of the area marked in left panel. (aii) Traces shown in ai, normalized by the ratio equal to their corresponding g . Magnified view at right demonstrates the resulting relative change of Sph values after normalization. Note the difference between the awake and the anesthetized state: transparent dots (copied from ai) are values before normalization and solid dots values after normalization. (bi), Relative weights of evoked component (gray bars) at each grating contrast in comparison to the weight of the baseline component (blue bars) in the anesthetized state after normalization (Equation 4 in main text). (bii) Same as bi in the awake state. (biii) same as bii, assuming (i.e. simulating) the amount of Sph in the awake state (Sph aw) being equal to the value of Sph in the anesthetized state (Sph an=-0.17). Note that also in this case, the weight of the spontaneous component in the awake state (g×Sph)aw remains significantly smaller (-0.22±0.03, n=5, blue bars in biii) than the spontaneous component (g×Sph)an in the anesthetized state (-0.36±0.11, n=18, blue bars in bi), p<0.001 two-sample t test. ***p<0.001, **p<0.01, and *p<0.05, one-sample and two-sample t test.
Tables
Key resources table
| Reagent type (species) or resource | Designation | Source or reference | Identifiers | Additional information |
|---|---|---|---|---|
| Genetic reagent (Mus musculus) | ePet-Cre (B6.Cg-Tg(Fev-cre)1Esd/J) | Scott et al., 2005 Jackson laboratory | JAX: 012712 | Breeded by the group of Dr. Stefan Herlitze and Dr. Melanie D. Mark (Ruhr University Bochum) |
| Recombinant DNA reagent | AAV1.EF1.dflox.hChR2(H134R)-mCherry.WPRE.hGH | Addgene | Addgene number: 20297-AAV1 | AAV virus constructed to express in the Cre-expressing cells. |
| Recombinant DNA reagent | AAV1.syn.jRCaMP1a.WPRE.SV40 | Addgene Akerboom et al., 2013 | Addgene number: 10848-AAV1 | AAV virus constructed to express in both excitatory and inhibitory neurons, due to the Synapsin promoter. |
| Antibody | Mouse anti-TPH (monoclonal) | Sigma-Aldrich | T0678-100ul | 1:200 |
| Antibody | Anti-mouse DyLight 488 (donkey polyclonal) | Abcam | 1:500 | |
| Antibody | Anti-c fos (rabbit polyclonal) | Santa Cruz Biotechnology | Sc-52 | 1:1000 |
| Antibody | Anti-rabbit Alexa 488 (donkey polyclonal) | Life Technology | 1:500 | |
| Chemical compound, drug | 5-HT2A receptor antagonist MDL-100907 | Sigma-Aldrich | M3324-5MG | 5-HT2A receptor antagonist, 20 mM in 0.9% NaCl, pH 10 |
| Chemical compound, drug | 5-HT1A receptor antagonist WAY-100135 | Sigma-Aldrich | W1895-5MG | 5-HT1A receptor antagonist, 5 mM in 0.9% NaCl pH 4 |
| Software, algorithm | MATLAB | Mathworks | RRID:SCR_001622 | |
| Software, algorithm | ImageJ | ImageJ (http://imagej.nih.gov/ij/) | RRID:SCR_003070 | |
| Software, algorithm | Inkscape | Inkscape (http://inkscape.org/) | RRID:SCR_014479 | |
| Other | Imager 3001 | Optical Imaging Inc, Mountainside, NY, USA |
Additional files
Download links
A two-part list of links to download the article, or parts of the article, in various formats.
Downloads (link to download the article as PDF)
Open citations (links to open the citations from this article in various online reference manager services)
Cite this article (links to download the citations from this article in formats compatible with various reference manager tools)
Separable gain control of ongoing and evoked activity in the visual cortex by serotonergic input
eLife 9:e53552.
https://doi.org/10.7554/eLife.53552


