Respiratory tissue-associated commensal bacteria offer therapeutic potential against pneumococcal colonization
- Department of Microbiology and Molecular Medicine, Faculty of Medicine, University of Geneva, Switzerland
- Analytical Sciences, School of Pharmaceutical Sciences, University of Geneva, University of Lausanne, Switzerland
- Swiss Centre for Applied Human Toxicology, Switzerland
- Institute for Infectious Disease (IFIK), University of Bern, Switzerland
- Graduate School GCB, University of Bern, Switzerland
- Department of Microbiology, Icahn School of Medicine at Mount Sinai, United States
Figures
Figure 1

Lactobacillaceae isolate from total lung homogenates of mice is identified to be Lactobacillus murinus, a member of altered Scheadler Flora.
(A) Phylogenetic tree of Lactobacillaceae isolate (indicated with red asterisk) to other known members of Lactobacillaceae family (L. murinus ASF361 is indicated with a red octothorpe). The phylogeny presented is based on the alignment of approximately 1400 nucleotides of the 16S rRNA gene. The phylogenetic analyses were generated with the neighbor-joining method. The percentage of replicate trees in which the associated taxa clustered together in the bootstrap test (100 replicates) is shown next to the branches. The trees are not rooted but drawn to scale with branch lengths in the same units as those of the evolutionary distances used to infer the phylogenetic tree. The evolutionary distances were computed using the Kimura 2-parameter method for 16S rRNA gene. The analysis included 17 sequences. Evolutionary analyses were conducted using MEGA6. All sequences are labeled according to strain name, species and accession number.( B) Genome of Lactobacillaceae isolate was aligned to reference genome database. Z-scores are calculated based on Average nucleotide identity. Top five hits are represented on the table. (C) Alignment between genome of Lactobacillaceae isolate and reference L. murinus genome from ASF 361. Genomic location, GC content, GC skew and sequence similarity given from most inner circle to most outer circle, respectively. The GC skew should not be considered since the nucleotide 0, origin of the genome, is not at the correct position due to the lack of closed genome of L. murinus.
Figure 2 with 1 supplement
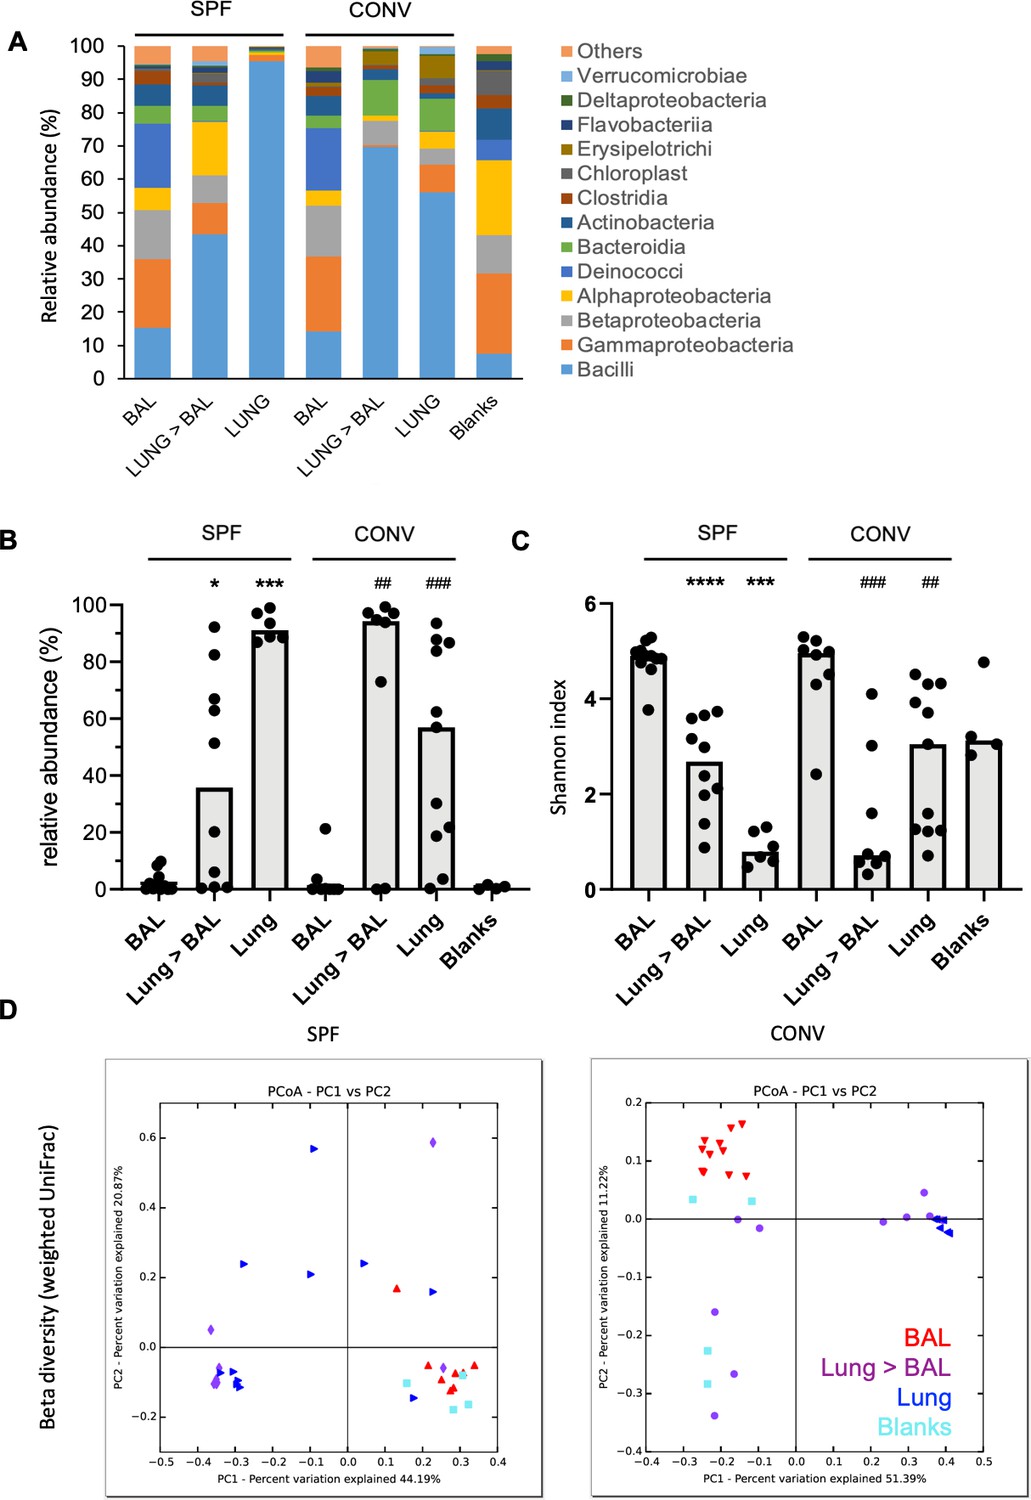
Bacilli class of bacteria is under-represented in bronchoalveloar lavage samples in mice in comparison to total lung homogenates.
BALF, total lung homogenates after BAL procedure (Lung >BAL) or directly sampled total lung homogenates (Lung) of mice housed in specific pathogen-free environment (SPF) or housed conventionally (CONV) were prepped for bacterial 16S rRNA DNA libraries. Samples from mice housed in two different cages from two independent experiments for each group were pooled for analysis (SPF; nBAL: 11, nLUNG>BAL:10, nLUNG:6, CONV; nBAL: 8, nLUNG>BAL:8, nLUNG:11). Empty tubes were processed in parallel (Blank) for evaluation of contamination. (A) Mean relative abundance (%) of different taxonomical classes of bacteria in BAL, Lung >BAL, Lung and Blank samples. Color codes for each bacterial class are given next to the graph. Number of animals used for evaluation is indicated on the graph for each group (n). (B) Relative abundance (%) of Lactobacillus genus in BAL, Lung >BAL, Lung and Blank samples. Each circle represents an individual mouse. Medians of each group are depicted as gray columns. Mann-Whitney test is applied for statistical analysis (*: in comparison to BAL of SPF mice, #: in comparison to BAL of CONV mice). (C) Individual Shannon indices of BAL, Lung >BAL, Lungs, and Blank samples. Each black circle represents an individual mouse. Medians of each group are depicted as columns. Mann-Whitney test is applied for statistical analysis (*: in comparison to BAL of SPF mice, #: in comparison to BAL of CONV mice). (D) 2D PCoA plots (UniFrac, weighted) of BAL (red head-down triangles), Lung >BAL (purple circles), Lungs (blue head-left triangles), and blanks (turquoise squares).
Figure 2—figure supplement 1
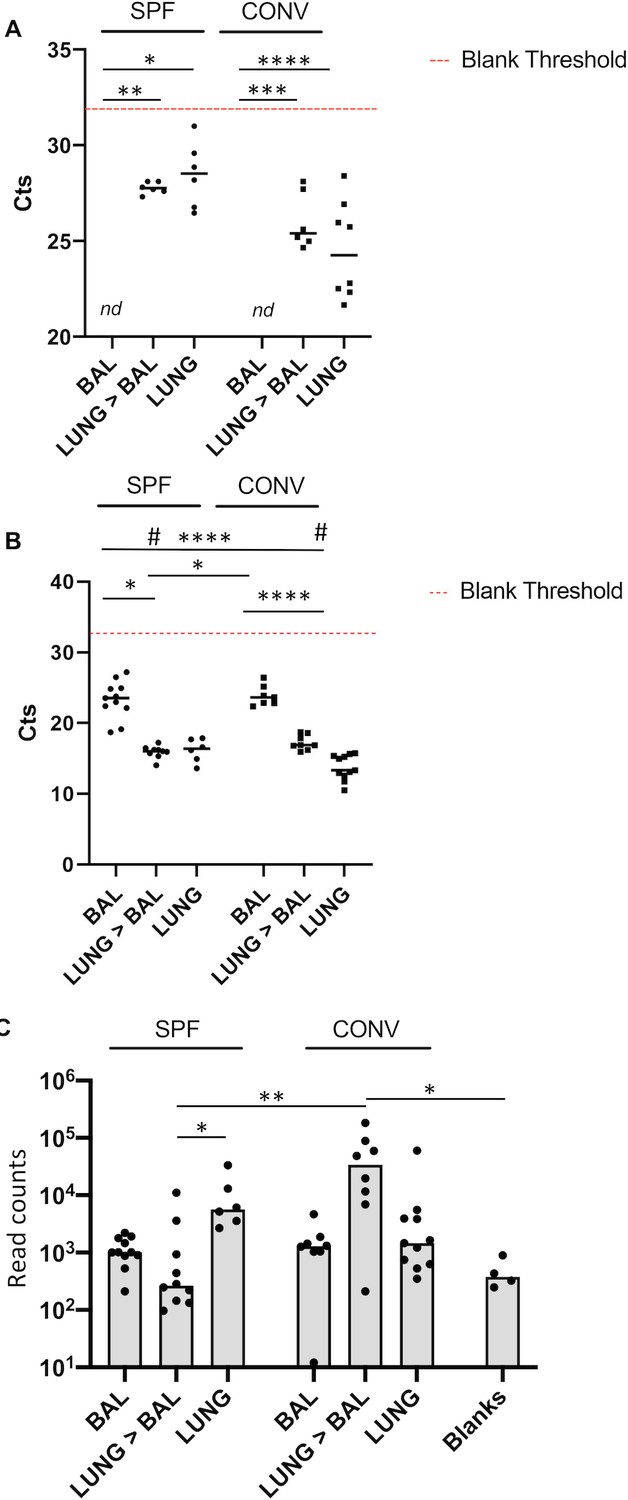
Sensitivity controls for qPCR and 16S rRNA NGS.
(A) 16S rRNA gene-specific qPCR was used to determine load of bacterial DNA in BALF, Lungs after BAL and total lung DNA extracted from SPF and conventionally housed mice (DNA samples from Figure 2A). CT values are depicted for individual animals. The dotted red line indicates the average CT value of blank samples. All BALF samples (SPF (n = 11) and CONV (n = 8)) had Ct values above the blank, 4/10 lungs after BAL (SPF) and 2/8 lungs after BAL samples had Ct values above the blank, 3/11 lungs (CONV) had Ct above the blank. Each dot indicates DNA from an individual mouse. Kruskal–Wallis test was used to determine statistical significance in multiple comparisons with Dunn’s correction, median Ct value are indicated. (B) 18S rRNA gene-specific qPCR was used to determine load of genomic mouse DNA in BALF, Lungs after BAL and total lung DNA extracted from SPF and conventionally housed mice. CT values are depicted for individual animals. Kruskal–Wallis test was used to determine statistical significance in multiple comparisons with Dunn’s correction, median Ct value are indicated and median Ct value are indicated. (C) Graphical representation of the reads counts obtained from samples presented in Figure 2A. Each dot indicates DNA from an individual mouse. Kruskal–Wallis test was used to determine statistical significance. Median read counts are indicated.
Figure 3 with 1 supplement
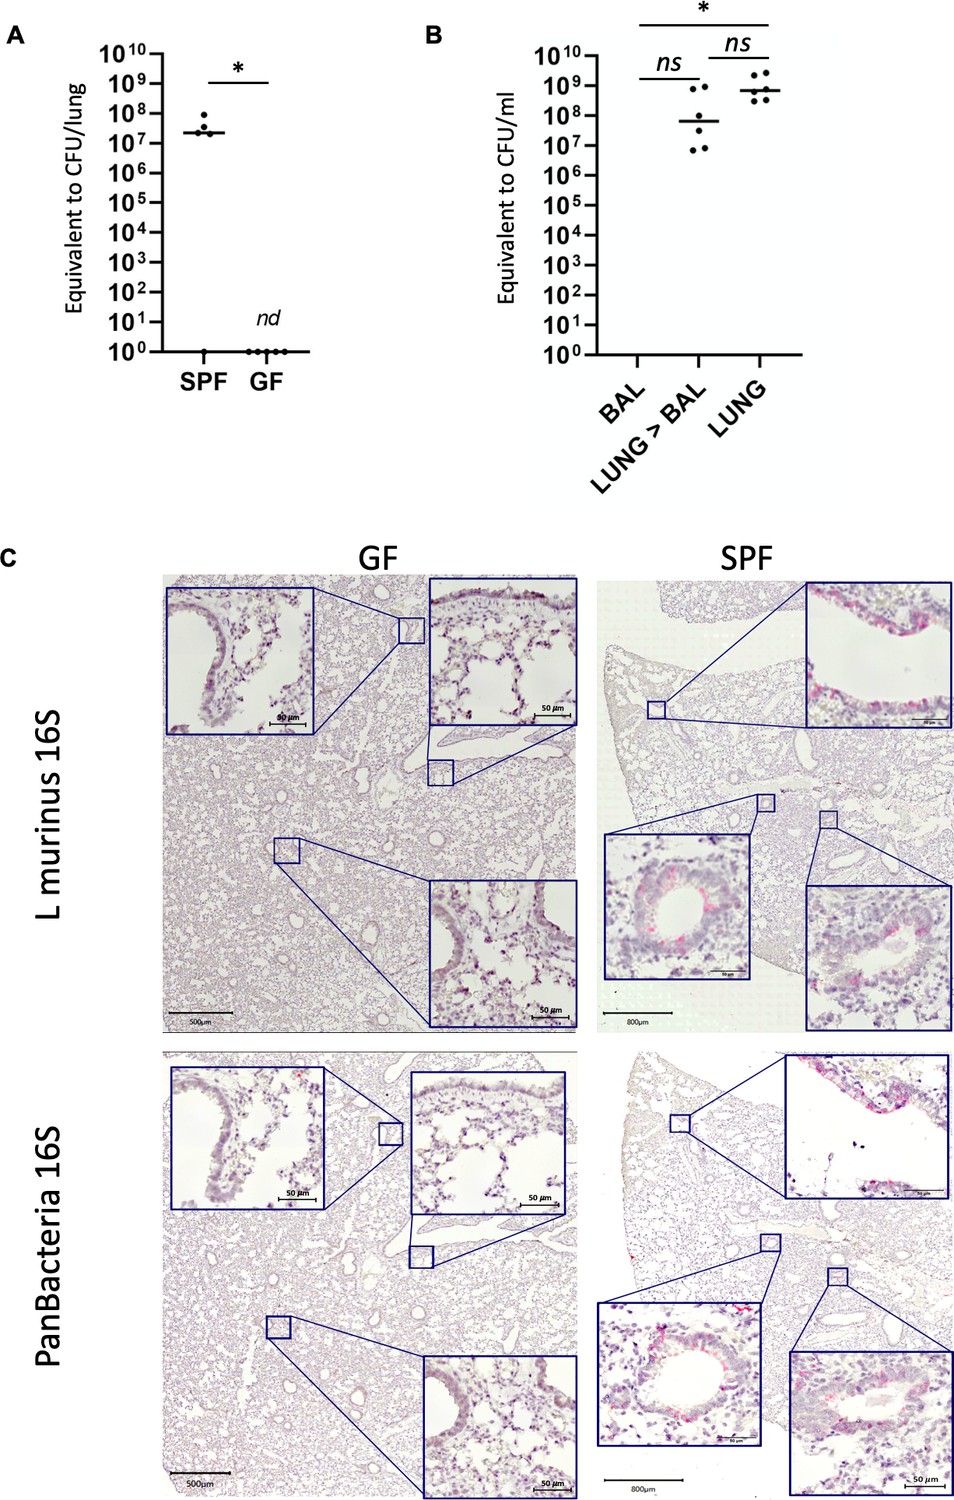
L. murinus is tightly associated with the respiratory tissue.
(A) L. murinus-specific qPCR was used to determine genome copies of L. murinus in total lung DNA extracted from SPF mice (n = 5) or germ-free (GF) mice (n = 5). CT values were compared to standard of L. murinus genomes (see Figure 3—figure supplement 3 and 1a). 1/5 SPF mice and all GF mice revealed no specific amplicon (see also Figure 3—figure supplement 3 and 1b). Median value is indicated, each dot represents an individual mouse. (B) L. murinus-specific qPCR was used to determine genome copies of L. murinus in BALF (n = 11), Lungs after BAL (n = 10) and total lung (n = 6) DNA extracted from SPF mice. CT values were compared to standard of L. murinus genomes, median values are indicated (see Figure 3—figure supplement 3 and 1a). Kruskal–Wallis test was used to determine statistical significance in multiple comparisons with Dunn’s correction. (C) Tissue distribution of L. murinus (upper panels) or total bacteria (lower panels) was determined in consecutive tissue slides of SPF mouse lungs (left panels) or GF mouse lungs (right panels). Bacterial colonization is indicated by a bright red/pink staining. Slides were counter-stained with hematoxylin. Representative sections of n = 5 mice for each group are shown.
Figure 3—figure supplement 1
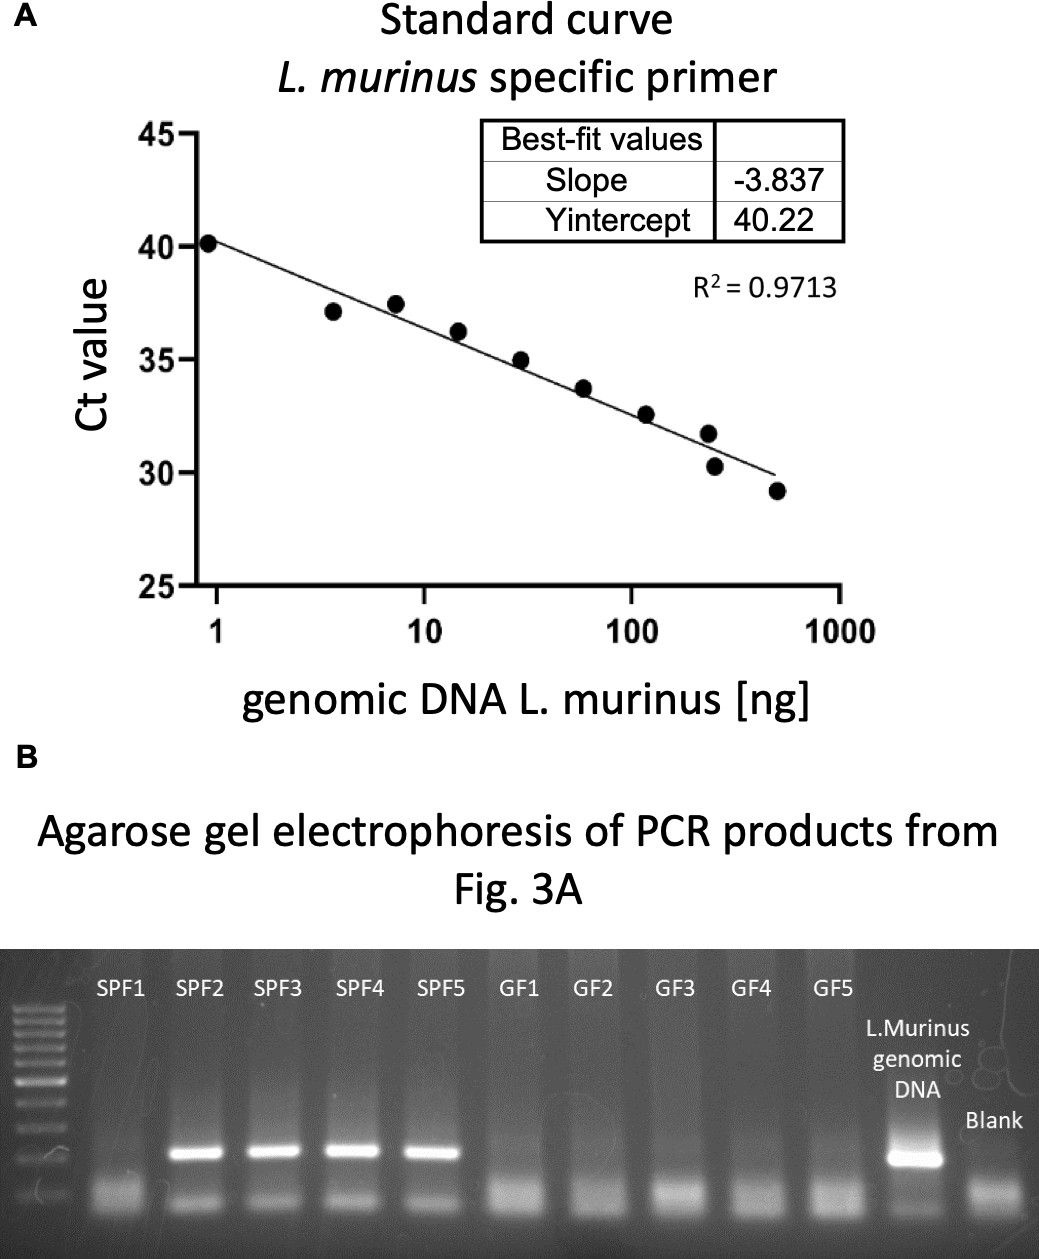
Quality controls for L. murinus specific qPCR.
(A) Standard curve for L. murinus-specific qPCR using DNA from a defined number of CFU of a L. murinus culture in log phase. (B) Amplicons of qPCR were loaded on a standard agarose gel and stained with 0.1 ethidium bromide.
Figure 4 with 1 supplement
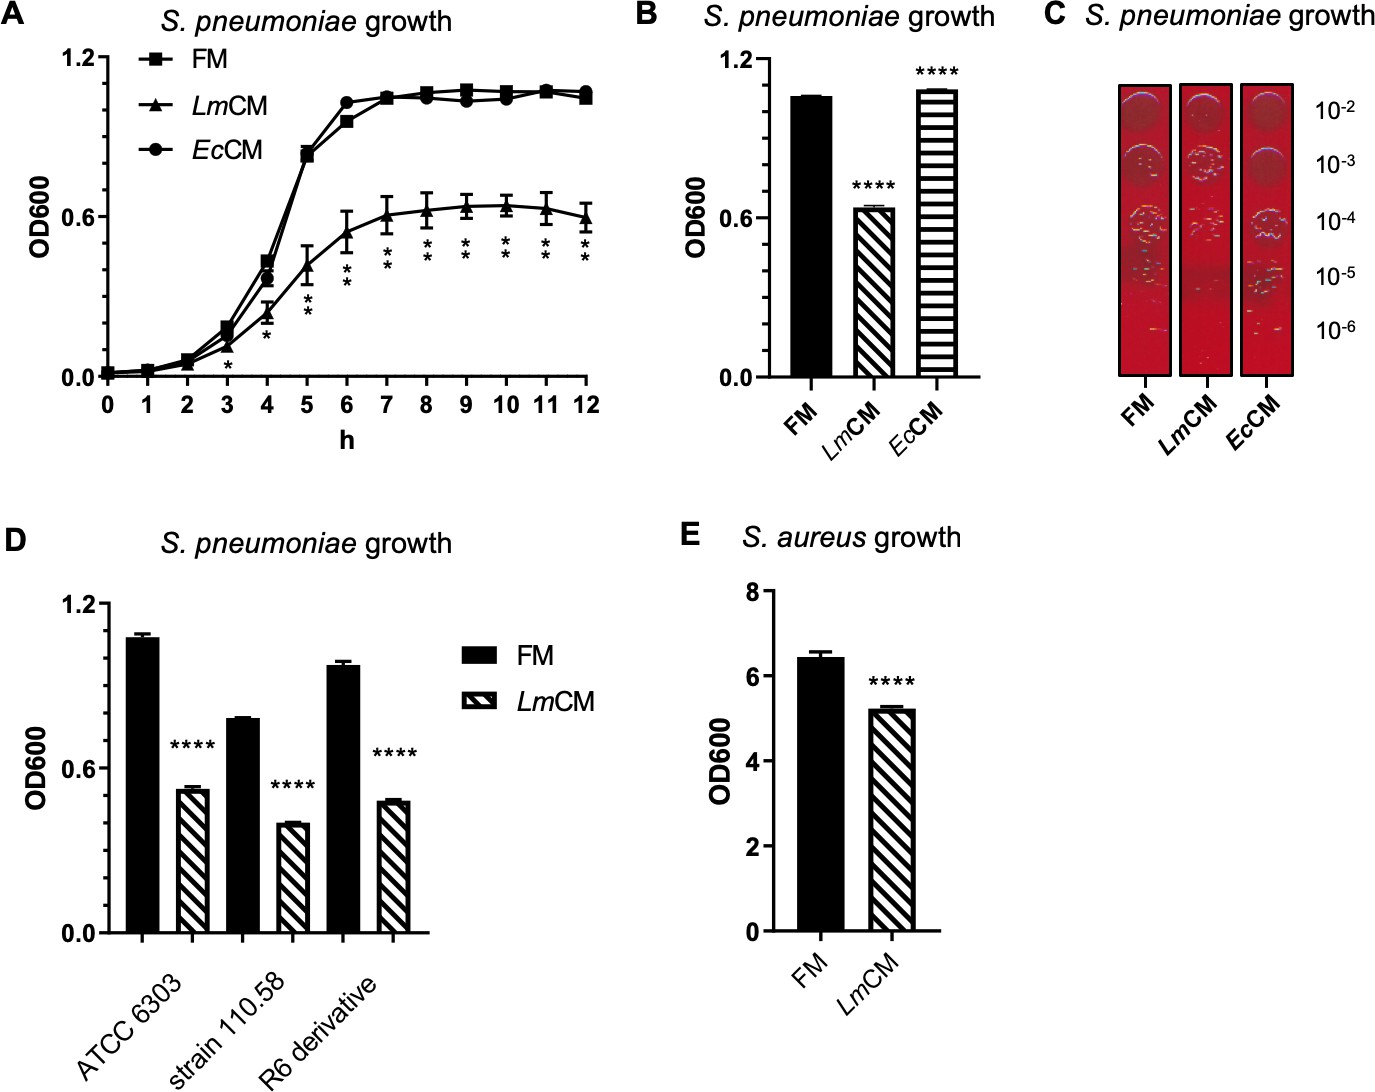
L. murinus conditioned media shows inhibitory role against S. pneumoniae growth in vitro.
(A) S. pneumoniae cultures were grown in presence of fresh (FM) or L. murinus (LmCM) or E. coli (EcCM) conditioned media. Culture growth was followed hourly by optical density at 600 nm (OD600) for 12 hr. Pooled data from two independent experiments are given as mean ± SD. Student t-test was applied for significance test. (B) S. pneumonia cultures were grown for 6 hr in presence of FM, LmCM, or EcCM. Culture growth was measured by OD600. Representative data from two independent experiments are depicted as mean ± sd (n = 3). Student t-test was applied for significance test in comparison to fresh media treated group.( C) Following incubation in presence of FM, LmCM, or EcCM for 6 hr (note, the same OD was taken for the efficiency of plating at the 6 hr time point), S. pneumonia cultures are serially diluted and growth on fresh TSB agar plate with 5% sheep blood for 24 hr. Representative images are shown. (D) Different S. pneumonia strains, that is the virulent encapsulated strain (ATCC6303), non-encapsulated clinical isolate (110.58) and a derivate of the non-encapsulated avirulent lab strain R6 (R-6 derivative), or (E) Staphylococcus aureus (USA300) cultures were grown in presence of FM, LmCM, or EcCM for 6 hr. Culture growth was measured by OD600. Representative data from two independent experiments are depicted as mean ± SD. Student t-test was applied for significance test in comparison to fresh media group of each bacterial strain.
Figure 4—figure supplement 1
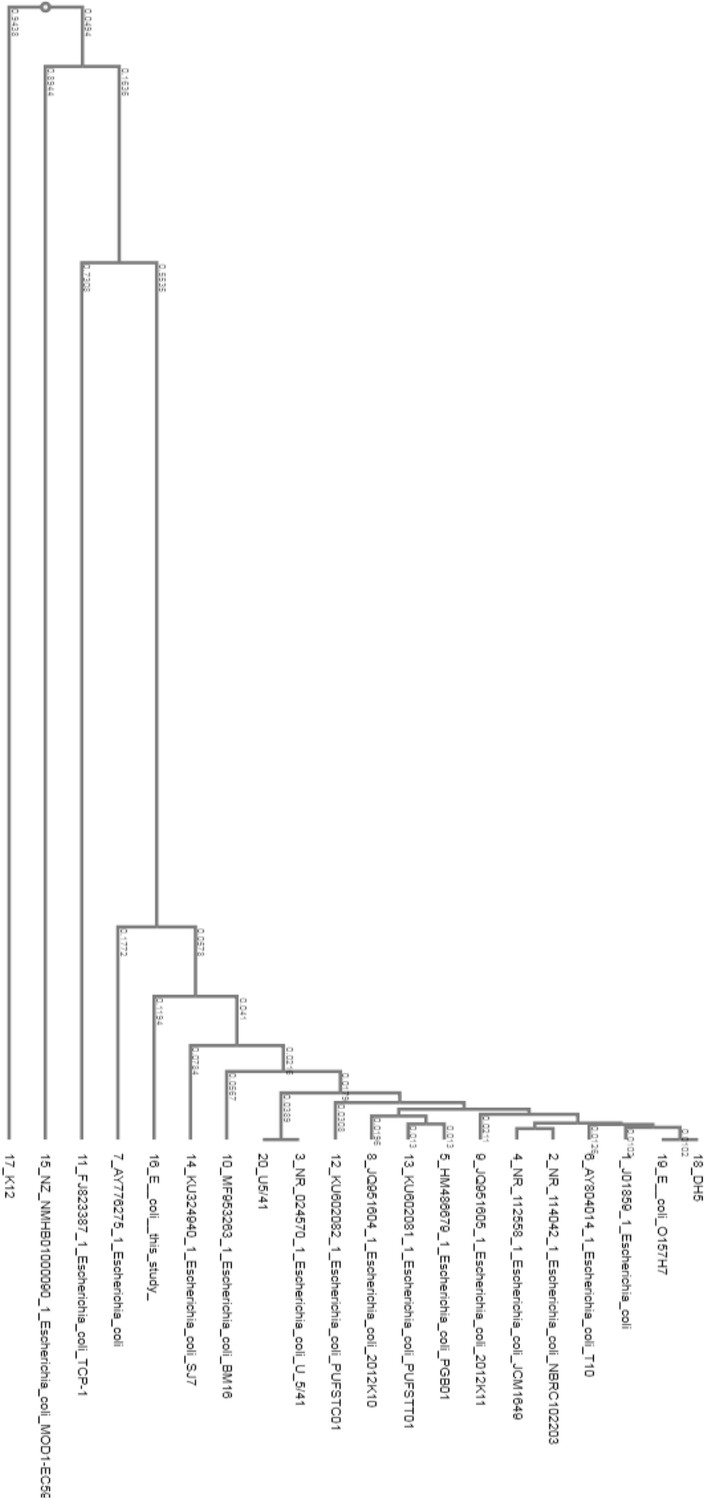
Phylogenetic tree of E. coli isolate to regular lab strains and other environmental isolates.
The phylogeny presented is based on the alignment of approximately 1400 nucleotides of the 16S rRNA gene. The phylogenetic analyses were generated with the neighbor-joining method. The percentage of replicate trees in which the associated taxa clustered together in the bootstrap test (100 replicates) is shown next to the branches. The trees are not rooted but drawn to scale, with branch lengths in the same units as those of the evolutionary distances used to infer the phylogenetic tree. The evolutionary distances were computed using the Kimura 2-parameter method for 16S rRNA gene. The analysis included 17 sequences. Evolutionary analyses were conducted using MEGA6. All sequences are labeled according to strain name, species and accession number.
Figure 5 with 3 supplements
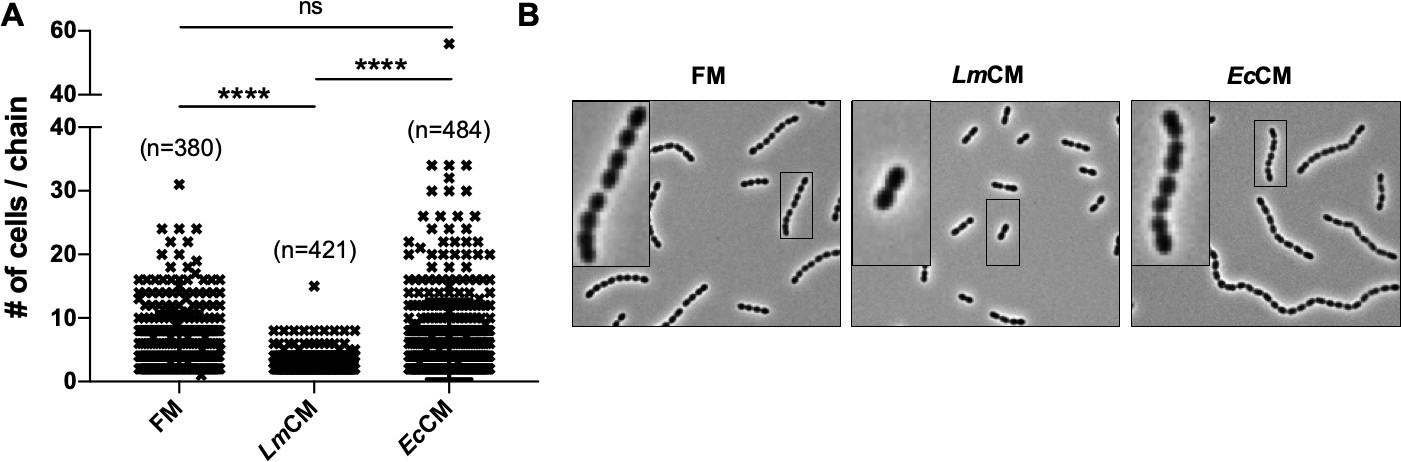
LmCM limits cellular chain length of S. pneumoniae cultures.
S. pneumonia cultures were grown to 0.6 OD600 in presence of FM, LmCM or EcCM. Cellular chain lengths of bacterial cultures are quantified using light microscopy. Each symbol represents an individual multicellular S. pneumoniae chain. Data was pooled from three independent experiments. Number of chains evaluated for each group indicated on the graph (n). Student t-test is applied for statistical analysis. Representative images are shown.
Figure 5—figure supplement 1
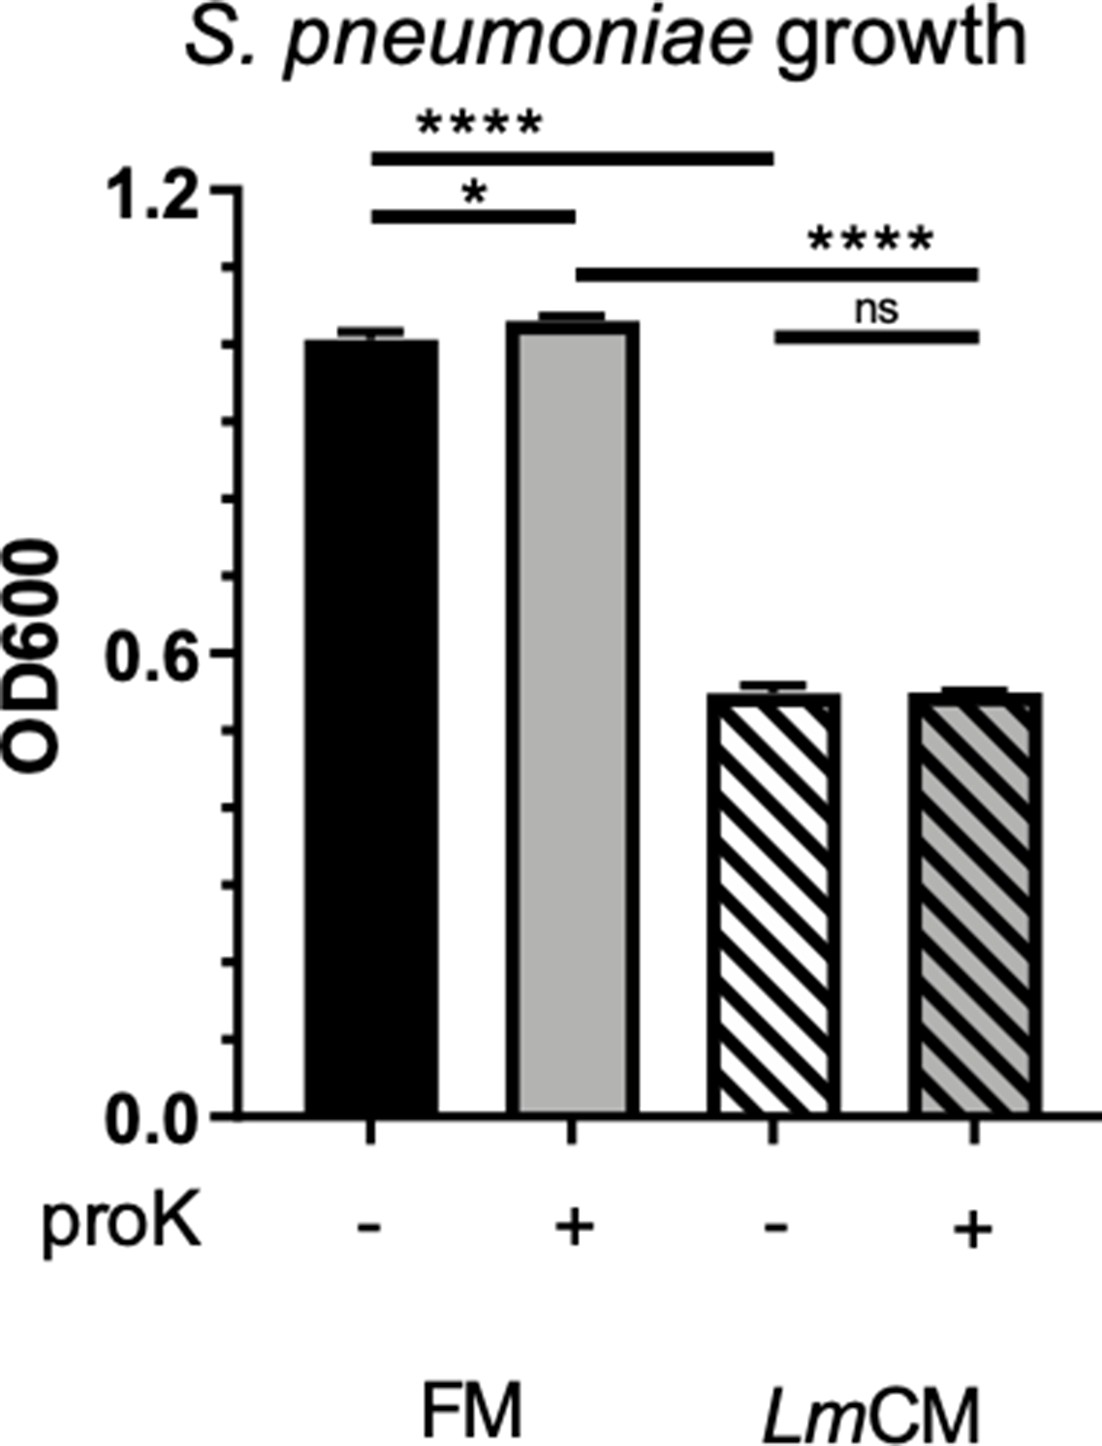
Active substance in LmCM causing growth inhibition on S. pneumoniae is not protein in nature.
S. pneumonia cultures were grown for 6 hr in presence of mock or proteinase K (proK) treated FM and LmCM. Culture growth was measured by OD600. Representative data from two independent experiments are depicted as mean ± SD (n = 3). Student t-test was applied for significance test.
Figure 5—figure supplement 2
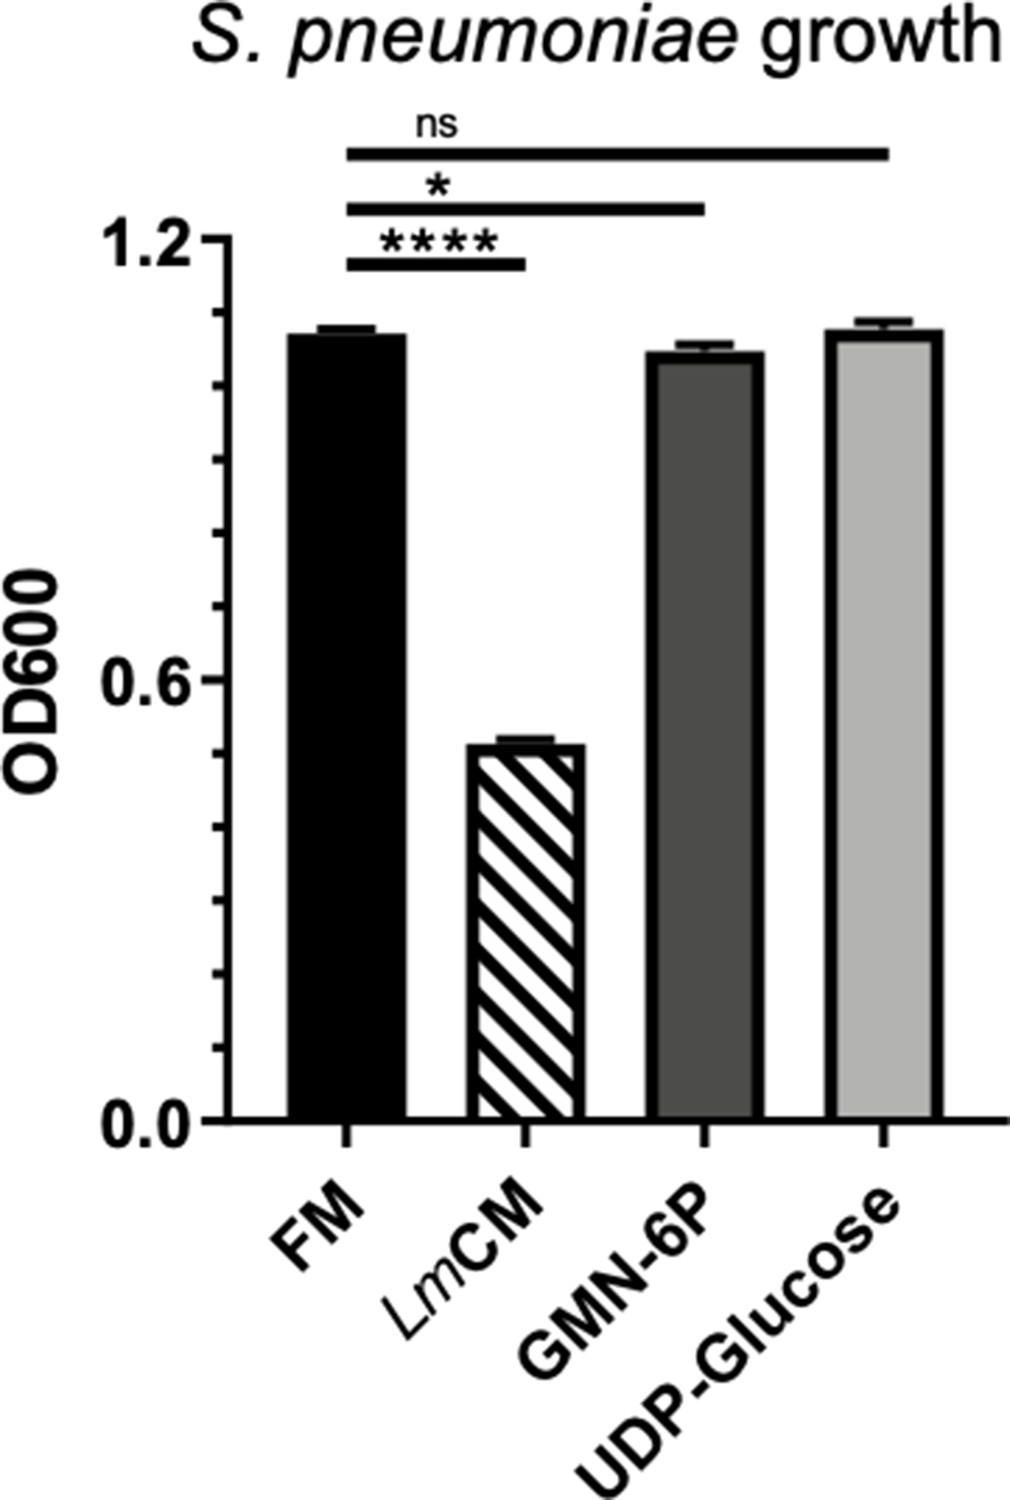
Mass spectrometry identified hits from LmCM do not cause similar growth inhibition on S. pneumoniae cultures.
S. pneumonia cultures were grown for 6 hr in presence of FM, LmCM, Glusamine-6-phosphate (10 mM) or UDP-glucose (10 mM). Culture growth was measured by OD600. Representative data from two independent experiments are depicted as mean ± SD (n = 3). Student t-test was applied for significance test.
Figure 5—figure supplement 3
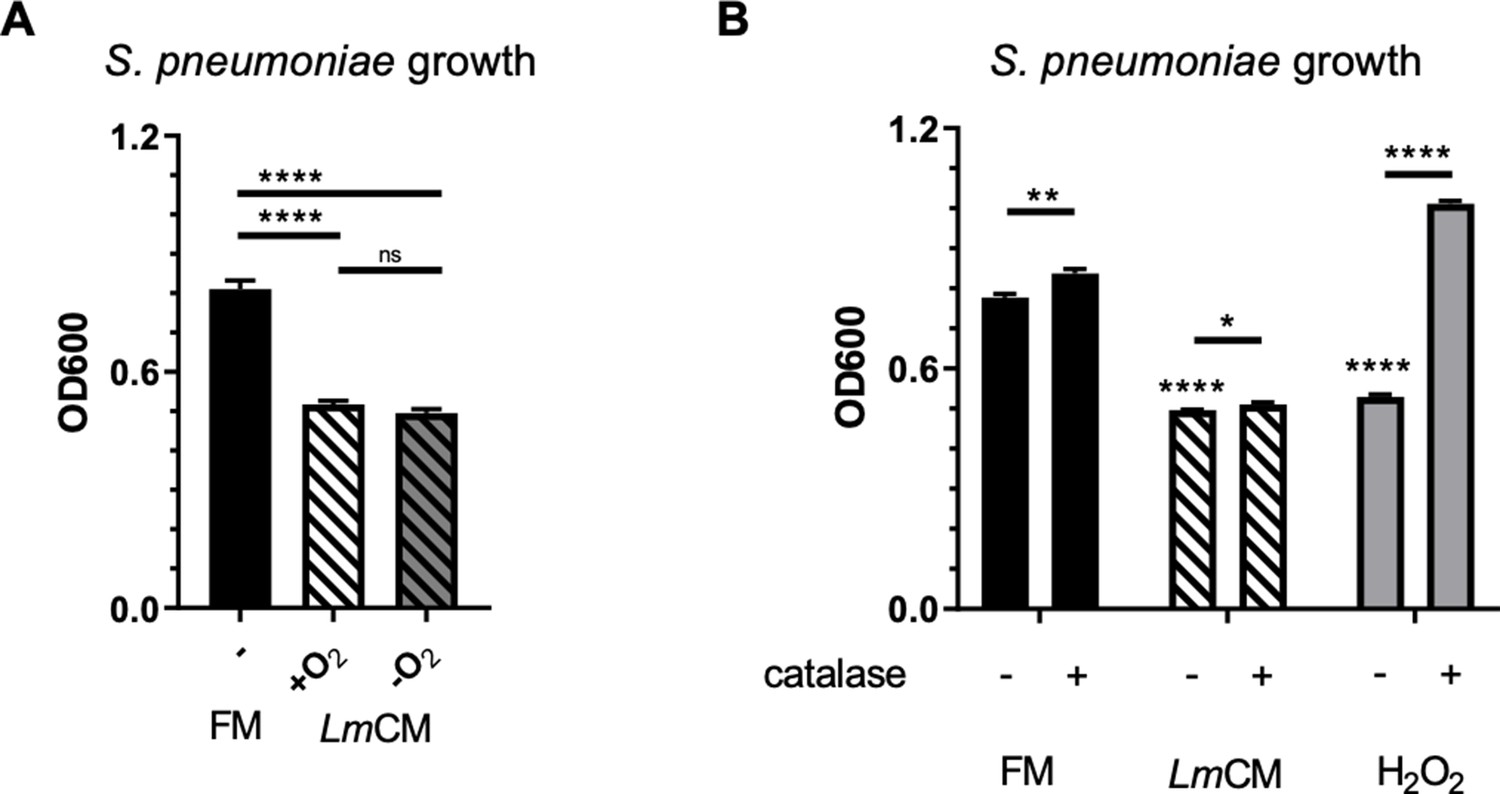
LmCM dependent suppression of S. pneumonia growth does not rely on reactive oxygen species.
Hydrogen peroxide, causing similar growth inhibition on S. pneumoniae cultures, is not the active substance in LmCM. (A) S. pneumoniae cultures grown for 6 hr in presence of FM or media conditioned by L. murinus in aerobic (+O2) or hypoxic environment (-O2). Culture growth was measured by OD600. Representative data from two independent experiments are depicted as mean ± SD (n = 3). Student t-test was applied for significance test. (B) S. pneumoniae cultures grown for 6 hr in presence of mock or catalase treated FM, LmCM or Hydrogen peroxide solution (H2O2, 3.26 mM). Culture growth was measured by OD600. Mean ± SD are depicted in the graph (n = 3). Student t-test was applied for significance test in comparison to fresh media treated group unless otherwise stated by the arrows.
Figure 6
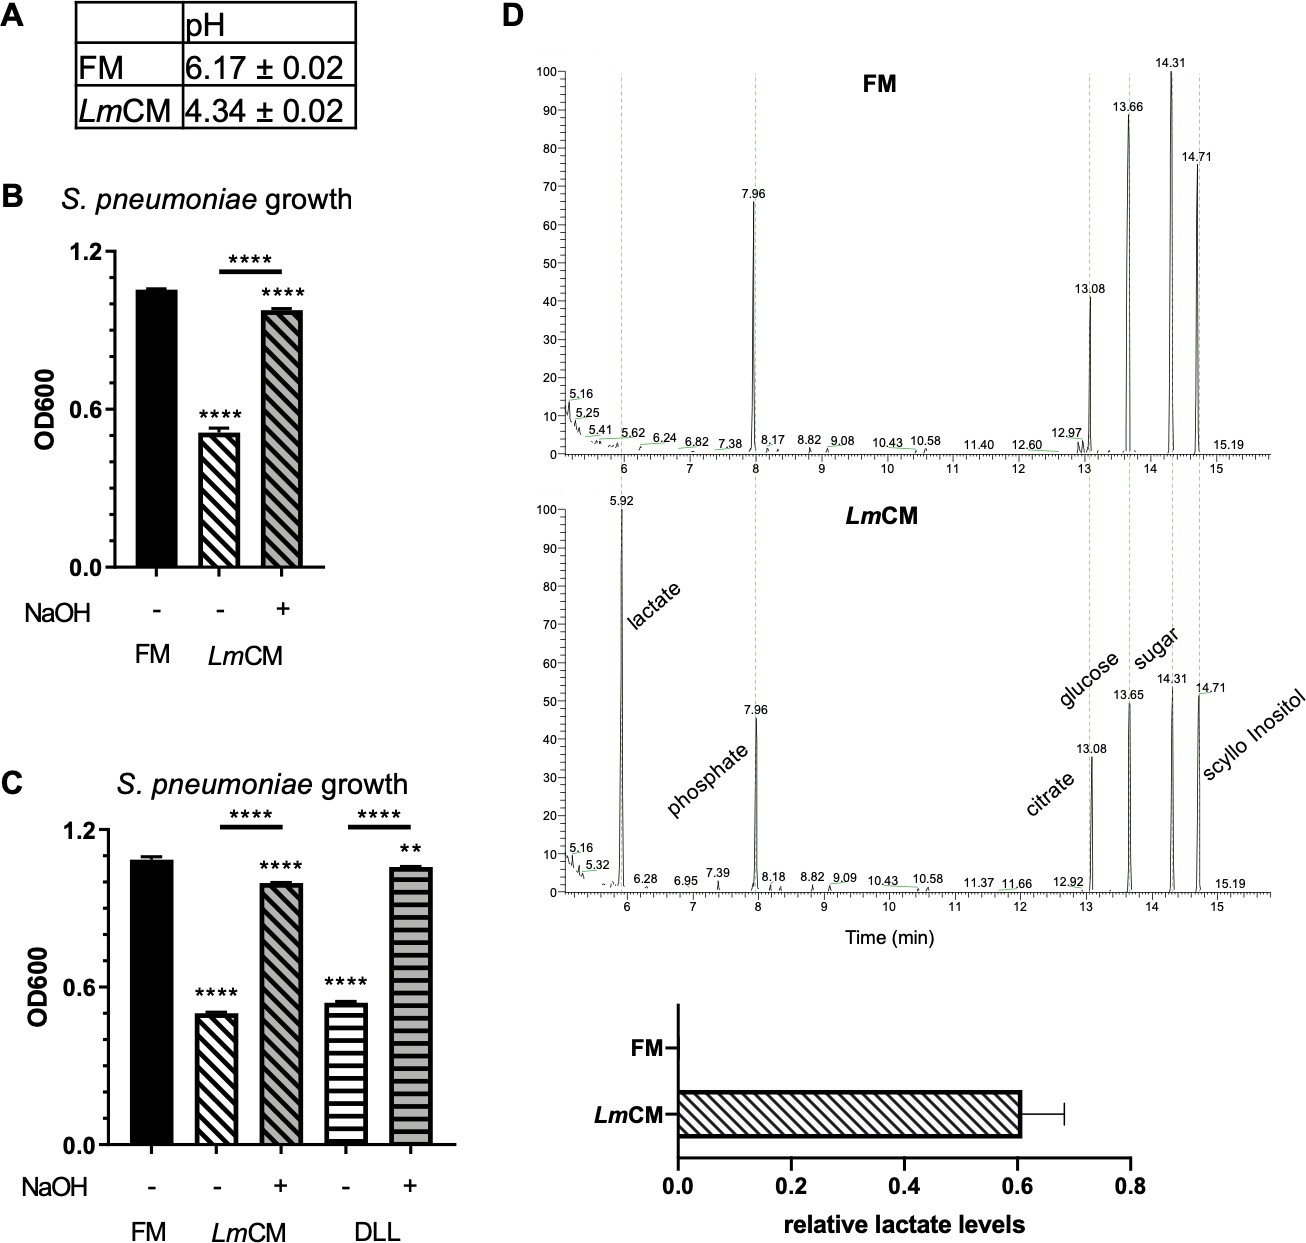
Lactic acid suppresses growth of S. pneumoniae.
Lactic acid present in LmCM is responsible for growth inhibition in S. pneumoniae cultures. (A) pH measurements of fresh (FM) or L. murinus conditioned (LmCM) media. Data is pooled from three independent experiments and depicted as mean ± SD (n = 3). (B) S. pneumonia cultures were grown for 6 hr in presence of FM, LmCM or pH adjusted LmCM (pH:~6.2, NaOH). Culture growth was measured by OD600. Representative data from two independent experiments are depicted as mean ± SD (n = 3). Student t-test was applied for significance test in comparison to fresh media treated group unless otherwise stated by the arrows. (C) Representative GC-MS total ion chromatograms of FM (dashed blue line) and LmCM (straight red line) are shown. Concentrations of Lactate in each media, calculated based on a standard curve acquired using DL-Lactic acid, depicted in the graph (Mean ± SD, n = 3). Student t-test was applied for significance test. (D) S. pneumonia cultures were grown for 6 hr in presence of FM, LmCM, DL-Lactic acid (DLL, 100 mM) or pH adjusted LmCM (pH:~6.2, NaOH) and pH adjusted DLL (pH:~6.2, NaOH). Culture growth was measured by OD600. Representative data from two independent experiments are depicted as mean ± SD (n = 3). Student t-test was applied for significance test in comparison to fresh media treated group unless otherwise stated by the arrows.
Figure 7
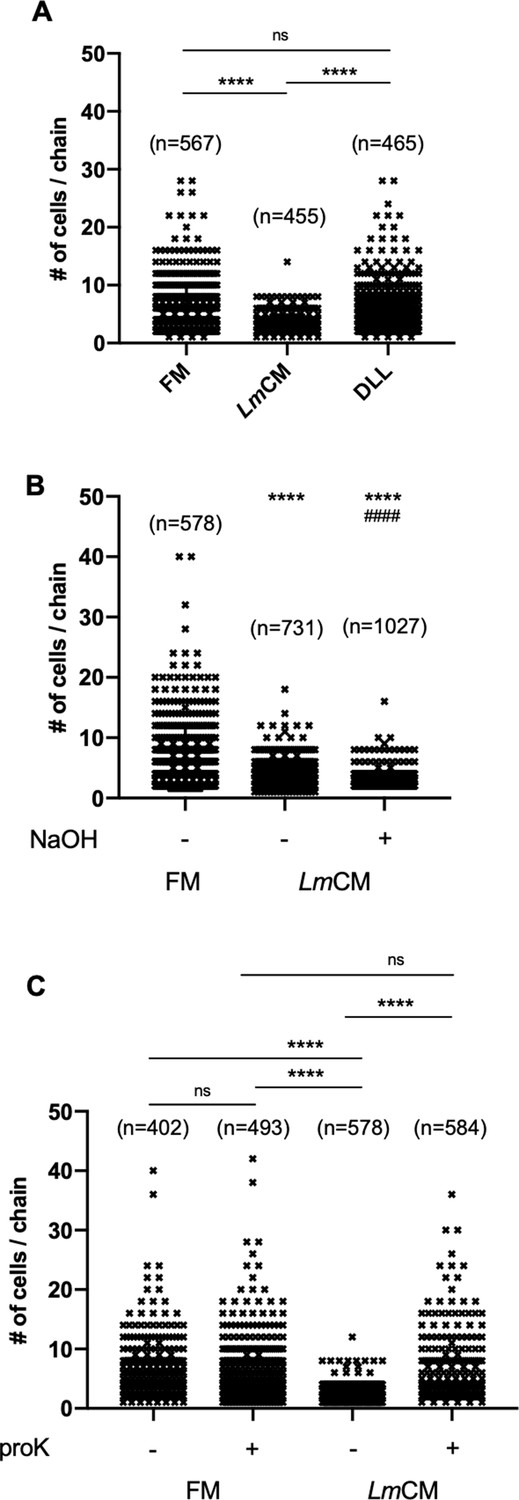
L. murinus secreted substance of protein origin is the cause of decrease in cellular chain length of S. pneumoniae cultures.
S. pneumonia cultures were grown to 0.6 OD600 in presence of (A) FM, LmCM or DL-Lactic acid (DLL,~100 mM), (B) FM, LmCM or pH adjusted LmCM (pH:~6.2, NaOH) and (C) mock or proteinase K (proK) treated FM and LmCM. Cellular chain lengths of bacterial cultures are quantified using light microscopy. Each symbol represents an individual multicellular S. pneumoniae chain. Data was pooled from three independent experiments. Number of chains evaluated for each group indicated on the graph (n). Student t-test is applied for statistical analysis.
Figure 8 with 1 supplement
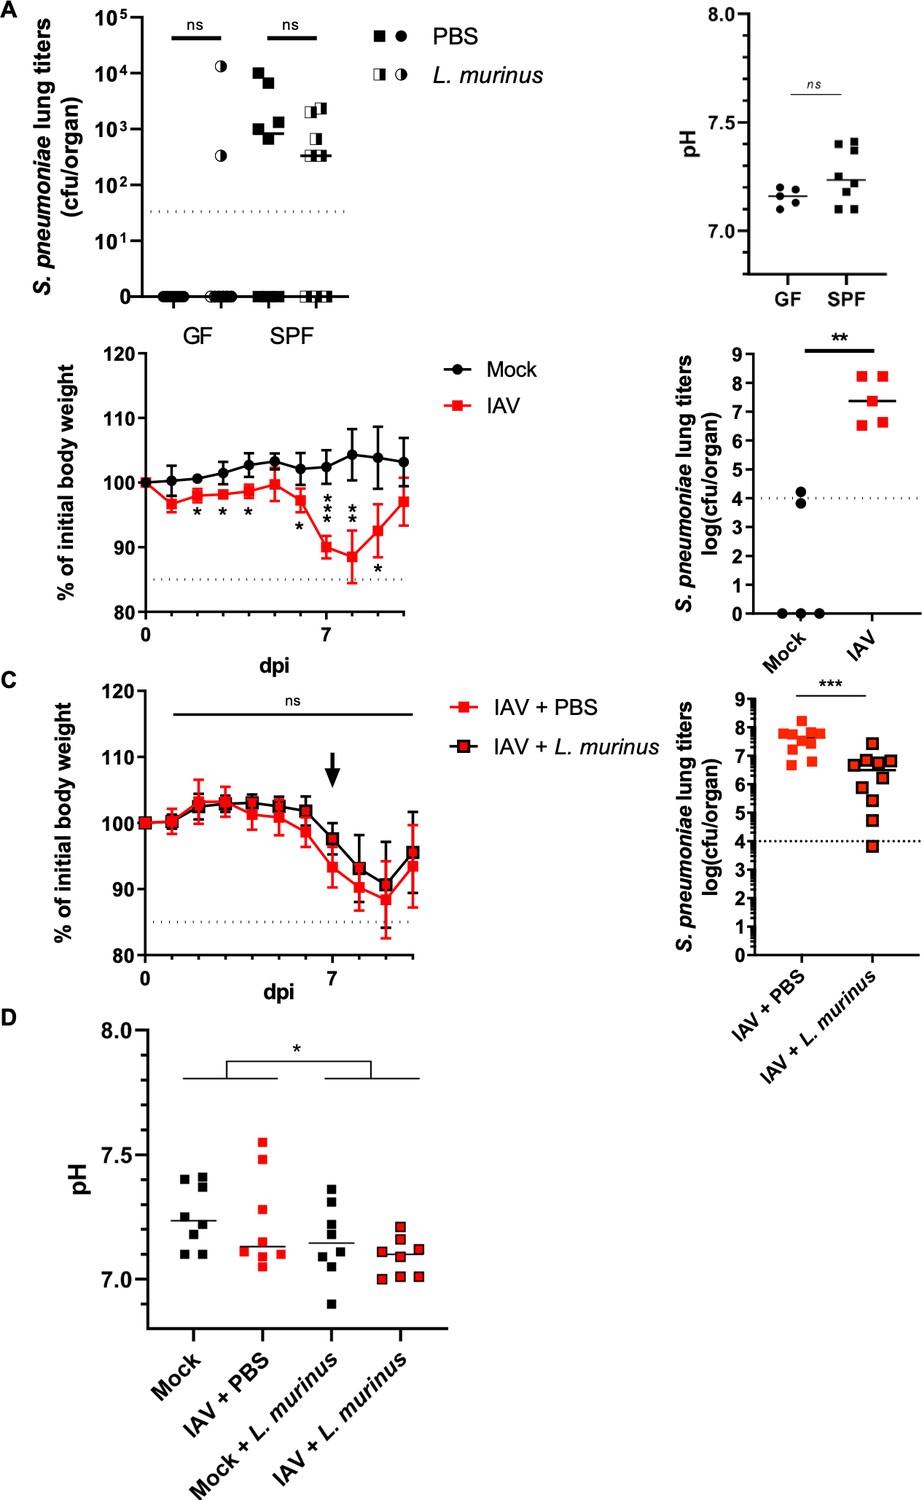
Therapeutic administration of L. murinus decreases S. pneumoniae titers in the lung of IAV infected mice.
(A) Germ-free (GF) or specific pathogen-free (SPF) mice were intranasally administered with PBS or L. murinus (~105 cfu/animal). Three days post-administration, mice were challenged with S. pneumoniae (~1500 cfu/animal). S. pneumoniae lung titers (cfu/organ) of L. murinus (half black/half white) or PBS (plain black) administered GF (circles) or SPF (squares) are quantified 24 hr post infection (n = 10). Medians are depicted by a black line for each group. Pooled data from two independent experiments are shown. BALF pH does not significantly differ between colonized and GF mice (right panel). Median pH values for indicated mice are shown. Each dot represents one animal. Mann-Whitney test is applied for statistical analysis.( B) Average relative initial body weight (%)± SD is depicted for mock treated (black line with circles) and IAV infected (red line with squares) mice (n = 5). Mice were challenged with S. pneumoniae (~1500 cfu/animal) 10 days post IAV infection. S. pneumoniae lung titers (cfu/organ) of mock treated (black circles) or IAV infected (red squares) are quantified 24 hr post infection (n = 5). Medians are depicted by a black line for each group. Student t-test was applied for significance test. (C) All mice are infected with IAV (40 pfu). Seven days post IAV infection, PBS (red line with red squares) or L. murinus (~105 cfu/animal, black line with red squares) is intranasally administered to the animals. Average relative initial body weight (%)± SD is depicted for both group (n = 10). Mice were challenged with S. pneumoniae (~1500 cfu/animal) 10 days post IAV challenge. S. pneumoniae lung titers (cfu/organ) of IAV infected, PBS (red squares) or L. murinus administered (black rounded red squares) are quantified 24 hr post infection (n = 10). Medians are depicted by a black line for each group. Pooled data from two independent experiments are shown. Student t-test was applied for significance test. (D) pH of BALF from mock treated or L. murinus colonized mice 3 days post colonization and 10 days post IAV vaccination (n = 7–8 animals/group).
Figure 8—figure supplement 1
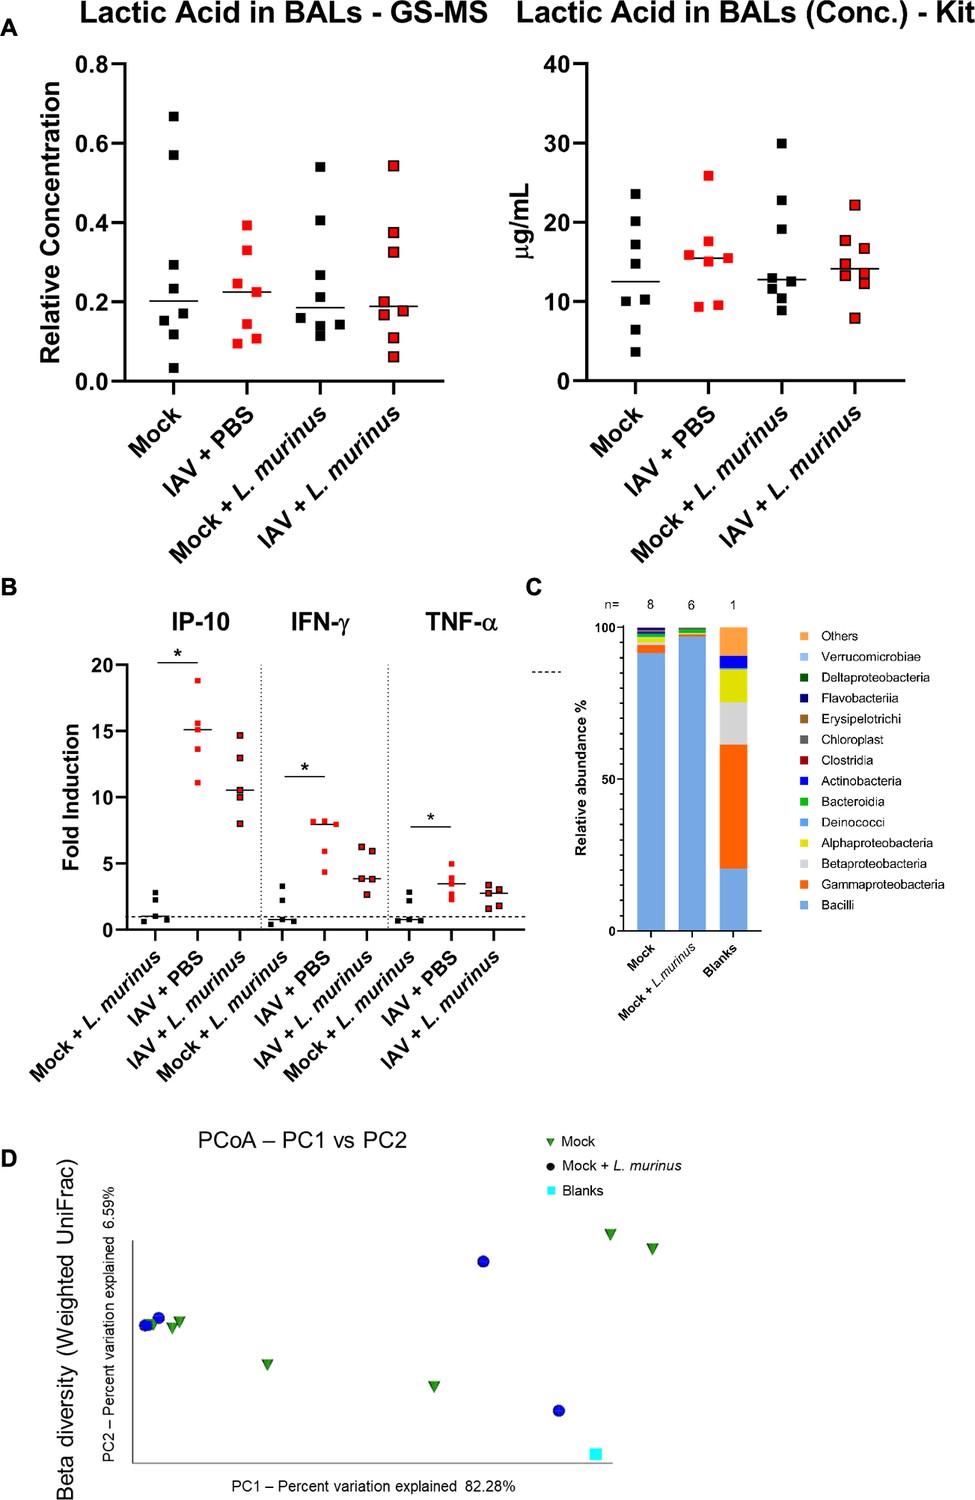
Probiotic treatment with L. murinus does not alter lactic acid levels, inflammatory response or composition of commensal lung bacteria.
(A) Lactic acid in BALF was determined from n = 7–8 mice per group, 3 days post colonization with mock or L. murinus using GC/MS (left) or an LDH based assay (right) (n = 7–8 animals/group). Median values are indicated. Each dot represents an individual animal. (B) Specific qPCR for mRNA of indicated cytokines from total lung RNA of mice (n = 4–5/group) colonized for 3 days with mock or L. murinus. Median values are indicated. (c) Relative composition of SPF mouse lung microbiota based on 16S-specific rRNA gene sequencing from n = 6–8 mice or blank. Bacterial classes are depicted. (C) Beta-diversity of mock treated or L. murinus challenged SPF mice 2 days post colonization. Each dot represents an individual mouse.
Additional files
-
Supplementary file 1
Genome annotation of L. murinus isolate.
L. murimus genome annotation obtained by RAST showing contig identifiers and detected features, start, stop coordinates and coding strand are indicated considering corresponding contig. Enzymatic commission number (EC), nucleotide and deduced amino acid sequences are also presented.
- https://cdn.elifesciences.org/articles/53581/elife-53581-supp1-v1.xlsx
-
Supplementary file 2
Analysis of pathogenicity islands in E. coli genome isolated from IAV infected mice.
The tables contain the list of genes putatively present onto pathogenicity islands recovered from the annotated genomes of two individual colonies of E. coli (A and B) isolated from lung tissue. Gene name and short name as well as gene function are presented. Note that the two lists have almost exactly the same content.
- https://cdn.elifesciences.org/articles/53581/elife-53581-supp2-v1.coli.xlsx
-
Supplementary file 3
Features found in metabolomics analyses of FM, LmCM or EcCM, named after their analytical technique, retention time, and mass.
Sheet 1 (whole list) contains all hits sorted by the ratio of the average signal (arbitrary units) from two runs for L. murinus conditioned medium (LmCM) over fresh medium (FM). Sheet two lists the hits with an AVG (LmCM)/AVG (FM) >10 fold. Sheet three lists the hits with an AVG E. coli conditioned medium (EcCM)/AVG (LmCM) <10 fold. Sheet 4 (short list) contains only hits that are present in sheet 2 and 3. Sheet five lists identified metabolites based on their masses and retention times compared to authentic reference standards run in-house under the same analytical setup. Score (arbitrary units) indicates the goodness of the overall matching between the experimental properties of each feature and those obtained for the corresponding standard, as calculated by Progenesis QI. Mass error express the relative mass difference (ppm) between the masses of the feature and the reference standard. Isotope similarity (%) corresponds to the matching of the isotopic profile of the feature and the reference standard.
- https://cdn.elifesciences.org/articles/53581/elife-53581-supp3-v1.xlsx
-
Transparent reporting form
- https://cdn.elifesciences.org/articles/53581/elife-53581-transrepform-v1.docx
Download links
A two-part list of links to download the article, or parts of the article, in various formats.
Downloads (link to download the article as PDF)
Open citations (links to open the citations from this article in various online reference manager services)
Cite this article (links to download the citations from this article in formats compatible with various reference manager tools)
Respiratory tissue-associated commensal bacteria offer therapeutic potential against pneumococcal colonization
eLife 9:e53581.
https://doi.org/10.7554/eLife.53581


