MEIS-mediated suppression of human prostate cancer growth and metastasis through HOXB13-dependent regulation of proteoglycans
- The Committee on Cancer Biology, The University of Chicago, United States
- Department of Pathology, The University of Illinois at Chicago, United States
- Department of Surgery, Section of Urology, The University of Chicago, United States
- Department of Urology, UT Southwestern, United States
Figures
Figure 1 with 2 supplements
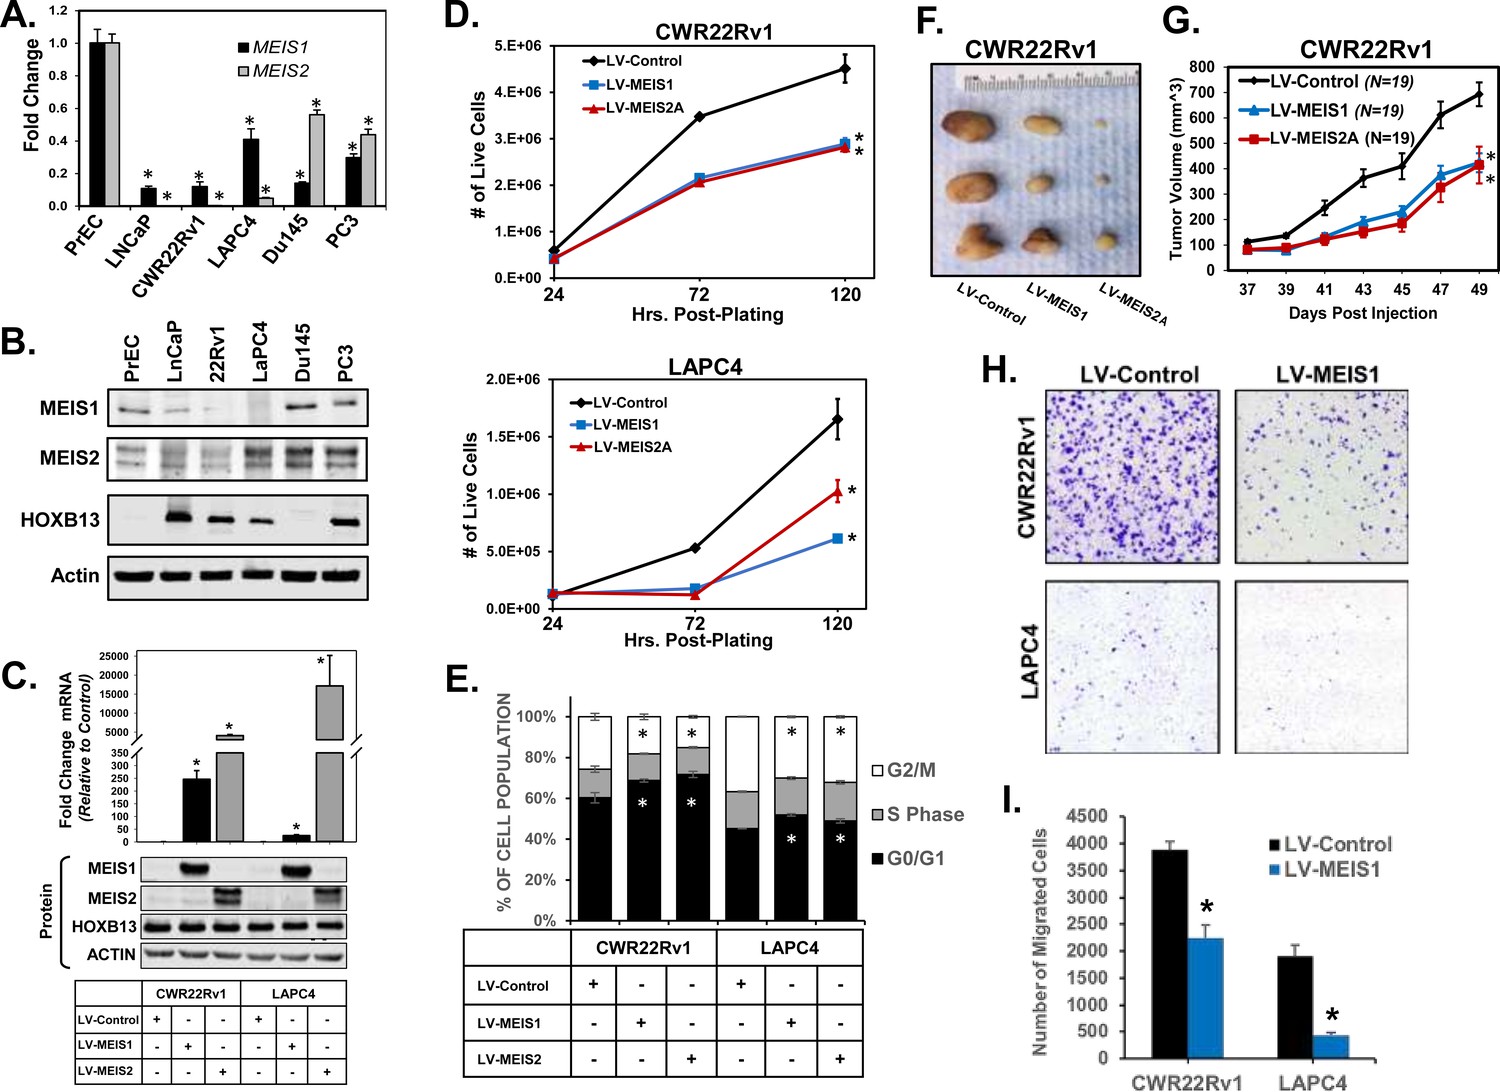
Expression of MEIS1 or MEIS2 in PrCa cell lines is sufficient to decrease growth in vitro and in vivo.
(A) RT-PCR for MEIS1 (black) or pan-MEIS2 (gray) in five of the most common prostate cancer cell lines (LNCaP, CWR22Rv1, LAPC4, Du145, and PC3) as compared to non-malignant primary prostate epithelial cells (PrECs). Fold-change from PrEC was calculated using ΔΔCq methodology (technical replicates, n = 3). Error bars represent standard error of the mean (SEM). (B) Western blot analysis of endogenous MEIS1, MEIS2, and HOXB13 expression from common prostate cancer cell lines and primary Prostate Epithelial Cell (PrEC) culture. Actin was used as a loading control. (C) Western blot confirmation of lentiviral overexpression of MEIS1 or MEIS2 in CWR22Rv1 and LAPC4 cell lines. LV-Control encodes an expression plasmid for constitutive Cas9 expression. Endogenous HOXB13 expression was also assessed in all lines. Actin was used as a loading control. (D) Proliferation of CWR22Rv1 (top) and LAPC4 (bottom) with exogenous expression of MEIS1 (blue), MEIS2A (red), or control (black). Cell number over time was assessed by manual counting of live cells on a hemocytometer. Data represent mean count and SEM at each time point (technical replicates, n = 3). Data for LV-Control and LV-MEIS2A is the same as in Figure 1—figure supplement 2D-E (E) Cell cycle analysis determined by propidium iodide (PI) fluorescence intensity in CWR22Rv1 and LAPC4 cells with exogenous expression of MEIS1 (blue), MEIS2A (red), or control (black). Data represent mean (technical replicates, n = 3) and SEM. (F) Representative tumors fixed at time of sacrifice. Tumors are subcutaneous xenografts of CWR22Rv1 cells with exogenous expression of MEIS1, MEIS2A, or control. (G) Subcutaneous tumor growth over time for CWR22Rv1 cells with exogenous expression of MEIS1 (blue), MEIS2A (red), or control (black). Data points represent mean (n = 19 for each cell type) and SEM. (H) Representative images of transwell migration assays for CWR22Rv1 (top) and LAPC4 (bottom) of cells with exogenous expression of control (left) or MEIS1 (right). (I) Quantification of transwell migrations performed in (H). Data represent mean (technical replicates, n = 4) and SEM. *Student’s t-test p<0.05 for all panels. See also Figure 1—figure supplements 1 and 2.
Figure 1—figure supplement 1
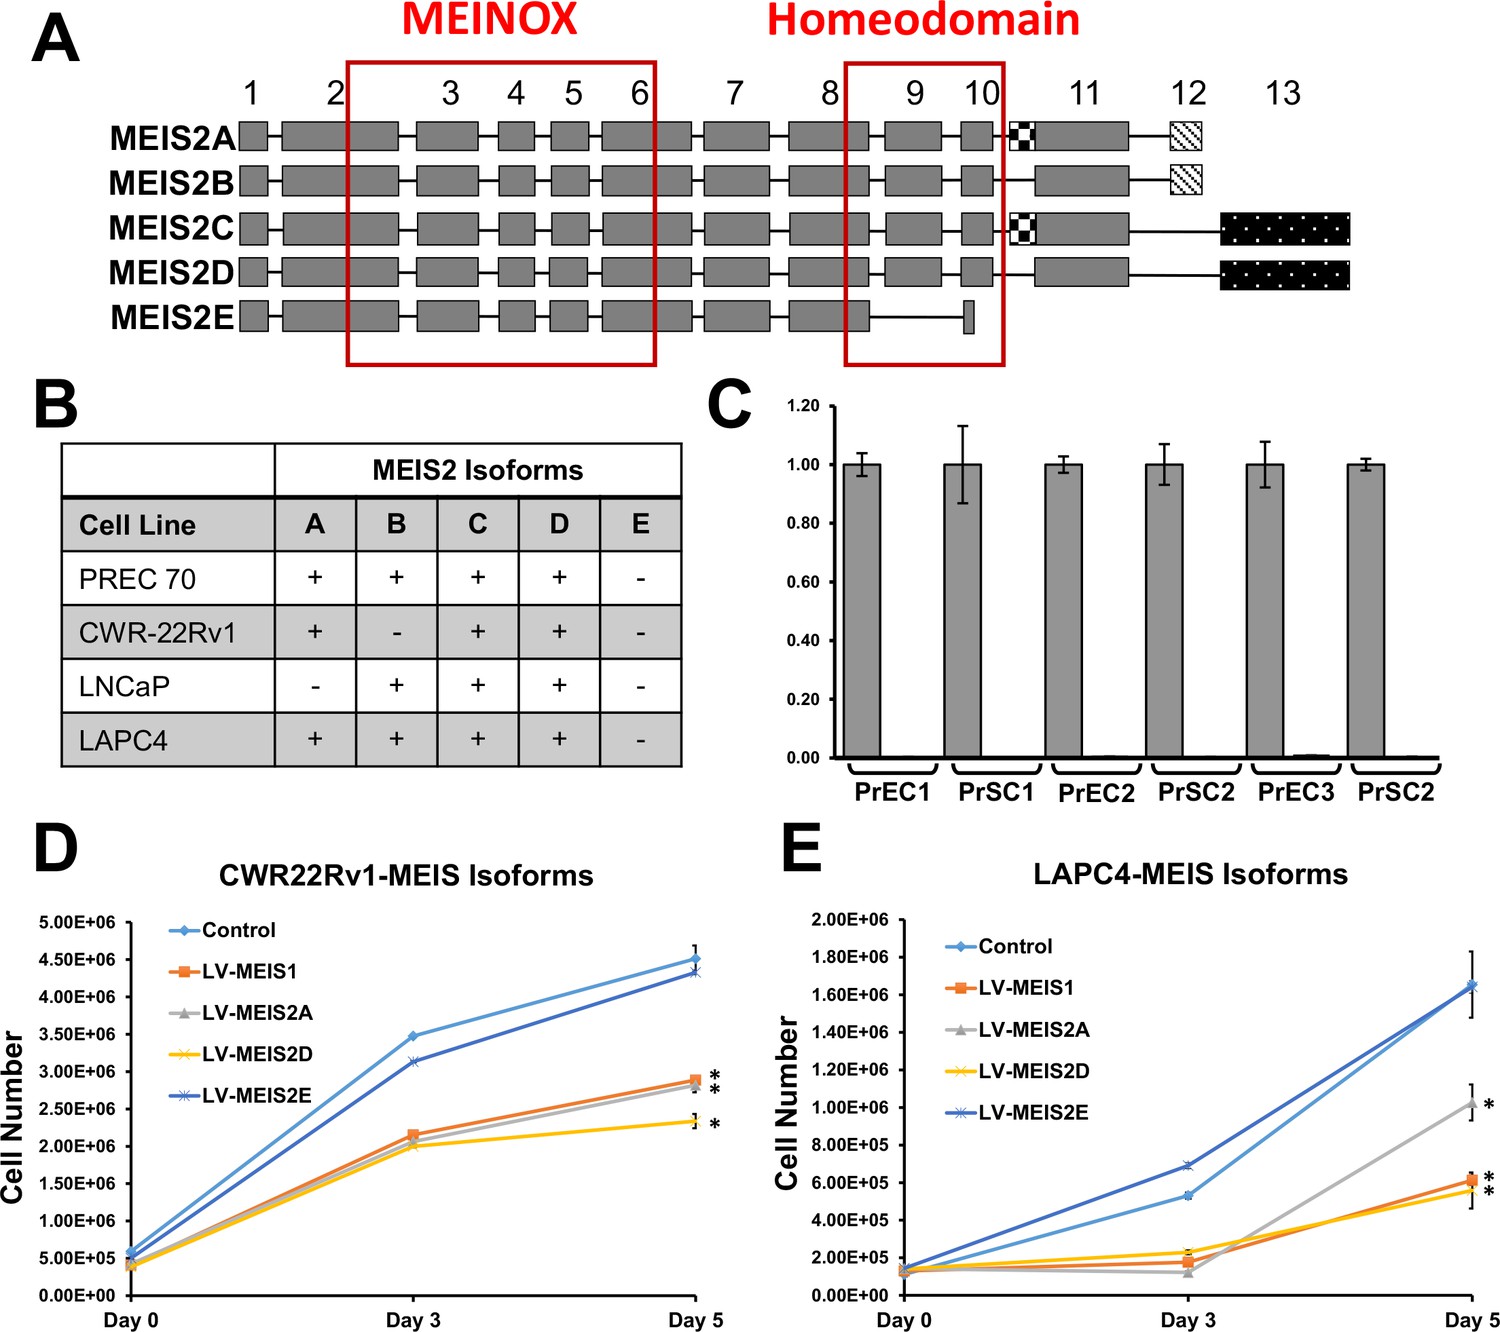
MEIS2 Isoforms in Prostate Cancer Cells.
(A) Schematic indicating the most common translational isoforms of MEIS2 (UniProt Identifier #O14770) modified from Geerts et al., 2005. Boxes represent exons as numbered on top. The checkered box represents the extra sequence within variant exon 11, and exons 12 and 13 are mutually exclusive. The two main functional domains, Meinox and Homeodomain, are boxed off in red. (B) Isoform distribution of MEIS2 in prostate cells. Table represents presence or absence of each MEIS2 isoform A through E identified in at least 5% of MEIS2 transcripts. (C) Absence of detectable MEIS2E isoform in primary prostate epithelial cells (PrECs) and stromal cells (PrSCs) obtained from three different patients. (D and E) Lentiviral expression and growth suppression of MEIS1, MEIS2A, and MEIS2D isoforms (LV-MEIS1, 2A, and 2D) in CWR22Rv1 and LAPC4 prostate cancer cells. Data for Control, MEIS1, and MEIS2A are also shown in Figure 1. The MEIS2E isoform, which lacks a DNA-binding homeodomain, did not suppress cell growth.
Figure 1—figure supplement 2
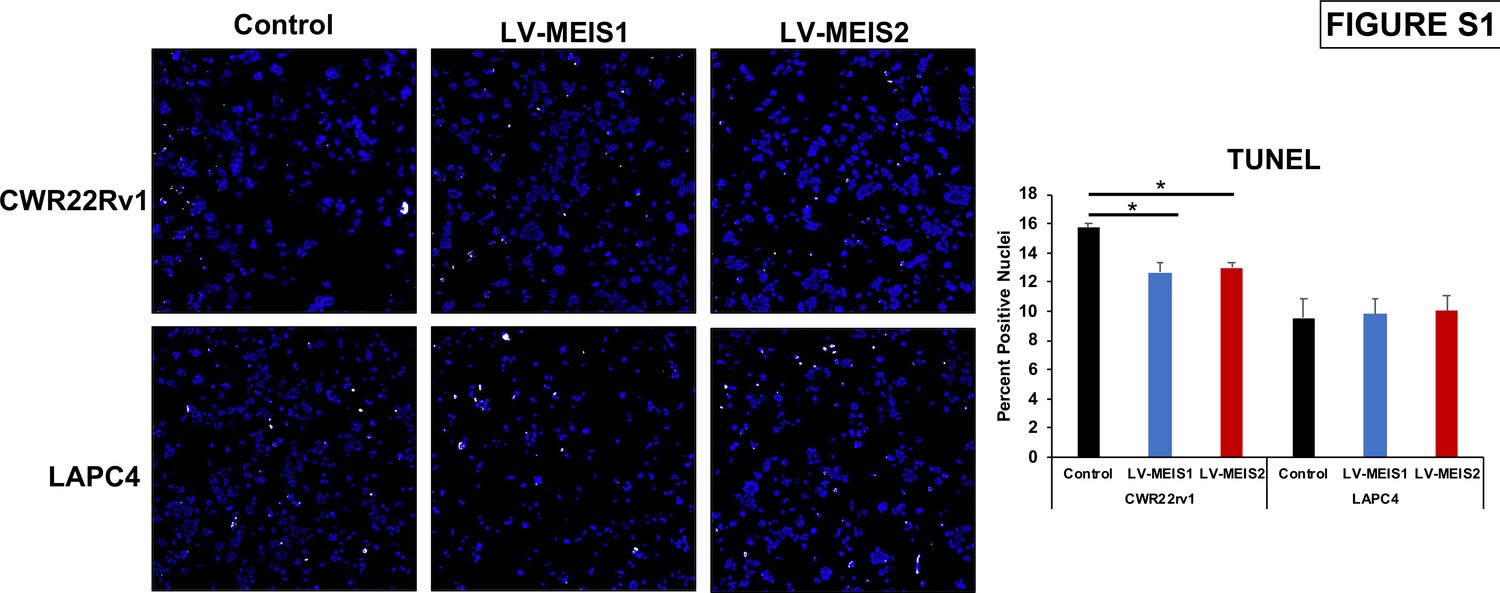
Decreased cell number with exogenous MEIS1 or MEIS2 expression is not the result of increased cell death.
Representative images (left) and quantitation (right) of terminal deoxynucleotidyl transferase (TdT) dUTP nick-end labeling (TUNEL) assay on CWR22Rv1 and LAPC4 cells expressing control, LV-MEIS1, or LV-MEIS2 48 hr after plating in full growth media in a 96-well plate. Nuclei are stained with DAPI (blue), and TUNEL assay signal is visualized with Alexa Fluor 647 (white). Complete wells were imaged at 4X, images for each well were stitched together, and TUNEL-positive nuclei were counted manually using ImageJ. Quantitation reflects mean (technical replicates, n = 4) and SEM. *Student’s t-test p<0.05.
Figure 2

Exogenous MEIS1 expression rescues the nuclear MEIS1–HOXB13 interaction present in normal prostate epithelial cells.
(A) Heatmap for HOX expression profile from publicly available, human RNA-seq data of benign prostate, primary prostate tumor, or metastasis from a prostate tumor. Log2(FPKM) values were used to generate heatmap. (B) In situ proximity ligation assay (PLA) to identify MEIS1/HOXB13 heterodimers in prostate epithelial cells (PrECs; short-term culture of primary epithelial cells from a de-identified patient, positive for expression of MEIS1 and HOXB13); CWR22Rv1-Control (expresses HOXB13 but has low to undetectable expression of MEIS1); CWR22Rv1-LV-MEIS1 (expresses HOXB13 and exogenous MEIS1); LAPC4-Control (expresses HOXB13 but has low expression of MEIS1); and LAPC4-LV-MEIS1 (expresses HOXB13 and exogenous MEIS1). Nuclei are stained with DAPI. Yellow puncta are the result of a positive PLA reaction and indicate MEIS1 and HOXB13 are within 40 nm of each other. Puncta were imaged as Texas-red fluorescence and pseudo-colored yellow for better contrast. Cells were imaged on the Keyence BZ-X800 microscope with 60x oil immersion objective. (C) Quantification of nuclear PLA signals in (B). Center lines show medians; box limits indicate 25th and 75th percentiles as determined by R software; whiskers extend 1.5-times the interquartile range from 25th and 75th percentiles, outliers are represented by dots; crosses represent sample means (n = 141, 422, 726, 107, 114, respectively). Boxplot generated with BoxplotR online tool (Spitzer et al., 2014) (*Welch’s t-test p<0.05). (D) Co-immunoprecipitation of MEIS1 with HOXB13 in PrECs and CWR22Rv1 and LAPC4 Control and LV-MEIS1 expressing cells.
Figure 3 with 1 supplement
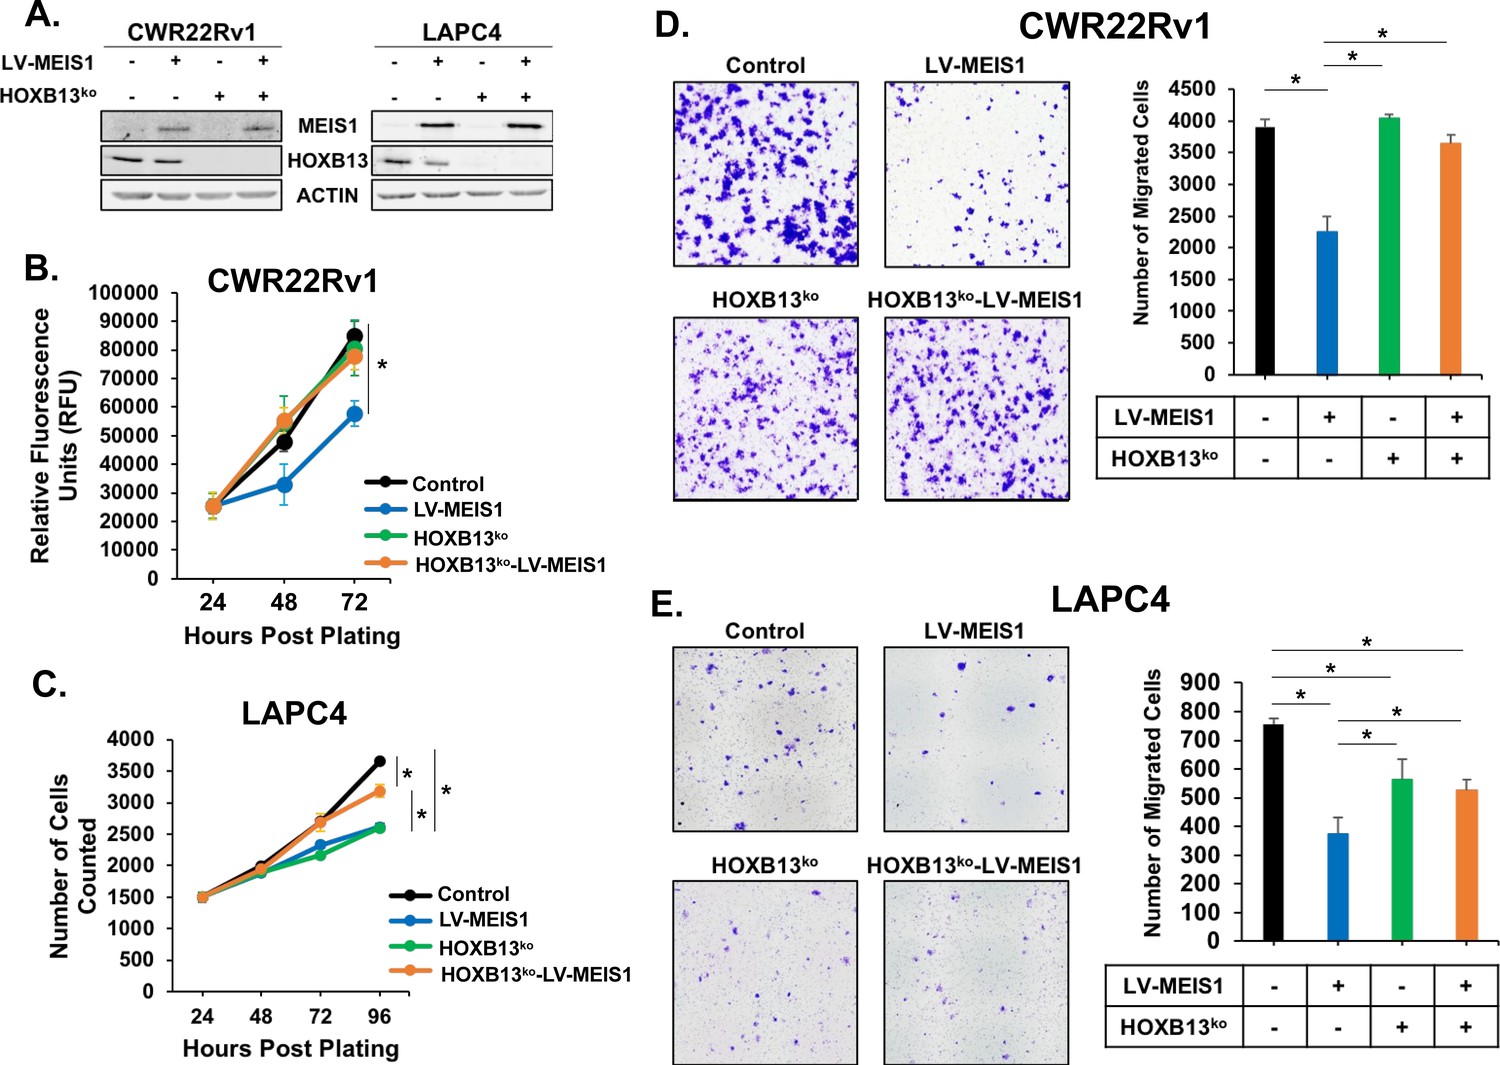
MEIS-mediated suppression of proliferation and migration is dependent upon HOXB13.
(A) Western blot analysis of HOXB13 knockout using CRISPR and exogenous expression of MEIS1 in the resulting HOXB13ko cells for CWR22Rv1 and LAPC4. Actin was used as a loading control. (B-C) Proliferation of CWR22Rv1 (B) and LAPC4 (C) cells expressing control (black) or LV-MEIS1 (blue); or with HOXB13ko (green) or HOXB13ko and LV-MEIS1 expression (orange). Cell number over time was assessed using CyQuant direct cell proliferation kit. Data represent mean and SEM at each timepoint (technical replicates, n = 3). (D-E) Representative 10x images (left) and quantitation (right) of transwell migration assay for CWR22Rv1 (D) and LAPC4 (E) cell line derivatives. Data represent mean number of cells counted (technical replicates, n = 3) and SEM. *Student’s t-test p<0.05 for all panels. See also Figure 3—figure supplement 1.
Figure 3—figure supplement 1

Cell viability is unaffected by HOXB13ko in LAPC4 cells.
Cell viability over time of LAPC4-Control, -LV-MEIS1, -HOXB13ko, and -HOXB13ko-LV-MEIS1.
Figure 4
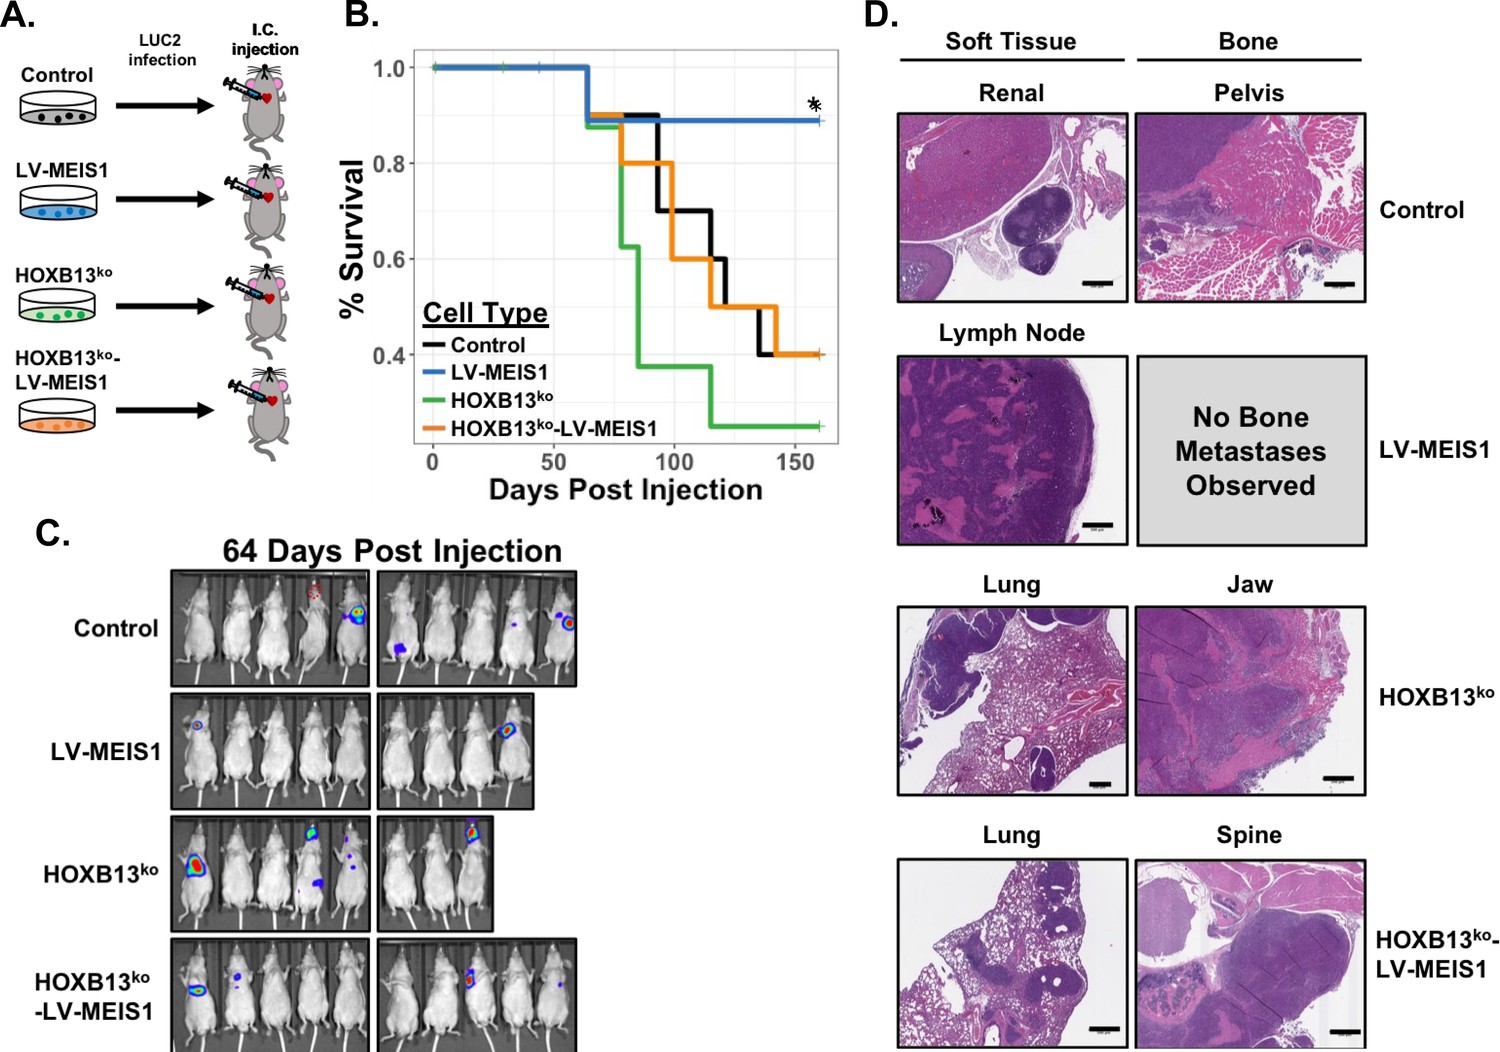
MEIS-mediated metastasis suppression in vivo is HOXB13-dependent.
(A) Schematic of experimental design for intracardiac injection of CWR22Rv1 cell line derivatives into athymic nude mice to model metastasis. Control (black), LV-MEIS1 (blue), HOXB13ko (green), and HOXB13ko-LV-MEIS1 (orange) derivatives of CWR22Rv1 were each infected with a lentiviral LUC2 expression vector to enable in vivo bioluminescent monitoring of metastasis formation. LUC2-expressing cells were then injected into the left ventricle of athymic nude mice with 1 cell line per mouse (n = 10 mice per cell line). (B) Kaplan-Meier survival curves illustrating overall survival of mice post-intracardiac injection to the veterinarian-approved endpoint. LV-MEIS1 vs. control cells (Chisq = 4.1 on 1 degree of freedom, p=0.04); LV-MEIS1 vs. HOXB13ko-LV-MEIS1 cells (Chisq = 4.1 on 1 degree of freedom, p=0.04); LV-MEIS1 vs. HOXB13ko cells (Chisq = 6.1 on 1 degree of freedom, p=0.01); HOXB13ko vs. control cells (Chisq = 1.4 on 1 degree of freedom, p=0.2); HOXB13ko vs. HOXB13ko-LV-MEIS1 cells (Chisq = 0.9 on 1 degree of freedom, p=0.3); HOXB13ko-LV-MEIS1 vs. control cells (Chisq = 0 on 1 degree of freedom, p=1). (C) Representative images of in vivo bioluminescent imaging of the metastatic colonization of CWR22Rv1 intracardiac-injected mice. Red dashed circle in the control mouse image indicates location of a visually evident and palpable metastasis that did not produce bioluminescent signal. (D) Representative H and E images (20 × magnification) of histological sections of metastases from injected mice. Scale bars indicate 500 µm.
Figure 5 with 2 supplements

Integration of ChIP-seq and RNA-seq analyses reveals MEIS1-mediated, HOXB13-dependent, direct regulation of proteoglycans including Decorin (DCN).
(A) Western blot confirmation of pull-down of MEIS1 from chromatin in CWR22Rv1 LV-MEIS1 and HOXB13ko-LV-MEIS1 cell lines (Top) and heatmap of read density profiles from MEIS1 ChIP-seq for ±2 kb of the peak center (PC) called by MACS2 (Bottom). Graphs are separated vertically into peaks called from LV-MEIS1 samples vs. input DNA (LV-MEIS1 peaks), where both MEIS1 and HOXB13 are expressed, and peaks called from HOXB13ko-LV-MEIS1 samples vs. input DNA (HOXB13ko-LV-MEIS1 peaks), where only MEIS1 is present and HOXB13 has been knocked-out. (B) Spaced Motif (SpaMo) analysis querying MEIS1 as the primary motif demonstrates an inferred secondary motif matching HOXB13 has a conserved spacing from the MEIS1 motif that is most significant at 1 bp away, downstream and on the opposite DNA strand in MEIS1 peaks from LV-MEIS1 ChIP-seq (top). In MEIS1 peaks from HOXB13ko-LV-MEIS1 ChIP-seq, SpaMo analysis identifies an inferred motif matching HOXA9 as the only HOX motif with a significant conservation of spacing with the MEIS1 motif and is most significant at 3 bp away on either DNA strand regardless of up or downstream (bottom). (C) Venn diagram demonstrating the number of genes with differential expression (fold-change >±1.5, FDR < 0.05) in CWR22Rv1-LV-MEIS1 vs. CWR22Rv1-Control cells from RNA-seq of these lines (gray), overlapped with the number of genes that MEIS1 peaks were annotated to using HOMER in either LV-MEIS1 (blue) or HOXB13ko-LV-MEIS1 (orange) ChIP-seq. The 157 genes (red) represent prioritized MEIS effector genes, since they are bound and differentially expressed only when HOXB13 is present. (D) Top 10 significantly enriched pathways from KEGG pathway enrichment analysis using the list of 157 genes identified in (C). (E) Volcano plot of gene expression Log2(fold-change) vs. significance (FDR) in CWR22Rv1 LV-MEIS1 vs. control cells. Dashed lines indicate thresholds for fold-change >2 or<2 and for FDR value <0.01. Highlighted gene symbols indicate genes that: 1) are within the ‘proteoglycans in cancer’ pathway curated by KEGG, 2) are annotated as targets in the MEIS1 ChIP-seq from LV-MEIS1 cells, and 3) have significant differential expression in LV-MEIS1 vs. control RNA-seq (fold-change >±1.5, FDR < 0.05). Gray dots indicate genes with no significant differential expression; green dots indicate genes with fold-change >±2 but FDR > 0.01; blue dots indicate genes with FDR < 0.01 but fold-change <±2; and red dots indicate genes with both FDR < 0.01 and fold-change >±2. (F) Integrated Genome Browser tracks of MEIS1 ChIP in the presence (WT-HOXB13, blue) and absence of HOXB13 (HOXB13-KO, red) at the DCN (2 regions, DCN #1 and DCN #2), LUM, and TFGBR3 loci. (G) ChIP-qPCR of MEIS1 binding using site-specific genomic primers against DCN, LUM, and TGFBR3 loci. MEIS1 binding is significantly diminished when HOXB13 is deleted (HOXB13KO; * indicates p<0.05). (H) Western blot analysis of key genes with significant differential expression in RNA-seq between CWR22Rv1-LV-MEIS1 and control. DCN, TGFBR3, and LUM are direct targets of MEIS1 from ChIP-seq data and ITGB1 is a downstream target of LUM. (I) Gene set enrichment analysis (GSEA) from RNA-seq between CWR22Rv1-LV-MEIS1 and control cells on the oncogenic signatures collection from MSigDB. Enrichment is observed in CWR22Rv-LV-MEIS1 cells for genes known to be suppressed by: active TGFβ signaling (TGFB_UP.V1_DN, NES: 1.43, FDR: 0.039), active EGFR signaling (EGFR_UP.V1_DN, NES: 1.42, FDR: 0.036), active WNT signaling (WNT_UP.V1_DN, NES:1.36, FDR 0.057), and active c-MYC signaling (MYC_UP.V1_DN, NES: 1.43, FDR: 0.045). (J) Heatmaps of expression and unsupervised clustering of RNA-seq from CWR22Rv1 control (purple), LV-MEIS1 (blue), HOXB13ko (green), and HOXB13ko-LV-MEIS1 (orange) cells for all genes in the leading edge of enrichment for each gene set in (G). See also Figure 5—figure supplement 1 and Supplementary files 1–6.
Figure 5—figure supplement 1
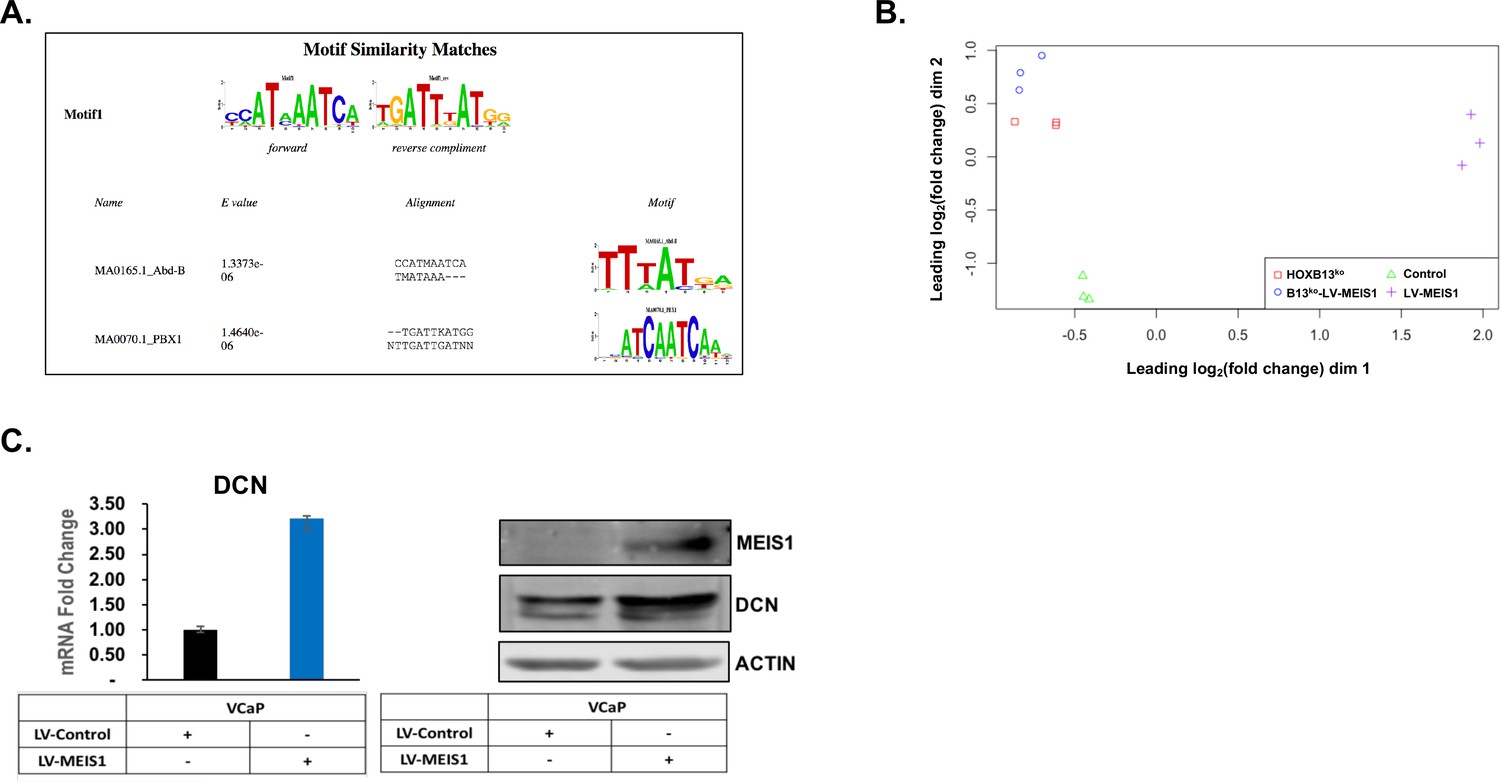
HOXA9 motif shares similarity, RNA-seq MDS plot, and Validation of DCN expression in VCaP.
(A) The web-based tool STAMP for alignment, similarity, and database-matching of DNA motifs was used to identify other motifs that share similarity to the HOXA9 motif inferred in SpaMo analysis of MEIS1 ChIP-seq from HOXB13ko-LV-MEIS1 cells. (B) Multidimensional scaling (MDS) plot generated by edgeR from differential gene expression analysis of RNA-seq shows nice clustering by cell line identity. (C) Western blot of Increased DCN expression resulting from LV-MEIS1 transfection was validated in VCaP cells. Actin was used as a loading control.
Figure 5—figure supplement 2
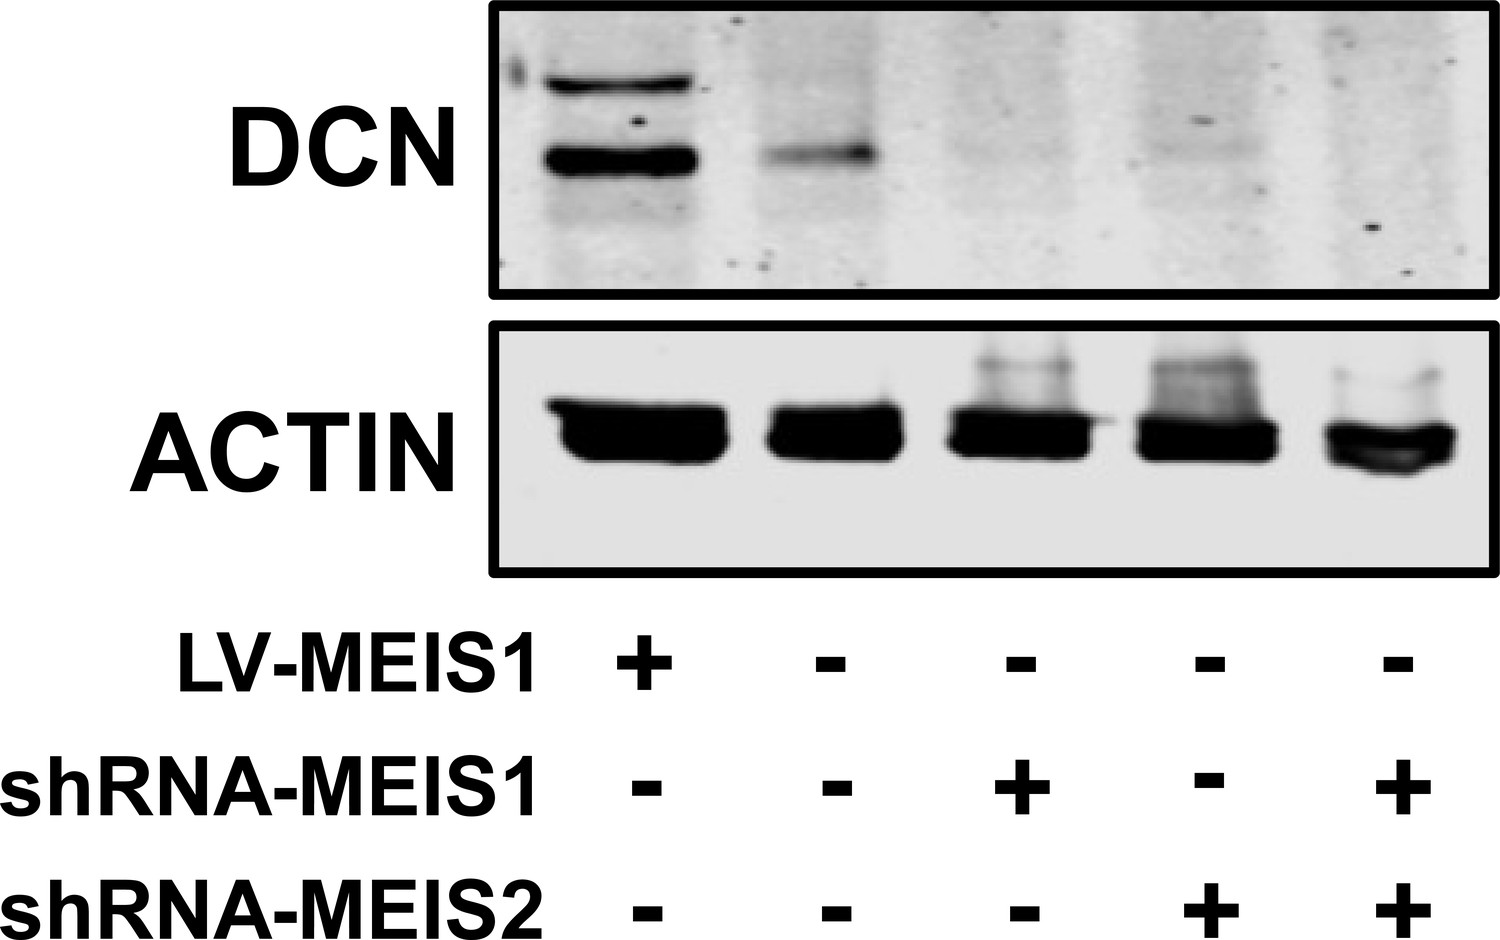
Functional impact of MEIS1 and DCN knockdown in LAPC4.
Western blot of DCN demonstrating decreased DCN protein expression in LAPC4 cells when MEIS1, MEIS2, or both MEIS1 and MEIS2 are depleted using targeted shRNAs. These lines were originally reported in Bhanvadia et al., 2018. Positive control was LAPC4 expressing ectopic MEIS1, and Actin was used as a loading control.
Figure 6 with 1 supplement
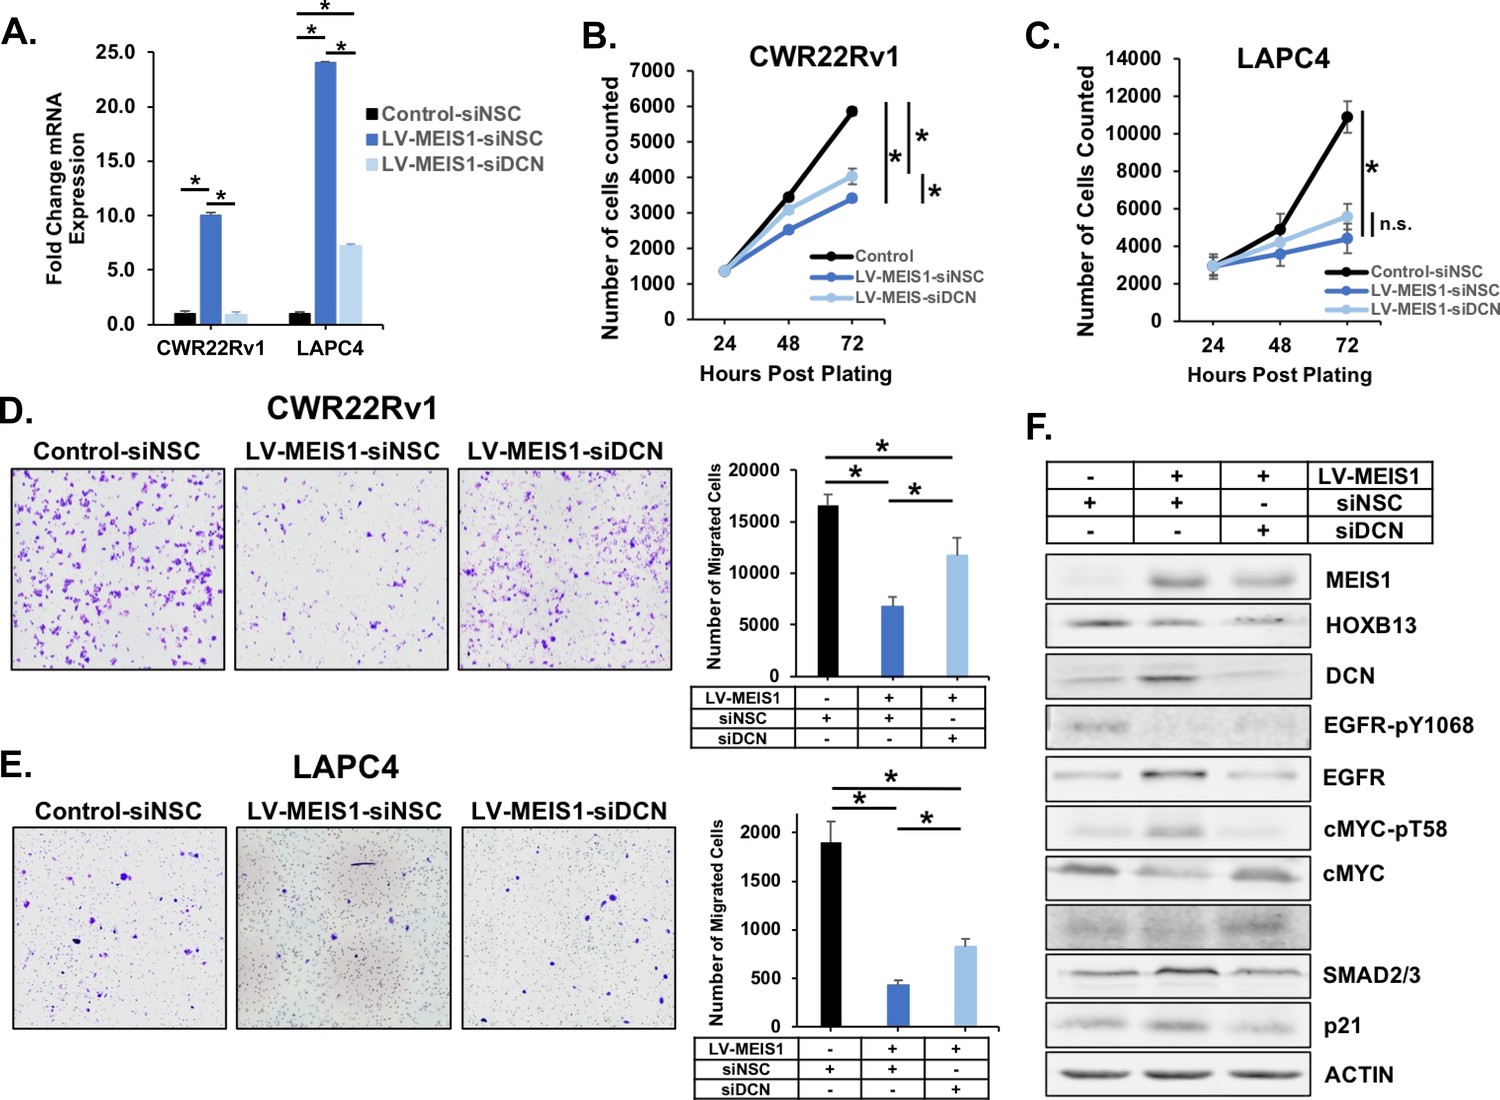
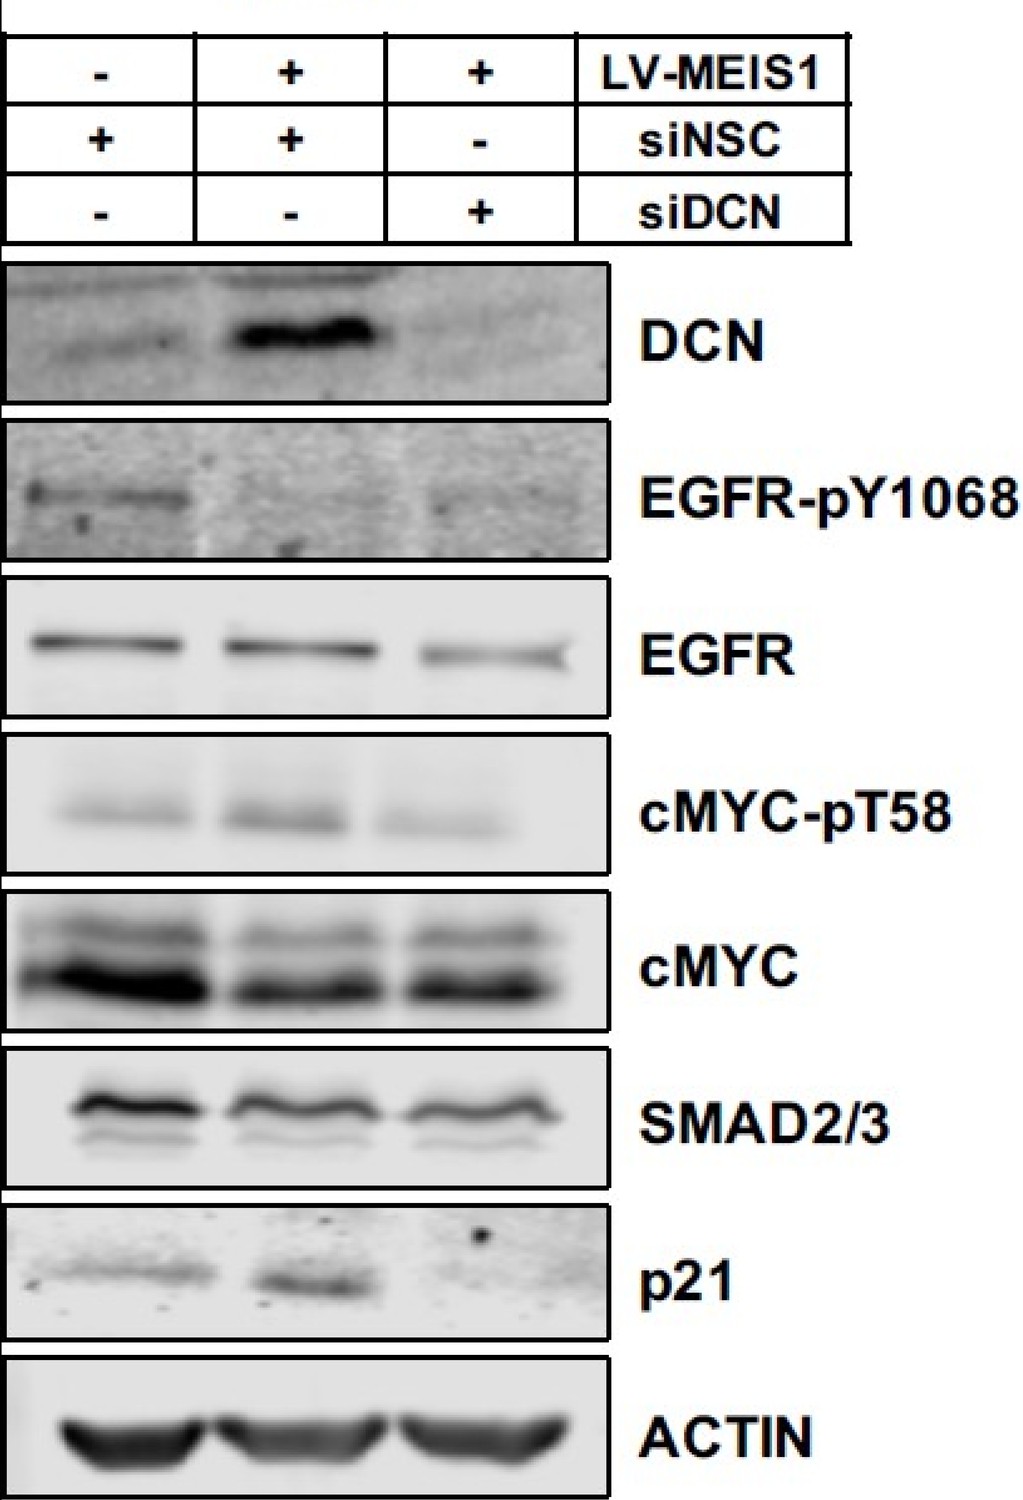
Knockdown of DCN partially reverses MEIS-mediated tumor suppression.
(A) RT-PCR in both CWR22Rv1 and LAPC4 for DCN expression in control (black) and LV-MEIS1 (dark blue) cells treated with a non-silencing control siRNA pool (siNSC, 4 siRNAs in pool) or LV-MEIS1 cells treated with an siRNA pool targeting DCN (light blue) (siDCN, 4 siRNAs in pool). Fold-change from control-siNSC was calculated using ΔΔCq methodology (technical replicates, n = 3). *Student’s t-test p<0.05. (B-C) Proliferation of CWR22Rv1 (B) and LAPC4 (C) cell lines from (A) was assessed using CyQuant direct cell proliferation assay. Data represent mean and SEM at each timepoint (technical replicates, n = 3). (D-E) Representative 10X images (left) and quantitation (right) of transwell migration assay for CWR22rv1 (D) and LAPC4 (E) cell line derivatives (control-siNSC, LV-MEIS1-siNSC, LV-MEIS1-siDCN). Data represent mean and SEM (technical replicates, n = 3). (F) Western blot analysis of MEIS1, HOXB13, DCN, and known downstream targets of DCN in CWR22Rv1 control-siNSC, LV-MEIS1-siNSC, and LV-MEIS1-siDCN. *Student’s t-test p<0.05 for all panels. See also Figure 5—figure supplement 2.
Figure 6—figure supplement 1
Western blot analysis of MEIS1, HOXB13, DCN, and known downstream targets of DCN in LAPC4 control-siNSC, LV-MEIS1-siNSC, and LV-MEIS1-siDCN cells.
Figure 7
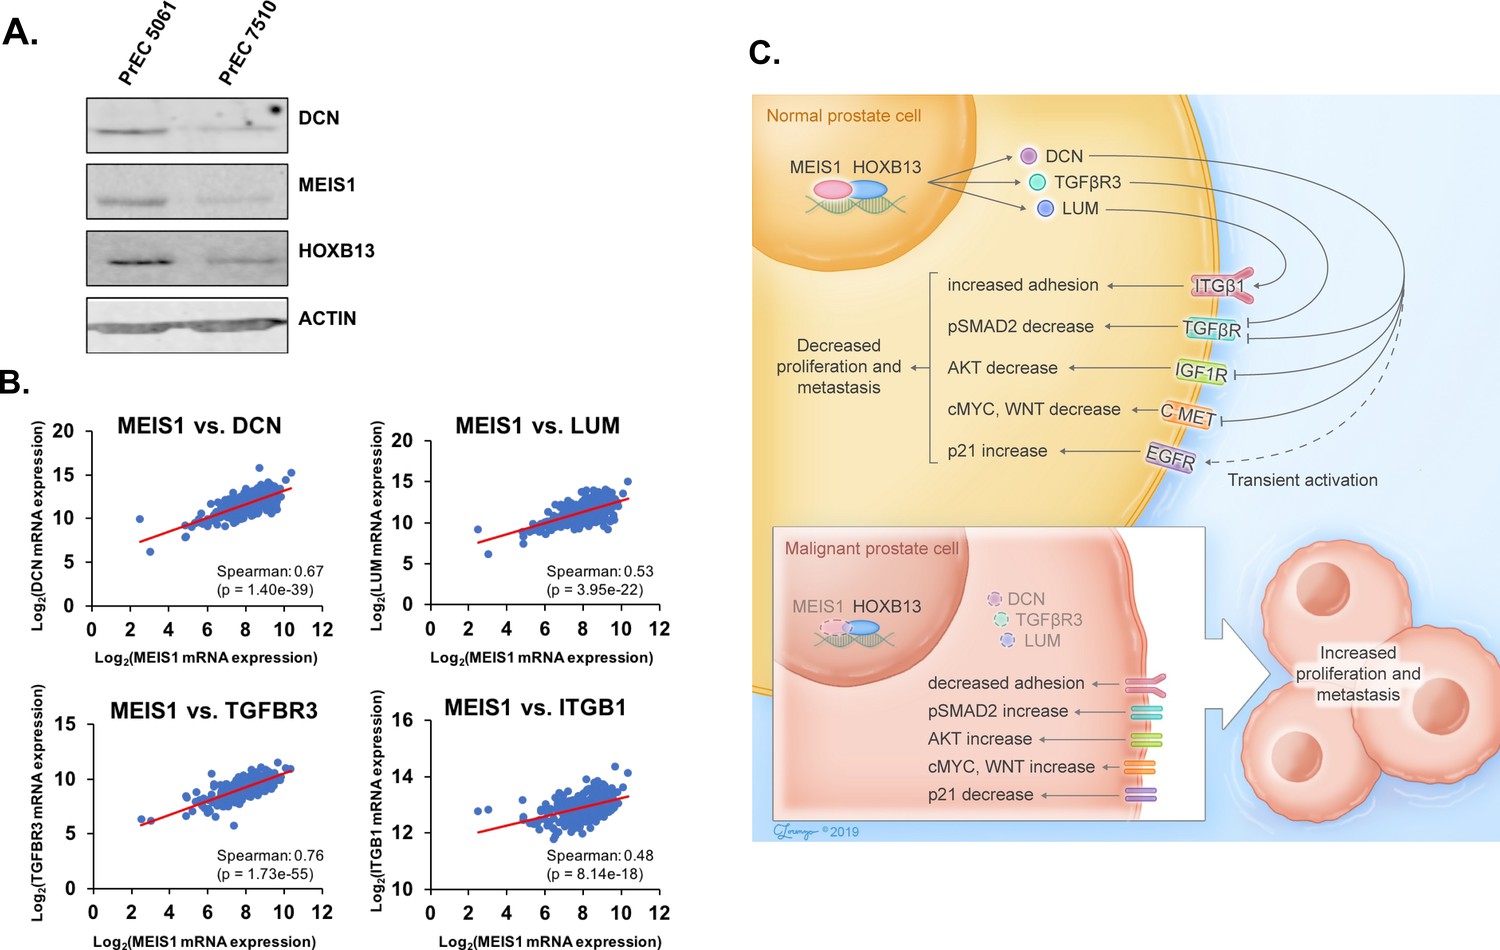
Increased proteoglycan expression within human prostate tumors that retain MEIS1/2 expression.
(A) Western blot analysis of MEIS1 and DCN expression in protein lysates from primary prostate epithelial cells (PrECs). Actin was used as a loading control. (B) Correlation of mRNA expression level of MEIS1 with DCN, TGFBR3, LUM, or ITGB1 in RNA-seq data of prostate tumors from The Cancer Genome Atlas (TCGA; RNA-seq V2 RSEM) (Abeshouse et al., 2015). Analysis was performed using the online tool cBioPortal (Cerami et al., 2012). (C) Schematic of Results. Within normal prostate epithelial cells, MEIS1 complexes with HOXB13 to maintain expression of proteoglycans such as DCN, LUM, and TGFBR3 and repress growth factor and migration/invasion signaling through RTKs. As a cell transforms to a malignant state, MEIS1/2 are epigenetically silenced in more aggressive prostate tumors and expression of tumor-suppressive proteoglycans is suppressed, leading to decreased regulation of oncogenic signaling through pathways such as TGFβ, EGFR, cMYC, WNT, and IGF1R.
Author response image 1

This file contains the HOXB13 binding to DCN and LUM of every publicly available HOXB13 ChIP-seq experiment done in prostate tissue or cell lines.
Every column is a different study or different treatment condition from the same study. The SRX###### number at the top of each column to be taken to more info about the study/experimental design for that HOXB13 ChIP run. The numbers for everything reflect the HOXB13 peak intensity (high number = more confident peak).
Additional files
-
Supplementary file 1
MEIS1 ChIP-seq peaks and annotation in CWR22Rv1 LV-MEIS1, Related to Figure 5.
Peaks identified by MACS2 in LV-MEIS1 ChIP-seq samples vs. input DNA were annotated to the nearest transcription start site (TSS) using HOMER.
- https://cdn.elifesciences.org/articles/53600/elife-53600-supp1-v2.xlsx
-
Supplementary file 2
MEIS1 ChIP-seq peaks and annotation in CWR22Rv1 HOXB13ko-LV-MEIS1, Related to Figure 5.
Peaks identified by MACS2 in HOXB13ko-LV-MEIS1ChIP-seq samples vs. input DNA were annotated to the nearest transcription start site (TSS) using HOMER.
- https://cdn.elifesciences.org/articles/53600/elife-53600-supp2-v2.xlsx
-
Supplementary file 3
Counts per million (CPM) expression of genes in RNA-seq from CWR22Rv1 cell line derivatives, Related to Figure 5.
Adapters and low-quality reads were trimmed before aligning sequences to hg38 transcriptome (ENSEMBL) using kallisto. Transcript counts were then summarized to the gene level with tximport and further analyzed with EdgeR to remove genes with low counts and normalize to library sizes.
- https://cdn.elifesciences.org/articles/53600/elife-53600-supp3-v2.xlsx
-
Supplementary file 4
All significantly differentially expressed genes between CWR22Rv1-LV-MEIS1 and control cells, Related to Figure 5.
TREAT and GLM methodologies in edgeR were used to determine significantly differentially expressed genes (fold-change >±1.5, FDR < 0.05) in LV-MEIS1 vs. control cells.
- https://cdn.elifesciences.org/articles/53600/elife-53600-supp4-v2.xlsx
-
Supplementary file 5
DEGs that are direct targets of MEIS1 only when HOXB13 is present, Related to Figure 5.
Overlap of DEGs between LV-MEIS1 and control cells with ChIP-seq targets from both HOXB13ko and HOXB13ko-LV-MEIS1 cells identified 157 DEGs that are targets of MEIS1 only when HOXB13 is present.
- https://cdn.elifesciences.org/articles/53600/elife-53600-supp5-v2.xlsx
-
Supplementary file 6
GSEA for Gene Ontology: Biological Processes on RNA-seq from LV-MEIS1 and control cells, Related to Figure 5.
The top 20 enriched gene sets from CWR22Rv1 RNA-seq of GSEA on the Gene Ontology: Biological Processes collection from MSigDB.
- https://cdn.elifesciences.org/articles/53600/elife-53600-supp6-v2.xlsx
-
Supplementary file 7
Key resources table.
- https://cdn.elifesciences.org/articles/53600/elife-53600-supp7-v2.docx
-
Transparent reporting form
- https://cdn.elifesciences.org/articles/53600/elife-53600-transrepform-v2.pdf
Download links
A two-part list of links to download the article, or parts of the article, in various formats.
Downloads (link to download the article as PDF)
Open citations (links to open the citations from this article in various online reference manager services)
Cite this article (links to download the citations from this article in formats compatible with various reference manager tools)
MEIS-mediated suppression of human prostate cancer growth and metastasis through HOXB13-dependent regulation of proteoglycans
eLife 9:e53600.
https://doi.org/10.7554/eLife.53600


