Lin28a/let-7 pathway modulates the Hox code via Polycomb regulation during axial patterning in vertebrates
- Department of Systems BioMedicine, Graduate School of Medical and Dental Sciences, Tokyo Medical and Dental University, Japan
- Department of Systems BioMedicine, National Research Institute for Child Health and Development, Japan
- Research Fellow of Japan Society for the Promotion of Science, Japan
- Research Core, Tokyo Medical and Dental University, Japan
- Laboratory of Metabolism, National Institutes of Health, United States
- Laboratory of Animal Regeneration Systemology, Meiji University, Japan
- Department of Medical Chemistry, Shiga University of Medical Science, Japan
- Department of Anatomy and Embryology, University of Tsukuba, Japan
- Department of Clinical Anatomy, Graduate School of Medical and Dental Sciences, Tokyo Medical and Dental University, Japan
- Reproduction Center, Yokohama City University, Japan
- AMED-CREST, Japan Agency for Medical Research and Development (AMED), Japan
- Department of Molecular Medicine, The Scripps Research Institute, United States
Figures
Figure 1 with 2 supplements

Skeletal patterning defects in Lin28a-/- mice.
(A) Whole-mount in situ hybridization of Lin28a in E9.5–11.5 embryos. (B) Lateral views of Wt (left panel) and Lin28a–/– mice (right panel) at E16.5. White arrow, the tip of the tail; white arrowhead, forelimb position; asterisk, hindlimb position. (C) Whole-mount in situ hybridization of Myog and FGF8 in E10.5 embryos. The numbers indicate the expression domains of Myog. White arrowhead, the starting position of the hindlimb bud; black arrowhead, the ending position of the hindlimb bud. (D–H) Representative skeletal preparations of Wt (left panels) and Lin28a–/– mice (right panels). Abbreviations/marks are described below. Lateral views of cervical and upper thoracic vertebrae (D); anterior views of the atlas and the axis (E); ventral views of the ribcage (F); dorsal views of thoracic vertebrae and ribs (G); and dorsal views of lumbar and sacral vertebrae (H) are shown. (I) Schematic diagram of skeletal phenotypes in Lin28a-/- mice. Each abbreviation in (D–I) indicates as follows: C1–C7, 1st to 7th cervical vertebrae; T1-T13, 1st and 13th thoracic vertebrae; R1–R13, 1st to 13th ribs; L1–L6, 1st to 6th lumbar vertebrae; S1–S4, 1st to 4th sacral vertebrae; Ca1, 1st caudal vertebrae. Black arrows in (D–E) indicate anterior arch of the atlas. Asterisks in (F–I) indicate the sites where skeletal deformations occurred.
Figure 1—figure supplement 1

Generation of Lin28a–/– mice.
(A) Schematic diagram of the Lin28a gene-targeting construct. The small light-blue box indicates the 5’ and 3’ untranslated regions (UTRs), and the large light-blue box indicates the coding region. Arrows (1–3) show the genomic PCR primers used for genotyping. 5’ and 3’ arms, 5’ and 3’ homology arms; Neo, PGK promoter and neomycin-resistance gene; DTA, diphtheria toxin A chain. (B) Genotyping via PCR of Lin28a mutants. The Wt allele produced PCR products of about 400 bp, whereas the targeted allele yielded products of about 750 bp. (C) Western blot analysis of Lin28a in E9.5 whole embryos. β-actin is shown as a loading control.
Figure 1—figure supplement 2
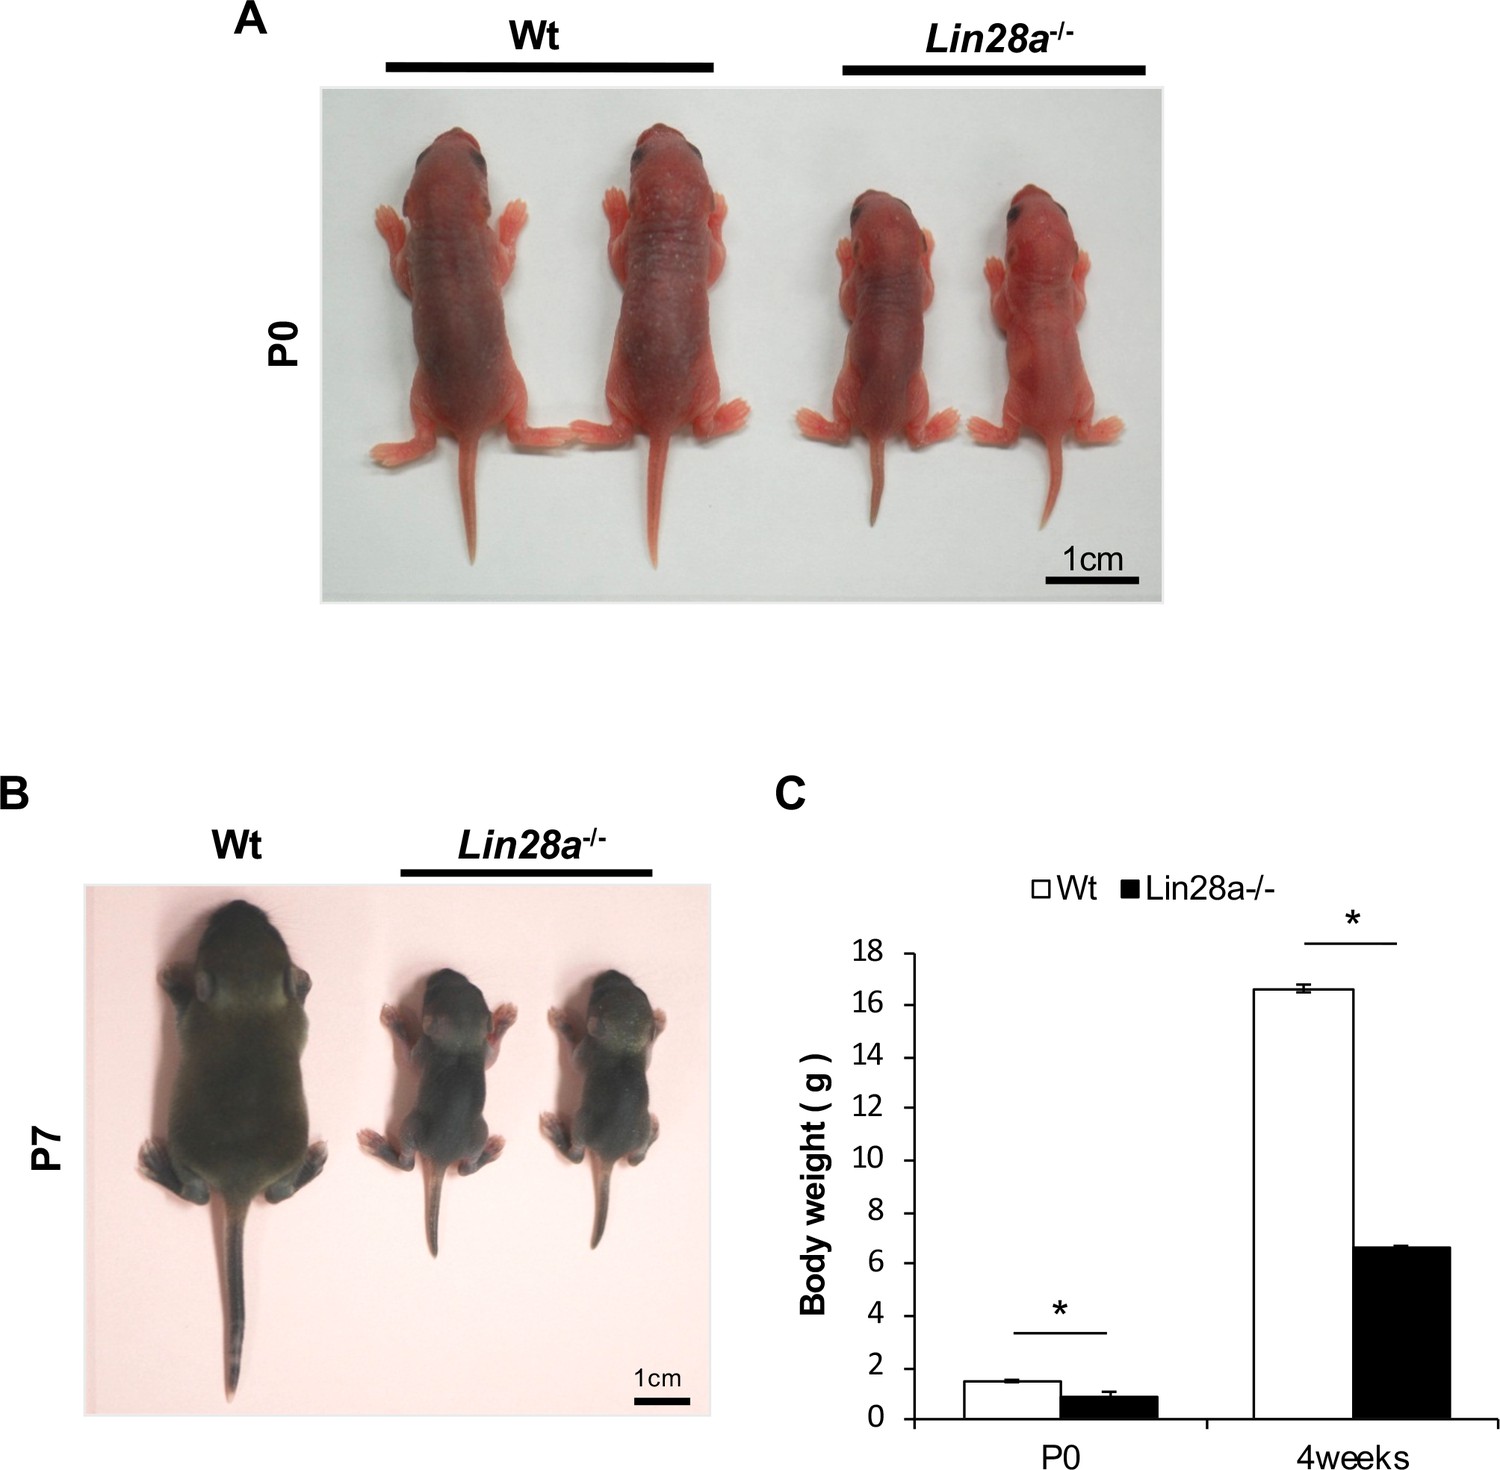
Lin28a–/– mice exhibit growth defects.
(A, B) Appearance of Wt and Lin28a–/– mice. Representative Wt (left) and Lin28a–/– (right) pups at P0 (A) and P7 (B) are shown. (C) Body weight of Wt and Lin28a–/– mice. Data are expressed as the mean ± SEM (n = 4). *p<0.05.
Figure 2 with 2 supplements

Hox gene dysregulation in Lin28a-/- mice.
(A) q-PCR analyses of all Hox genes. All data are expressed as the mean ± standard error of the mean (SEM) (n = 3). *p<0.05. (B) Whole-mount in situ hybridization of Hox genes in E11.5 embryos. Lateral views (top panels) and dorsal views (bottom panels) of hindlimb and tail region are shown. Black arrowhead, anterior domain of Hox gene; HL, hindlimb; dashed line, hindlimb position; two-way arrow, distance from the hindlimb to the anterior domain of Hoxc13. (C) Histological analysis of E12.5 animals. Alcian blue staining (top panels) and in situ hybridization of Hoxc13 (bottom panels) are shown. (D) Skeletal preparations of Wt (left panel) and Lin28a+/– mice (right panel) that received RA treatment. R1–R13, 1st to 13th ribs; asterisk, the ablation of the 13th rib. See also Figure 2—figure supplement 2. (E) Summary of Hox gene dysregulation in Lin28a mutants.
-
Figure 2—source data 1
Source data related to panel (A).
- https://cdn.elifesciences.org/articles/53608/elife-53608-fig2-data1-v1.xlsx
Figure 2—figure supplement 1
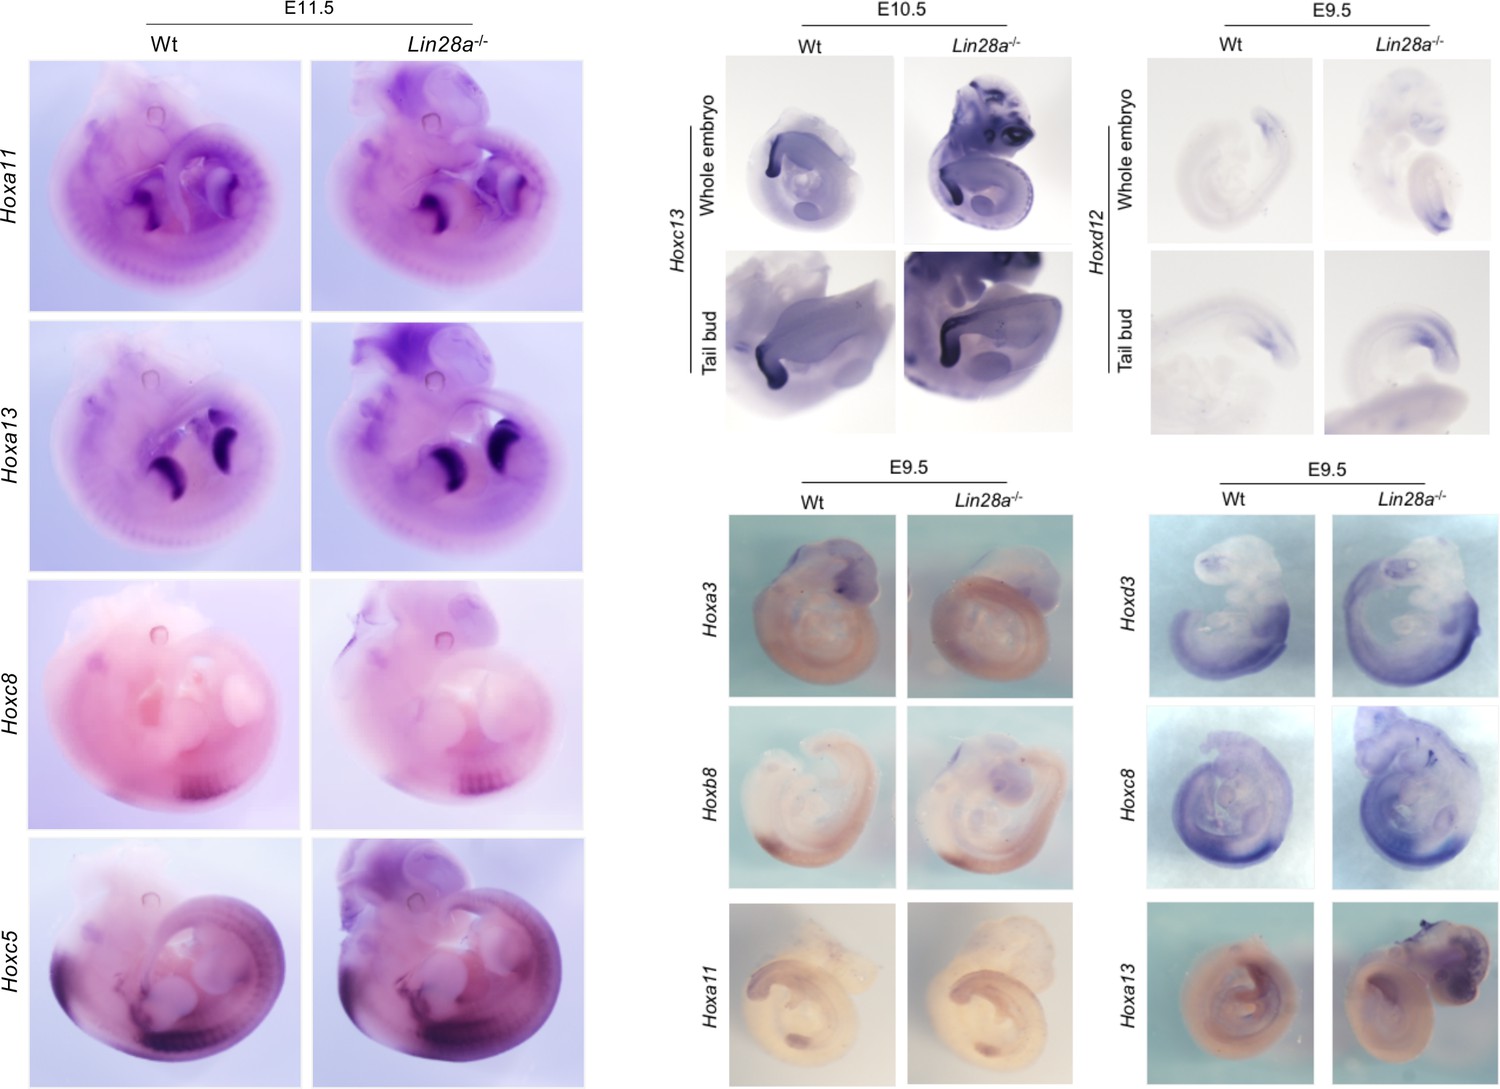
Whole-mount in situ hybridization of Hox genes in Lin28 knockout embryos (Related to Fig.
Figure 2B). Whole-mount in situ hybridization of Wt and Lin28a–/– mice embryos at E9.5 (using Hoxa3, Hoxd3, Hoxb8, Hoxc8, Hoxa11, Hoxd12 and Hoxa13 probes), at E10.5 (using Hoxc13 probe) and at E11.5 (using Hoxc5, Hoxc8, Hoxa11 and Hoxa13 probes).
Figure 2—figure supplement 2

RA sensitivity in Lin28a mutant mice.
(A) Dorsal views of thoracic vertebrae and ribs of RA-treated Lin28a–/– mice. R1–R12, 1st to 12th ribs. The asterisk indicates the ablation of the 13th rib. (B–F) Lateral view of cervical and upper thoracic vertebrae of each genotype treated with RA. C1–C7, 1st to 7th cervical vertebrae; T1, 1st thoracic vertebra. The dotted lines from left to right show the exoccipital bone and C1 and C2, respectively. C1’ and C2’ show fusion and morphological changes of C1 and C2, respectively. C1′‘indicates an additional C1 vertebra.
Figure 3 with 2 supplements
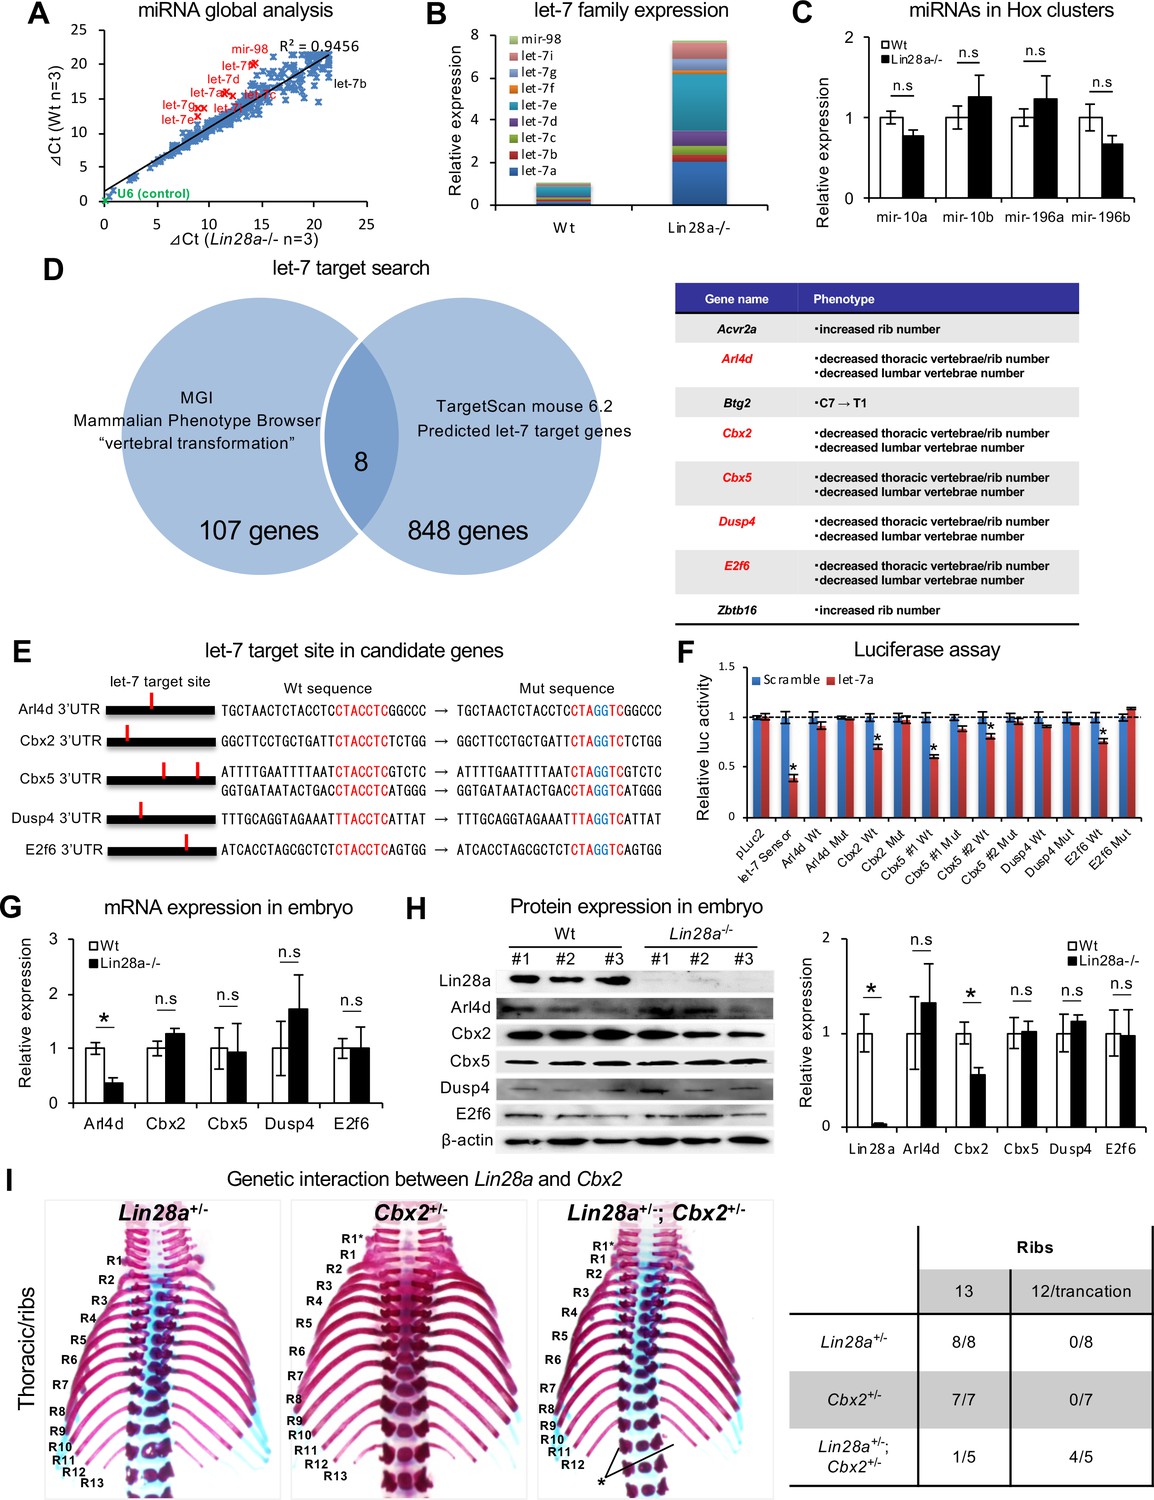
Let-7 targets the polycomb gene directly.
(A) Comparison of microRNA expression in Wt and Lin28a–/– embryos at E9.5. (B, C) q-PCR analyses of let-7-family members (B) and Hox-embedded microRNAs (C). In (B), data are expressed as the mean (n = 3), and the relative amount of total let-7 microRNAs is shown. (D) let-7 target search with TargetScan and Phenotype Browser. (E) The let-7 target site in the 3’UTR sequence of candidate genes. The let-7 seed-matched sequence and mutated sequence are shown in red and blue, respectively. (F) Luciferase reporter activity in the presence/absence of the let-7 target site in 3’UTR sequence. (G–H) qPCR and western blot analyses of candidate genes. (I) Dorsal views of thoracic vertebrae and ribs. Single heterozygous mutants (left and middle panels) and a double heterozygous mutant (right panel) are shown. R1–R13, 1st to 13th ribs; asterisk, the ablation or truncation of the 13th rib. See also Figure 3—figure supplement 1. (J) Frequency of rib defects in mutant mice. All data are expressed as the mean ± SEM (n = 3). *p<0.05. n.s., not significant.
-
Figure 3—source data 1
Source data related to panel A-C, and F-H.
- https://cdn.elifesciences.org/articles/53608/elife-53608-fig3-data1-v1.xlsx
Figure 3—figure supplement 1
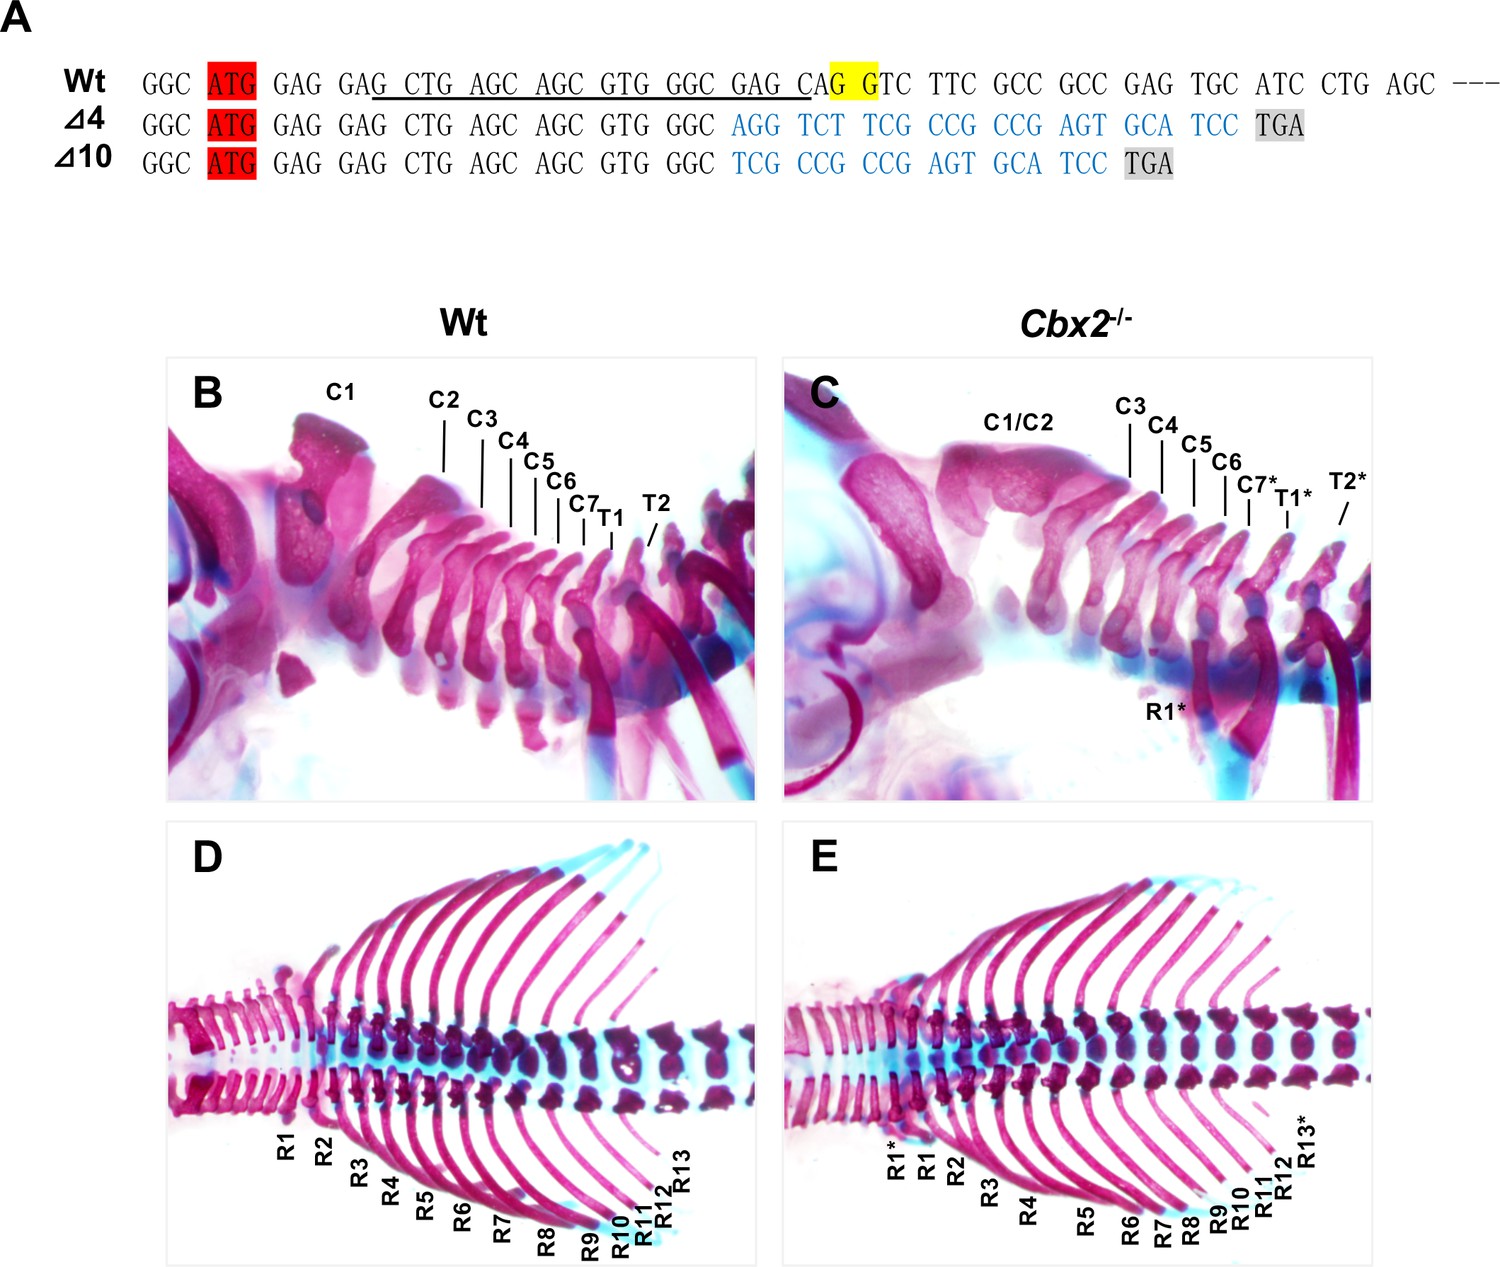
Skeletal defects in Cbx2 mutant mice.
(A) Cbx2 targeting and the sequence of Cbx2 mutants. The start codon of Cbx2 is highlighted in red and the PAM sequence for hCas9 is highlighted in yellow. Targeting sequences are underlined. The predicted stop codons in mutants are highlighted in gray. (B–E) Skeletal preparations of Wt and Cbx2–/– mice. Lateral views of cervical and upper thoracic vertebrae (B, C) and dorsal views of thoracic vertebrae and ribs (D, E) are shown. C1–C7, 1st to 7th cervical vertebrae; T1 and T2, 1 st and 2nd thoracic vertebrae; R1–R13, 1st to 13th ribs; C1/C2, fusion of C1 and C2; the asterisks indicate the posterior transformation of vertebrae.
Figure 3—figure supplement 2
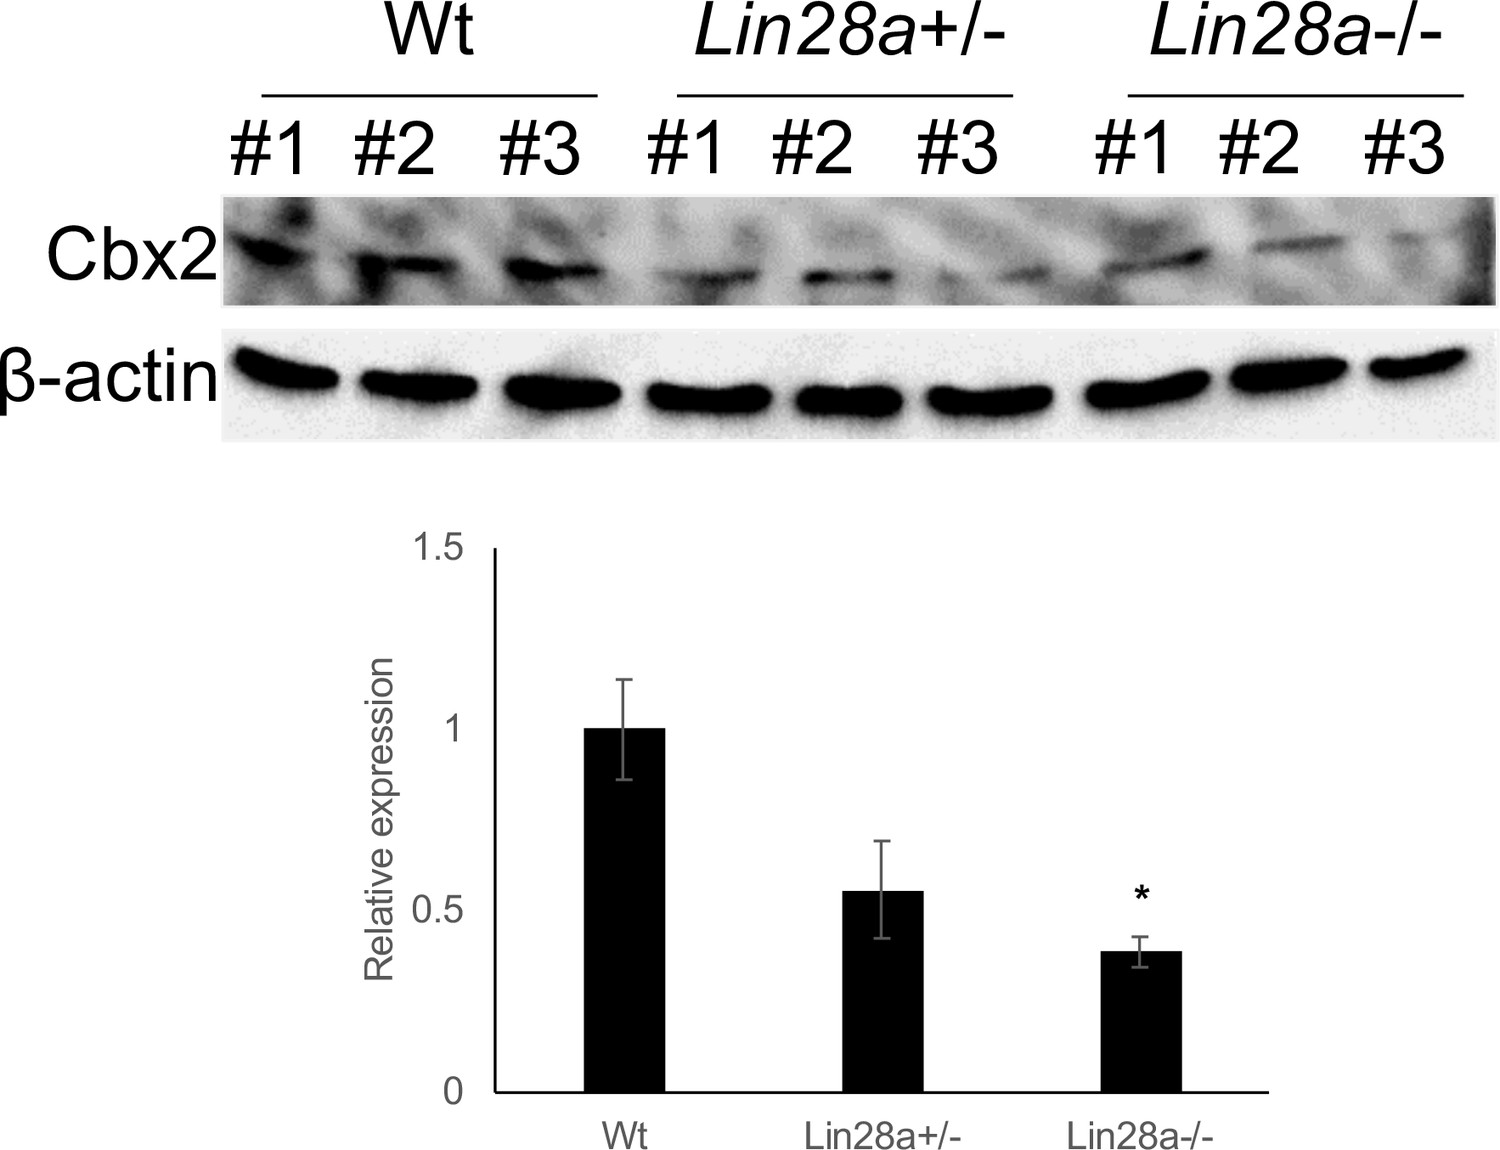
Expression level of Cbx2 in Lin28a mutant embryo.
Change in the expression of Cbx2 in Lin28a+/– and Lin28a–/– mice E9.5 embryos were detected by western blot analyses. β-actin is shown as a loading control. All data are expressed as the mean ± SEM (n = 3).
Figure 4
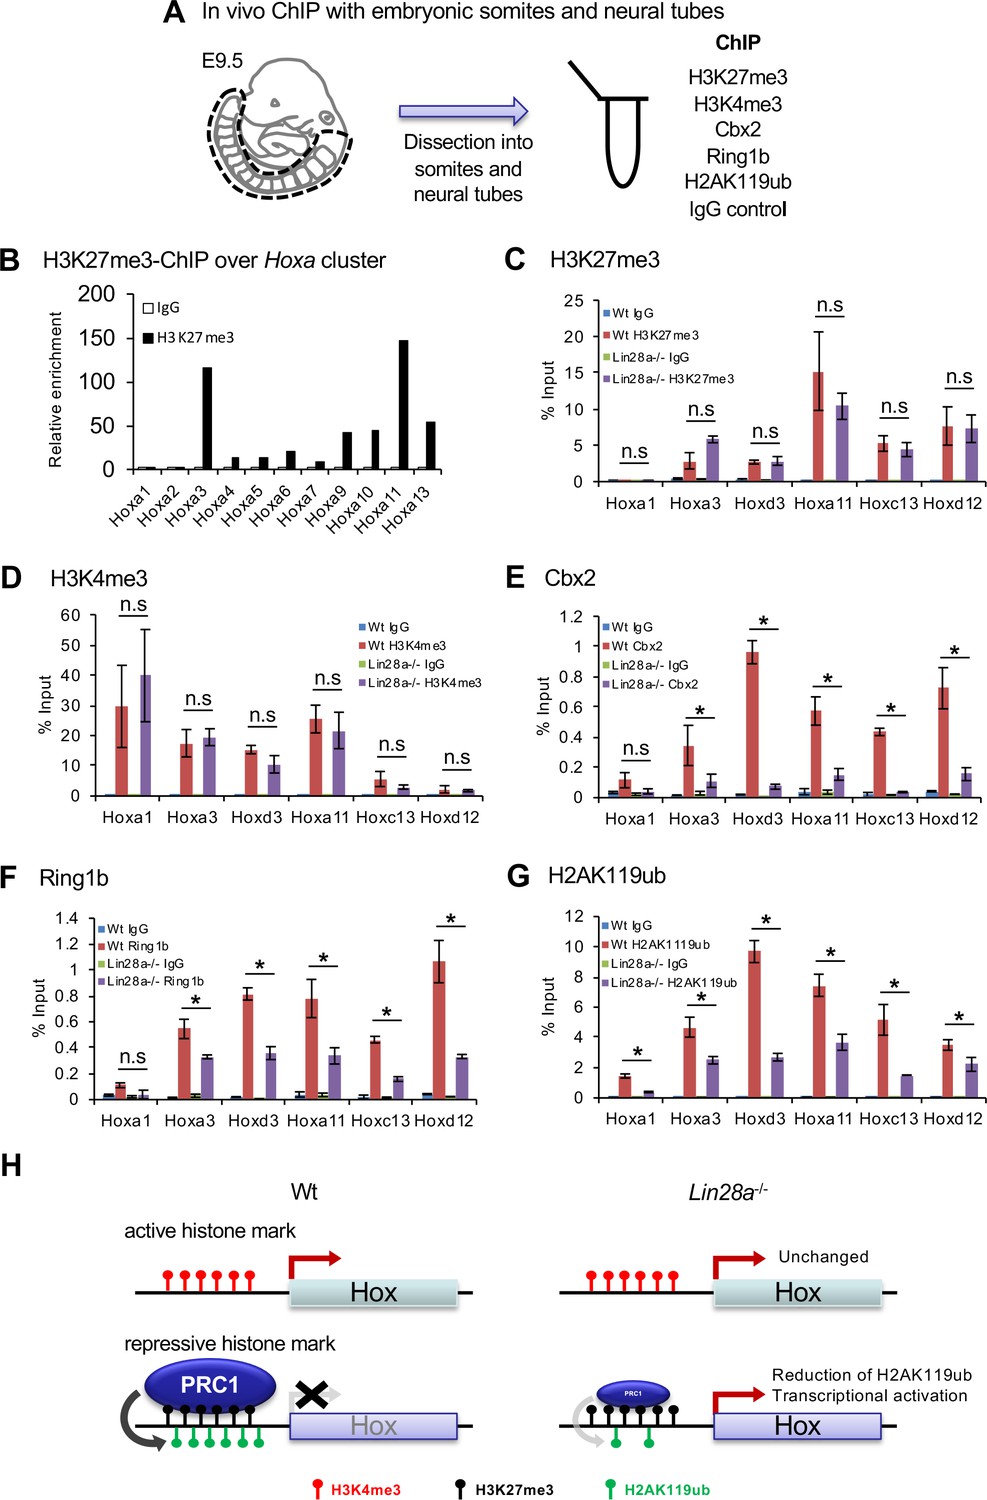
Histone modifications and polycomb occupancy at Hox loci in Lin28a-/- mice.
(A) Schematic diagram of the experimental procedure for ChIP analysis. (B) ChIP and q-PCR analyses of H2K27me3 in Hox A cluster genes in Wt embryos. (C–G) ChIP and q-PCR analyses of H3K27me3 (C), H3K4me3 (D), Cbx2 (E), Ring1b (F), and H2AK119ub (G). Percentages of immunoprecipitated DNA compared with the input are shown. (H) Summary of the chromatin state of Hox loci in Wt and Lin28a–/– embryos. All data are expressed as the mean ± SEM (n = 3). *p<0.05. n.s., not significant.
-
Figure 4—source data 1
Source data related to panel B-G.
- https://cdn.elifesciences.org/articles/53608/elife-53608-fig4-data1-v1.xlsx
Figure 5
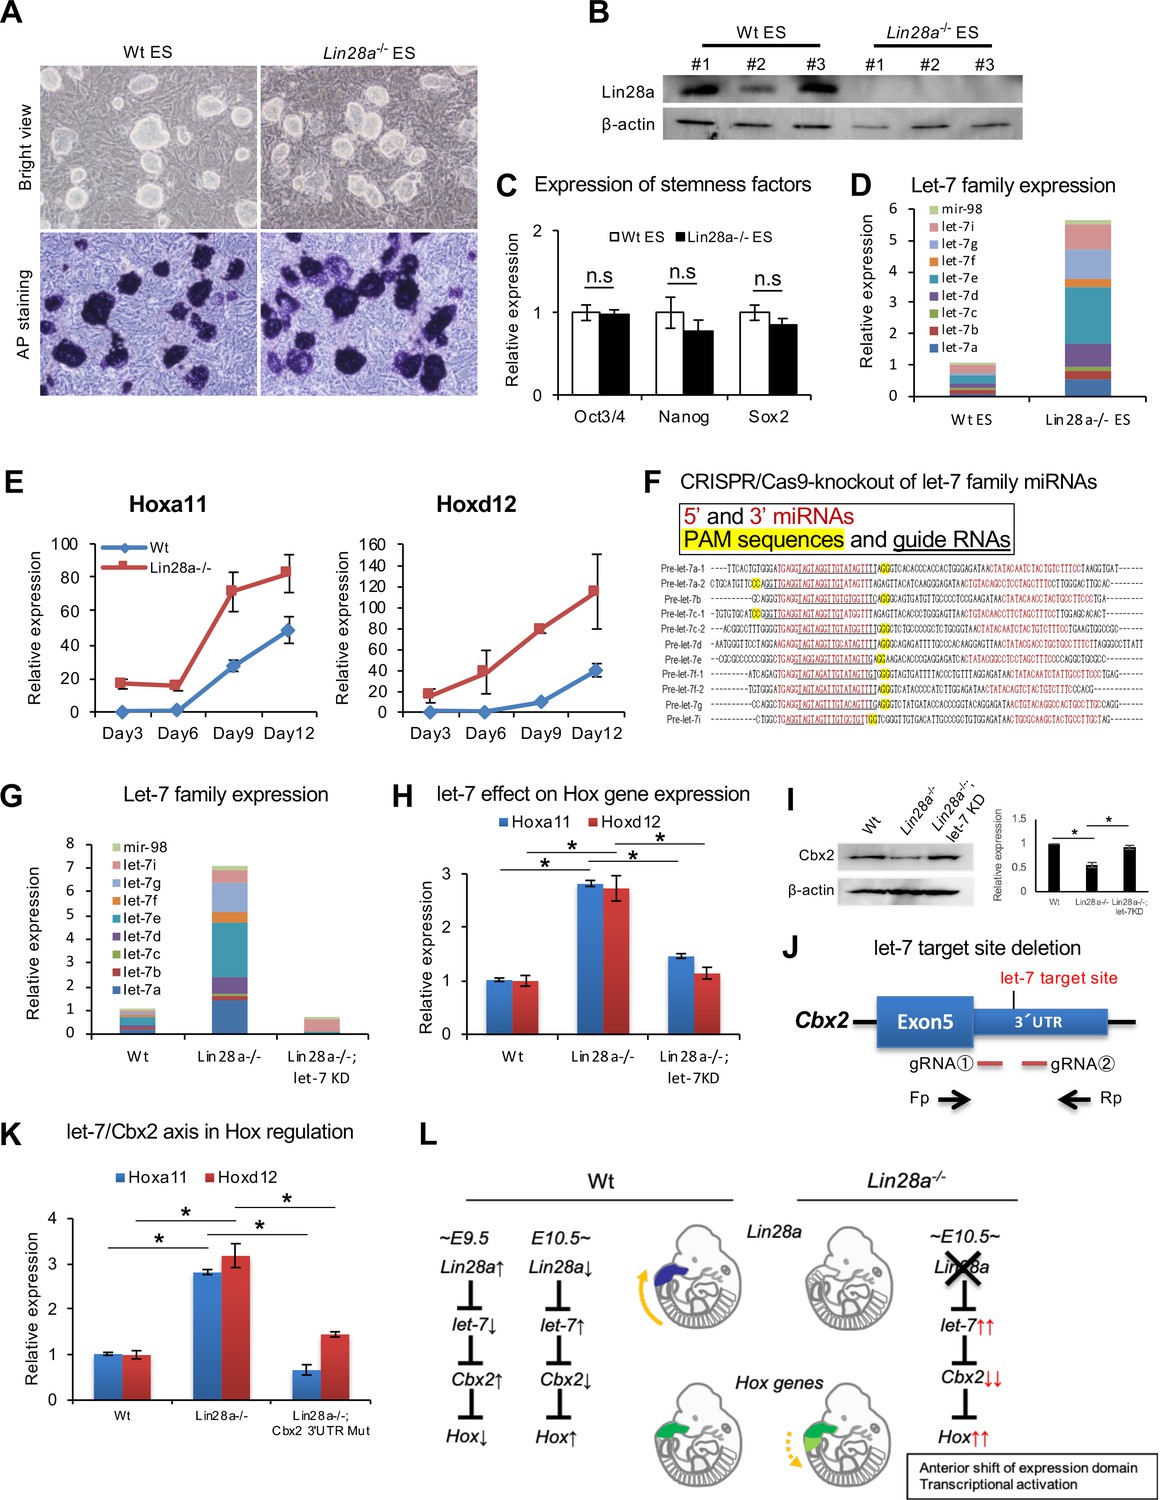
Knockdown of let-7 can reverse Hox gene dysregulation.
(A) Morphology (top panels) and alkaline phosphatase activity (bottom panels) of Wt and Lin28a–/– ES-like cells. (B) Western blot analysis of Lin28a in ES-like cells. β-actin is shown as a loading control. (C) q-PCR analysis of stemness factors. (D) q-PCR analysis of let-7-family members. The level of expression relative to total let-7 amount in Wt is shown. (E) q-PCR analyses of Hoxa11 and Hoxd12 over a time course of 3, 6, 9, 12 days following embryoid body formation. (F) Precursor sequences of let-7-family members and guide RNAs for let-7 targeting Let-7 mature microRNAs are shown in red. The protospacer adjacent motif (PAM) sequence for hCas9 is highlighted in yellow, and targeting sequences are underlined. (G) Let-7 expression in Wt, Lin28a–/– and Lin28a–/–; let-7 KD cells. The level of expression relative to total let-7 amount in Wt is shown. (H) Let-7 knockdown rescues Hox gene dysregulation in Lin28a–/– cells. (I) Cbx2 expression level of Wt, Lin28a–/– and Lin28a–/–; let-7 KD derived EBs. β-actin is shown as a loading control. (J) Schematic diagram of let-7 target site deletion from Cbx2 3’UTR and genotyping via PCR of mutant clones. (K) q-PCR analyses of Hoxa11 and Hoxd12 following embryoid body formation. (L) Schematic diagram of Lin28a/let-7 mediated Hox gene regulation. All data are expressed as the mean ± SEM (n = 3). n.s., not significant.
-
Figure 5—source data 1
Source data related to panel C-E, G-H, and K.
- https://cdn.elifesciences.org/articles/53608/elife-53608-fig5-data1-v1.xlsx
Tables
Table 1
Summary of skeletal abnormalities in Lin28a mutant mice.
| Anterior arch of the atlas* | Ribs† | Sternum attachment‡ | Lumbar§ | |||||
|---|---|---|---|---|---|---|---|---|
| 13 | 12 | 7 | 61 | 6 | 5 | L6/S1* | ||
| Wt(n = 16) | 0 | 16 (100%) | 0 | 16 (100%) | 0 | 7 (43.8%) | 8 (50%) | 1 (6.2%) |
| Lin28a+/-(n = 19) | 4 (21.1%) | 19 (100%) | 0 | 19 (100%) | 0 | 0 | 18 (94.7%) | 1 (5.3%) |
| Lin28a-/- (n = 14) | 9 (64.3%) | 0 | 14 (100%) | 0 | 14 (100%) | 0 | 9 (64.3%) | 5 (35.7%) |
-
The percentages of each phenotype are shown in parenthesis.
* The anterior arch of the atlas was formed from C2 or via fusion.
-
† Total number of pairs of ribs.
‡ Total number of pairs of true ribs that were attached to the sternum.
-
§ Total number of lumbar vertebrae. L6/S1* indicates an abnormal sacral vertebra that had morphological features of a lumbar vertebra on only one side.
Key resources table
| Reagent type (species) or resource | Designation | Source or reference | Identifiers | Additional information |
|---|---|---|---|---|
| Antibody | anti-Arl4d | Santa Cruz | SC-271274 | mouse monoclonal antibody, for western blot, at 1:500 |
| Antibody | anti-b-actin | Sigma | A5316 | mouse monoclonal antibody, for western blot, at 1:2000 |
| Antibody | anti-Cbx2 | Abcam | ab80044 | Rabbit polyclonal antibody, for western blot, at 1:500 |
| Antibody | anti-CBX2 | Bethyl Laboratories | A302-524A | Rabbit polyclonal antibody, for ChIP |
| Antibody | anti-Cbx5 | Cell Signaling Technology | #2616S | Rabbit polyclonal antibody, for western blot, at 1:1000 |
| Antibody | anti-DIG-AP Fab fragment antibody | Roche | 1-093-274 | sheep polyclonal antibody, for in situ hybridization |
| Antibody | anti-Dusp4 (MKP-2) | Santa Cruz | SC-1200 | Rabbit polyclonal antibody, for western blot, at 1:250 |
| Antibody | anti-E2f6 | Santa Cruz | SC-8366 | goat polyclonal antibody, for western blot, at 1:500 |
| Antibody | anti-Lin28a | Cell Signaling Technology | #3978S | Rabbit polyclonal antibody, for western blot, at 1:1000 |
| Antibody | anti-mouse IgG HRP-conjugated | Sigma | A2304 | goat affinity isolated antibody, for western blot, at 1:2000 |
| Antibody | anti-rabbit IgG HRP-conjugated | Sigma | A6154 | goat affinity isolated antibody, for western blot, at 1:2000 |
| Antibody | anti-trimethyl-histone H3 (Lys27) | Millipore | #07–449 | Rabbit Polyclonal Antibody, for ChIP |
| Antibody | anti-trimethyl-histone H3 (Lys4) | Millipore | #07–473 | Rabbit Polyclonal Antibody,for ChIP |
| Antibody | normal rabbit IgG | Santa Cruz | SC-2027 | Rabbit Polyclonal Antibody, for ChIP |
| Antibody | RING1B (D22F2) XP rabbit monoclonal antibody (mAb) | Cell Signaling Technology | #5694S | rabbit monoclonal antibody, for ChiP |
| Cell Lines | HEK293T cells | ATCC | RRID:CVCL_0063 | |
| Cell Lines | Wt or Lin28a-/-ES like cells | Materials and methods section | N/A | |
| Chemical compound, drug | 2-mercaptoethanol | Gibco | #21985023 | |
| Chemical compound, drug | acetic anhydride | Wako | #011–00276 | |
| Chemical compound, drug | Alcian Blue | Sigma | A5268-10G | |
| Chemical compound, drug | Alizarin Red S | Sigma | A5533-25G | |
| Chemical compound, drug | Chaps | Dojindo Molecular Technologies | 349–04722 | |
| Chemical compound, drug | CHIR 99021 | Wako | 034–23103 | |
| Chemical compound, drug | Fast Green FCF | Sigma | F7258-25G | |
| Chemical compound, drug | Fast Red Violet LB Salt | Sigma | F3381-5G | |
| Chemical compound, drug | formamide | Sigma | SIGF5786 | |
| Chemical compound, drug | G-418 Sulfate | Wako | 074–05963 | |
| Chemical compound, drug | glycine | Wako | #077–00735 | |
| Chemical compound, drug | heparin | Nacalai Tesque | 17513–96 | |
| Chemical compound, drug | NBT/BCIP | Roche | #1697471 | |
| Chemical compound, drug | PD0325901 | Wako | 162–25291 | |
| Chemical compound, drug | PFA | Wako | #162–16065 | |
| Chemical compound, drug | Retinoic acid (all-trans) | Wako | 182–01111 | |
| Chemical compound, drug | sodium pyruvate | Gibco | #11360070 | |
| Chemical compound, drug | triethanolamine | Wako | 142–05625 | |
| Commercial assay, kit | Chemi-Lumi One | Nacalai Tesque | #07880 | |
| Commercial assay, kit | DirectPCR Lysis reagent | Viagen Biotech | #102 T | |
| Commercial assay, kit | ExoSAP-IT Express PCR Cleanup Reagents | ThermoFisher scientific | #75001 | |
| Commercial assay, kit | FugeneHD | Promega | E2312 | |
| Commercial assay, kit | GoTaq Flexi DNA Polymerase | Promega | M8298 | |
| Commercial assay, kit | Lipofectamine 2000 | Invitrogen | #11668019 | |
| Commercial assay, kit | MegaClear Transcription Clean-Up Kit | Invitrogen | AM1908 | |
| Commercial assay, kit | mMESSAGE mMACHINE T7 Kit | Invitrogen | AM1344 | |
| Commercial assay, kit | SuperSignal West Femto Maximum Sensitivity Substrate | Thermo Fisher Scientific | #34095 | |
| Commercial assay, kit | SYBR Green PCR Master Mix | Applied Biosystems | #4309155 | |
| Commercial assay, kit | TaqMan MicroRNA Assays | Applied Biosystems | let-7a (#000377), let-7b (#002619), let-7c (#000379), let-7d (#002283), let-7e (#002406), let-7f (#000382), let-7g (#002282), let-7i (#002221), mir-98 (#000577), mir-10a (#000387), mir-10b (#002218), mir-196a (#241070), mir-196b (#002215), RNU6B (#001093) | |
| Commercial assay, kit | TaqMan Rodent MicroRNA Array A and B | Applied Biosystems | #4398979 | |
| Commercial assay, kit | TaqMan Rodent MicroRNA Array B | Applied Biosystems | #4398980 | |
| Commercial assay, kit | TaqMan Universal Master Mix II, no UNG | Applied Biosystems | #4440040 | |
| Commercial assay, kit | the TaqMan MicroRNA Reverse Transcription kit | Applied Biosystems | #4366597 | |
| Peptide, recombinant protein | ESGRO Recombinant Mouse LIF Protein | Merck Millipore | ESG1107 | |
| Peptide, recombinant protein | Proteinase K recombinant PCR Grade | Roche | 03-115-887-001 | |
| Strains | Cbx2 deficient mice | Materials and methods section | N/A | |
| Strains | Lin28a deficient mice | Materials and methods section | N/A | |
| Strains | Meox2 Cre | The Jackson Laboratory | N/A | |
| Other | Dulbecco’s Modified Eagle’s medium (DMEM) | Sigma | D5796 | |
| Other | Glutamax | Gibco | #35050061 | |
| Other | Immobilon | Millipore | WBKLS0100 | |
| Other | nonessential amino acids (NEAAs) | Gibco | #11140050 | |
| Other | sheep serum | Thermo Fisher Scientific | 535–81301 | |
| Other | skim milk | Wako | #190–12865 | |
| Other | tRNA | Roche | 109–495 |
Additional files
-
Supplementary file 1
Survival rate of Lin28a mutant mice at various stages.
- https://cdn.elifesciences.org/articles/53608/elife-53608-supp1-v1.docx
-
Transparent reporting form
- https://cdn.elifesciences.org/articles/53608/elife-53608-transrepform-v1.docx
Download links
A two-part list of links to download the article, or parts of the article, in various formats.
Downloads (link to download the article as PDF)
Open citations (links to open the citations from this article in various online reference manager services)
Cite this article (links to download the citations from this article in formats compatible with various reference manager tools)
Lin28a/let-7 pathway modulates the Hox code via Polycomb regulation during axial patterning in vertebrates
eLife 9:e53608.
https://doi.org/10.7554/eLife.53608


