Enhancer architecture sensitizes cell specific responses to Notch gene dose via a bind and discard mechanism
- Graduate Program in Molecular and Developmental Biology, Cincinnati Children's Hospital Research Foundation, United States
- School of Neurobiology, Biochemistry and Biophysics, George S. Wise Faculty of Life Science, Tel Aviv University, Israel
- Division of Developmental Biology, Cincinnati Children’s Hospital, United States
- Department of Biomedical Engineering, University of Cincinnati, United States
- Department of Molecular Genetics, Biochemistry and Microbiology, University of Cincinnati College of Medicine, United States
- Medical-Scientist Training Program, University of Cincinnati College of Medicine, United States
- Department of Cell Biology, Emory University and Emory University School of Medicine, United States
- Department of Pediatrics, University of Cincinnati College of Medicine, United States
Figures
Figure 1 with 2 supplements
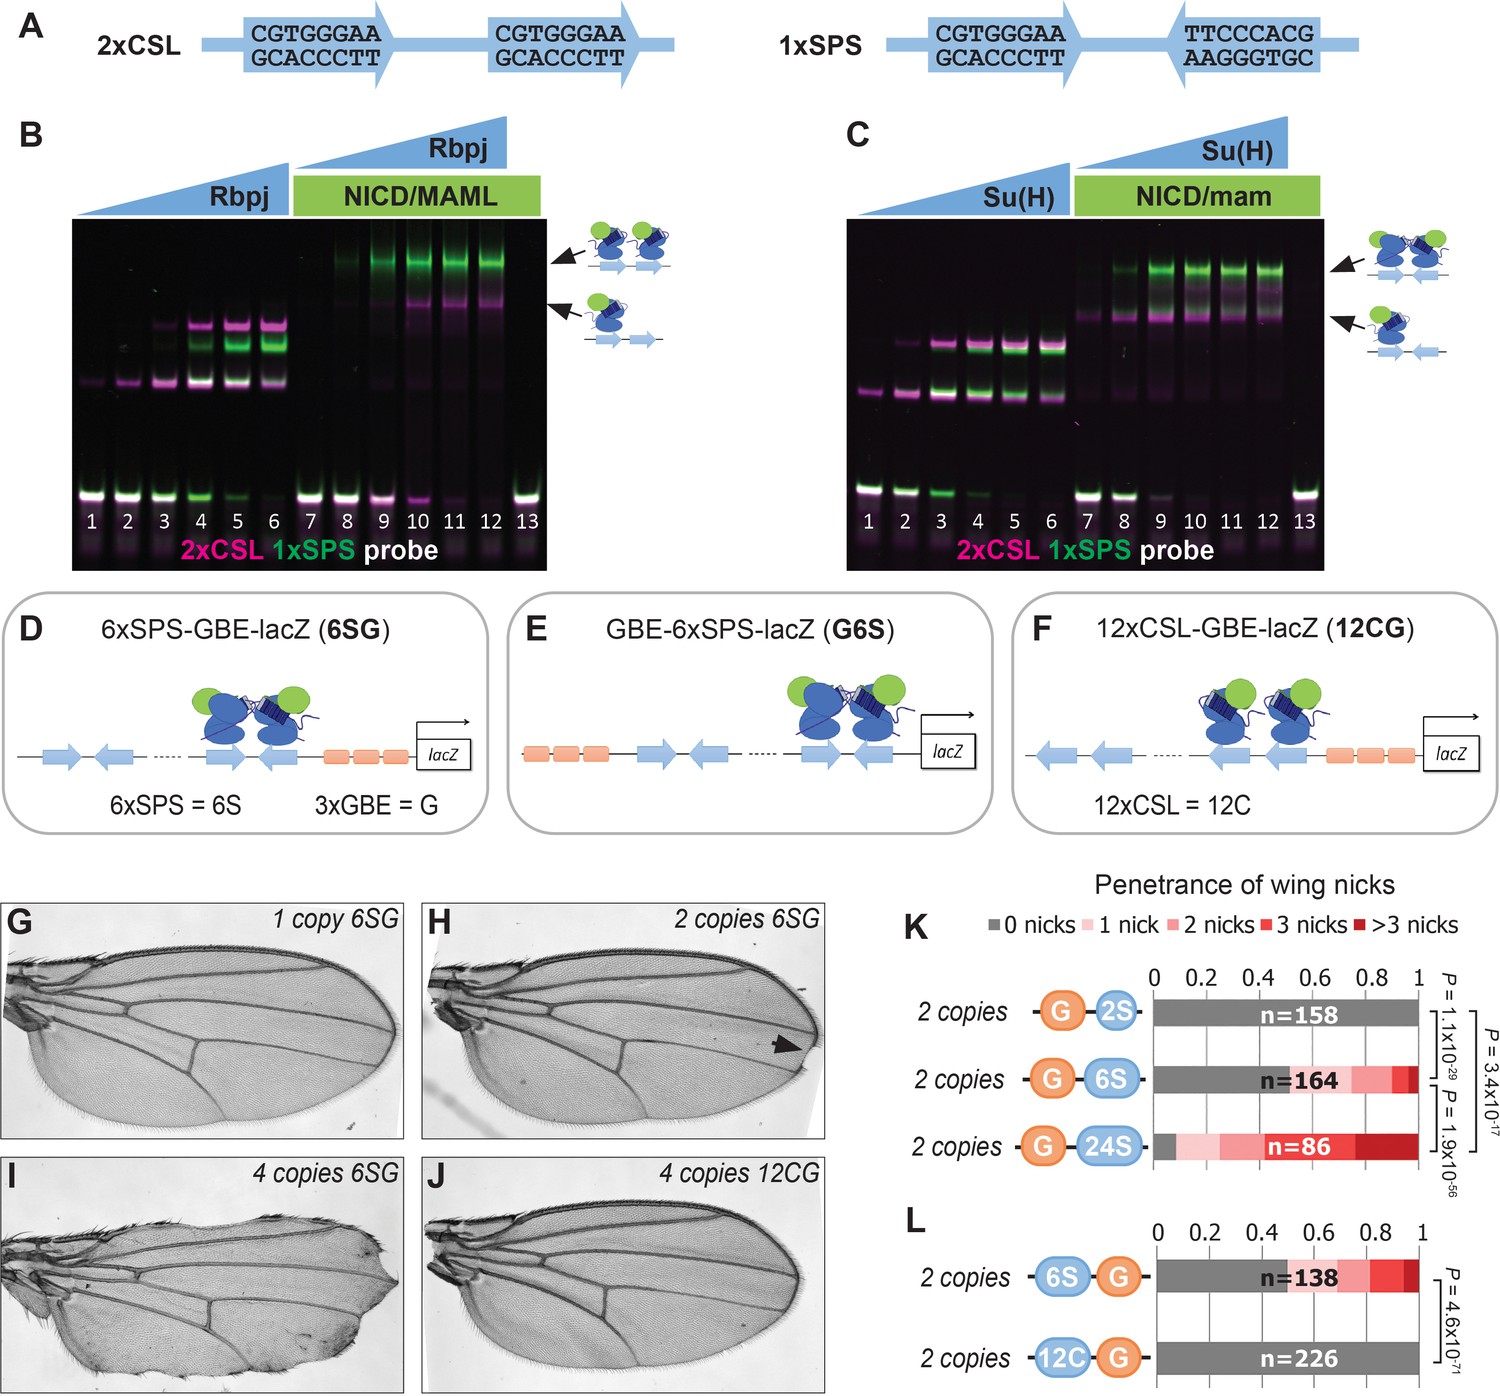
Synthetic Notch enhancers induce a Drosophila notched wing phenotype.
(A) Sequences of 2xCSL and 1xSPS used for performing EMSAs and generating reporters. (B–C) Electromobility shift assays (EMSAs) using purified mammalian NCM proteins (B) and fly NCM proteins (C) with both 2xCSL (magenta) and 1xSPS (green) probes. Arrows highlight bands consistent with one vs two NCM complexes on DNA. RBPJ/Su(H) concentration increases from 10 to 320 nM and 1 µM NICD/Mastermind was used in indicated lanes. Note, we separated the 2xCSL and 1xSPS probe signals and show the EMSA data in grayscale in Figure 1—figure supplement 1. (D–F) Schematics of 6xSPS-3xGBE-lacZ (6SG), 3xGBE-6xSPS-lacZ (G6S) and 12xCSL-3xGBE-lacZ (12CG). (G–J) Wings from flies with one copy, two copies, or 4 copies of 6SG-lacZ, or 4 copies of 12CG-lacZ. Arrowhead denotes a notch. (K–L) Quantified wing notching in flies with indicated transgenes. Proportional odds model tested penetrance and severity differences between G6S-lacZ and G24S-lacZ. Two-sided Fisher’s exact test assessed the penetrance of other genotypes.
Figure 1—figure supplement 1
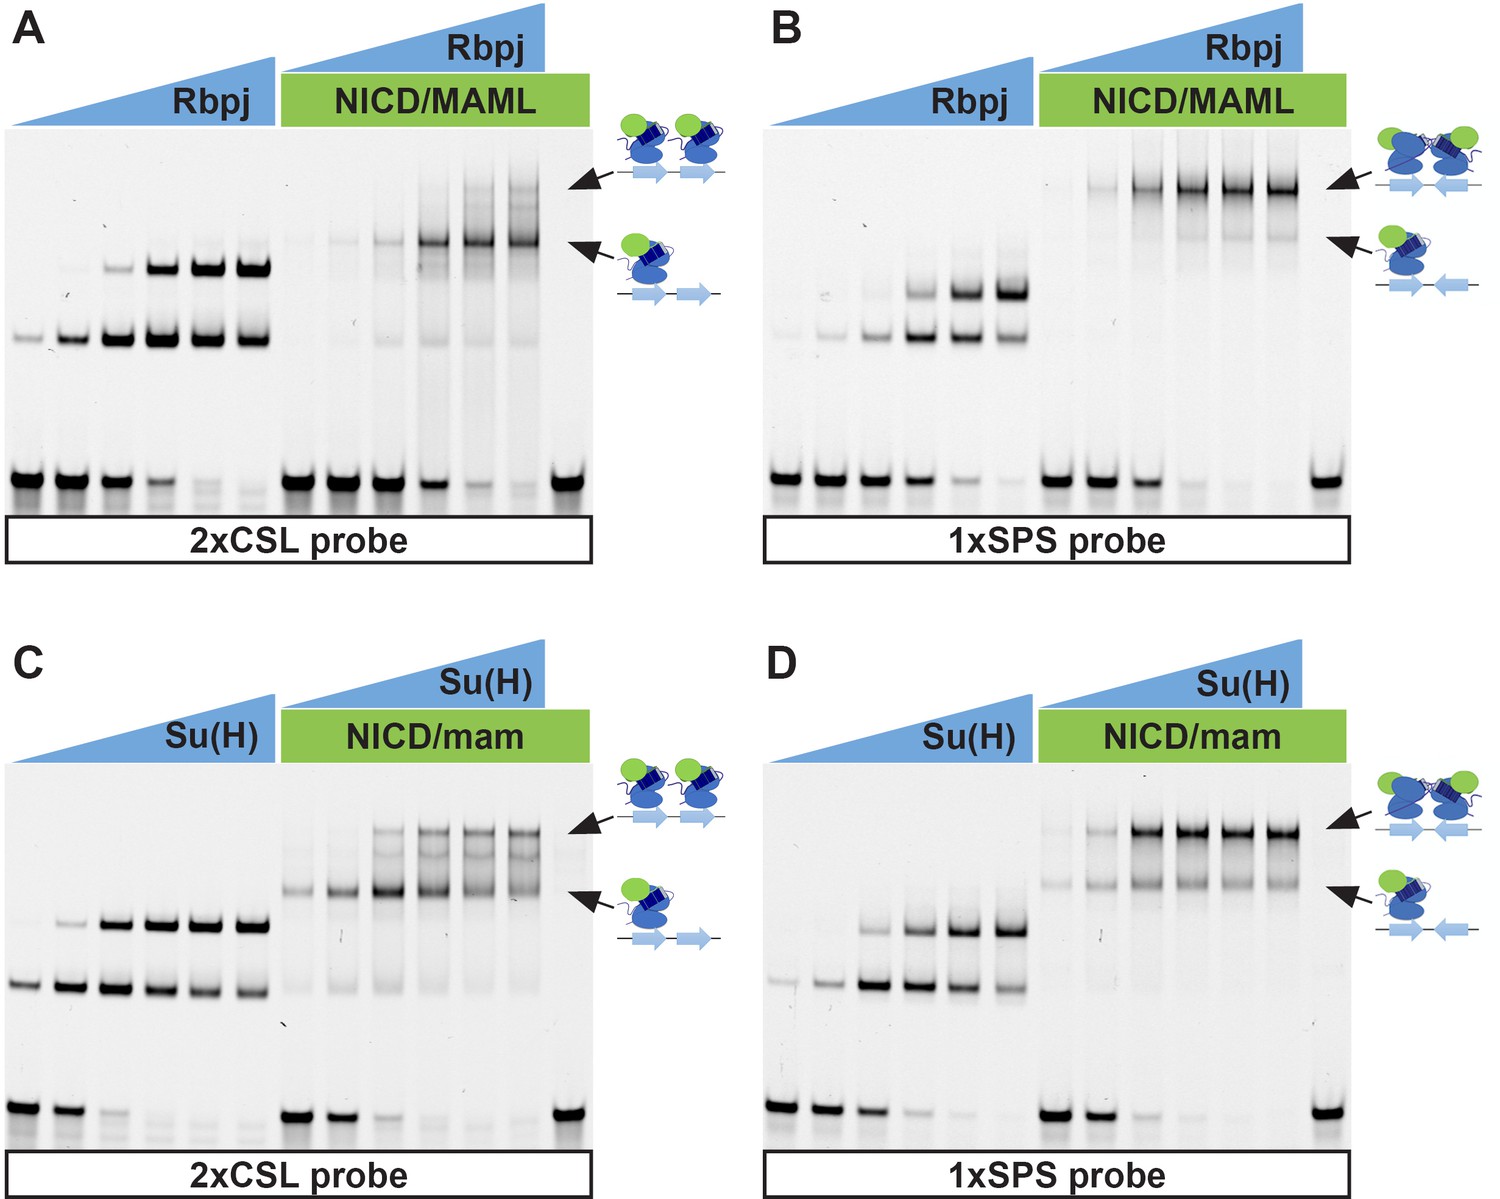
Individual channels of EMSAs.
(A–D) EMSAs using purified mammalian NCM proteins (A–B) or fly NCM proteins (C–D) and labeled 2xCSL (A, C) and 1xSPS (B, D) probes. Arrows highlight bands consistent with one vs two NCM complexes on DNA. The data shown in this figure are the isolated grayscale images of those shown in color in Figure 1B–C. Note, the fly and mouse proteins both cooperatively bind the 1xSPS but not the 2xCSL probe. However, we did observe that using the same concentration of mouse proteins resulted in the formation of more 2NCM complex on the 1xSPS probe relative to the fly proteins, suggesting that the mouse proteins may be more cooperative than the fly proteins. However, since we are not using full-length NICD and MAM proteins from either species due to difficulty in purifying these large proteins, additional studies are required to confirm the relevance of this observed difference.
Figure 1—figure supplement 2
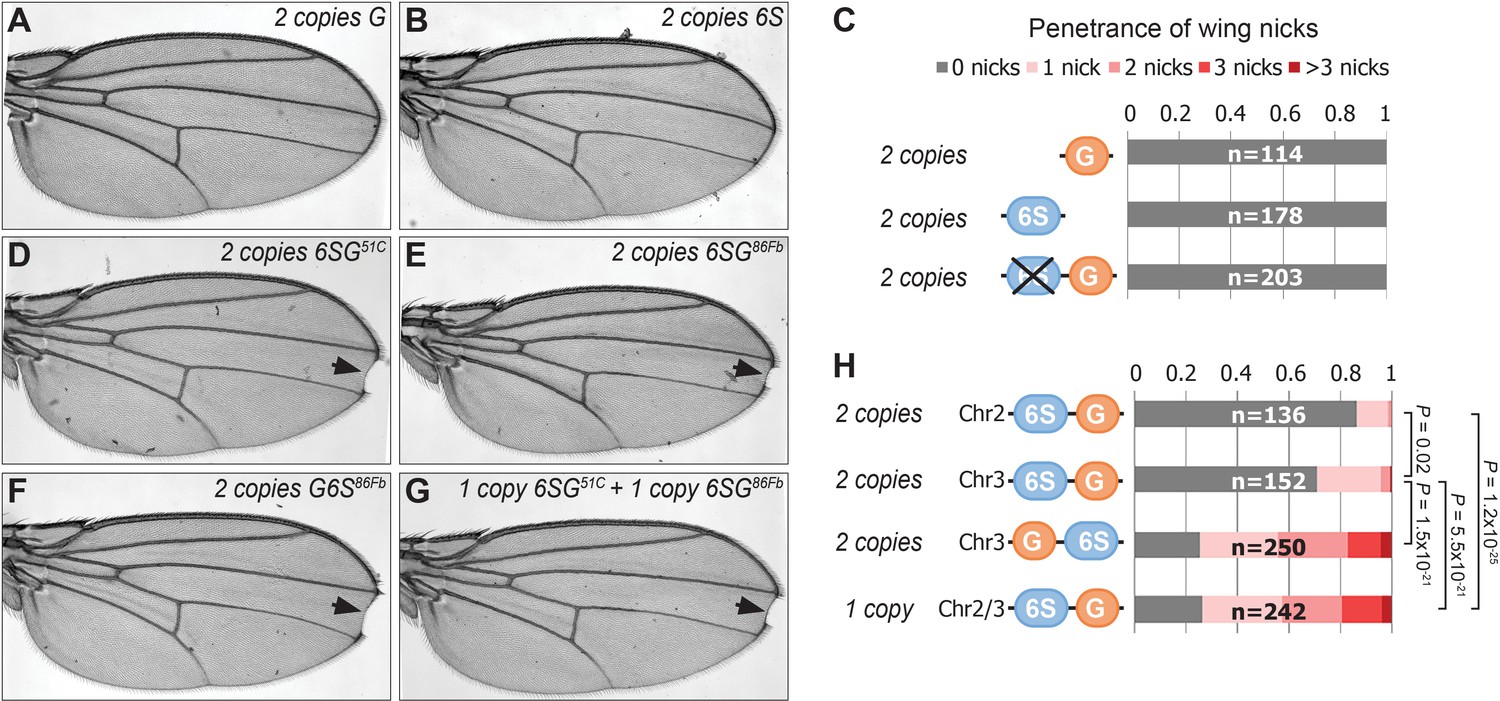
GBE and SPS sites are both required to induce the formation of wing nicks.
(A–B) Wing images from flies containing either 2 copies of 3xGBE-lacZ (A) or 6xSPS-lacZ (B) reveal no wing notching phenotypes. (C) Wing notching penetrance from flies with indicated genotypes. (D–G) Wing images from flies with indicated genotypes. 51C and 86Fb are genomic loci on second and third chromosome, respectively and arrows denote wing notches. (H) Wing notching penetrance and severity from flies with indicated genotypes. Note, while all of the fly lines with 2 copies of the 6SG-lacZ and G6S-lacZ transgenes develop wing notches, the penetrance and severity of the phenotype can vary between lines. The number of wings scored (n) for each genotype is noted, and a proportional odds model with Bonferroni adjustment tested for significance.
Figure 2 with 1 supplement
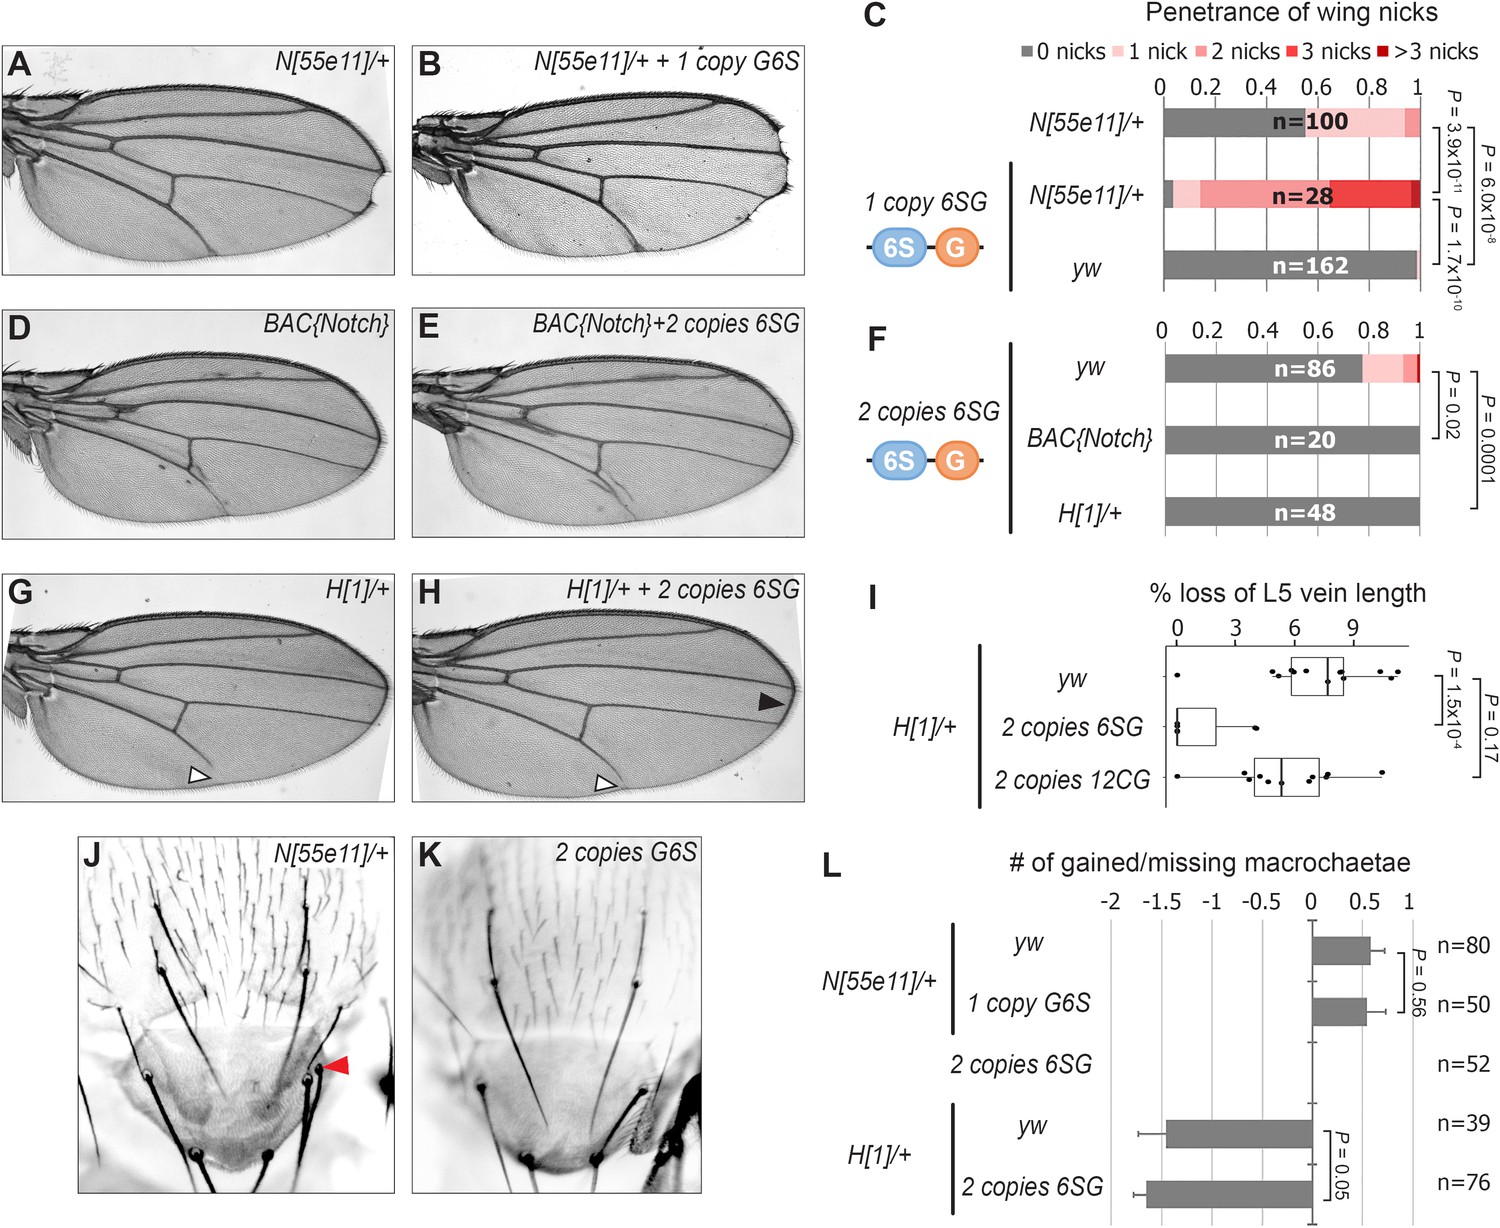
SPS-GBE reporters impact wing margin and vein development but not macrochaetae.
(A–B) Wings from Notch heterozygotes (N55e11/+) in the absence (A) and presence of G6S-lacZ (B). (C) Quantified wing notching in the indicated genotypes. Proportional odds model tested for penetrance/severity differences. (D–E) Wings from flies containing two extra N alleles (BAC{Notch-GFP-FLAG}) in the absence (D) and presence of 6SG-lacZ (E). (F) Quantified wing notching in flies with indicated genotypes. Two-sided Fisher’s exact test. (G–H) Wings from H1/+ flies in the absence (G) and presence (H) of 6SG-lacZ. Solid arrowhead highlights loss (G) and rescue (H) of L5 wing vein. Open arrowhead points to rescued 6SG-induced wing notching phenotype in H1/+ flies. (I) Quantification of loss of L5 vein in flies with indicated genotypes. Each dot represents a measurement from an individual wing. Two-sided Student's t-test. In box plots, the line represents median, the box shows interquartile range, and whiskers represent the 1.5 times interquartile range. (J–K) Notum images from a N55e11/+ (J) and G6S-lacZ (K) fly. Arrowhead denotes extra macrochaetae in N55e11/+. (L) Quantification of gained/lost dorsalcentral and scutellar macrochaetae (wild type = 8) in indicated genotypes. Proportional odds model tested for statistical significance. Data are mean ±95% confidence interval.
Figure 2—figure supplement 1
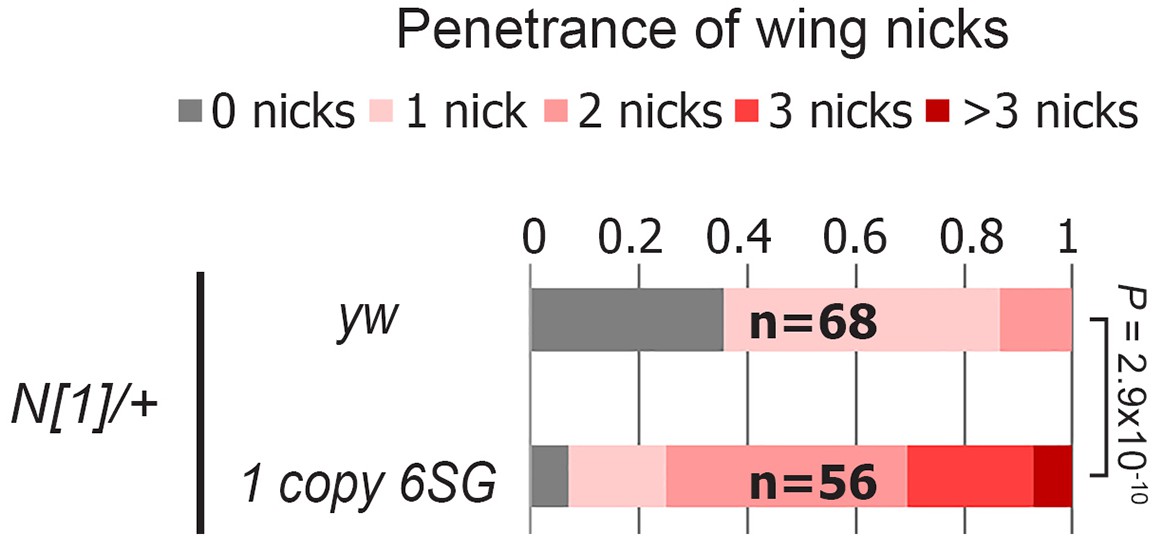
GBE-SPS reporter enhances the wing notching phenotype in the N1/+ background.
Quantified wing notching in the indicated genotypes. Proportional odds model tested for statistical significance.
Figure 3 with 2 supplements
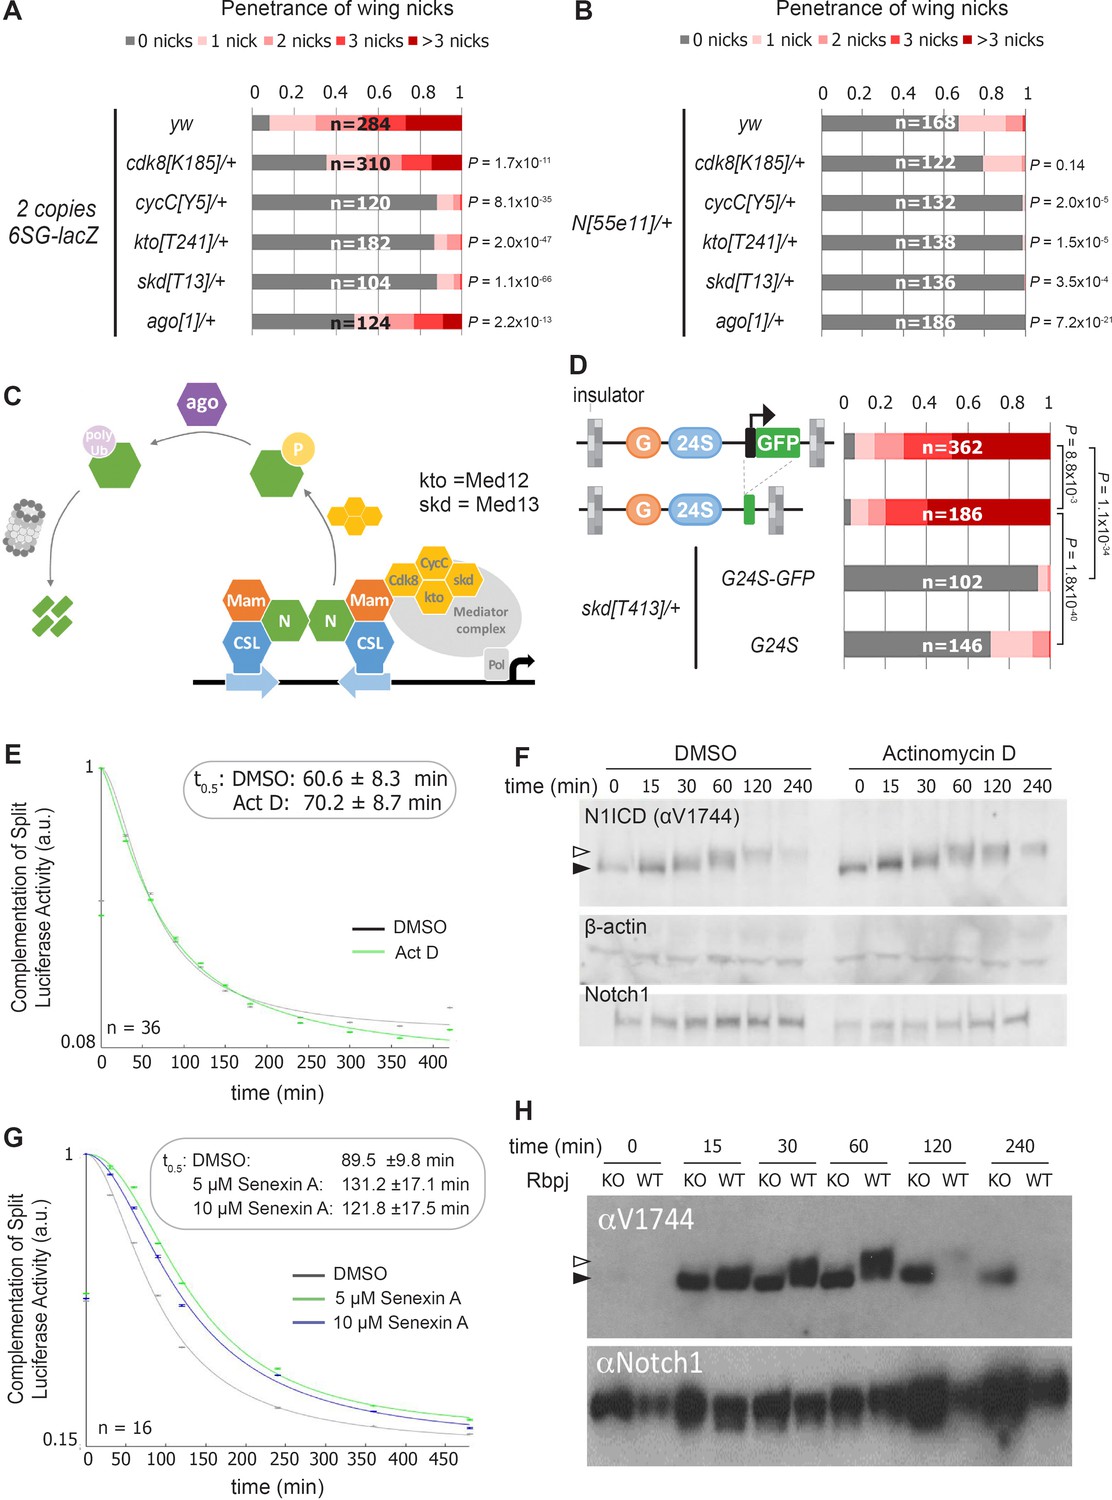
Reducing the activity of the Cdk8-Mediator suppresses the formation of wing notches.
(A–B) Quantified wing notching in 6SG-lacZ (A) or N55e11/+ (B) in wild-type or cdk8, cycC, kto, skd or ago heterozygotes. Proportional odds model with Bonferroni adjustment tested for significance compared to wild-type. (C) Model of Cdk8-mediated NICD degradation. NCM complexes on SPSs recruit Cdk8, CycC, kto and skd. Cdk8 phosphorylates NICD to promote its degradation via Ago and the proteasome (gray cylinder). Cdk8 can also interact with the core Mediator (gray oval). (D) Schematics of promoter-containing and -lacking transgenes at left. Wing notching penetrance and severity at right. Proportional odds model was used to assess significance. (E) Rbpj-N1ICD split luciferase assay assessing N1ICD half-life in HEK293T cells treated with DMSO or Actinomycin D. 95% confidence interval noted. (F) Western blot of N1ICD, total Notch1 and β-actin after Notch activation in mK4 cells treated with DMSO or Actinomycin D. (G) Rbpj-N1ICD split luciferase assay assessing N1ICD half-life in HEK293T cells treated with DMSO, 5 μM Senexin A or 10 μM Senexin A. 95% confidence interval noted. (H) Western blot of N1ICD and full-length Notch1 after Notch activation in either wild-type (OT13) or Rbpj-deficient (OT11) cells. Open arrow denotes post-translationally modified NICD and closed arrow denotes un-modified NICD.
Figure 3—figure supplement 1
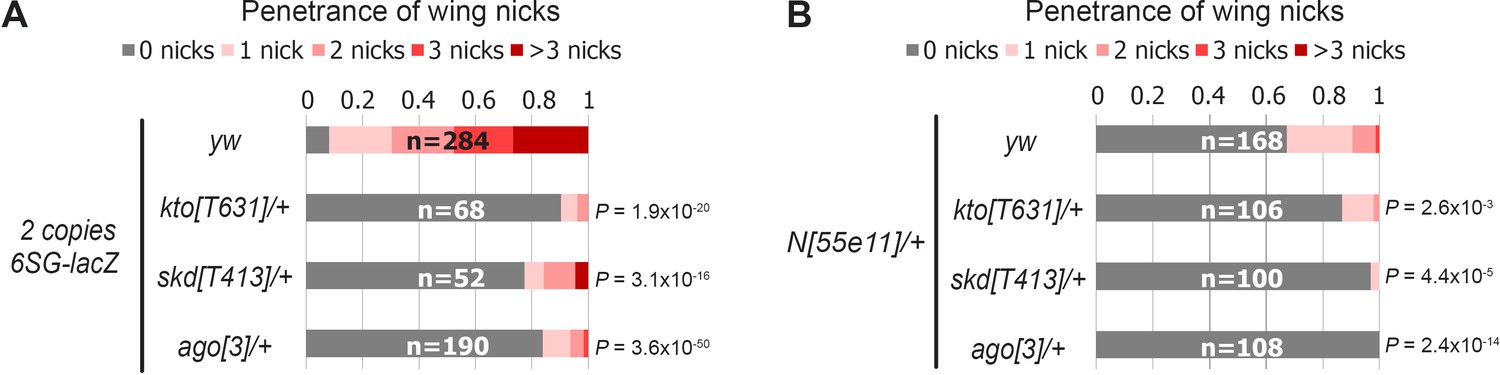
Decreased gene dose of the Cdk8-Mediator submodule suppresses the formation of wing nicks.
(A) Wing notching penetrance and severity from flies containing 2 copies of 6SG-lacZ in wild-type (yw) or heterozygotes of components of the Cdk8-Mediator submodule or Drosophila Fbw7 (ago). Wild-type data is the same as Figure 3A as it was performed in the same experiment. (B) Wing notching penetrance and severity from N heterozygotes crossed to a wild-type (yw) or heterozygotes of either components of the Cdk8-Mediator submodule or ago. Wild-type data is the same as Figure 3B as it was performed in the same experiment. Number of wings scored (n) for each genotype is noted. Proportional odds model with Bonferroni adjustment.
Figure 3—figure supplement 2
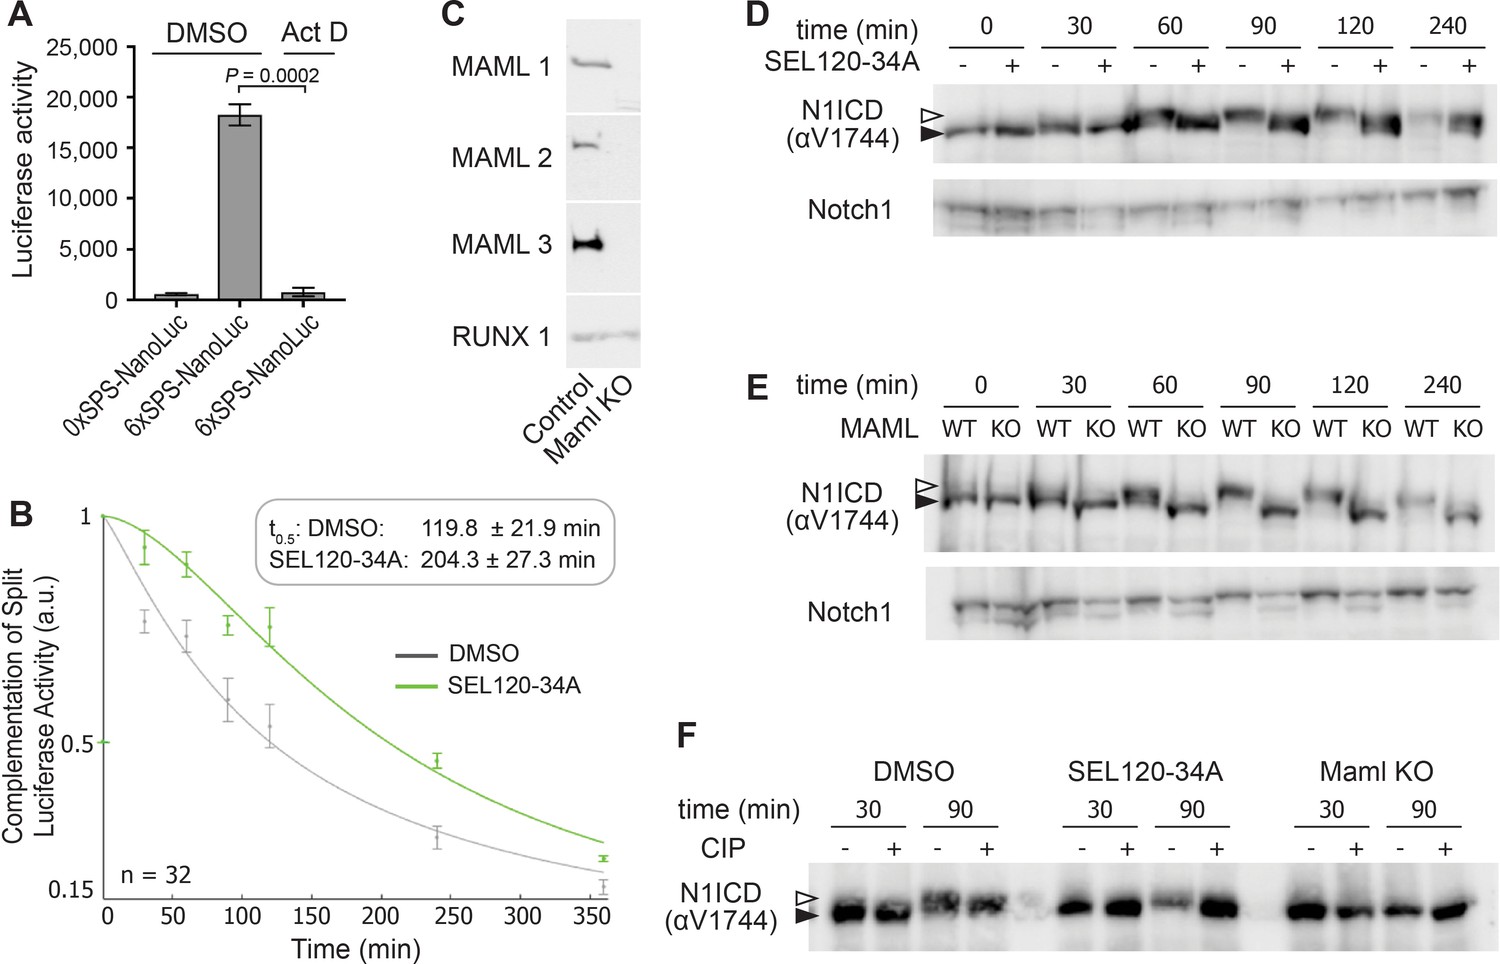
Transcription inhibition doesn't impact NICD mobility.
(A) Luciferase activity of 6xSPS-NanoLuc (6S) after Notch activation in mK4 cells treated with either DMSO or Actinomycin D (50 nM). Empty luciferase vector (0xSPS-NanoLuc) was used as control (WT). One-way ANOVA analysis. (B) Rbpj-N1ICD split luciferase assay assessing N1ICD half-life in HEK293T cells treated with DMSO or 1 μM SEL120-34A, a CDK8/CDK19 specific inhibitor. 95% confidence interval noted. (C) Western blot of MAML1-3 in either wild-type or MAML-deficient mK4 cells. RUNX1 is used as a loading control. (D) Western blot of N1ICD and Notch1 in mK4 cells treated with either DMSO or 2 μM SEL120-34A after indicated duration of Notch activation. An antibody that recognizes both the membrane bound and induced Notch1 signal is used as a loading control. Open arrow denotes post-translationally modified NICD and closed arrow denotes un-modified NICD. (E) Western blot of N1ICD and Notch1 after Notch activation in MAML-deficient mK4 cells. Note, N1ICD mobility from MAML-deficient cells did not change over time, consistent with post-translational modifications requiring MAML-mediated DNA binding. An antibody that recognizes both the membrane bound and induced Notch1 signal is used as a loading control. Open arrow denotes post-translationally modified NICD and closed arrow denotes un-modified NICD. (F) Western blot of N1ICD in wild-type mK4 cells treated with either DMSO or SEL120-34A, or MAML-deficient mK4 cells after indicated duration of Notch activation with/without Calf intestinal phosphatase (CIP) treatment.
Figure 4 with 2 supplements
A mathematical model coupling NICD degradation to DNA binding predicts Notch activity and tissue sensitivity.
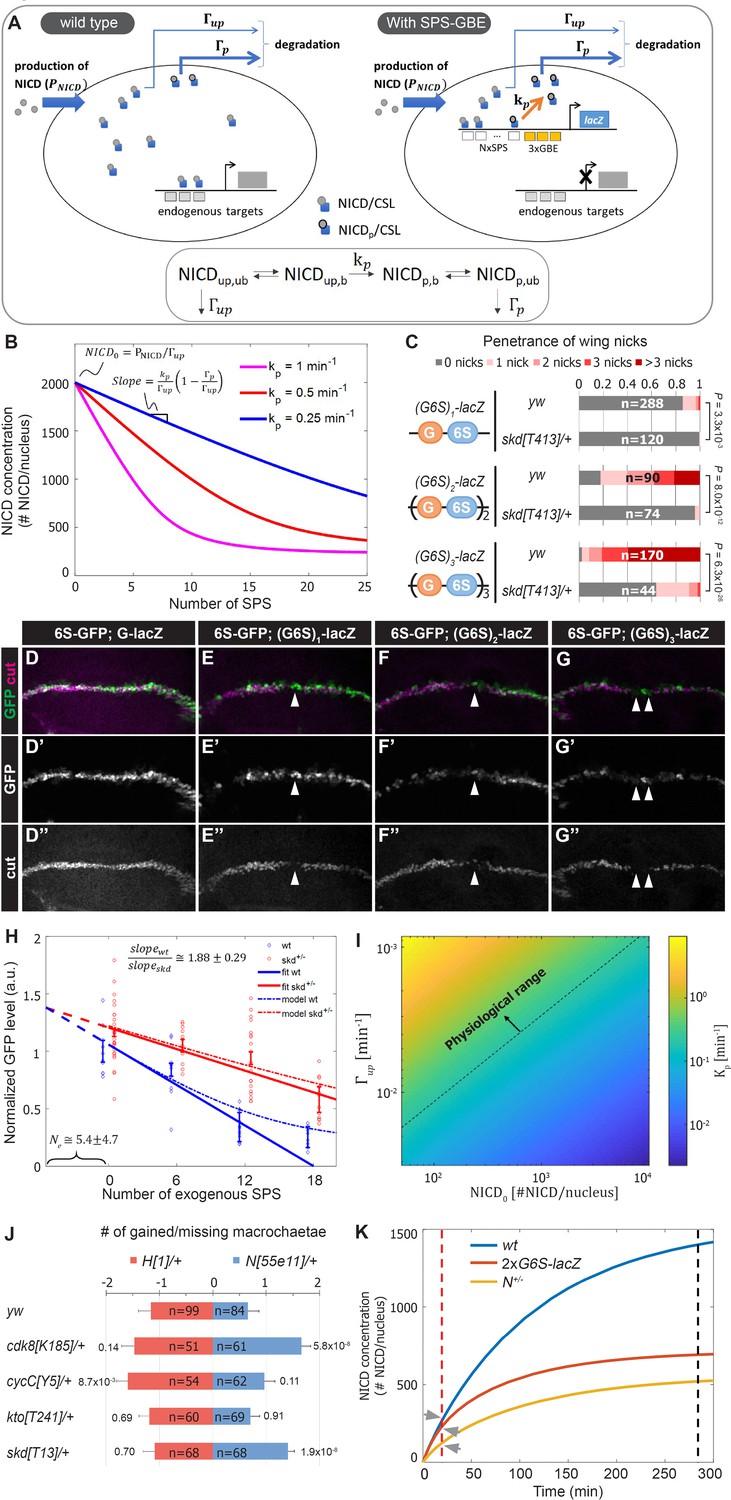
(A) Schematic and equation describing SPS-GBE induced turnover of NICD. In both wild type (left) and nuclei with SPS-GBE sites inserted (right), NICD is produced and enters the nucleus at a constant rate (). NCM complexes form on SPS, where NICD is phosphorylated by Cdk8 at a rate . Phosphorylated NICD degrades faster () than unphosphorylated NICD (). Subscripts denote phosphorylated, unphosphorylated, bound, and unbound NICD. (B) Simulations of NICD levels as a function of SPS number. The three curves correspond to simulations with indicated values of . NICD starts from a common level () and initially decreases linearly with SPS number, with a slope proportional to . (C) Wing notching penetrance and severity in flies with indicated genotypes. Proportional odds model was used to assess significance. (D–G”) Wing discs from flies containing 6xSPS-GFP (6S-GFP) and either GBE-lacZ (G-lacZ) or (G6S)1,2 or 3-lacZ stained with cut (magenta). (H) Quantified GFP levels in wing discs with increasing SPSs (0, 6, 12, 18 correspond to (G6S)1,2 or 3-lacZ) in either wild type (blue) or skd heterozygotes (red). Each dot represents the average GFP level in margin cells from a single wing disc. Error bars show means and S.E.M for each disc. Solid lines represent linear fit to mean GFP values of the first three points of wild-type (blue) and the four points of skd heterozygotes (red). Ratio of slopes is indicated. Effective number of endogenous SPS, , is estimated by extrapolating the y axis intersect of dashed lines. (I) Estimated phosphorylation rates by a single SPS, . Values of (color-bar) were estimated for a range of values of and . Dashed line represents lower limit of the physiological range of kinase activities. (J) Quantified number of gained/lost macrochaetae from indicated genotypes in N55e11/+ (blue bars) or H1/+ (red bars) background. Proportional odds model with Bonferroni adjustment. Data are mean ±95% confidence interval. (K) NICD level simulations as a function of time after Notch activation (at t = 0 min) in wild-type (blue), N heterozygotes (yellow) and SPS-GBE flies (red). In tissues with long duration Notch activation (black dash line), N heterozygotes and SPS-GBE sites similarly reduce NICD levels. In tissues with short duration Notch activation (red dash line), NICD levels are weakly affected by SPS-GBE compared to N heterozygotes (arrows).
Figure 4—figure supplement 1
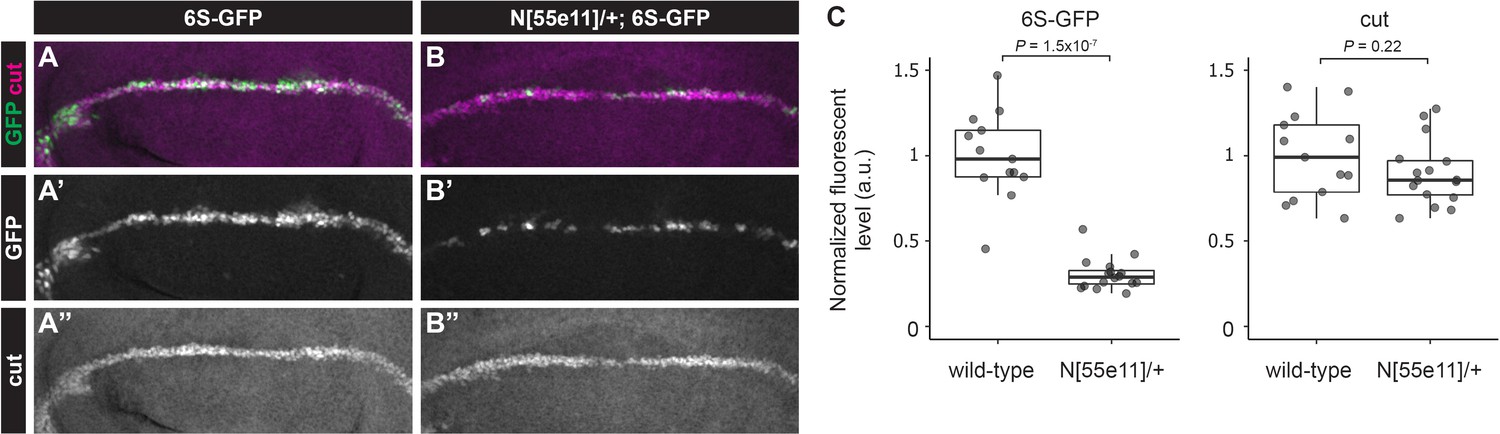
6S-GFP reporter activity is sensitive to Notch gene dose.
(A–B”) Representative immunostained third instar wing discs from wild-type or N heterozygous female flies containing 6xSPS-GFP (6S-GFP) stained with cut (magenta). (C) Quantification of GFP and Cut levels from wing discs of indicated genotype. Each dot represents the average wing margin cell pixel intensity as measured from an individual imaginal disc. Two-sided Student’s t-test.
Figure 4—figure supplement 2
Dynamic model is robust for to variations in parameters.
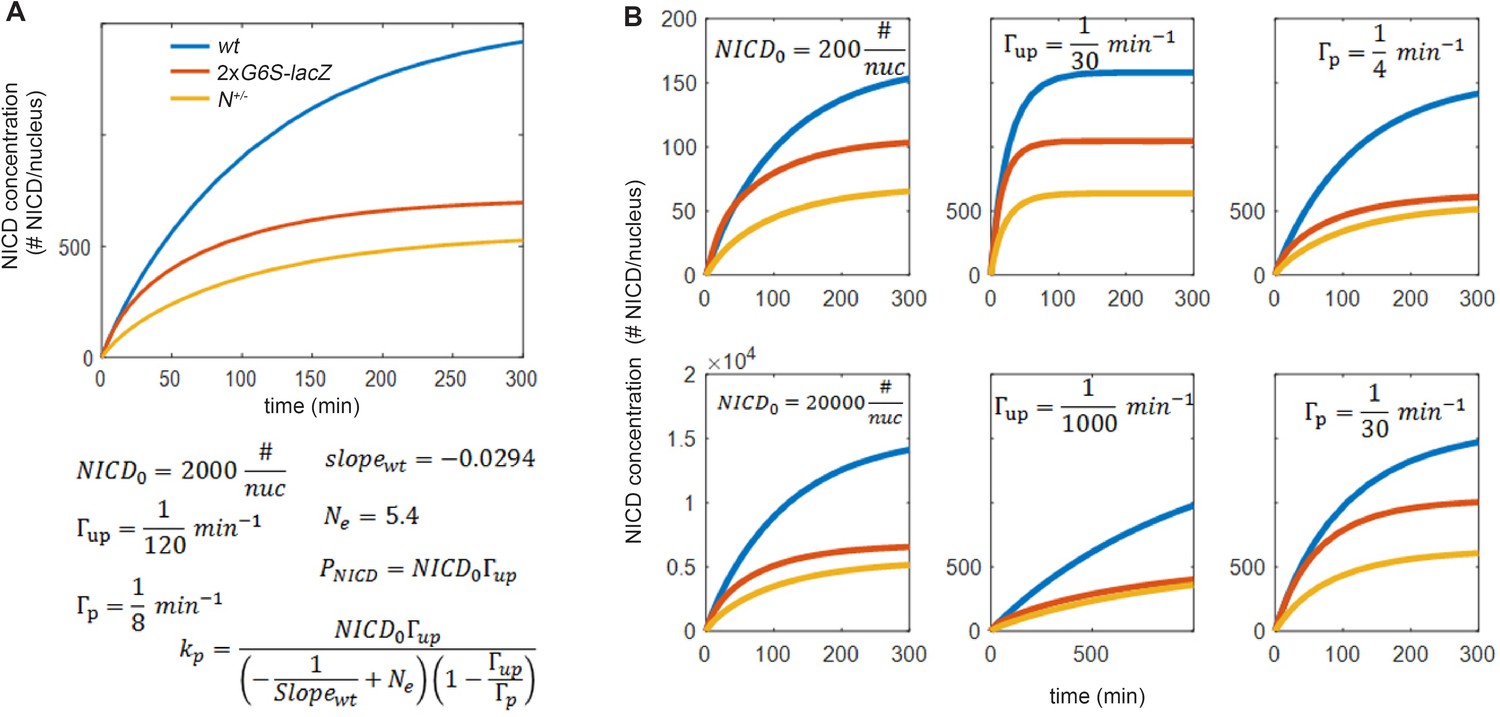
(A) Top: Simulation of NICD levels as a function of time after the onset of Notch activation (at t=0 min) in wild-type (blue), N heterozygotes (yellow) and SPS-GBE flies (red). Bottom: Parameters used for the model. The values of and were extracted from the analysis of Figure 4H. Other parameter values were chosen in the middle of the range estimation as described in the modeling section. (B) Simulations of NICD levels as a function of time for different parameters as indicated. In each plot, one parameter is changed compared to (A) with all other parameters remaining the same. This analysis shows that varying and over two orders of magnitude, and over one order of magnitude do not affect the general conclusion that long duration processes, but not short duration processes, are sensitive to the CDK8-mediated degradation mechanism.
Figure 5
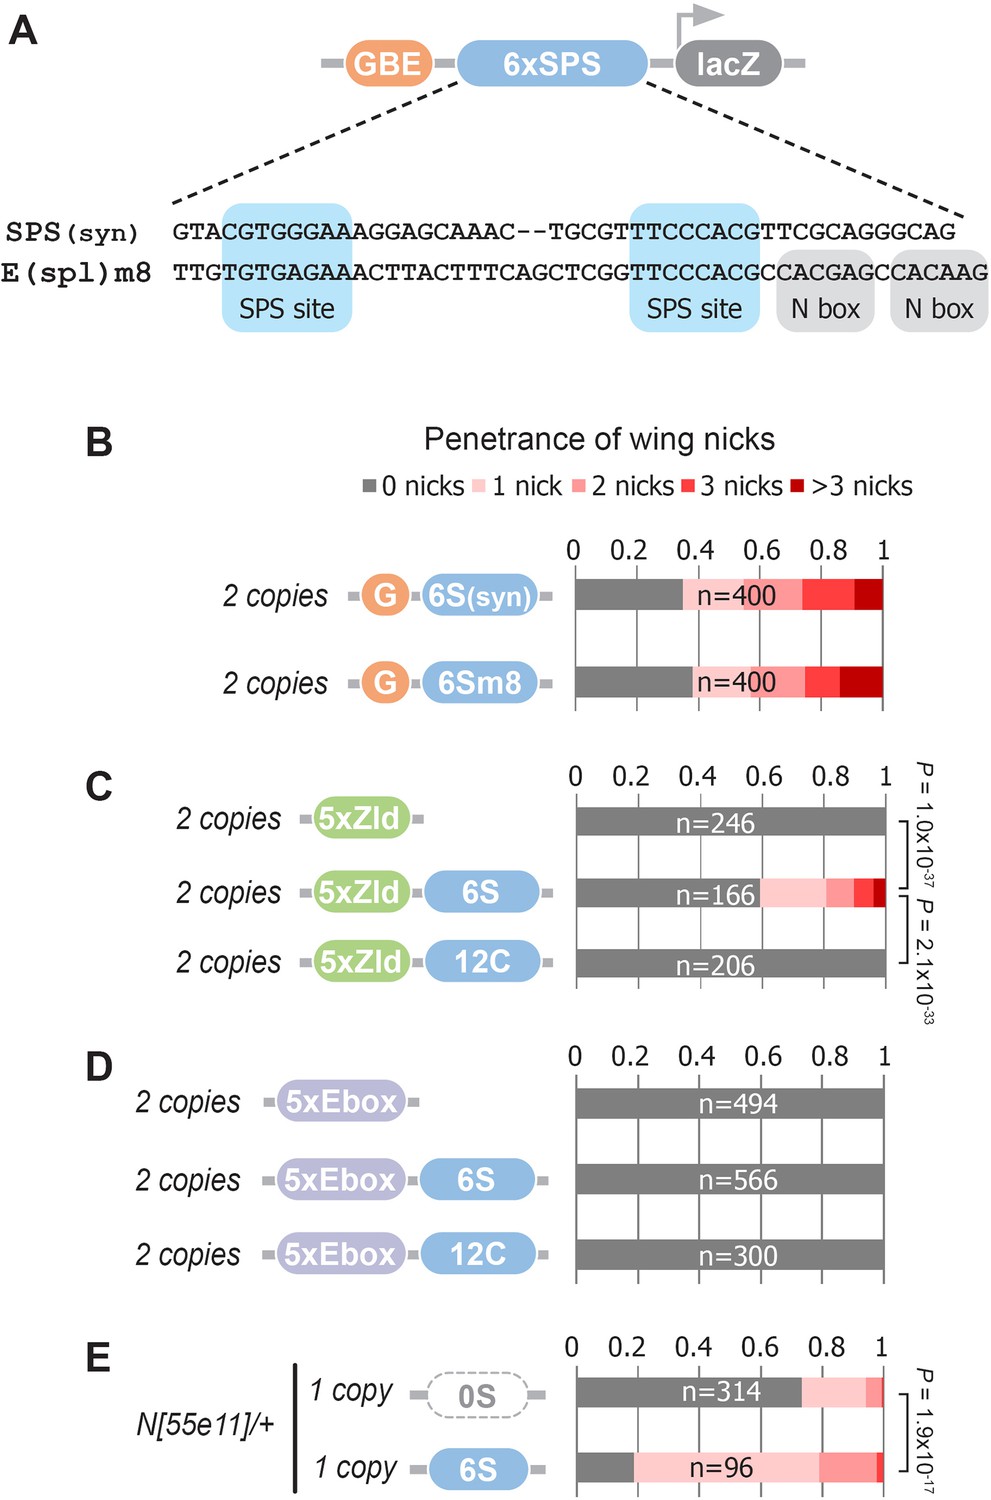
Defining enhancer TFBSs that induce the notched wing phenotype.
(A) Graphical representation and sequence alignment of the synthetic SPS (SPS(syn)) and E(spl)m8 SPS constructs. SPS sites are highlighted in blue and Nbox sequences, which are only present in E(spl)m8, are shaded in gray. (B) Quantified wing notching in flies with two copies of either G6Ssyn-lacZ or G6Sm8-lacZ inserted in the same locus. (C) Quantified wing notching in flies with two copies of either 5xZelda(Zld)-lacZ, 5xZld-6xSPS-lacZ, or 5xZld-12xCSL-lacZ. Two-sided Fisher’s exact test assessed for significance between genotypes. (D) Quantified wing notching in flies with two copies of either 5xEbox-lacZ sites alone, 5xEbox-6xSPS-lacZ, or 5xEbox-12xCSL-lacZ. (E) Quantified wing notching in N heterozygous flies containing a single copy of either 0xSPS-lacZ or 6xSPS-lacZ transgenes. Proportional odds model tested for penetrance/severity.
Tables
Key resources table
| Reagent type (species) or resource | Designation | Source or reference | Identifiers | Additional information |
|---|---|---|---|---|
| Genetic reagent (D. melanogaster) | BAC{Notch} | BloomingtonDrosophila Stock Center | BDSC:38665; RRID:BDSC_81271 | FlyBase symbol: PBac{N-GFP.FLAG}VK00033 |
| Genetic reagent (D. melanogaster) | N[55e11] | BloomingtonDrosophila Stock Center | BDSC:28813; RRID:BDSC_28813 | |
| Genetic reagent (D. melanogaster) | H[1] | BloomingtonDrosophila Stock Center | BDSC:515; RRID:BDSC_515 | |
| Genetic reagent (D. melanogaster) | kto[T241] | BloomingtonDrosophila Stock Center | BDSC:63126; RRID:BDSC_63126 | |
| Genetic reagent (D. melanogaster) | kto[T631] | BloomingtonDrosophila Stock Center | BDSC:63125; RRID:BDSC_63125 | |
| Genetic reagent (D. melanogaster) | skd[T13] | BloomingtonDrosophila Stock Center | BDSC:63123; RRID:BDSC_63123 | |
| Genetic reagent (D. melanogaster) | skd[T413] | BloomingtonDrosophila Stock Center | BDSC:63124; RRID:BDSC_63124 | |
| Genetic reagent (D. melanogaster) | cdk8[K185] | PMID:11171343 | ||
| Genetic reagent (D. melanogaster) | cycC[Y5] | PMID:11171343 | ||
| Genetic reagent (D. melanogaster) | ago[1] | PMID:11565033 | ||
| Genetic reagent (D. melanogaster) | ago[3] | PMID:11565033 | ||
| Cell line (H. sapiens) | HEK293T | PMID:23806616 | Stable expression of CLuc-RBPjK and Notch1-NLuc | |
| Cell line (M. musculus) | mK4 | PMID:11850199 | RRID:CVCL_9T80 | |
| Cell line (M. musculus) | OT-13 | PMID:9374409 | RRID:CVCL_T371 | wild-type embryonic fibroblast |
| Cell line (M. musculus) | OT-11 | PMID:9374409 | RRID:CVCL_T370 | RBPjK deficient embryonic fibroblast |
| Antibody | anti-NICD Cleaved Notch1 Val1744 D3B8 (Rabbit monoclonal) | CST | Cat # 4147; RRID:AB_2153348 | WB (1:1000) |
| Antibody | anti-Notch1 Clone D1E11 (Rabbit monoclonal) | CST | Cat# 3608; RRID:AB_2153354 | WB (1:1000) |
| Antibody | anti-cut (Mouse monoclonal) | DSHB | Cat# 2B10 | IF (1:50) |
| Antibody | anti-β-Actin Clone AC-15 (Mouse monoclonal) | Sigma-Aldrich | Cat# A5441; RRID:AB_476744 | WB (1:4000) |
| Antibody | anti- MAML1 D3E9 (Rabbit monoclonal) | CST | Cat# 11959; RRID:AB_2797778 | WB (1:1000) |
| Antibody | anti-MAML2 (Rabbit polyclonal) | CST | Cat# 4618; RRID:AB_2139273 | WB (1:1000) |
| Antibody | anti-MAML3 (Rabbit polyclonal) | Bethyl | Cat# A300-684A; RRID:AB_2266032 | WB (1:1000) |
| Antibody | anti-RUNX1 D4A6 (Rabbit monoclonal) | CST | Cat# 8529; RRID:AB_10950225 | WB (1:1000) |
| Antibody | ECL anti-rabbit-HRP | GE Healthcare | Cat# NA934; RRID:AB_772206 | WB (1:5000) |
| Antibody | ECL anti-mouse-HRP | GE Healthcare | Cat# NA931; RRID:AB_772210 | WB (1:5000) |
| Sequence-based reagent | MAML1 exon1 PX458 F | This paper | guide RNA | CACCGCCGAAGTGGCAGCCGGCGCC |
| Sequence-based reagent | MAML1 exon1 PX458 R | This paper | guide RNA | AAACGGCGCCGGCTGCCACTTCGGC |
| Sequence-based reagent | MAML1 exon1 PX459 F | This paper | guide RNA | CACCGCGCCGGAAGAGGCGTTTTC |
| Sequence-based reagent | MAML1 exon1 PX459 R | This paper | guide RNA | AAACGAAAACGCCTCTTCCGGCGC |
| Sequence-based reagent | MAML2 exon1 PX458 F | This paper | guide RNA | CACCGGGGGCCTCCCAGTAAATAA |
| Sequence-based reagent | MAML2 exon1 PX458 R | This paper | guide RNA | AAACTTATTTACTGGGAGGCCCCC |
| Sequence-based reagent | MAML2 exon1 PX459 F | This paper | guide RNA | CACCGACTCCCACCAGTGATTAGTT |
| Sequence-based reagent | MAML2 exon1 PX459 R | This paper | guide RNA | AAACAACTAATCACTGGTGGGAGTC |
| Sequence-based reagent | MAML3 exon1 PX458 F | This paper | guide RNA | CACCGCTCCCGGGGCACACTATTT |
| Sequence-based reagent | MAML3 exon1 PX458 R | This paper | guide RNA | AAACAAATAGTGTGCCCCGGGAGC |
| Sequence-based reagent | MAML3 exon1 PX459 F | This paper | guide RNA | CACCGCTCACTGGGGTGCGCGTTG |
| Sequence-based reagent | MAML3 exon1 PX459 R | This paper | guide RNA | AAACCAACGCGCACCCCAGTGAGC |
| Chemical compound, drug | Actinomycin D | Sigma-Aldrich | Cat# A1410 | |
| Chemical compound, drug | Senexin A | R and D | Cat# 4875 | |
| Chemical compound, drug | SEL120-34A | Medchemexpress | Cat# HY-111388A | |
| Chemical compound, drug | CIP | NEB | Cat# M0525S | |
| Chemical compound, drug | D-Luciferin | Goldbio | Cat# LUCK-100 | |
| Chemical compound, drug | Trypsin-EDTA | Gibco | Cat# 25300–120 | |
| Chemical compound, drug | SuperSignalFemto West Chemoluminescent Substrate | Thermo-Fisher Scientific | Cat# PI34095 | |
| Software, algorithm | MATLAB | Mathworks | RRID:SCR_001622 | Codes available at https://github.com/OhadGolan/NICD-concentration-in-the-nucleus-as-by-binding-site-coupled-NICD-degradation |
Additional files
-
Supplementary file 1
Genetic crosses performed to generate the analyzed progeny.
All genotypes of Drosophila fly lines mated to generate the offspring and data shown in each experimental Figure.
- https://cdn.elifesciences.org/articles/53659/elife-53659-supp1-v2.docx
-
Transparent reporting form
- https://cdn.elifesciences.org/articles/53659/elife-53659-transrepform-v2.pdf
Download links
A two-part list of links to download the article, or parts of the article, in various formats.
Downloads (link to download the article as PDF)
Open citations (links to open the citations from this article in various online reference manager services)
Cite this article (links to download the citations from this article in formats compatible with various reference manager tools)
Enhancer architecture sensitizes cell specific responses to Notch gene dose via a bind and discard mechanism
eLife 9:e53659.
https://doi.org/10.7554/eLife.53659


