An asymmetric sheath controls flagellar supercoiling and motility in the leptospira spirochete
- Department of Molecular Biophysics and Biochemistry, Yale School of Medicine, United States
- Laboratory of Molecular and Structural Microbiology, Institut Pasteur de Montevideo, Uruguay
- Departament of Epidemiology of Microbial Diseases, Yale School of Public Health, United States
- Gonçalo Moniz Institute, Oswaldo Cruz Foundation, Brazilian Ministry of Health, Brazil
- Department of Microbial Pathogenesis, School of Medicine, Yale University, United States
- Biology of Spirochetes Unit, Institut Pasteur, France
- Integrative Microbiology of Zoonotic Agents, Department of Microbiology, Institut Pasteur, France
Figures
Figure 1 with 2 supplements
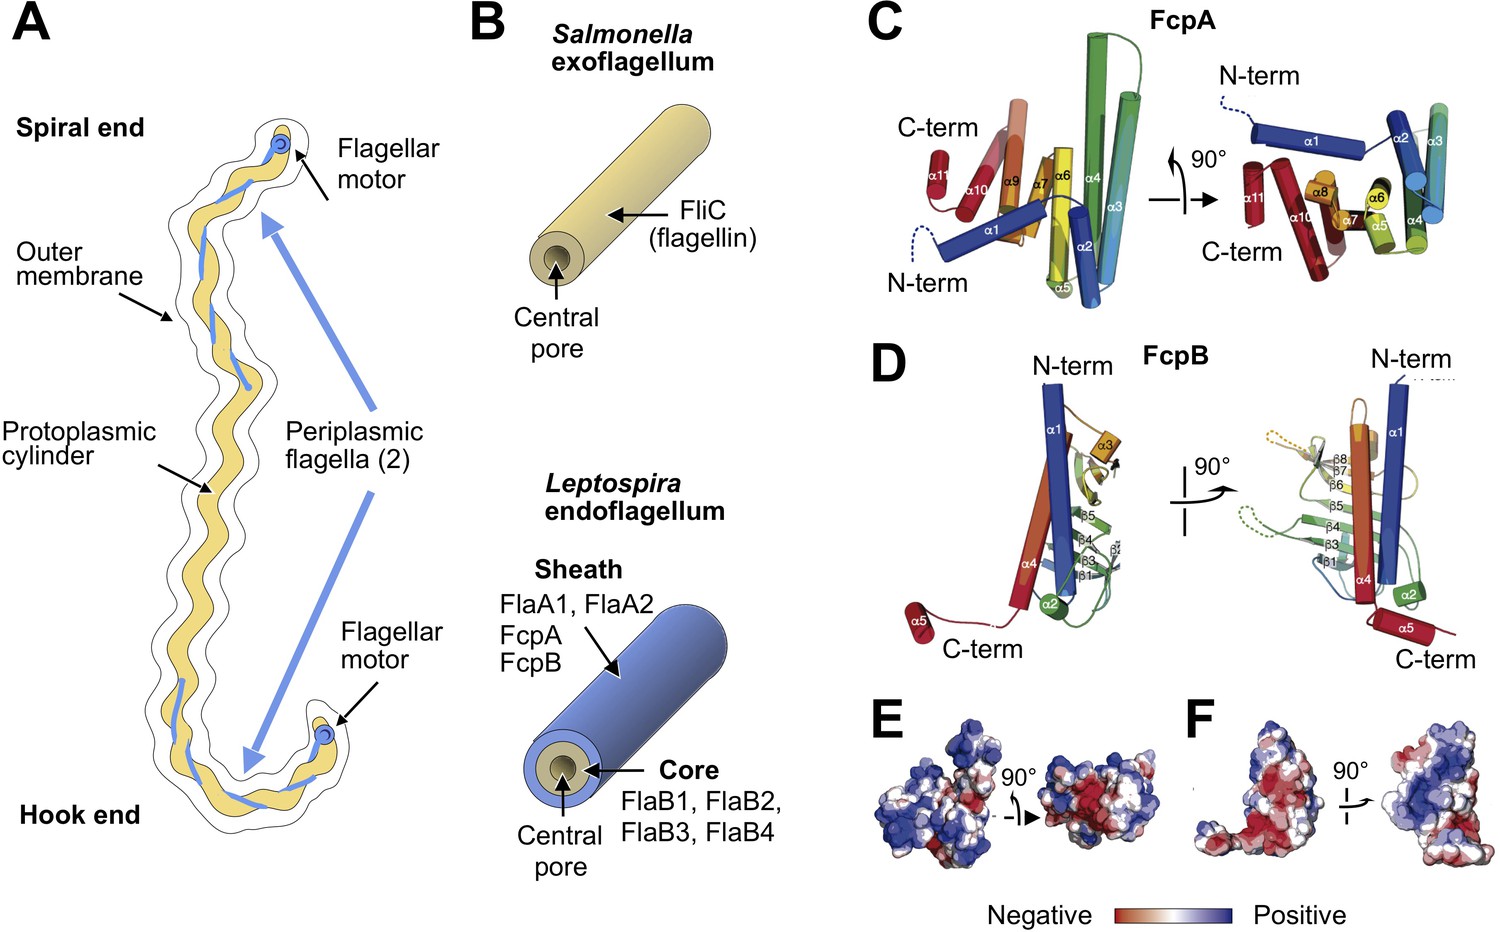
X-ray crystal structures of the sheath proteins, FcpA from L. biflexa and FcpB from L. interrogans.
(A). Schematic of a Leptospira cell. Each cell has two flagella sandwiched between the inner and outer membranes; a single flagellum extends from a motor at either end. (B) Comparison of the predicted endoflagellar filament composition and morphology in Leptospira with the Salmonella exoflagellum. (C) Structure of L. biflexa FcpA in two orthogonal views, depicted as a cartoon colored with a ramp from blue (N-terminus) to red (C-terminus). The dotted line stands for the flexible 54 amino acids at the N-terminus, not visible in electron density. (D) Structure of L. interrogans FcpB in two orthogonal views, similar color code as panel A. (E) Solvent accessible surface of FcpA colored according to an electrostatic potential ramp from negative (red) through neutral (white) to positive (blue) potentials. (F) Solvent accessible surface of FcpB, similar color code as panel E. The perspective was chosen to show the interacting surface of FcpB (positively charged region, panel F left-hand side), in an open-book view (approximately 180° rotated according to a vertical axis), with FcpA (negative cleft, panel E right-hand side). This interaction was later uncovered by studying the whole filament assembly (see Figure 4E).
Figure 1—figure supplement 1
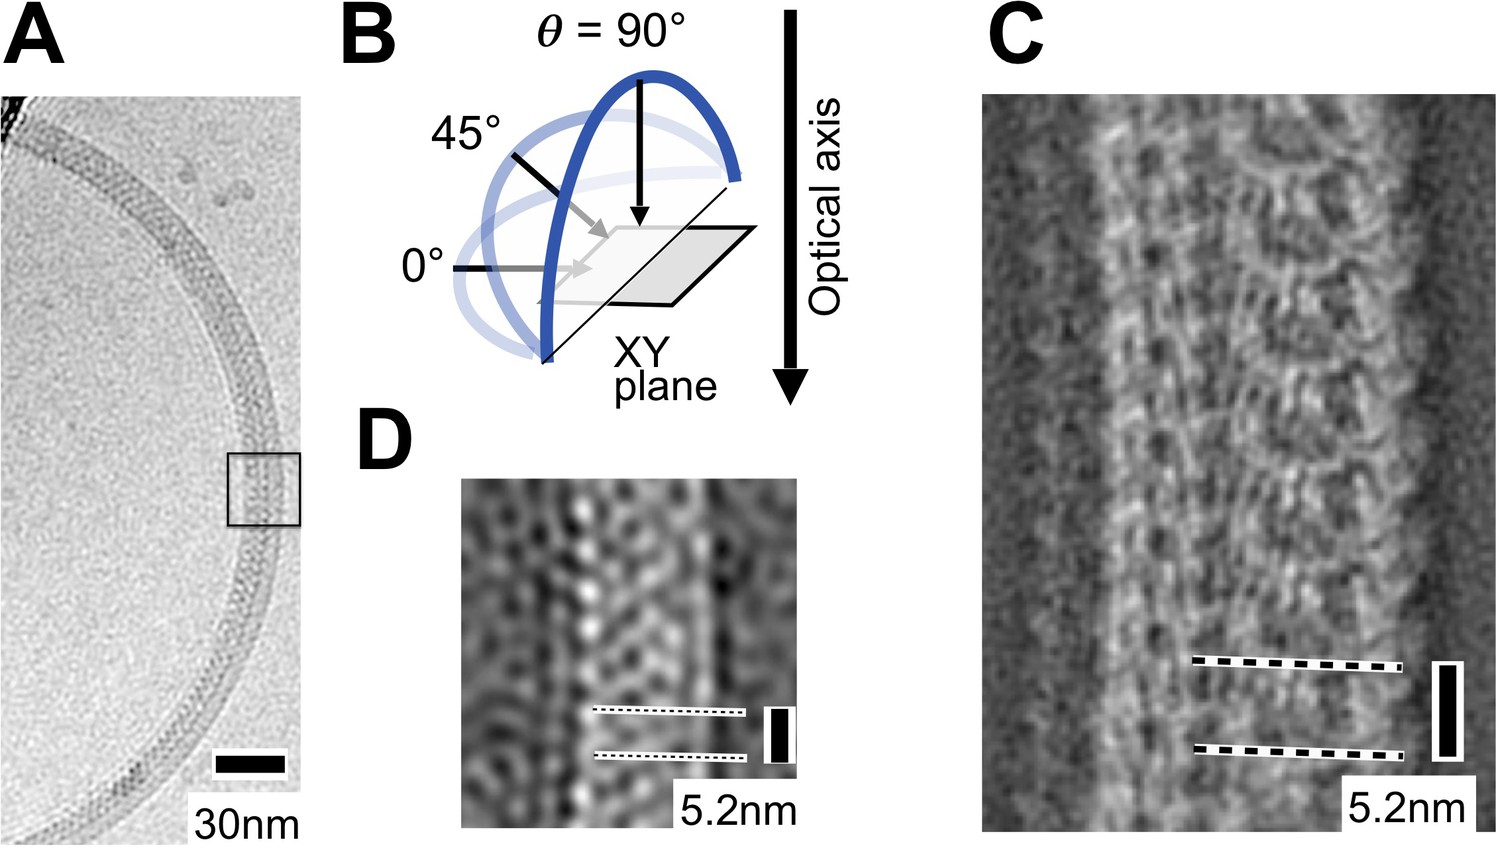
Preferred orientation of purified coiled L.biflexa flagellar filaments in the specimen ice layer.
(A) Cryo-electron micrograph showing a wild-type L. biflexa flagellar filament. (B) Schematic illustrating our definition of the tilt angle (θ) of a filament with respect to the XY-plane. (C) Representative 2D class average image from ~250 filaments imaged by cryo-EM at 0° tilt. Within cryo-EM samples, Leptospira flagella are largely restricted to the XY plane (θ~0°) due to confinement within the specimen ice layer, yielding a relatively small number of distinct class average images (<30). This restriction in the range of θ values prevents a meaningful 3D reconstruction from being obtained. (D) Close-up of the boxed region in A after applying a low-pass filter.
Figure 1—figure supplement 2
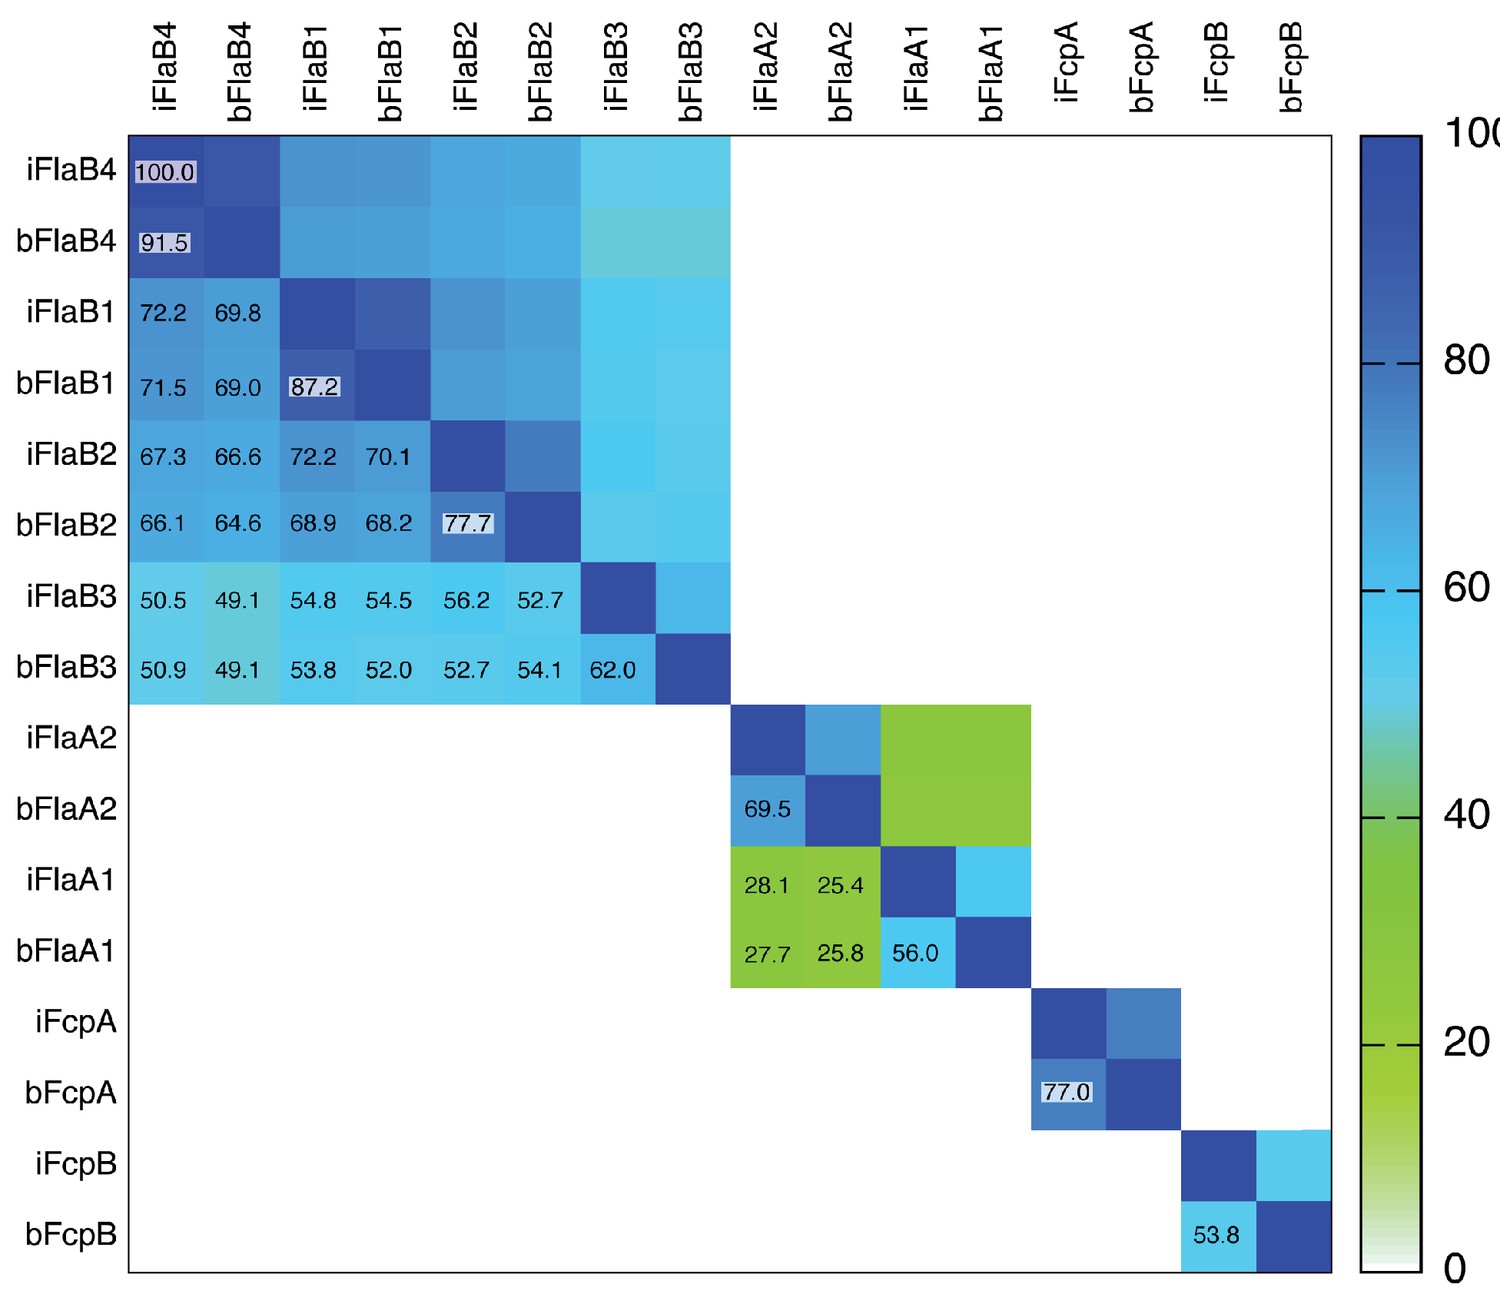
Square matrix plot illustrating pairwise sequence identities of flagellar filament proteins from Leptospira.
Individual boxes are colored according to the ramp scale shown on the right (white - green - blue). Percent identities are also indicated in each pairwise box (the main diagonal boxes correspond to 100% self-identities). The prefixes ‘i’ or ‘b’ on the column and row labels indicate Leptospira interrogans or L. biflexa, respectively, followed by the name of the protein. Note that FlaB3 is significantly less homologous to the other three FlaB isoforms. The two FlaA isoforms, FlaA1 and FlaA2 are homologous, albeit with low sequence identity (<30%). FcpA and FcpB are not homologous between them, and FcpA shows significantly higher sequence conservation among different Leptospira species, than FcpB.
Figure 2 with 5 supplements
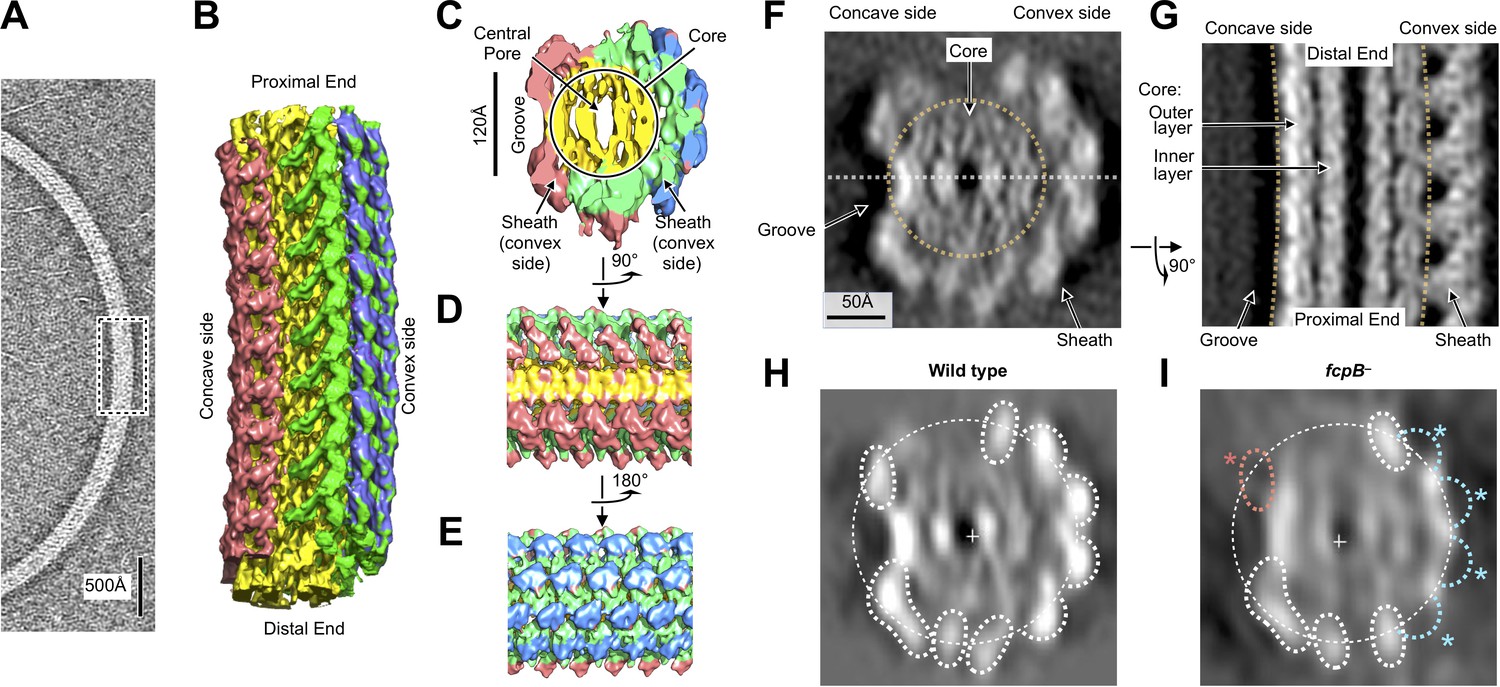
Flagellar filament purified from wild-type L. biflexa Patoc with asymmetric sheath layer visualized by cryo-tomographic sub-tomogram averaging.
(A) Cryo-tomographic slice of the flagellar filament in vitrified ice. Dashed box denotes the approximate dimensions extracted for sub-tomographic averaging. (B) Final averaged volume (isosurface representation) of the flagellar filament denoting segmented regions of sheath (red, green, and blue) and core (yellow). The red sheath regions are located on the inner curvature or ‘concave’ side of the filament, whereas the blue and green sheath regions are located on the outer curvature, or ‘convex’ side. (C) Cross-sectional view of the sub-tomographic average; the filament diameter ranges from 210 to 230 Å. (D – E) Rotated views of the sub-tomographic average. (F, G) Wild-type map axial and lateral cross-sections (respectively), highlighting asymmetric features including the ‘groove’ on the filament inner curvature. The white dashed line in (F) indicates the geometry of the lateral density cross-section in panel (G). (H) Projected wild-type map cross-section, filtered to 18 Å resolution, showing features corresponding to core and sheath elements. (I) Projected fcpB– map cross-section, highlighting differences with the wild-type projection in H. Four missing densities on the convex side (blue asterisks) correspond to fitted locations of FcpB in the wild-type map; an additional missing density on the concave side (red asterisk) is provisionally assigned as FlaA1 and/or FlaA2 (see text).
Figure 2—figure supplement 1
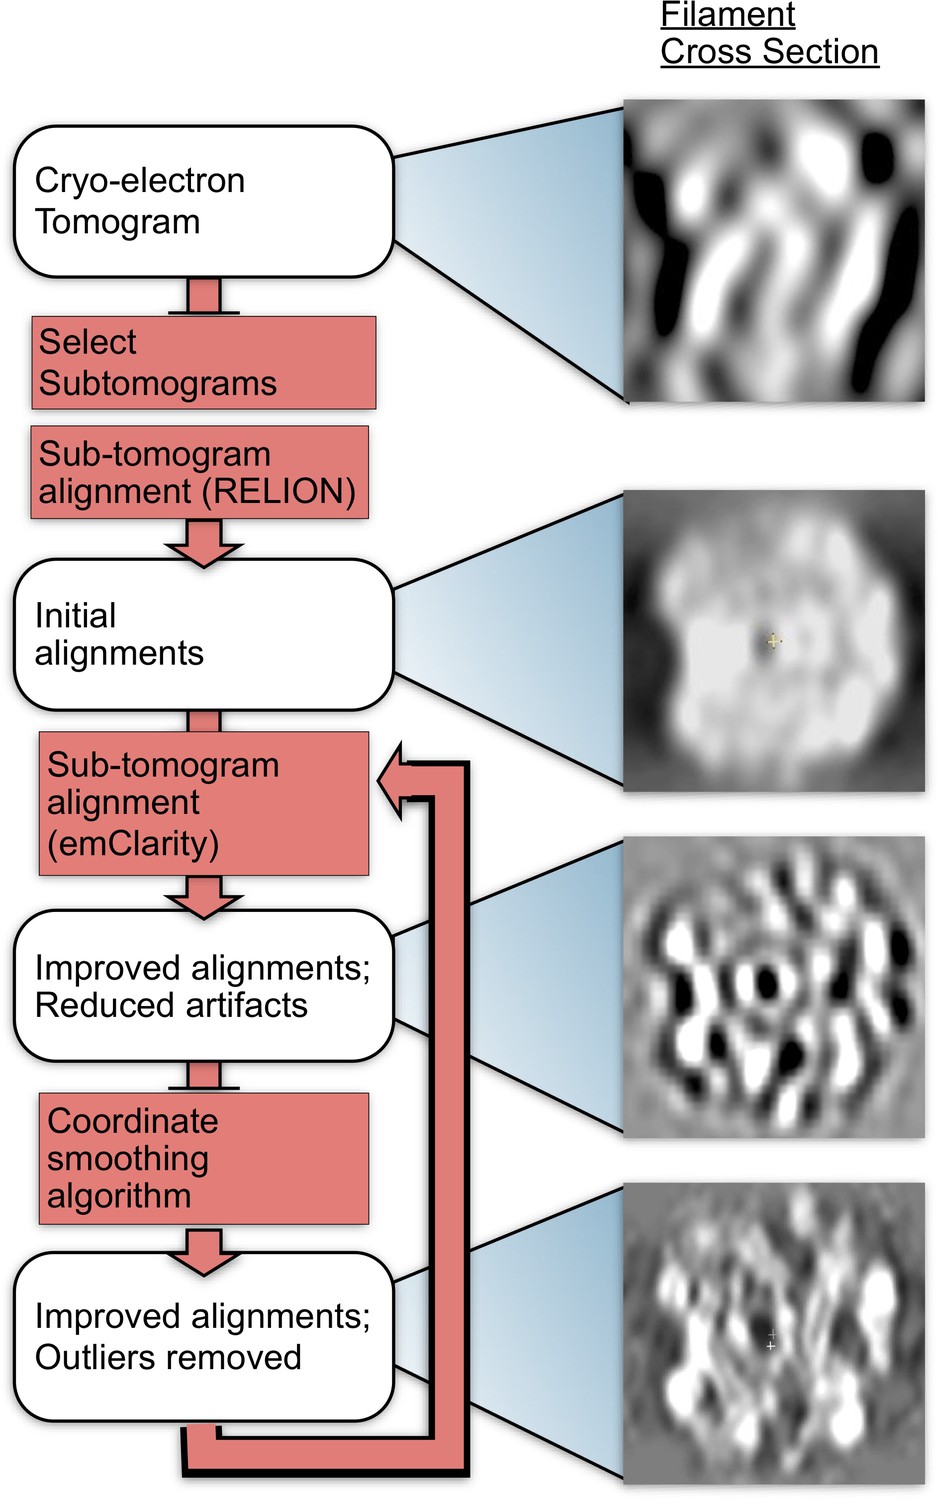
Methods flow chart.
Cross-sections of subtomograms or subtomogram averages resulting from each step are shown on the right.
Figure 2—figure supplement 2
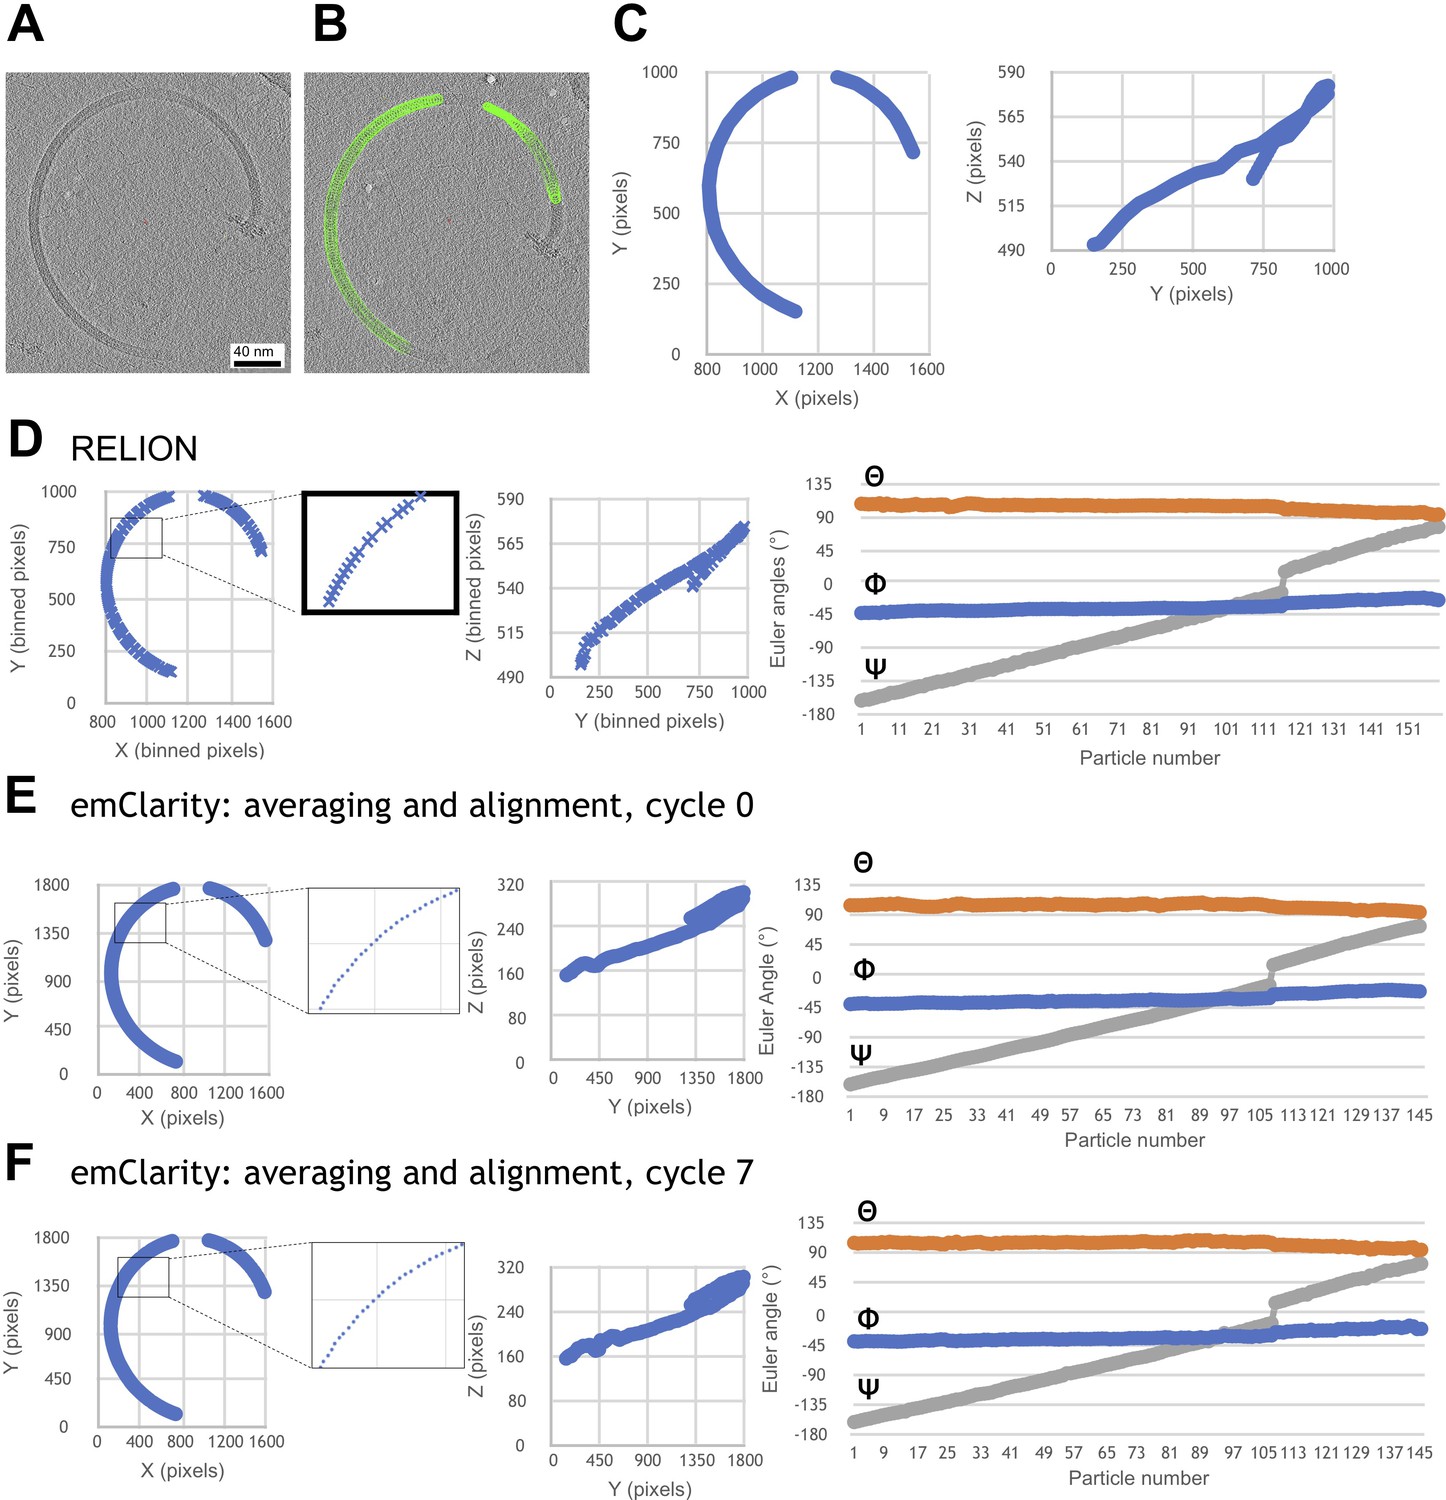
Progressive improvement of alignment parameters for a representative filament, after various stages of refinement.
The refinement procedure incorporated an in-house smoothing algorithm that rectifies gaps, duplicates and outliers to obtain continuous 3D coordinate models of every subunit from each selected filament segment. (A) Section through a reconstructed tomogram of a purified L. biflexa wild-type flagellar filament. (B) Particle selection (green spheres) that selects the filament trajectory through the tomogram slice. (C) Particle X/Y (left) and Y/Z (right) coordinates selected in B. Tomograms and coordinates shown here correspond to a binning of 2, at 5.208 Å/pixel. (D) Filament trajectory (XYZ coordinates and Euler angles) following the initial RELION refinement step. (E) Filament trajectory output following the first cycle of emClarity refinement. Application of the smoothing algorithm after the RELION step eliminates gaps seen in some sections of the filament trace (compare insets in panels D and E). (F) Filament trajectory following an additional smoothing step, followed by a second pair of emClarity/smoothing steps.
Figure 2—figure supplement 3
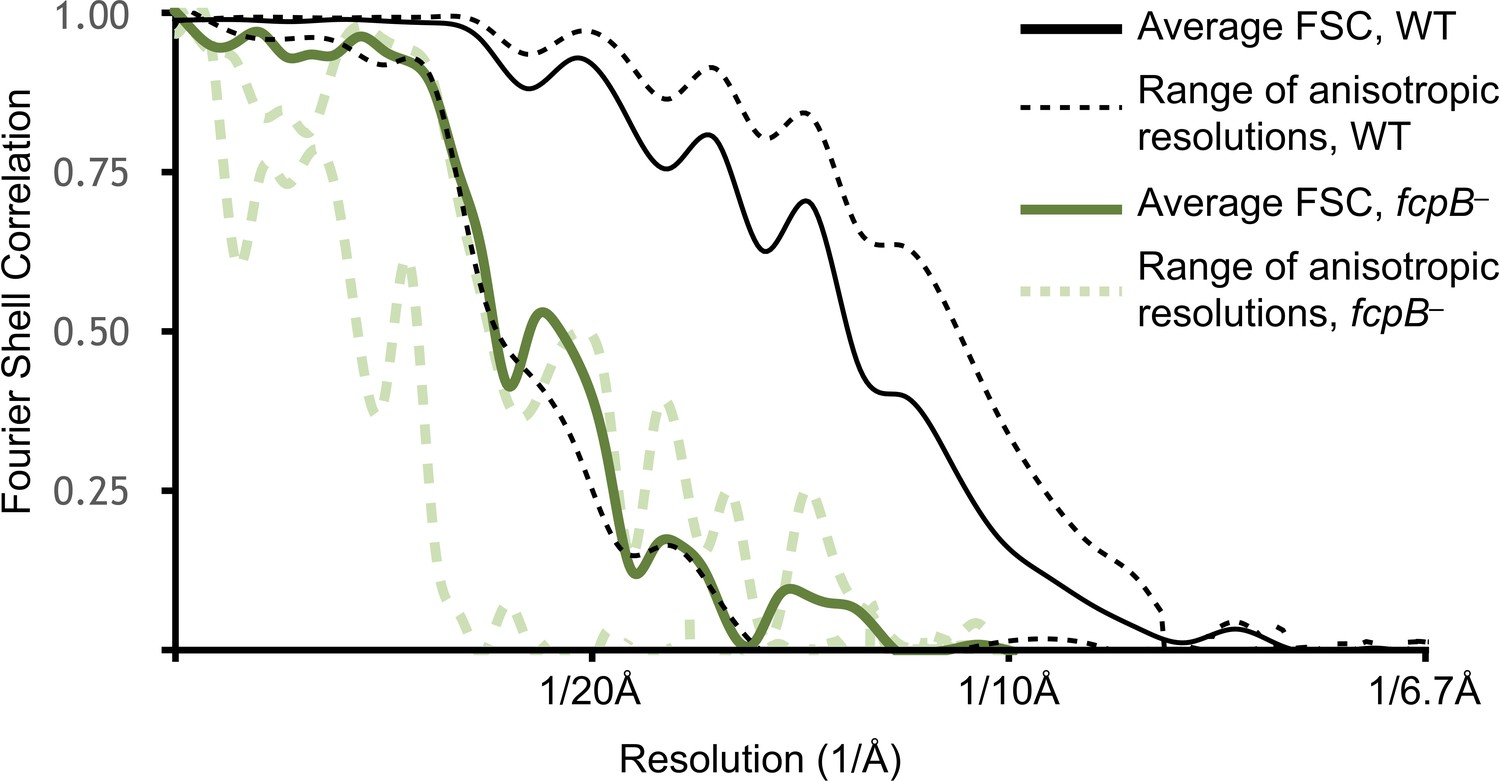
Resolution estimates for wild-type and fcpB– subtomogram average reconstructions.
Shown in dashed lines are Fourier shell correlation (FSC) curves that capture the resolution anisotropy using local sectors (‘cones’) in Fourier space. The corresponding resolution estimates range from ~9 Å in the best directions (perpendicular to the filament supercoiling axis, i.e. directions parallel to specimen ice layer plane) to ~18 Å in the worst direction (parallel to filament supercoiling axis, i.e. a vector perpendicular to the specimen ice layer plane). The latter direction corresponds to the ‘missing cone’ in our data due to a combination of strongly preferred filament orientation and limited tilt angle in the tomographic data collections. Resolution anisotropy results in a marked elongation of map features in this direction (orthogonal to the viewing plane in Figure 2A,B; vertical direction in Figure 2C–E). Results are only shown for the highest and lowest-resolution FSC cones.
Figure 2—figure supplement 4
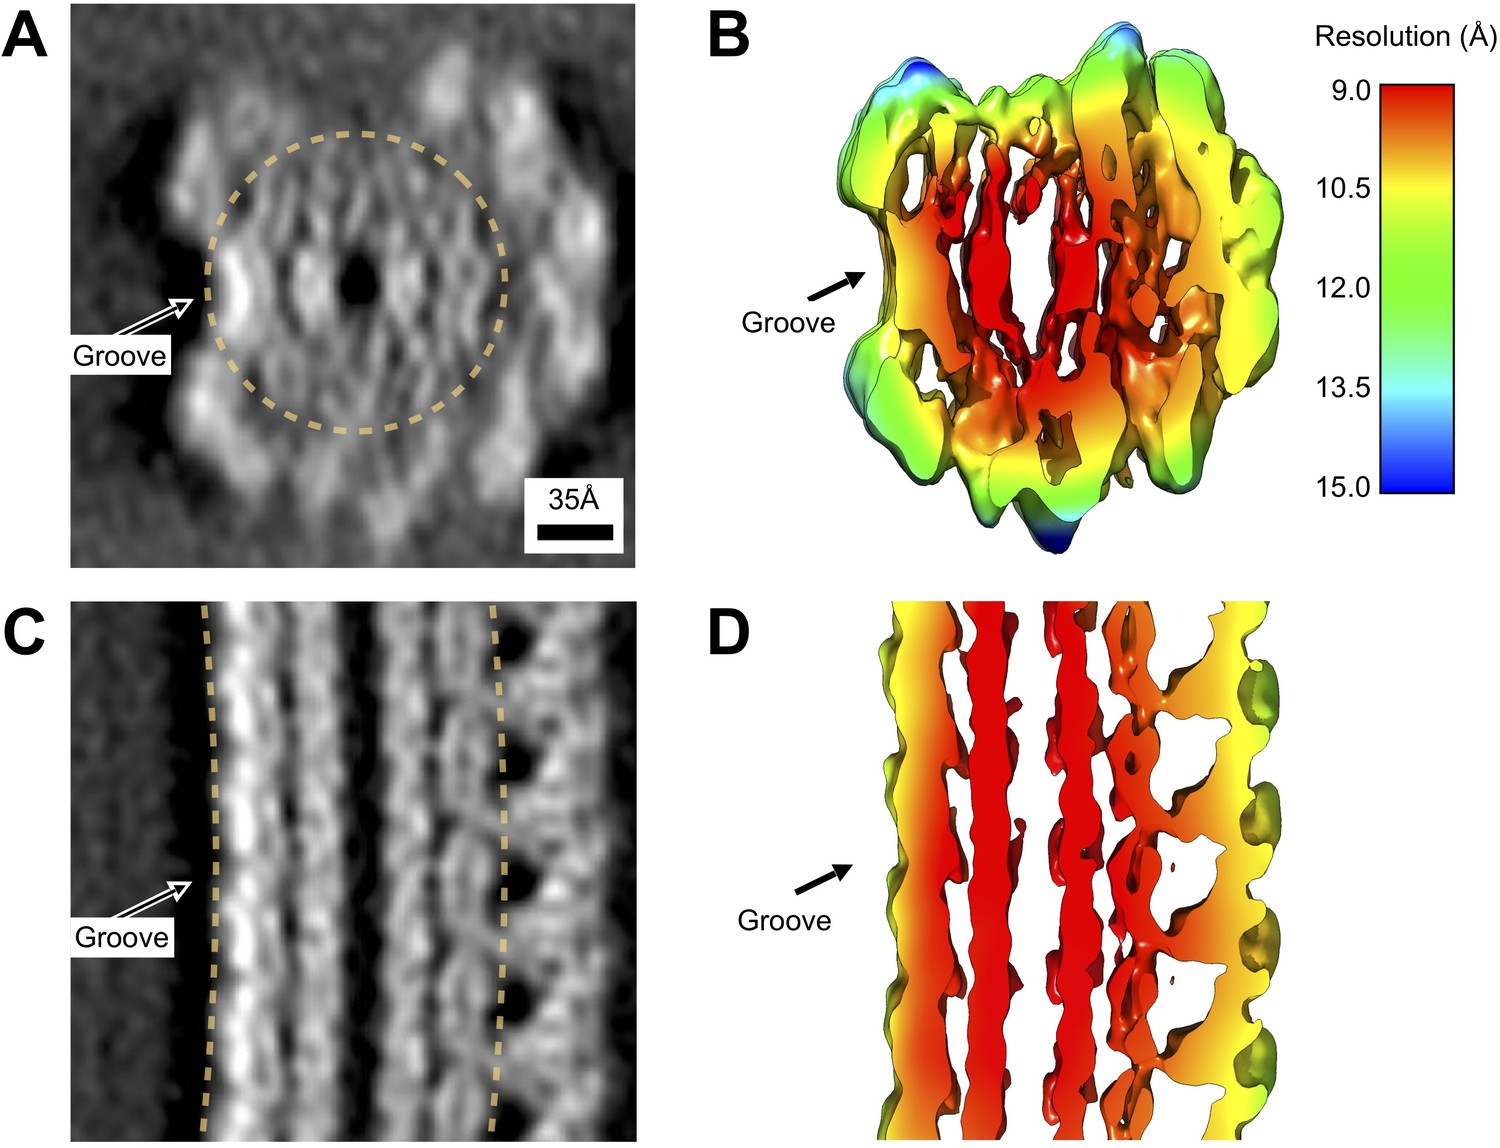
Local resolution estimates for the wild-type L. biflexa flagellar filament subtomogram average reconstruction.
(A, C) Projected thin cross-sections of the subtomogram average, revealing the presence of nanometer-scale features. An arrow marks the groove, corresponding to a systematic absence of sheath density on one side of the filament. (B, D) Slices through the corresponding density isosurface, colored by estimated local resolution (see Materials and methods). The reported average resolution within the core ranges from 9 to 10 Å. Within the sheath, the reported resolution ranges from 10 to 13 Å, with excursions up to ~15 Å found at the top of the axial cross section (C).
Figure 2—figure supplement 5
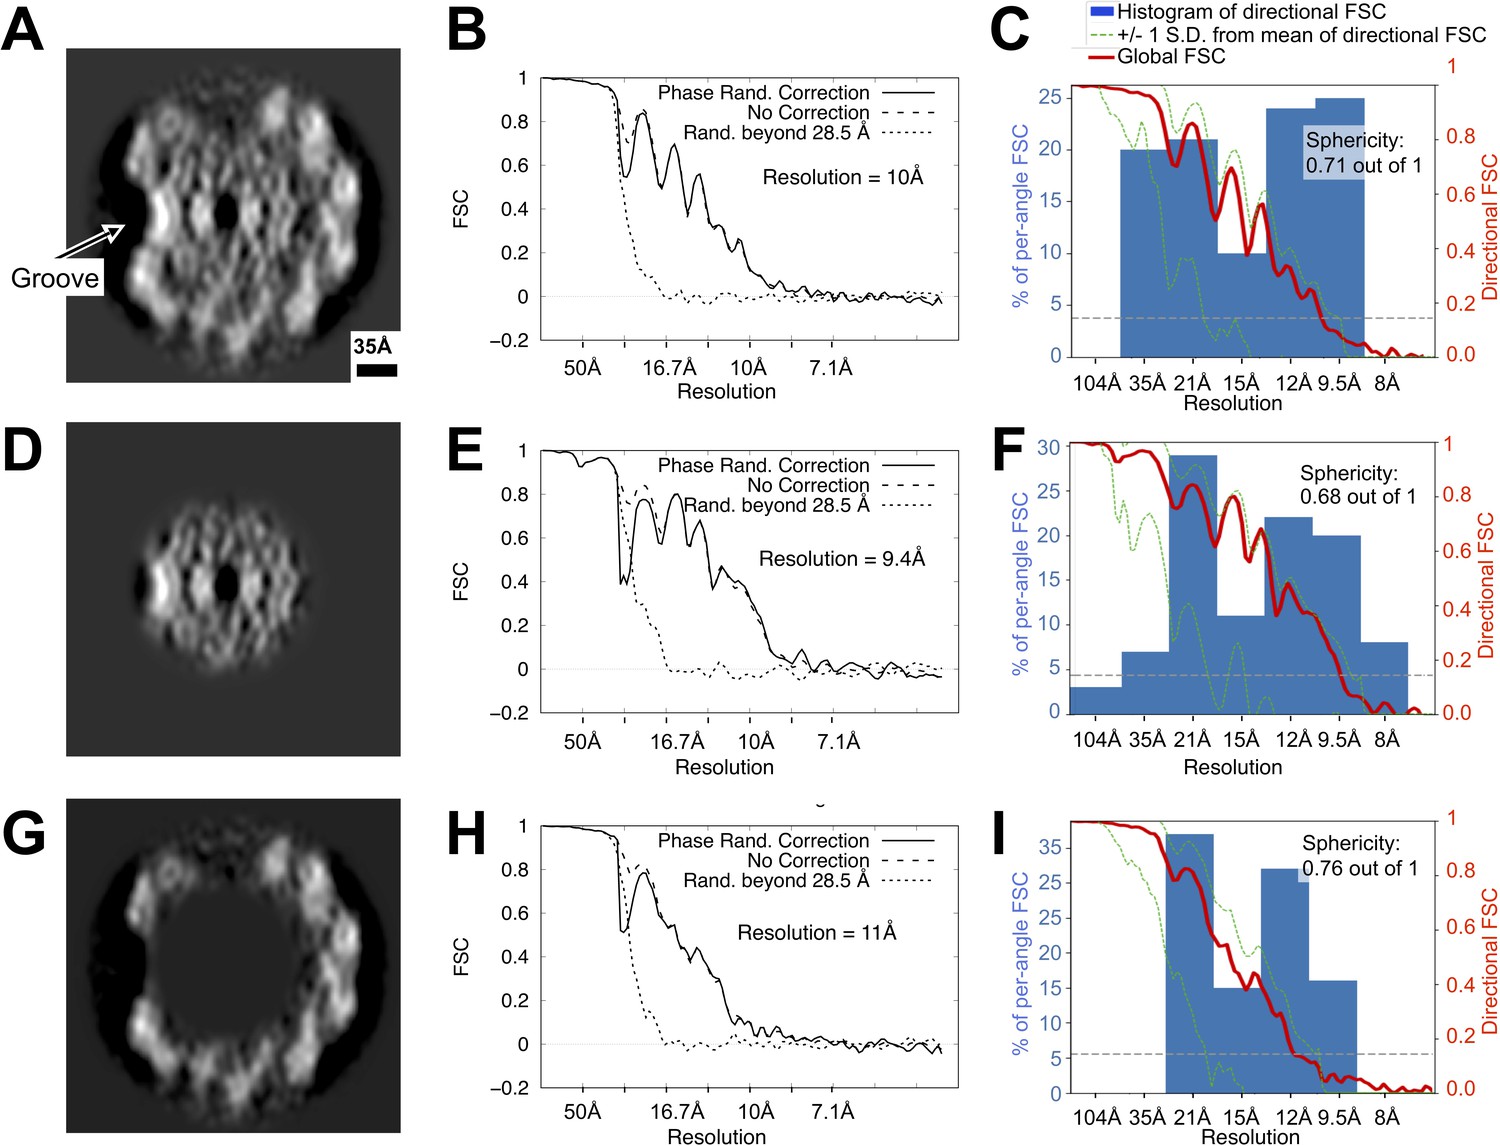
Directional resolution estimates for the wild-type Leptospira flagellar filament map, with separate estimates for masked core and sheath subregions.
(A, D, G) Map cross-sections following application of the three masks used during these calculations, corresponding to the whole filament, core, and sheath regions, respectively (see Methods). (B, E, H) Non-directional Fourier Shell Correlation estimates for the three masked regions, calculated with the Relion software suite. (C, F, I) Directional Fourier Shell Correlation estimates for the three masked regions using the 3D FSC program (Tan et al., 2017) (see Materials and methods). The histogram (blue bars) reports the distribution of estimated resolutions for different angular directions (conical regions in Fourier space). Due to strongly preferred filament orientations in the sample (see Figure 1—figure supplement 1), a cone of data is missing from the map Fourier transform. As a result, a significant drop-off is observed in the reported resolution for angular directions that coincide with the missing cone, as reflected in the histogram: reported resolutions are distributed widely, from ~35 Å in the worst directions (those close to the vertical axis in (A, D, G) to ~8 Å in the best directions. Although this resolution anisotropy leads to ‘smearing’ of density features (vertical direction in panels (A), (D), (G), the asymmetric groove is large enough to be readily resolved in the wild-type map. While features on the left side in panels (A), (D), (G) (where the groove is located) diverge from the right side (where there is no groove), the average map resolution is comparable at these two locations (Figure 2—figure supplement 4), supporting the observed asymmetry between the two sides of the filament. See Figure 3—figure supplement 4.
Figure 3 with 6 supplements
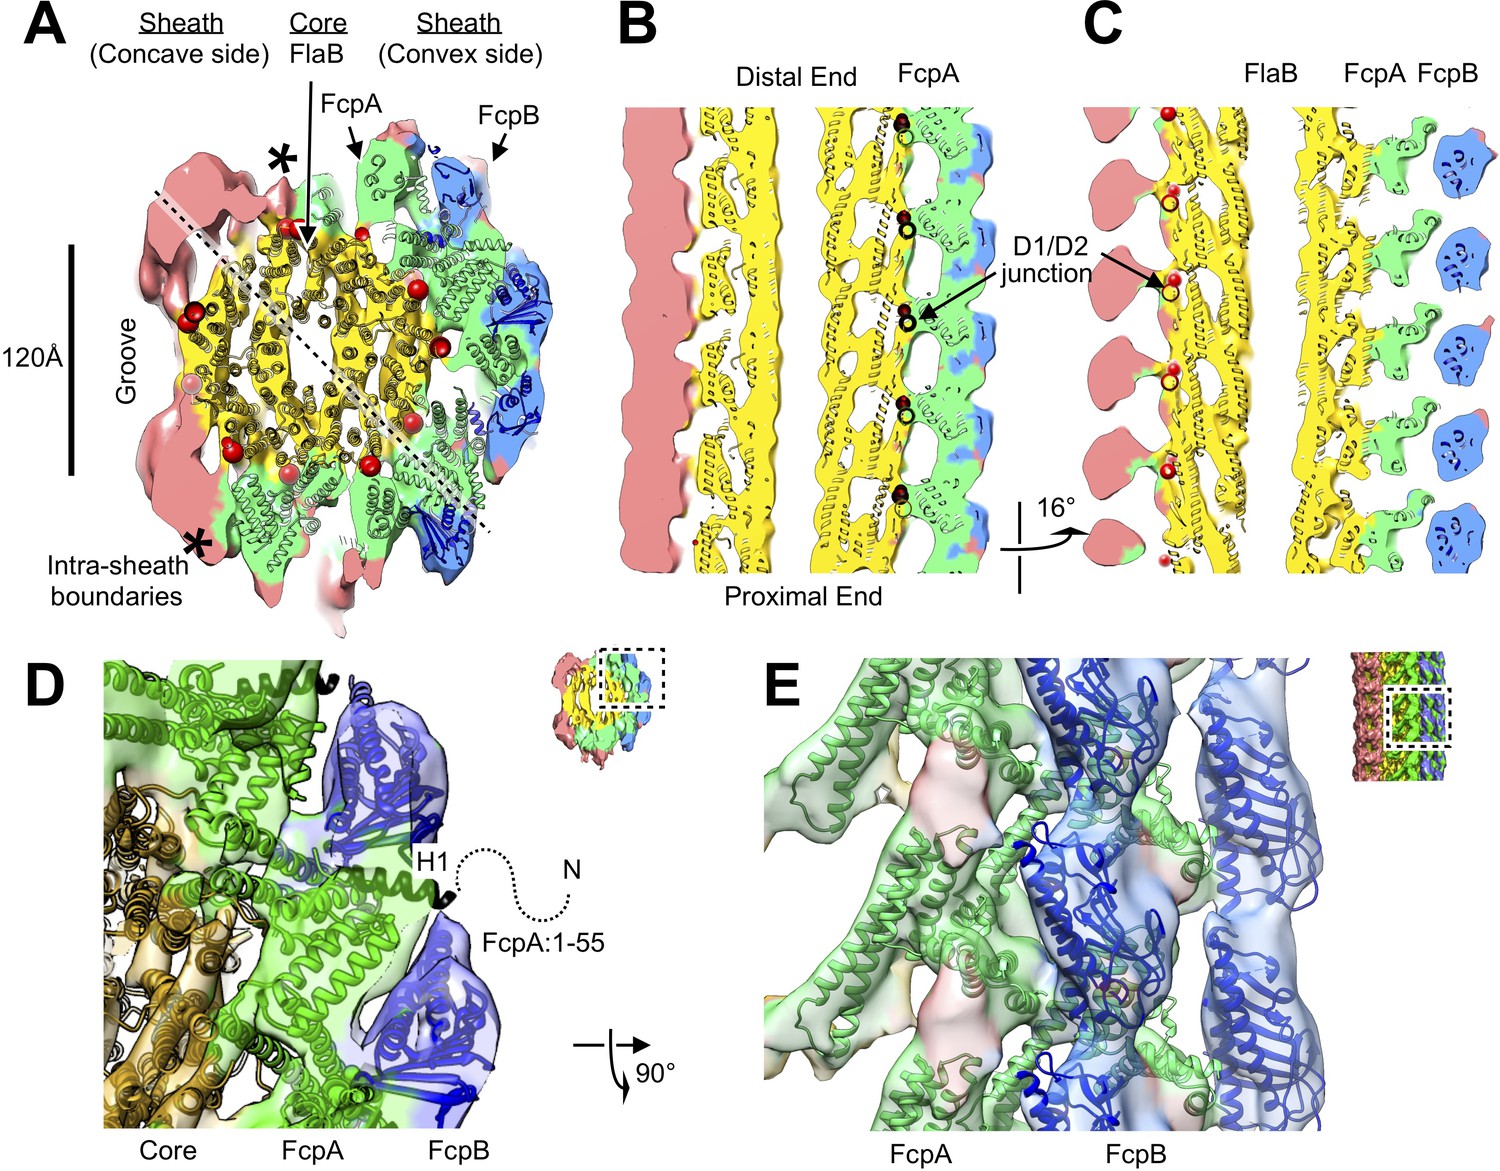
Atomic model of the core and sheath regions of the L. biflexa flagellar filament obtained by docking X-ray crystal structures into the cryo-EM map.
(A) Cross-sectional slice of the filament density map isosurface with fitted models of the pseudo-symmetric core assembly (yellow ribbons) and two sheath components, FcpA and FcpB, which localize to the filament outer curvature. Six FcpA protofilaments (green ribbons) directly contact the core and support an outer layer consisting of four FcpB protofilaments (blue ribbons). Asterisks denote boundaries between FcpA and inner curvature density (red). Red markers denote the location of the junction between the modeled D1 α-helical domain of FlaB and the species-specific insertion that substitutes for the D2/D3 outer domains found in Salmonella spp. FliC (flagellin) but not in Leptospira spp. FlaB. (B) Longitudinal slice through the filament center, corresponding to the dashed line in A, showing the central channel surrounded by the core and sheath layers. The major interface region between FcpA and the core coincides with this insertion. (C) A 16° rotated view of the map in B showing core-sheath contacts at the site of the FcpB insertions on the opposite side of the filament (concave side); identity of the sheath protein (red) is unassigned. (D) Close-up cross-sectional view of the averaged filament map showing X-ray model fits of FcpA and FcpB in the outer curvature sheath region. (E) Close-up view of the averaged filament map rotated 90° relative to the view in D showing X-ray model fits.
Figure 3—figure supplement 1
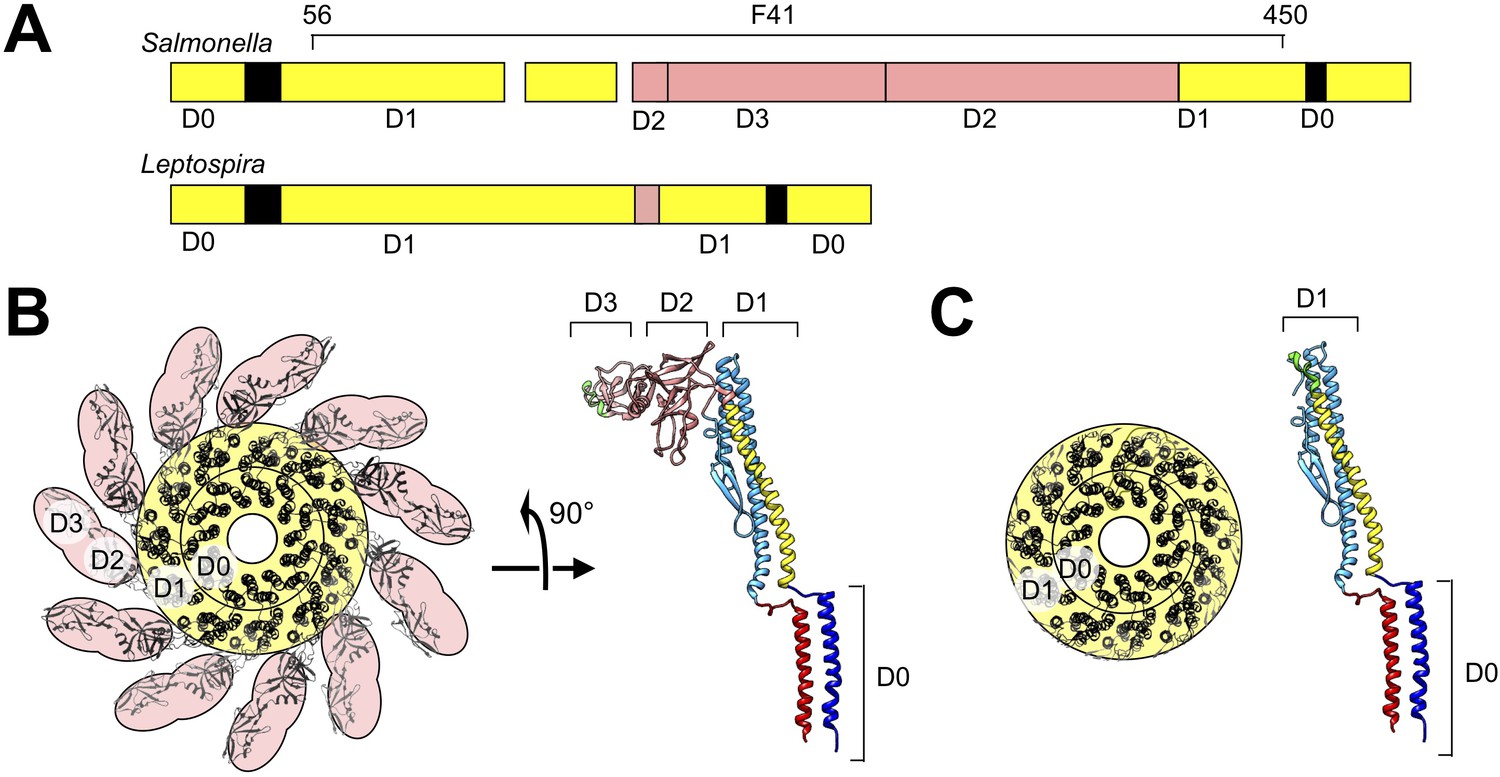
Structure model of Leptospira FlaB by homology modeling and sequence alignment.
(A) Schematic of aligned sequences of Salmonella FliC (top) and Leptospira FlaB (bottom), indicating assignments for subdomains D0 and D1. (B) Axial view of the Salmonella flagellar filament structure (left) and side view of the component FliC structure (right; PDB ID 1UCU Yonekura et al., 2003) depicting the locations of subdomains D0-D3. (C) Corresponding views of the modeled Leptospira FlaB core assembly.
Figure 3—figure supplement 2
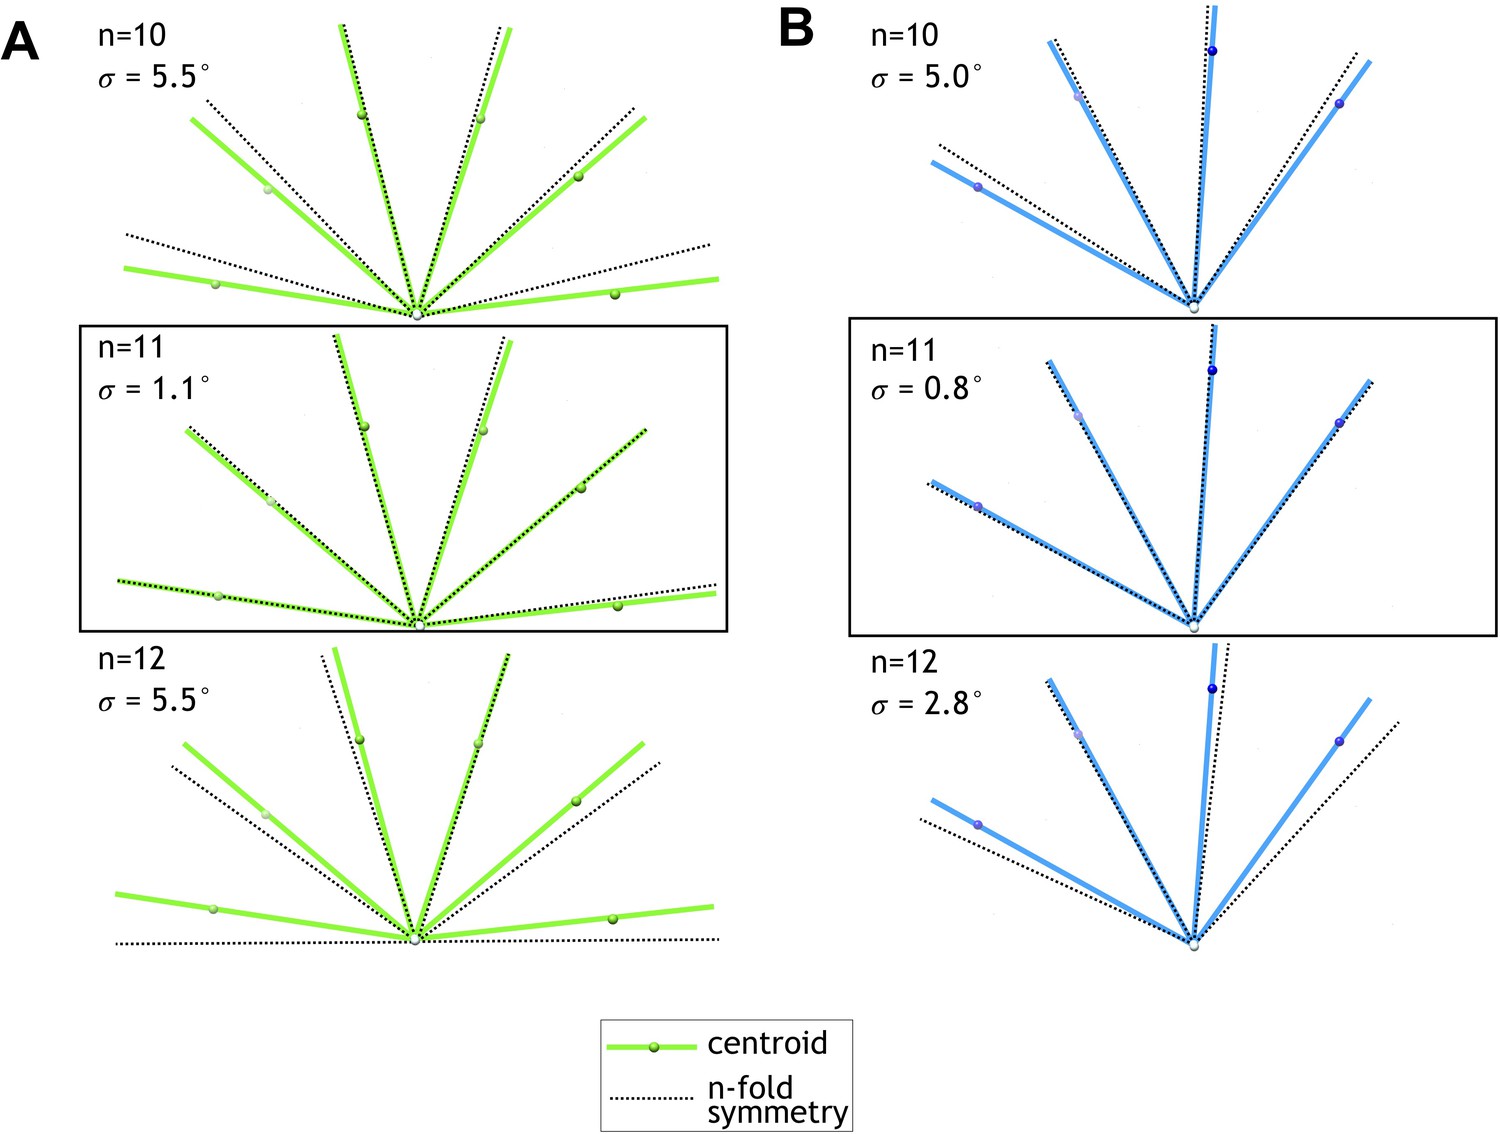
Centroid angular positions of fitted FcpA and FcpB models match an 11-protofilament pseudo-helical lattice.
(A) Filament cross-sectional view showing centroid positions of fitted FcpA models (green spheres) and their angular position (green lines) with respect to the middle of the central channel (white sphere). Overlaid are predicted angular positions (black dashed lines) for symmetric helical lattice sites of the given symmetry type (n = 10, 11, or 12 protofilaments). Root mean squared angular deviations between centroid and symmetric angular positions (σ) are smallest for the 11-protofilament case. (B) Plots of FcpB centroid positions, as in A, indicating best agreement with an 11-protofilament binding pattern.
Figure 3—figure supplement 3
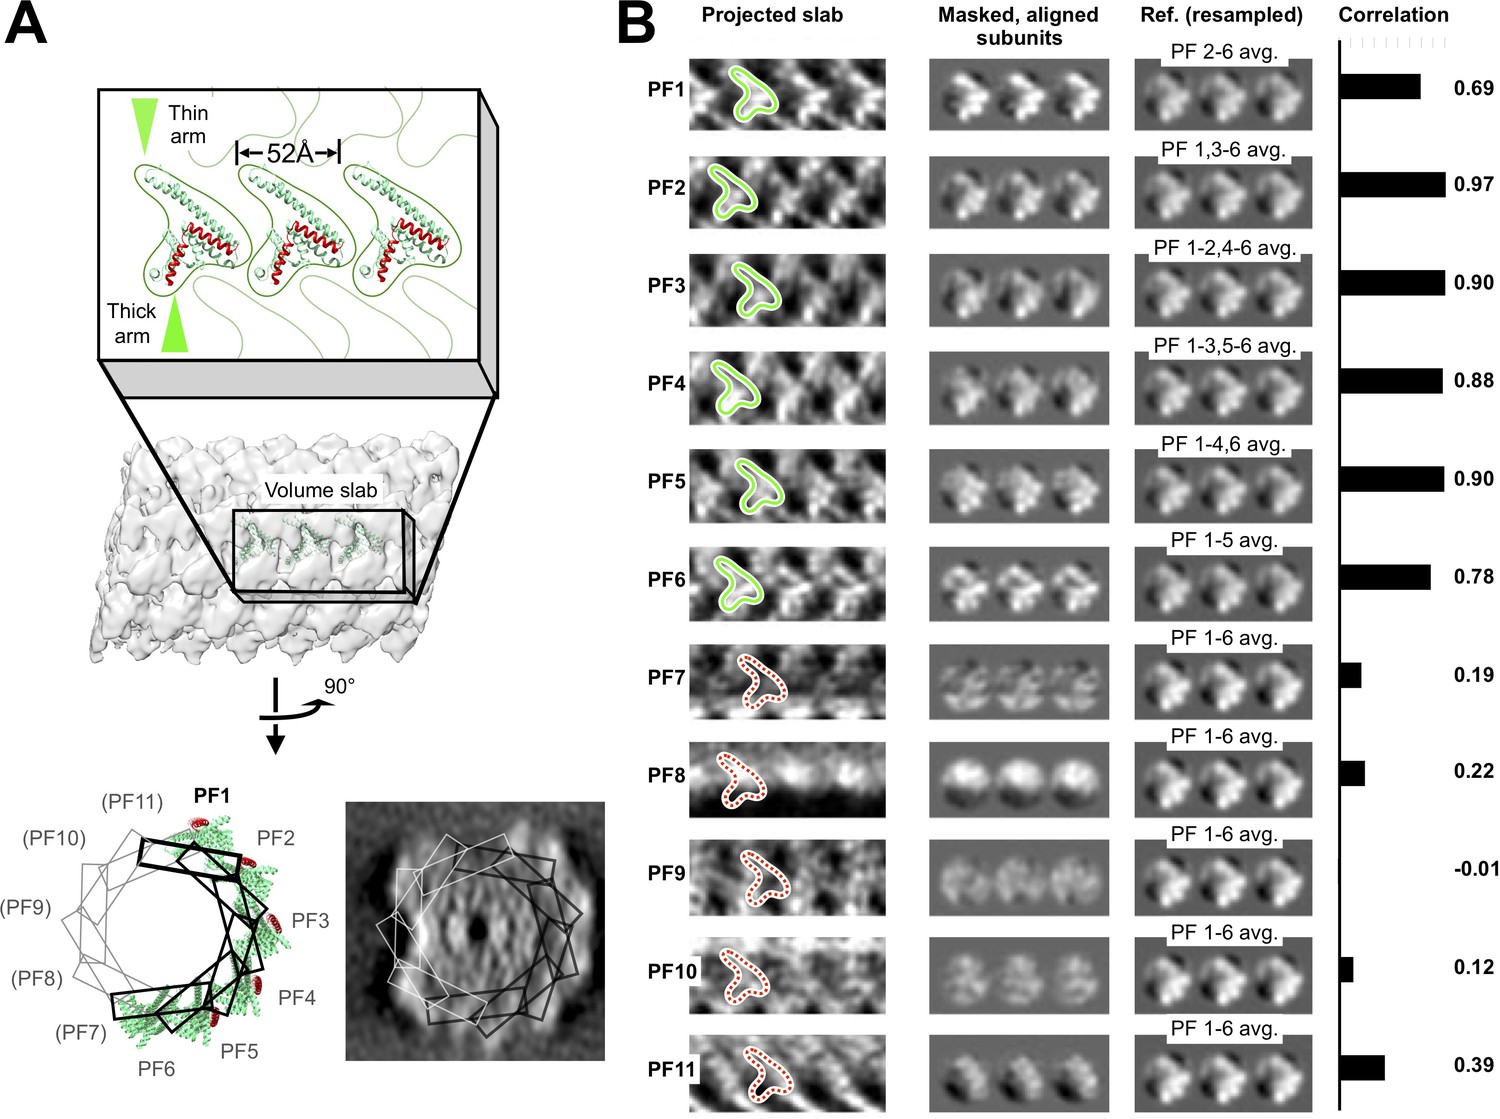
Identification of six similarly arranged FcpA protofilaments in the flagellar filament sheath.
(A) Schematic depicting locations of symmetry-related ‘slab’ volumes defined within the filament sheath layer, and corresponding docked FcpA sites. Volume slabs are rotated in progressive increments of 360°/11 = 32.7° about an axis tangent to a curve running through the filament center (which corresponds to the filament helical axis, for a straightened filament). (B) Two-dimensional projections (left column) of the slab volumes in A, revealing six rows (‘PF1’ – ‘PF6’) of distinctive ‘V’-shaped features consistent with the size and shape of FcpA monomers (green outlines) docked onto the core surface. V-shaped features are absent (red dashed outlines) from symmetry-related locations in remaining volume slabs (‘PF7’ – ‘PF11’), indicating a discontinuity in the corresponding pseudo-helical array of FcpA molecules identified by computational docking studies (Figure 3). In the middle column, density features are aligned with each other by applying axial shifts corresponding to the pseudo-helical lattice parameters, and circular masks are applied to isolate features corresponding to non-overlapping regions of individual FcpA subunits. The right column shows consensus averages of identified ‘FcpA’ sites, used as references for cross correlation comparison with the masked areas in the middle column. To avoid spuriously high cross-correlation values, the reference image for each protofilament is resampled to exclude the identified ‘FcpA’ site from that same protofilament, if present. Cross-correlation scores between protofilament regions and the references reveal a strong resemblance of the six identified FcpA sites to the consensus features (cross-correlation ≥0.69). In contrast, cross-correlation of the remaining five sites to the references is much lower (≤0.39), suggesting that FcpA is either absent or binds in a very different configuration. Note that the much lower correlation between PF7-PF11 sites and the references (B), compared with the PF1-PF6 sites, cannot be explained by artifacts due to the ‘missing cone’ of Fourier data in the subtomogram average (due to preferred sample orientation); the range of axial rotations spanned by the PF1–PF6 sites is more than 180°, encompassing all possible orientations of the missing cone. Thus, missing cone artifacts seen in any FcpA subunits bound to PF7-PF11 would be comparable to those in PF1-PF7.
Figure 3—figure supplement 4
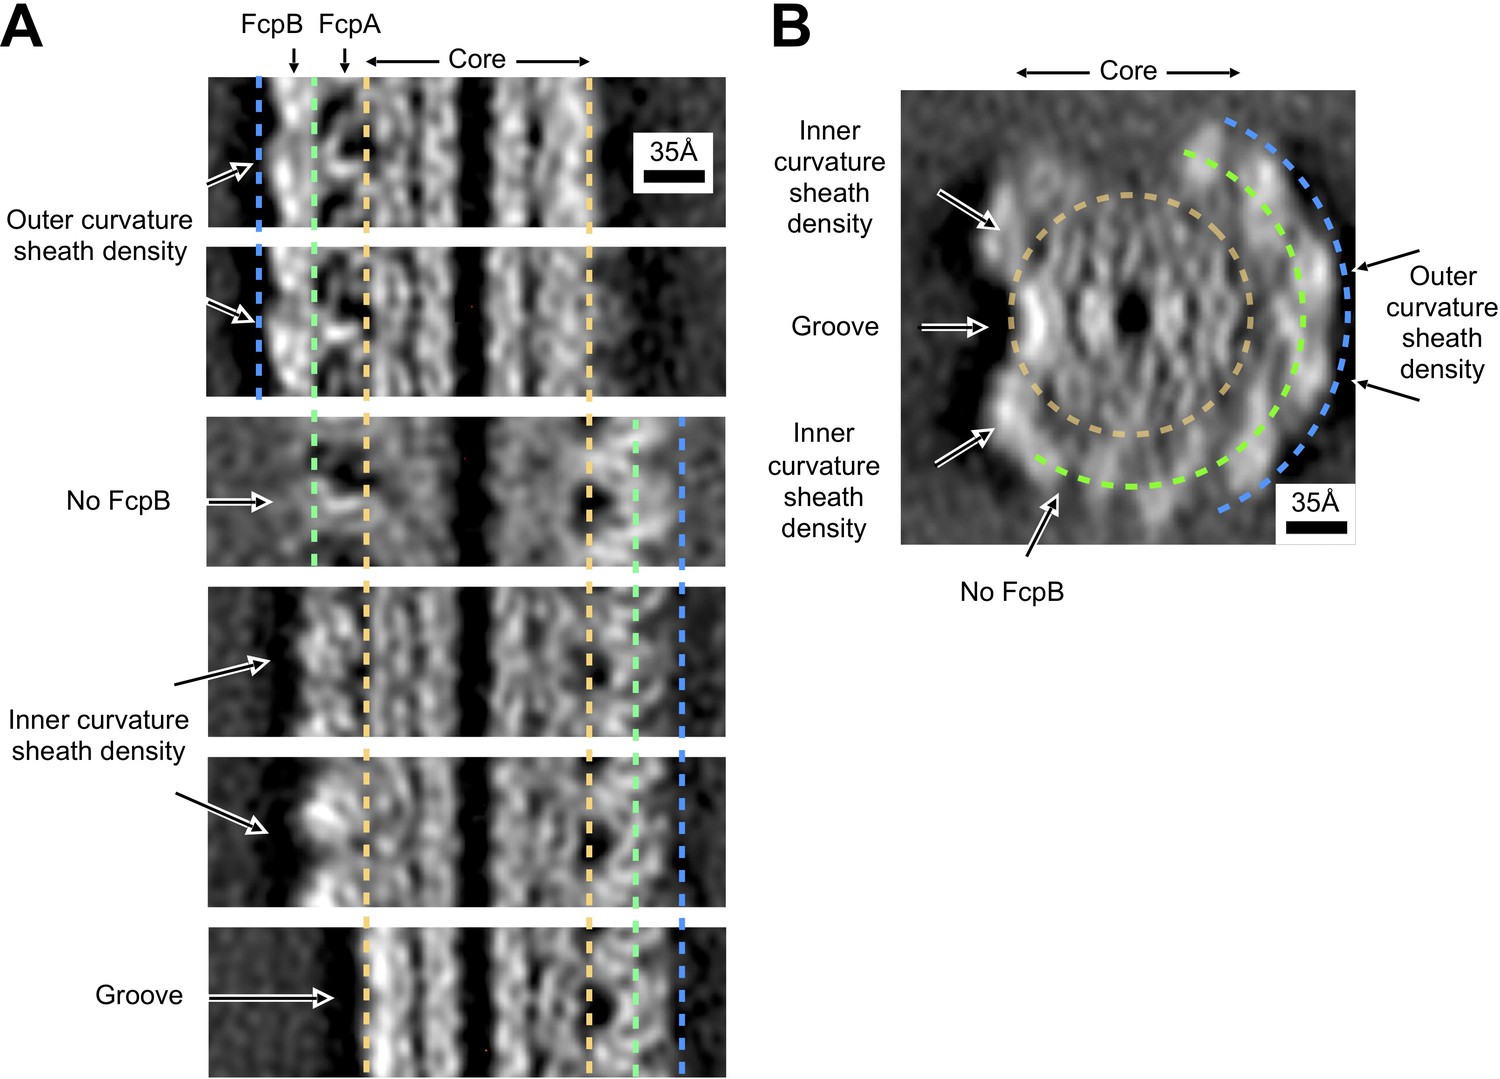
Asymmetry of inner and outer sheath density features in wild-type Leptospira filaments.
(A) Comparison of sheath density features for different lateral cross sections of the wild-type Leptospira subtomogram average, related by pseudo-helical symmetry. The core region is delineated by gold dashed lines; bounds for FcpA and FcpB regions are denoted by green and blue dashed lines, respectively. For sites on the outer curvature where we identified occupancy for both FcpA and FcpB (top two panels), two distinct density layers are observed corresponding to the two components. Note the presence of radial spoke-like features as well as large, characteristic voids (dark regions) corresponding to the FcpA layer. For sites on the inner curvature (fourth and fifth panels), sheath density features have a distinctly more globular character (note the absence of spoke-like features or large voids). For the FcpA site where the FcpB locus was vacant (third panel, ‘No FcpB’), the features are ‘smeared’ in the horizontal direction due to resolution anisotropy (see Figure 2—figure supplement 5). However, note that characteristic features of the FcpA/FcpB sheath layer located on the opposite side of the core can still be distinguished in this panel (compare the right-hand sides of panel 3 and panels 4–6)– thus indicating that individual subunit features can still be resolved, consistent with the estimated range of anisotropic resolution values (worst resolution in the sheath ~8–35 Å; see Figure 2—figure supplement 5). (B) Axial cross-section of the wild-type Leptospira subtomogram average, with arrows indicating the cross-section directions for the six panels in A. Gold, green and blue dashed lines denote the identified core, FcpA and FcpB regions for our model.
Figure 3—figure supplement 5
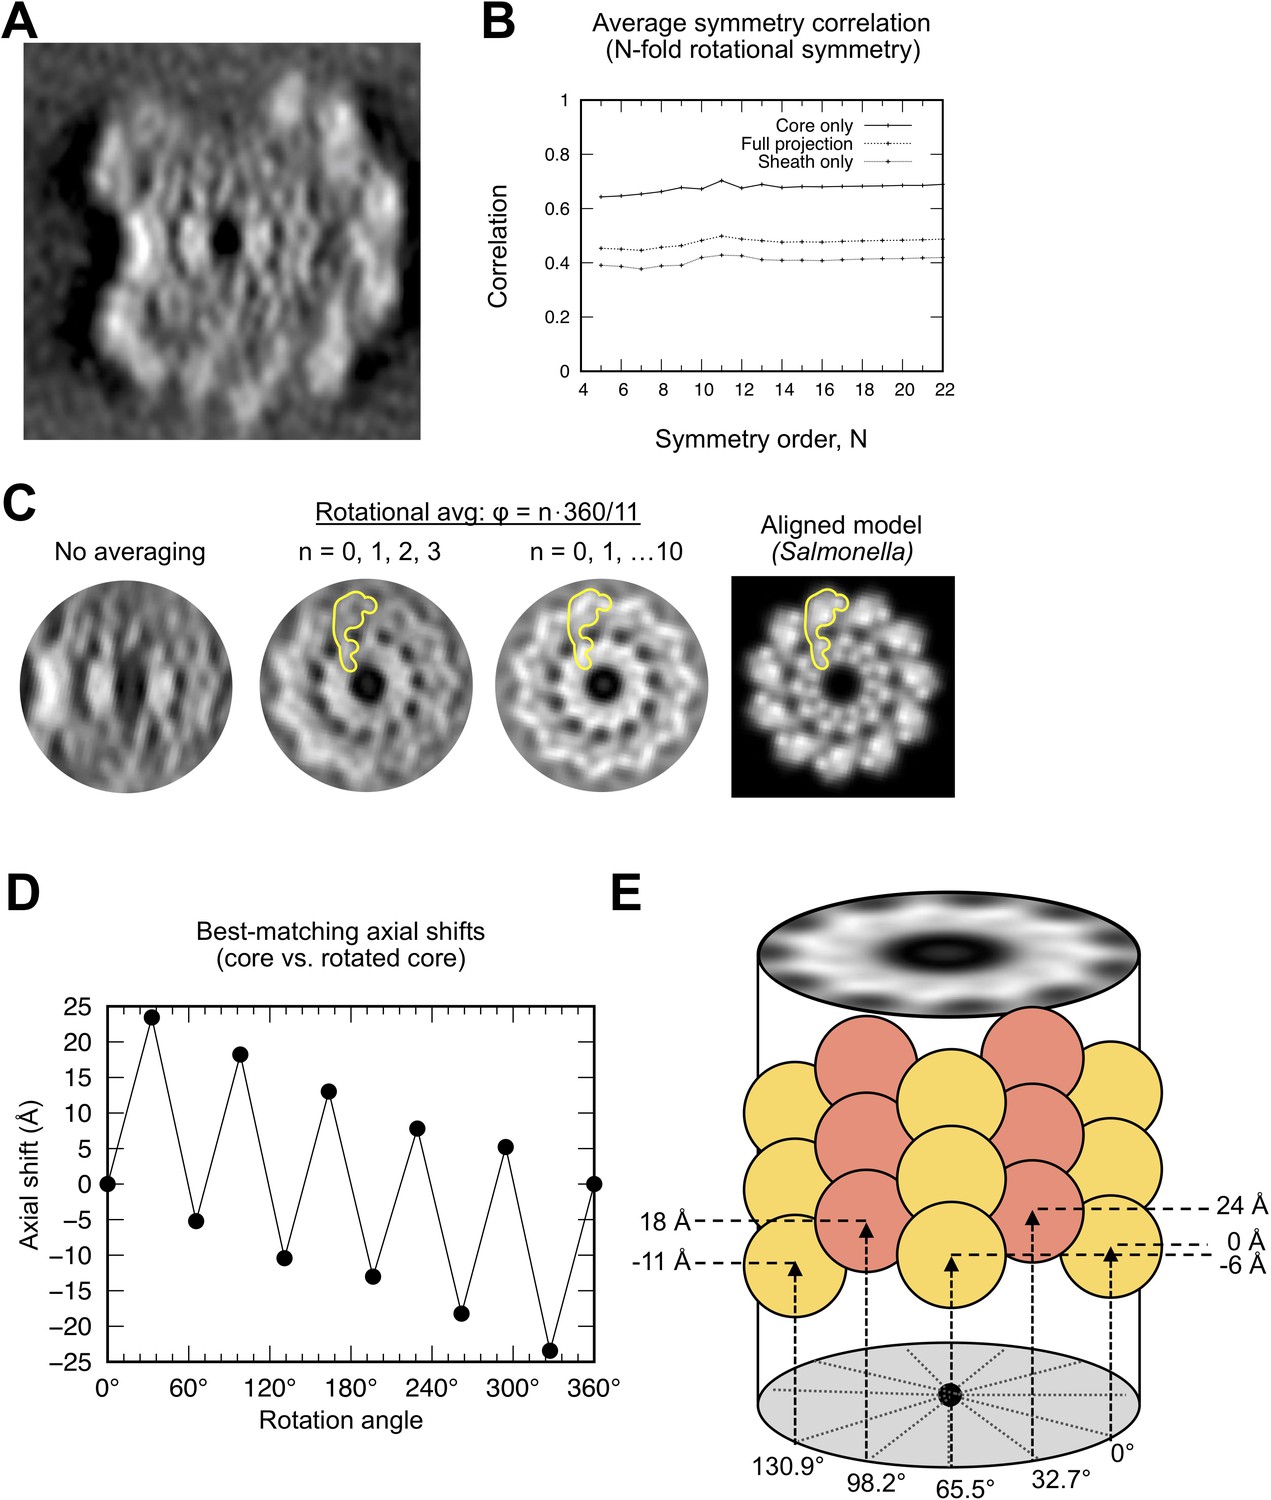
Symmetry analysis of the Leptospira core indicates an 11-protofilament architecture.
(A) Projected filament cross section of a 52Å-long segment of the wild-type L. Biflexa flagellar filament. (B) Plot of the averaged cross-correlation between the image in A and N rotated copies of itself, corresponding to rotations of 1*360°/N, 2*360°/N, … (N-1)*360°/N about the filament center. Thus, for an image containing an 11-fold symmetric feature, the averaged cross-correlation value will be highest for symmetry order N = 11. Systematically varying N in this calculation reveals a maximum corresponding to 11-fold radial symmetry, matching the symmetry of the Salmonella flagellum. Cross-correlations were computed for the entire image (‘full projection’) as well as masked sub-regions corresponding to the core (‘core only’) and sheath (‘sheath only’). All three of these calculations yield a maximum score for N = 11. (C) The 11-fold symmetry operator identified in B was used to average the projected map, reducing the effects of the missing wedge and substantially improving molecular features. Leftmost panel shows the original core region, center-left panel shows the result of adding four symmetry-related copies (N = 11; Φ = 0*360°/11, 1*360°/11, 2*360°/11, 3*360°/11) and center-right panel shows the result of adding 11 symmetry-related copies (resulting in an 11-fold symmetric image). Features in the averaged images (yellow shape) resemble the projected D0/D1 subdomain within a projected Salmonella flagellar filament cross section (rightmost panel; synthetic image derived from PDB ID 3A5X). (D) Results of three-dimensional cross-correlation analysis between the wild-type sub-tomographic average volume and rotated copies of itself. For each rotation value (Φ=0*360°/11, 1*360°/11, … 11*360°/11), a volume copy was rotated about an axis running through the center channel and masked to exclude all but the core region of a single 52 Å axial repeat. A 3D cross-correlation map was then computed between the resulting volume and the original reference, and the axial shift described by the top-scoring peak was plotted for each Φ rotation value. The resulting graph describes a staggered pattern of helical subunit positions closely matching the 11-start helical symmetry observed in several other reported bacterial flagella structures (Namba et al., 1989; Wang et al., 2017). The estimated pseudo-helical parameters (~26 Å helical pitch,~5.5 subunits per turn) closely match helical parameters established for several other flagellar filaments (i.e. Salmonella:~25.5 Å – 27 Å helical pitch, 5.4x – 5.5x subunits per turn).
Figure 3—figure supplement 6
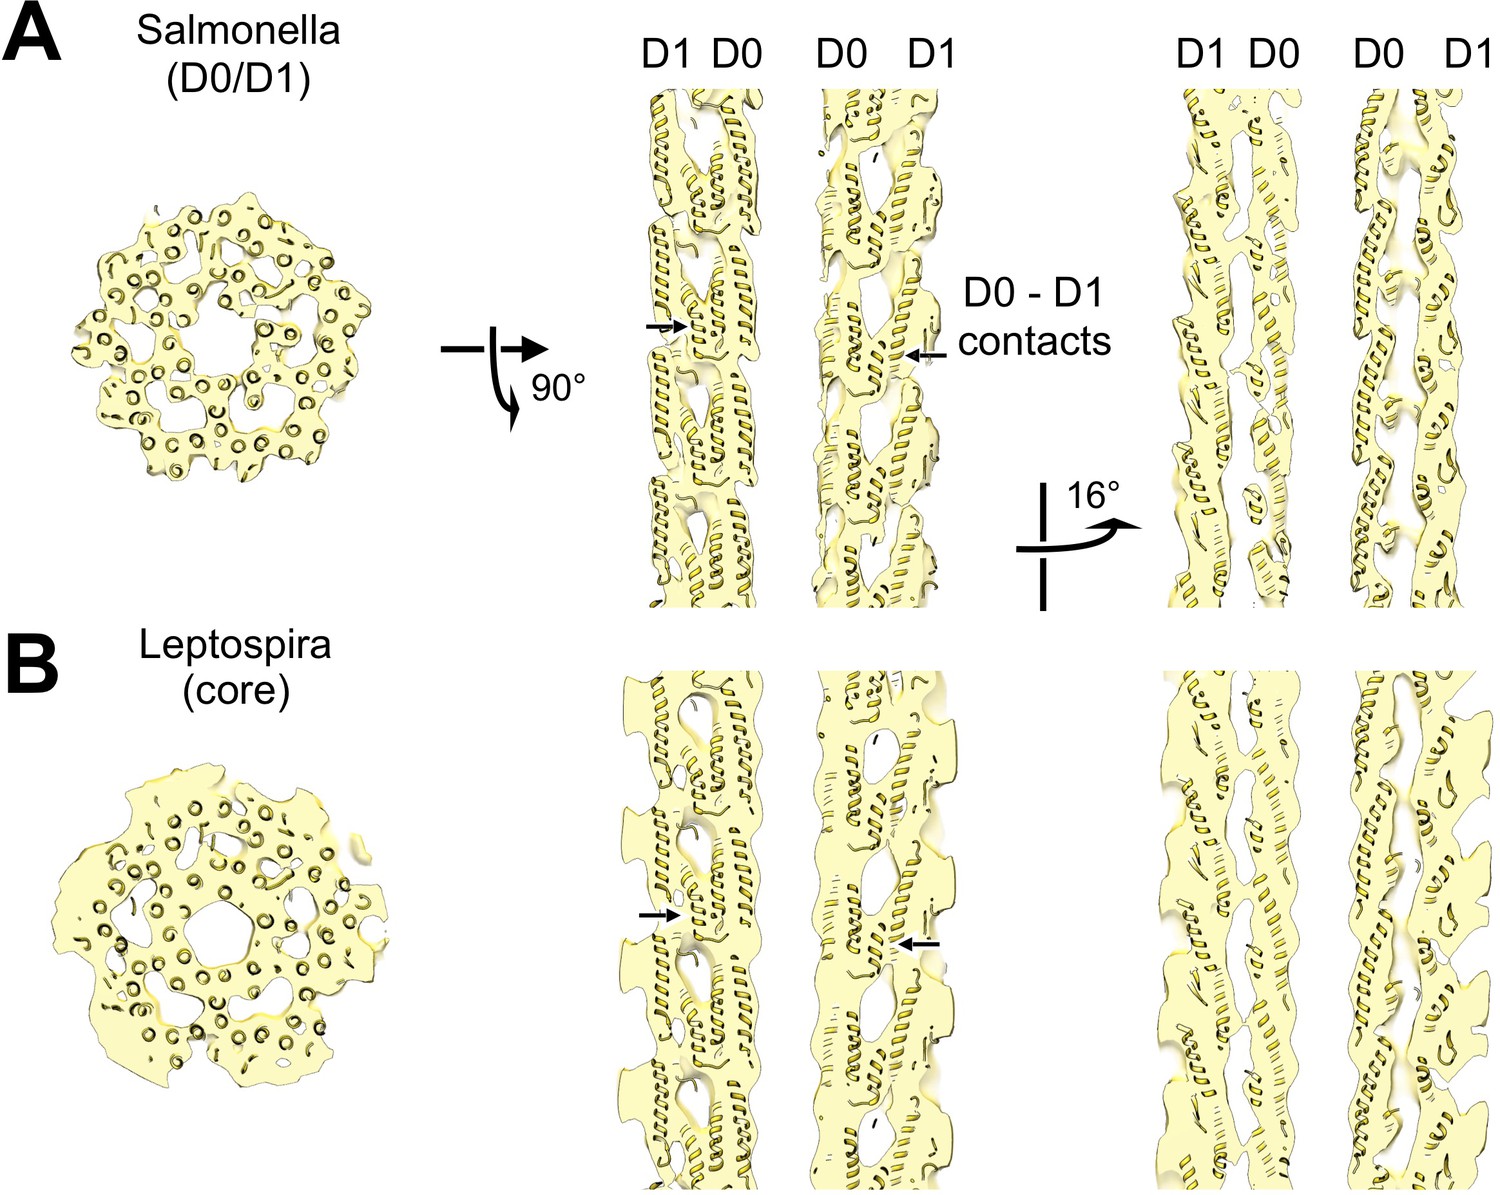
Structural homology between the D0/D1 core region from a synthetic map of the Salmonella flagellar filament and the core region of our wild-type Leptospira flagellar filament subtomogram average volume.
(A) Axial and lateral cross sections of the Salmonella flagellar filament from an atomic model (Yonekura et al., 2003) rendered at 12 Å resolution. (B) Corresponding cross sections of the aligned Leptospira flagellar filament subtomogram average volume, after 11-fold symmetry averaging.
Figure 4
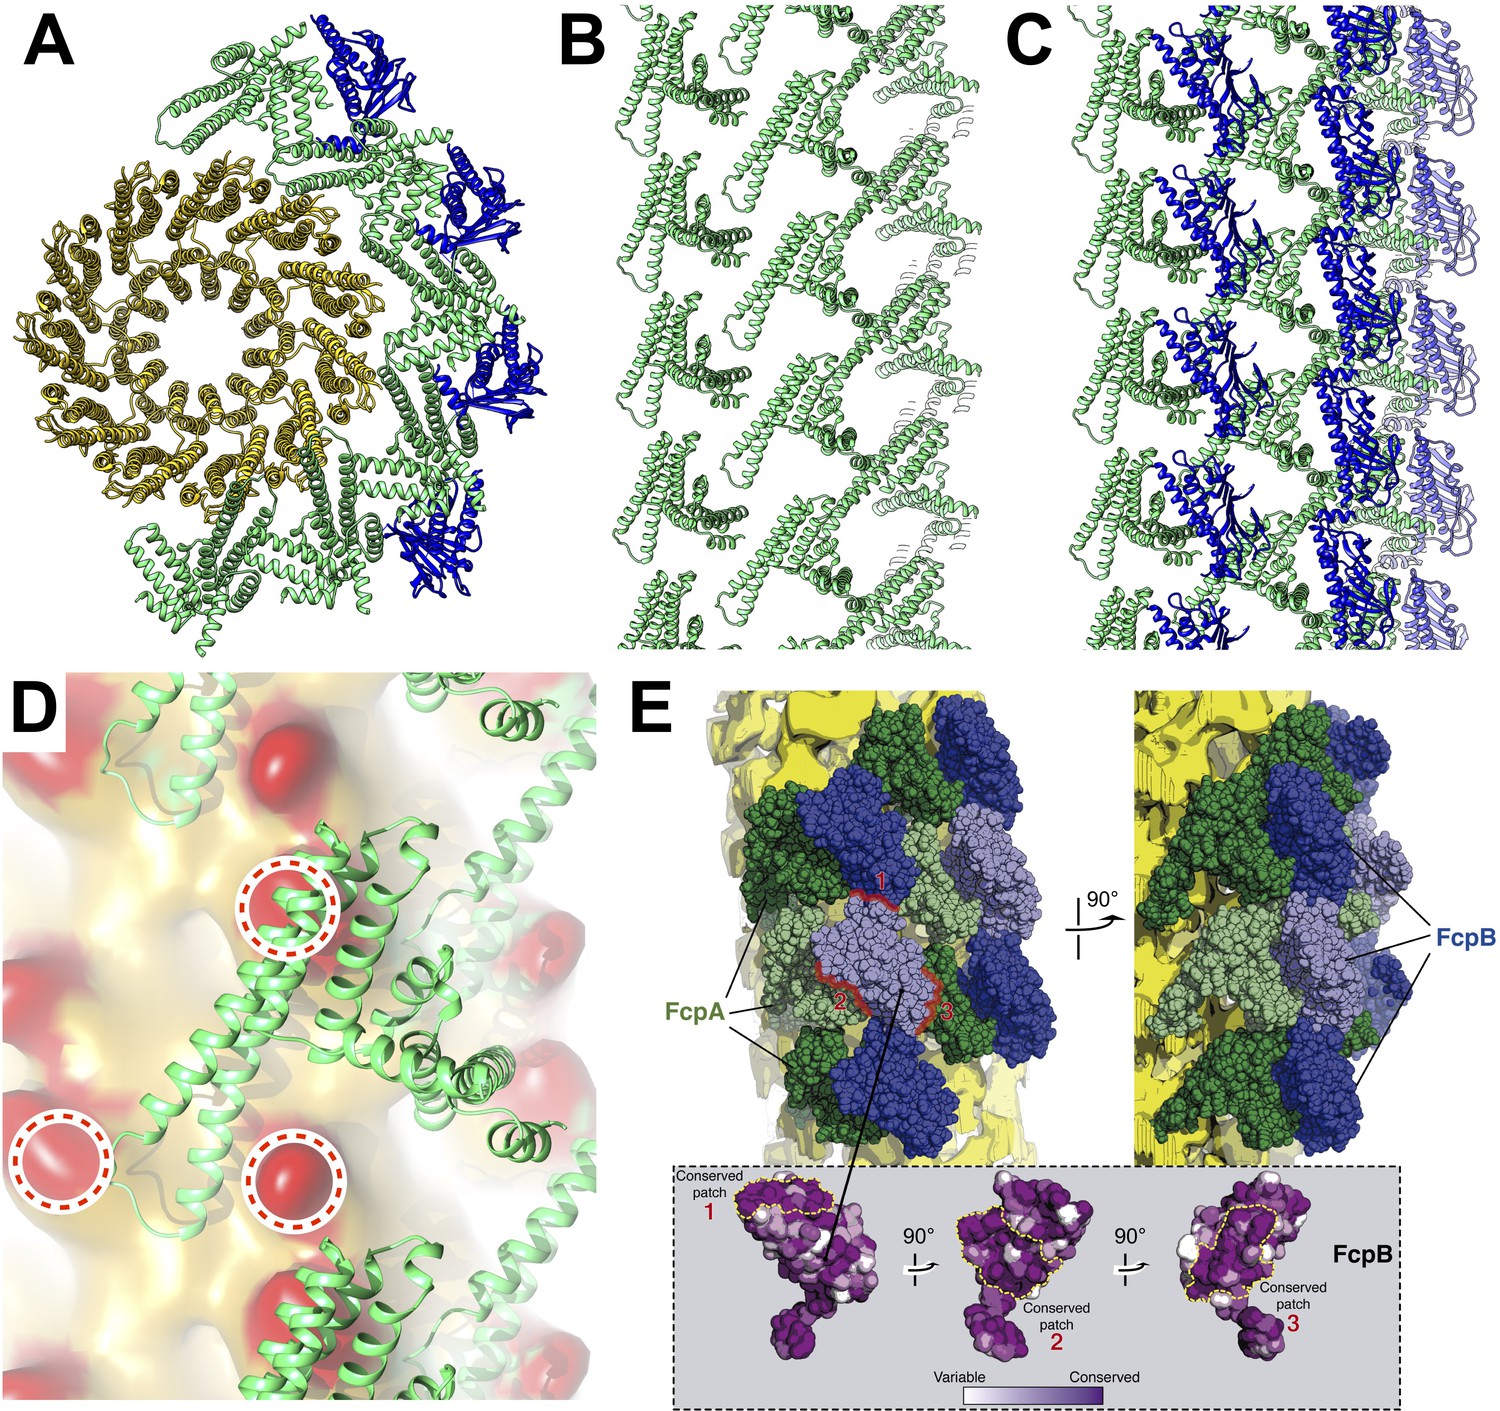
Predicted protein-protein interactions from the combined lattice and sheath model.
(A – C) Ribbon model depiction of the core-sheath atomic model; FlaB is colored gold, FlaA green, FlaB blue. (A) is an axial cross-section view, (B) is a lateral view of the FcpA lattice only, (C) shows the full FcpA/FcpB lattice. (D) Predicted interactions between FcpA (green ribbon) and predicted loop regions from FlaB (red, circled). (E) Conserved sequence elements on the FcpB surface are oriented towards neighboring FcpA molecules.
Figure 5 with 4 supplements

The sheath amplifies flagellar curvature to enable motility in the spirochete Leptospira spp.
(A) Histogram of wild-type filament curvatures derived from 3D filament trajectories. A minority of filaments presumed to have shed some or all of the sheath (see Figure 5—figure supplement 1), as judged by a smaller measured diameter, were excluded from this analysis. (B) Histogram of fcpB– mutant filament curvatures. As in A, a minority population of smaller-diameter filaments were excluded. (C) Histogram of fcpA– mutant filament curvatures, subdivided into distributions for the larger-diameter population (see Figure 5—figure supplement 1B, 3rd panel) and the smaller-diameter population (see Figure 5—figure supplement 1B, 4th panel). (D–E) Model for sheath-enforced curvature in the Leptospira flagellar filament; inherent curvature is amplified due to binding of FcpA and FcpB along the convex side of the core. (F) Model depicting how sheath-enforced flagellar curvature would interact with the coiled body in Leptospira to generate large-scale curved deformations in the body. (G) If flagellar curvature is reduced, the flagellum can pass through the body helix without deforming it, so filament rotation would not directly induce body deformations (except due to rolling and/or sliding friction against the cell cylinder).
Figure 5—figure supplement 1
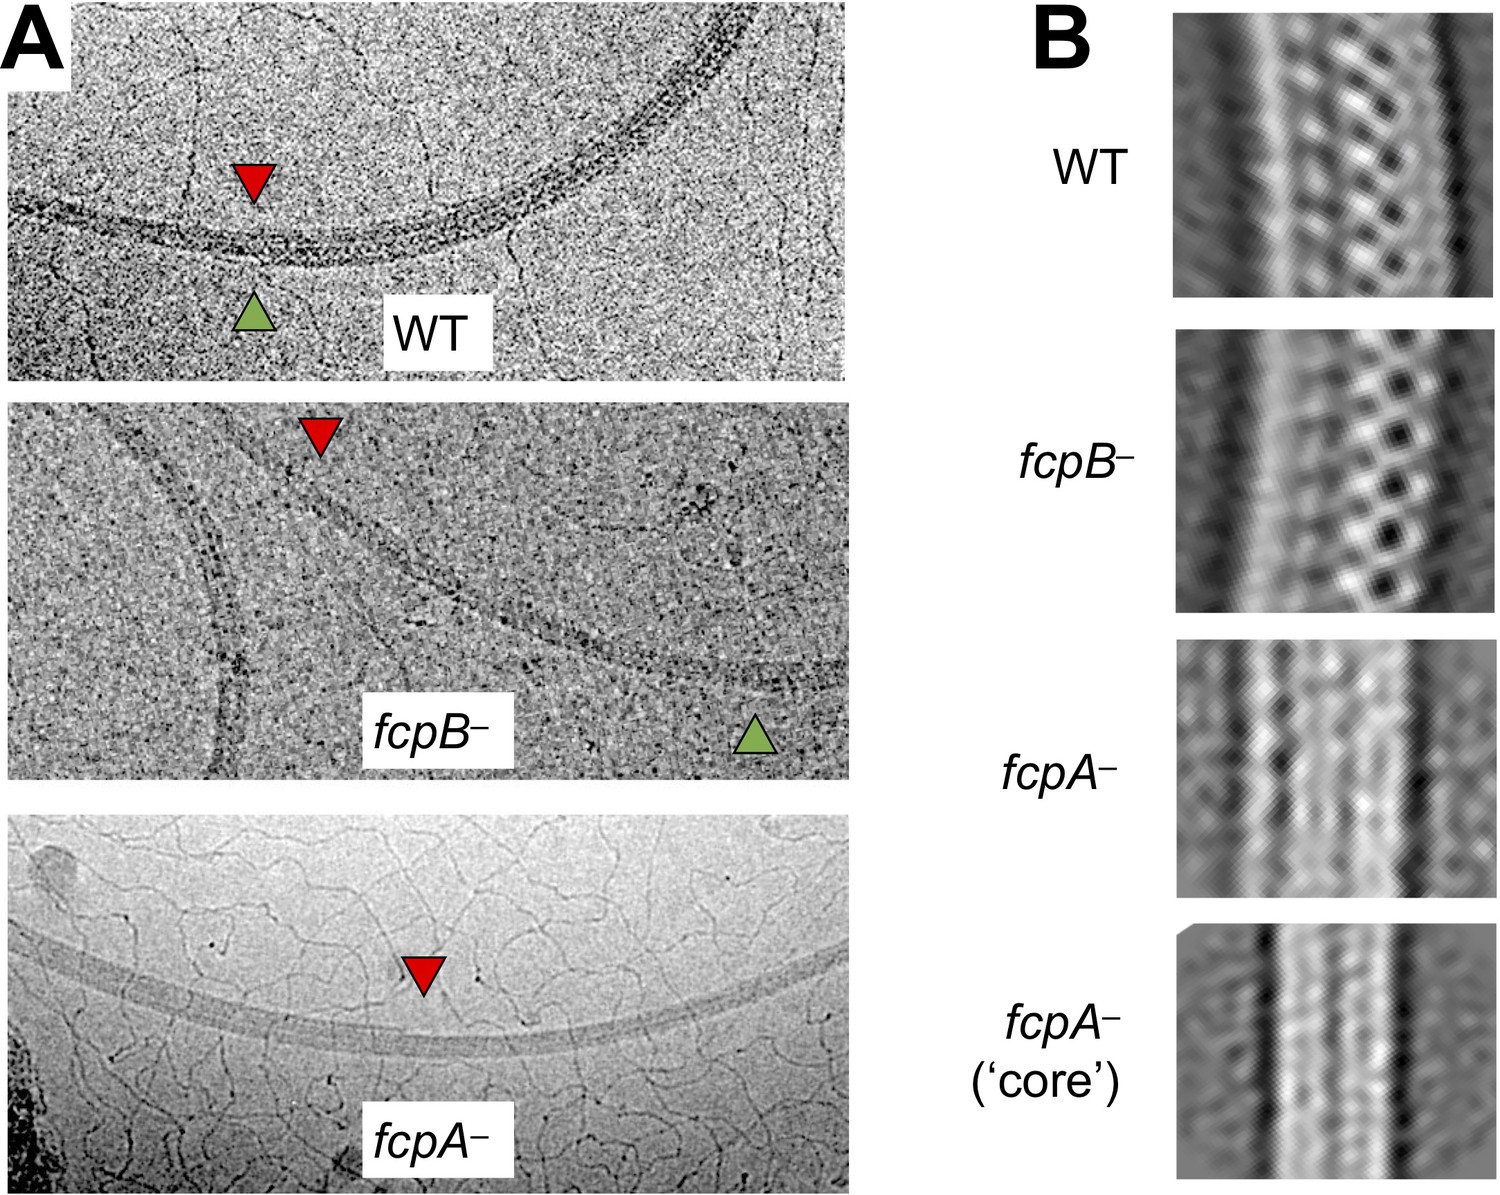
Shedding of sheath layers observed in wild-type and mutant L. biflexa flagellar filaments.
(A) Cryo-EM images of wild-type and mutant L. biflexa flagellar filaments that exhibit shedding of sheath layers, either on the inner (red triangles) or outer (green triangles) curvature. Shedding was only rarely seen in wild-type and fcpB– filaments (Table 3) and could be observed on both inner and outer curvatures, sometimes in the same filament. In contrast, fcpA– filaments usually lost sheath layers from the inner curvature and concurrent shedding on both inner and outer curvatures in this mutant was extremely rare (Table 3). (B) 2D class averaging of filament subtomogram segments reveals distinct filament diameters and/or curvature for wild-type vs. mutant flagella. Wild-type flagella subtomogram 2D classes mainly yielded images with a diameter of ~250 Å. Subtomogram 2D classes from fcpB– samples have a smaller diameter (~95% of wild-type for the dominant class), while classes from fcpA– samples are narrower still (66%–87% of wild-type). Multiple classes of different radii were observed in all samples wild-type and mutant; only the most common ones are shown. Curvature is most evident in the wild-type and fcpB– samples, while fcpA– filament class averages are straighter; the narrowest class (bottom panel), which likely represents the core FlaB assembly absent a sheath, shows little or no evidence of curvature. Classes similar to the bottom panel were also observed in the wild-type and fcpB– samples.
Figure 5—figure supplement 2

Shedding of sheath layers in wild-type L. biflexa flagellar filaments coincides with loss of curvature.
Shown are three examples where a transition (marked by green and red triangles, as in Figure 5—figure supplement 1A) from thick (blue dashed lines) to thin (yellow dashed lines) filament diameter co-localizes with a transition to a less tightly curved supercoil.
Figure 5—figure supplement 3
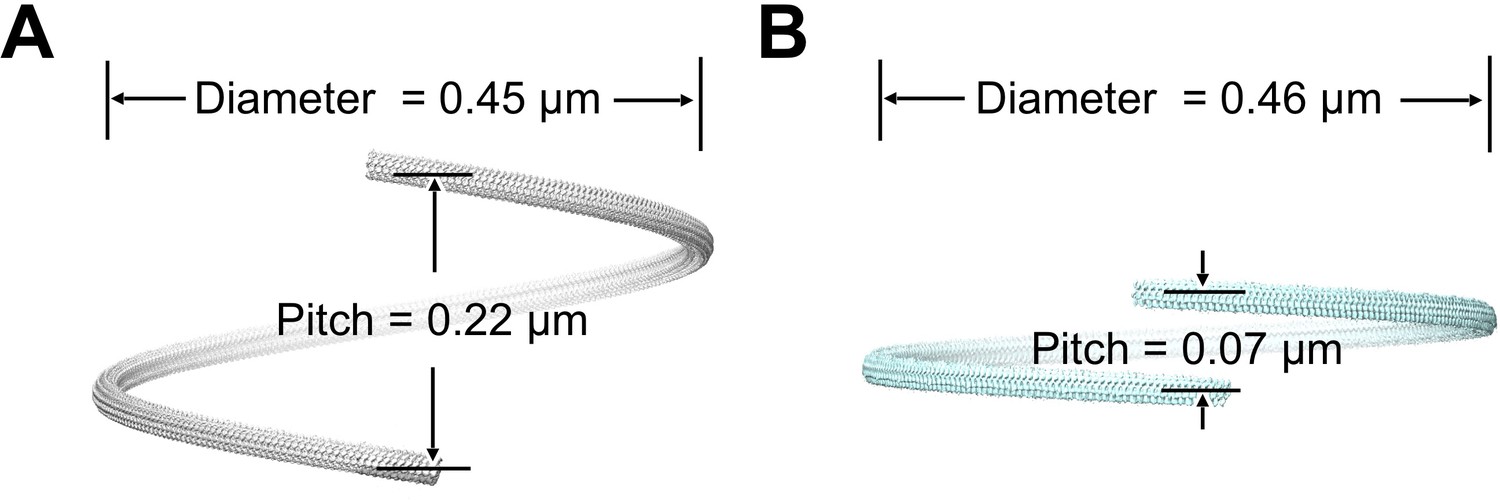
Supercoiling parameters of wild-type and fcpB– mutant flagellar filaments estimated from subtomogram average structures.
(A) Superhelical pitch and diameter estimated for wild-type filament (see Materials and methods). 3D rendering of a full superhelical turn was generated from a composite of ~30 copies of the subtomogram average. (B) Superhelical pitch and diameter of the fcpB- mutant, similar to A.
Figure 5—figure supplement 4
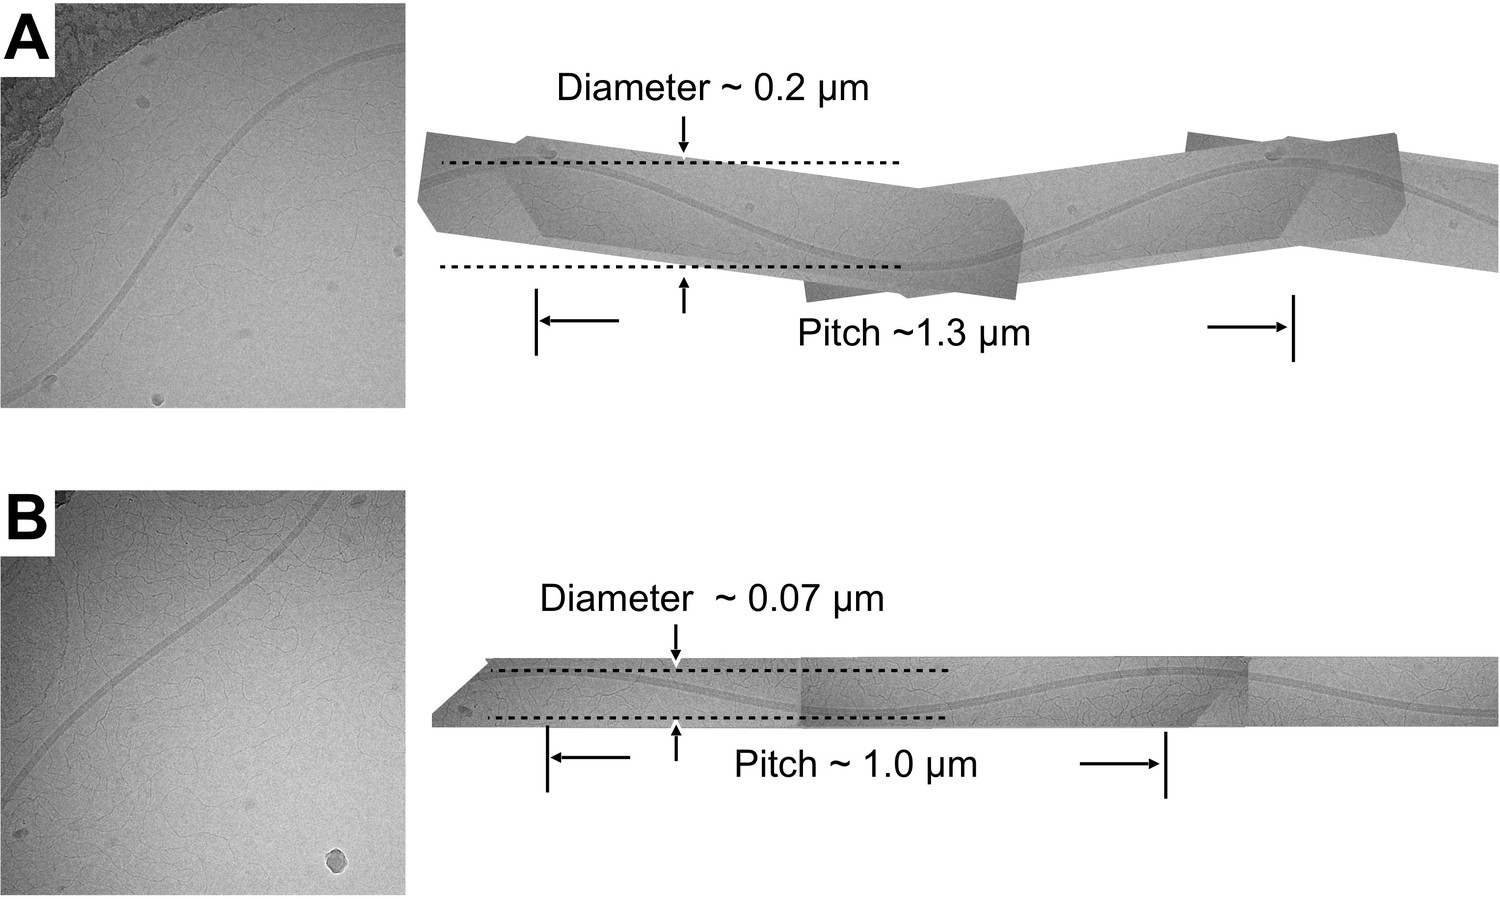
Sinusoidal supercoil forms observed in the fcpA- sample.
(A, B) Two examples of sinusoidally oscillating filament supercoils imaged by cryo-EM for the fcpA- sample. Sinusoidal oscillations were rare or nonexistent in the wild-type and fcpB- samples, but were occasionally observed in fcpA- samples. To approximate the superhelical pitch and supercoil diameter, each of the imaged filaments was extrapolated (right) to a full wavelength representation by manual superposition of rotated and mirror-image copies of itself. The resulting, supercoil parameter estimates fall within the range of values observed for polymorphic flagellar forms in exoflagellates (|superhelical pitch| ~ 0–2.3 µm; |supercoil diameter| ~ 0–2.7 µm) (Kamiya and Asakura, 1976). The handedness of the fcpA- supercoils was not determined.
Videos
Video 1
Overview of the wild-type Leptospira flagellar filament map and model, illustrating separately the FcpA and FcpB sheath layers.
Video 2
Cross-section of the filament center, showing superposed wild-type map and atomic model, going through a 360° axial rotation of the filament.
The core density is replaced by the 11-fold symmetry-averaged map.
Video 3
Similar to Video 2, but without the 11-fold symmetry-averaged core.
The core atomic model is not fully accounted for by the map density at certain viewing angles, which we attribute to missing wedge artifacts.
Tables
Table 1
Protein components of the flagellar filament from Leptospira.
| Protein | Mol. weight | Putative localization in spirochete filaments | Gene names Leptospira biflexa (Uniprot ID) | Gene names Leptospira interrogans (Uniprot ID) | Protein copies per cell in L. interrogans (Malmström et al., 2009) | Sequence homologies |
|---|---|---|---|---|---|---|
| FlaB1 | ~31 kDa | Core | LEPBIa2133 (B0SSZ5) | LIC11890 (Q8F4M3) | ~14,000 | • The four FlaB isoforms are homologous to domains D0+D1 of S. enterica flagellin FliC. • FlaB1, FlaB2 and FlaB4 are ~ 65–70% identical to each other in both Leptospira species. • L. biflexa FlaB1 is ~ 87% identical to L. interrogans FlaB1. |
| FlaB2 | ~31 kDa | Core | LEPBIa2132 (B0SSZ4) | LIC11889 (Q72R59) | ~2000 | • L. biflexa FlaB2 is ~ 78% identical to L. interrogans FlaB2. |
| FlaB3 | ~31 kDa | Core | LEPBIa1872 (B0SS86) | LIC11532 (Q72S54) | ~300 | • FlaB3 is ~ 50–55% identical to the other three isoforms in both Leptospira species. • L. biflexa FlaB3 is ~ 62% identical to L. interrogans FlaB3. |
| FlaB4 | ~31 kDa | Core | LEPBIa1589 (B0SQZ5) | LIC11531 (Q72S55) | ~3500 | • L. biflexa FlaB4 is ~ 92% identical to L. interrogans FlaB4. |
| FlaA1 | ~36 kDa | Sheath | LEPBIa2335 (B0SKT4) | LIC10788 (Q72U74) | ~4500 | • The two FlaA isoforms are not homologous to FlaB or other bacterial flagellins. • FlaA1 and FlaA2 are ~ 25–28% identical in bothLeptospira species. • L. biflexa FlaA1 is ~ 56% identical to L. interrogans FlaA1. |
| FlaA2 | ~27 kDa | Sheath | LEPBIa2336 (B0SKT5) | LIC10787 (Q72U75) | ~3500 | • L. biflexa FlaA2 is ~ 70% identical to L. interrogans FlaA2. |
| FcpA | ~36 kDa | Sheath | LEPBIa0267 (B0STJ8) | LIC13166 (Q72MM7) | ~8000 | • FcpA is unique to the Leptospira genus. • FcpA and FcpB are not homologous. • L. biflexa FcpA is ~ 77% identical to L. interrogans FcpA. |
| FcpB | ~32 kDa | Sheath | LEPBIa1597 (B0SR03) | LIC11848 (Q72RA0) | ~4000 | • FcpB is unique to the Leptospira genus. • L. biflexa FcpB is ~ 53% identical to L. interrogans FcpB. |
Table 2
X-ray diffraction data processing and model refinement statistics.
| FcpA_1 | FcpA_2 | FcpA_3 | FcpB | |
|---|---|---|---|---|
| Wavelength | 0.97910 | 0.97858 | 0.97858 | 1.54179 |
| Resolution range | 67.36–1.90 (1.94–1.90)* | 48.23–2.95 (3.07–2.95) | 45.12–2.5 (2.6–2.5) | 37.15–2.58 (2.72–2.58) |
| Space group | P 622 | P 21 | C 2 | P 212121 |
| Unit cell (abc Å, αβγ °) | a = b = 132.4c = 67.4 α=β=90 γ = 120 | a = 85.5 b = 96.5 c = 121.1 α = 90 β = 105.2 γ = 90 | a = 82.3 b = 99.6 c = 106.7 α = 90 β = 91.9 γ = 90 | a = 60.7 b = 65.6c = 134.4 α = 90 β = 90 γ = 90 |
| Total reflections | 180402 (11851) | 137503 (15749) | 99658 (10749) | 62470 (8683) |
| Unique reflections | 27914 (1742) | 39975 (4485) | 29300 (3278) | 17479 (2442) |
| Multiplicity | 6.5 (6.8) | 3.4 (3.5) | 3.4 (3.3) | 3.6 (3.6) |
| Completeness | 99.7 (99.3) | 99.5 (99.7) | 98.4 (97.9) | 99.2 (97.1) |
| Mean I/sigma(I) | 23.9 (1.5) | 17.2 (2.0) | 18.2 (2.3) | 8.1 (3.2) |
| Wilson B factor | 31.7 | 102.8 | 81.3 | 42.8 |
| R-merge | 0.152 (2.128) | 0.050 (0.651) | 0.040 (0.484) | 0.128 (0.395) |
| R-meas | 0.166 (2.309) | 0.059 (0.768) | 0.047 (0.577) | 0.150 (0.464) |
| CC1/2 | 0.991 (0.218) | 0.999 (0.842) | 0.999 (0.805) | 0.993 (0.818) |
| Reflections used in refinement | 27881 (1605) | 39955 (4341) | 29292 (3123) | 17436 (2411) |
| Reflections used for R-free | 1494 (100) | 2005 (208) | 1489 (155) | 1029 (168) |
| R-work | 0.194 (0.259) | 0.197 (0.3445) | 0.196 (0.2586) | 0.204 (0.2739) |
| R-free | 0.219 (0.309) | 0.222 (0.3888) | 0.221 (0.3088) | 0.250 (0.3328) |
| Number of non-hydrogen atoms | 2307 | 7971 | 4089 | 3472 |
| macromolecules | 1979 | 7924 | 3866 | 3410 |
| ligands | 90 | 36 | 84 | 31 |
| solvent | 238 | 11 | 139 | 31 |
| RMS bonds (Å) | 0.010 | 0.010 | 0.010 | 0.010 |
| RMS angles (°) | 0.86 | 1.00 | 1.03 | 1.11 |
| Ramachandran favored ‡ (%) | 98.72 | 98.39 | 98.23 | 95.33 |
| Ramachandran outliers ‡ (%) | 0.00 | 0.00 | 0.22 | 0.00 |
| PDB ID | 6NQW | 6NQX | 6NQY | 6NQZ |
| Raw diffraction data ¶ (doi) | 10.15785/ SBGRID/693 | 10.15785/ SBGRID/691 | 10.15785/ SBGRID/692 | 10.15785/SBGRID/694 (data used to solvethe structure by SAD) 10.15785/SBGRID/695 (data used for finalstructure refinement) |
-
*Values in parentheses are for highest-resolution shell.
‡Calculated by MolProbity [Williams, C. J. et al. MolProbity: More and better reference data for improved all-atom structure validation. Protein Sci 27, 293–315, doi:10.1002/pro.3330 (2018)].
-
¶Deposited in the SBGrid Data Bank public database [Morin, A. et al. Collaboration gets the most out of software. Elife 2, e01456, doi:10.7554/eLife.01456 (2013)].
Table 3
Diameter changes in wild-type and fcpA–/fcpB– mutants reflect differences in sheath composition.
| Leptospira strain | Inner Curvature* | Outer Curvature† | Both‡ | Total # Images |
|---|---|---|---|---|
| WT | 0 | 4 | 7 | 162 |
| fcpB– | 0 | 4 | 2 | 139 |
| fcpA– | 16 | 3 | 1 | 83 |
-
* ‘Inner curvature’ refers to filaments where an abrupt transition in the apparent filament diameter was observed on the concave side of a curved filament.
† ‘Outer curvature’ refers to filaments where an abrupt transition was observed on the convex side.
-
‡ ‘Both’ refers to cases where both ‘inner’ and ‘outer’ transitions were observed in the same filament (see Figure 5—figure supplement 1).
Additional files
Download links
A two-part list of links to download the article, or parts of the article, in various formats.
Downloads (link to download the article as PDF)
Open citations (links to open the citations from this article in various online reference manager services)
Cite this article (links to download the citations from this article in formats compatible with various reference manager tools)
An asymmetric sheath controls flagellar supercoiling and motility in the leptospira spirochete
eLife 9:e53672.
https://doi.org/10.7554/eLife.53672


