Primate homologs of mouse cortico-striatal circuits
- Department of Psychology, Royal Holloway University of London, United Kingdom
- Neural Control of Movement Laboratory, Department of Health Sciences and Technology, Switzerland
- Wellcome Centre for Integrative Neuroimaging, Department of Experimental Psychology, University of Oxford, United Kingdom
- Wellcome Centre for Integrative Neuroimaging, Centre for Functional MRI of the Brain (FMRIB), Nuffield Department of Clinical Neurosciences, John Radcliffe Hospital, University of Oxford, United Kingdom
- Donders Institute for Brain, Cognition and Behaviour, Radboud University Nijmegen, Netherlands
Figures
Figure 1 with 1 supplement
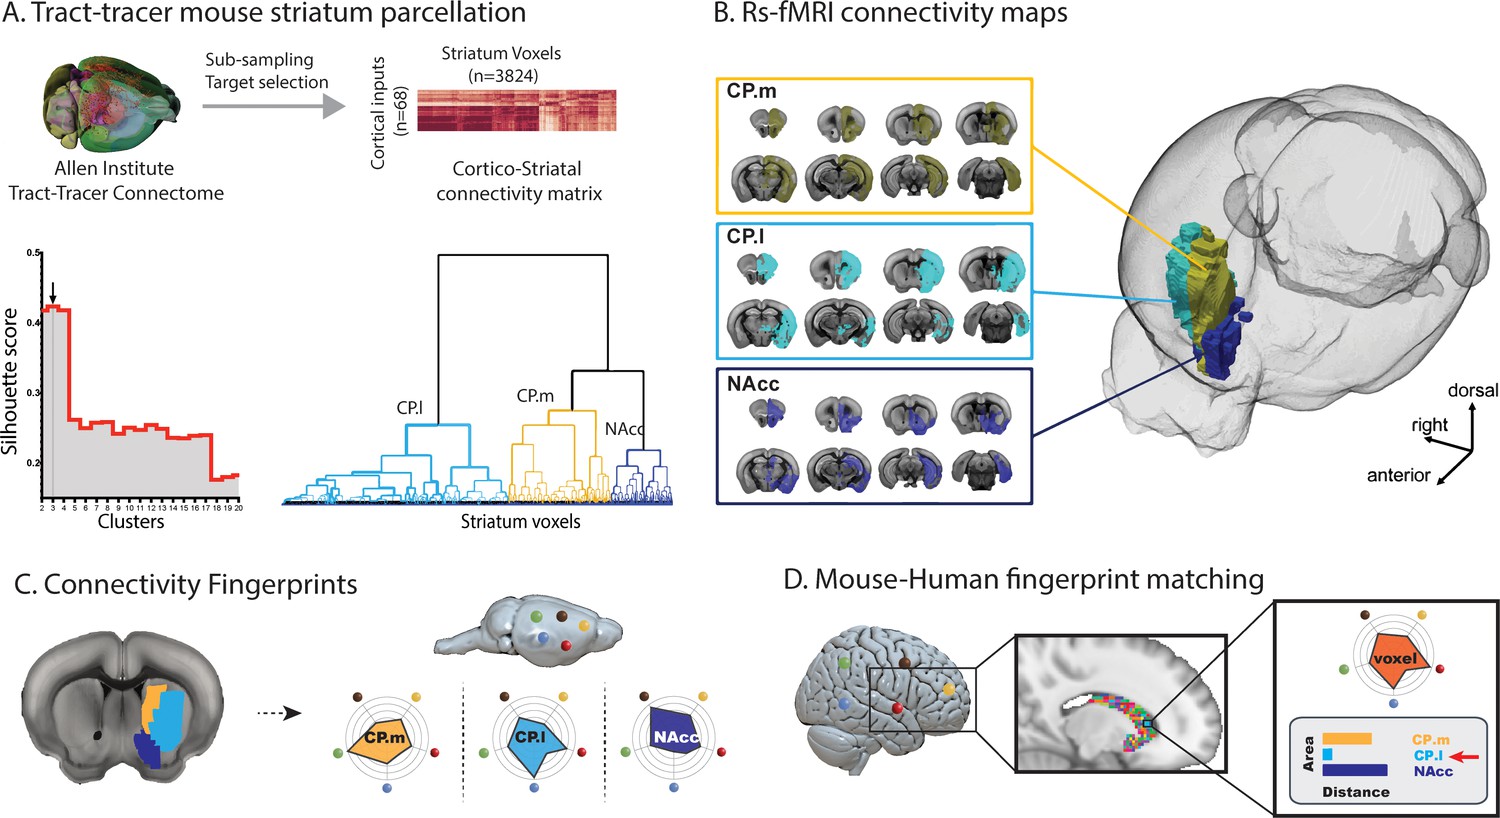
Images illustrating the creation of mouse striatal seeds, their connectivity, and connectivity fingerprint matching.
(A) Schematic illustrating how mouse striatal seeds were created using tracer connectivity data from the Allen Institute. A connectivity matrix was extracted describing the volume of terminal label in each striatal voxel from 68 cortical injection sites. Correlating the values in this matrix established the similarity of connectivity fingerprints across striatal voxels. Hierarchical clustering was used to sort the correlation matrix into voxels with similar connectivity patterns (lower right dendrogram) and silhouette value was used to establish the number of clusters where within-cluster similarity and between-cluster differences were greatest (lower left plot). The arrow shows that the best solution according to silhouette value was a three cluster solution. (B) RsfMRI voxelwise connectivity maps for the three striatal seeds. (C) A schematic illustrating the process of extracted connectivity fingerprints for the three mouse striatal seeds. Connectivity fingerprints show the strength of connectivity (correlation of rsfMRI timeseries) between each striatal seed region and target regions outside the striatum D) In humans (or macaques), connectivity fingerprints were extracted from each voxel of the striatum - comparing the connectivity strength of striatal voxels with human homologs of the five target regions identified in mice. The similarity of each human voxel fingerprint can then be compared against each of the three mouse striatal fingerprints.
Figure 1—figure supplement 1
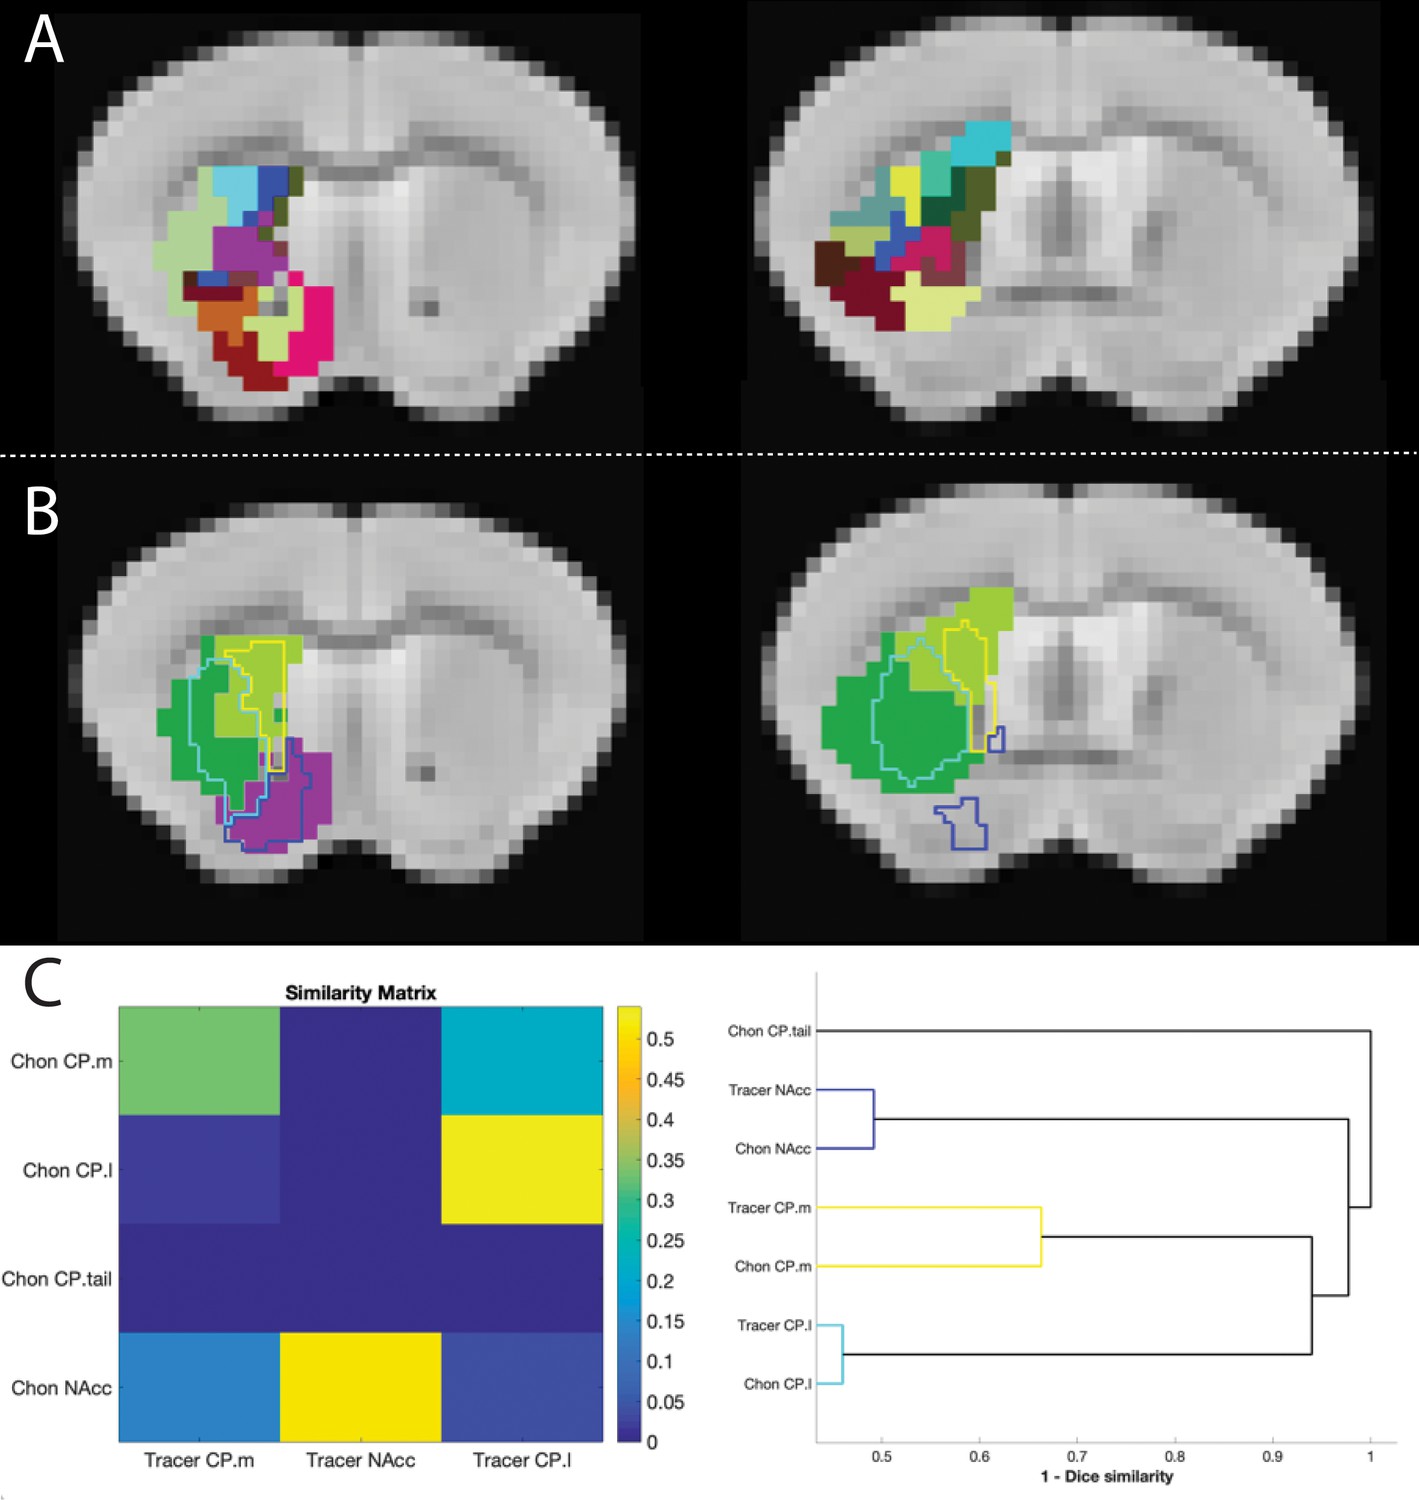
Figure showing the overlap between tracer-based and rsfMRI parcellations of the mouse striatum.
(A) The 33 cluster segmentation of Chon et al. (2019) from two representative slices. (B) Clusters from Chon et al. (2019) showed highly similar connectivity patterns and clustered into four segments (shown in solid colours). The outline of the tracer-based parcellation is overlayed using the same colour scheme as Figure 1. (C) Similarity matrix showing the spatial correlation between tracer-based and rsfMRI-based striatal clusters and dendrogram showing dice similarity clustering. These highlight the consistency between tracer-based and rsfMRI-based clustering methods.
Figure 2 with 4 supplements
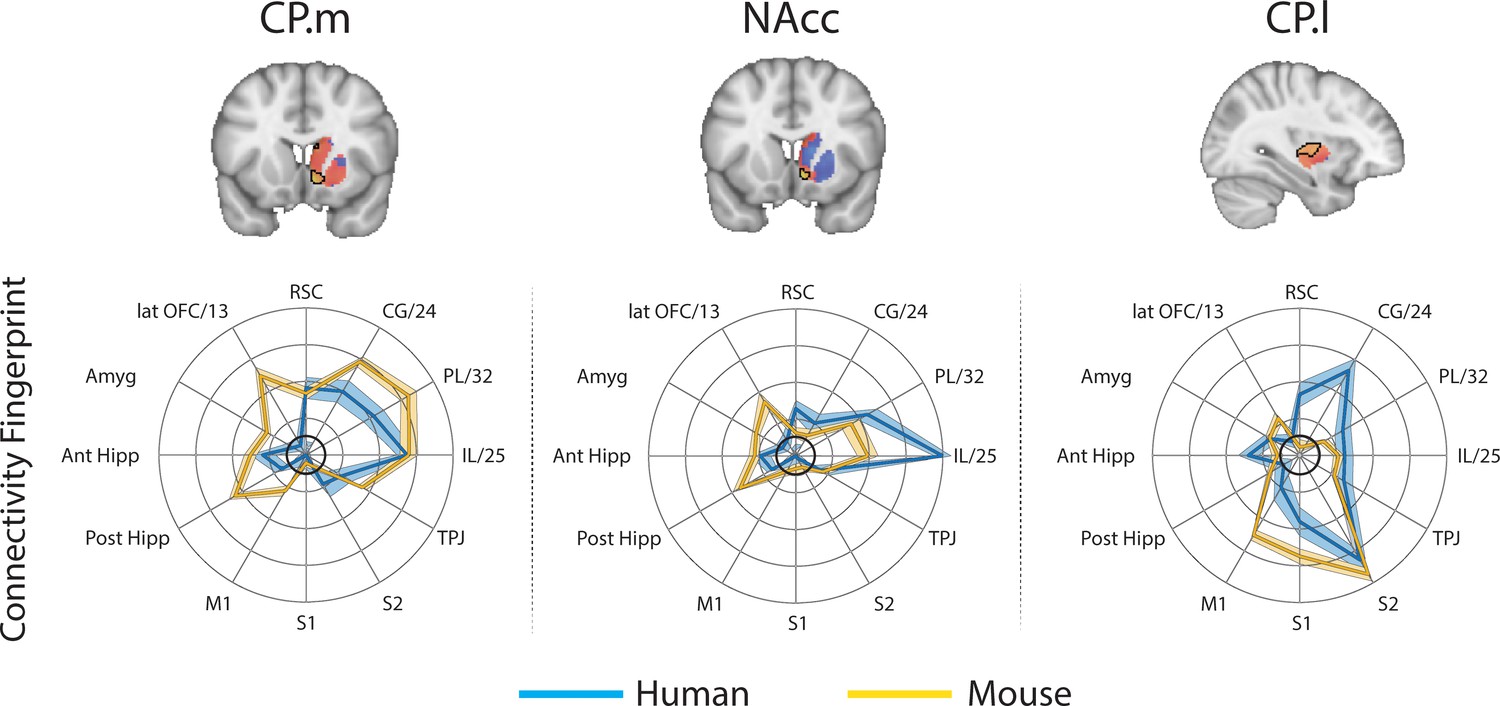
Brain images show unthresholded striatal t-maps of mouse-human similarity for CP.m, NAcc, and CP.l.
Red-yellow voxels indicate increasingly positive correlations of connectivity fingerprints across species, blue-cyan voxels indicate increasing negative correlations of connectivity fingerprints across species. Black outlines indicate voxels that showed statistically significant similarity (TFCE p<0.05). Human and mouse connectivity fingerprints are shown underneath each brain image to highlight similarity in the connectivity pattern across species. Shaded error bars show the standard error of the mean. The data ranges from Z-values −0.1–0.4 and the thick grey circle shows 0.
Figure 2—figure supplement 1
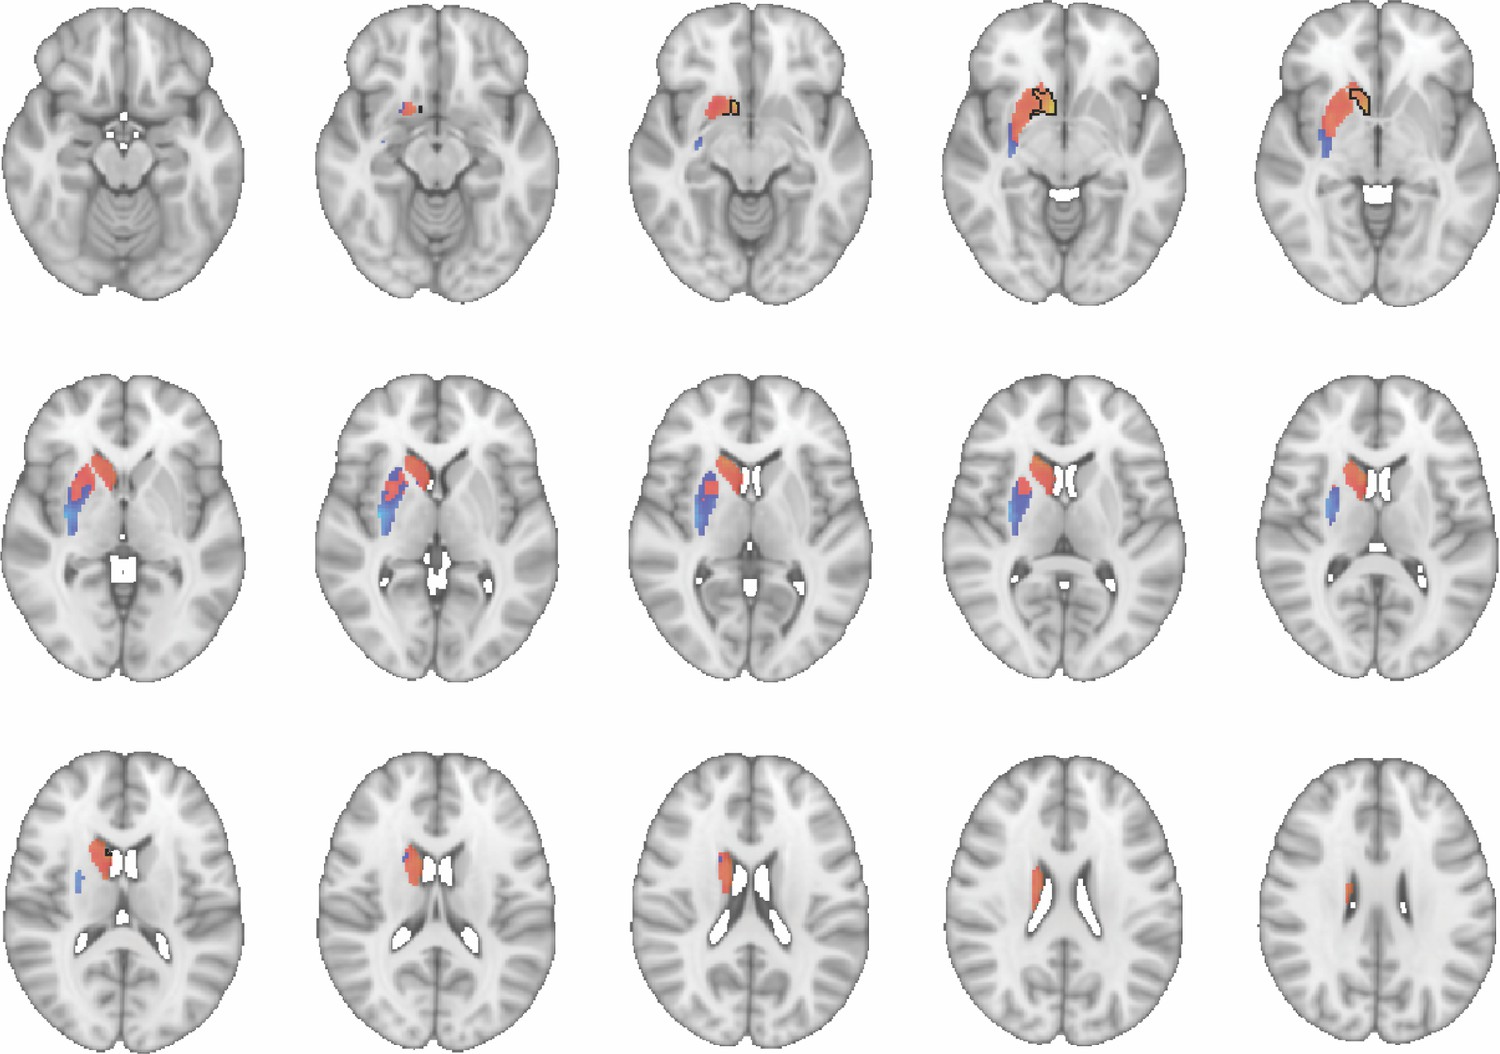
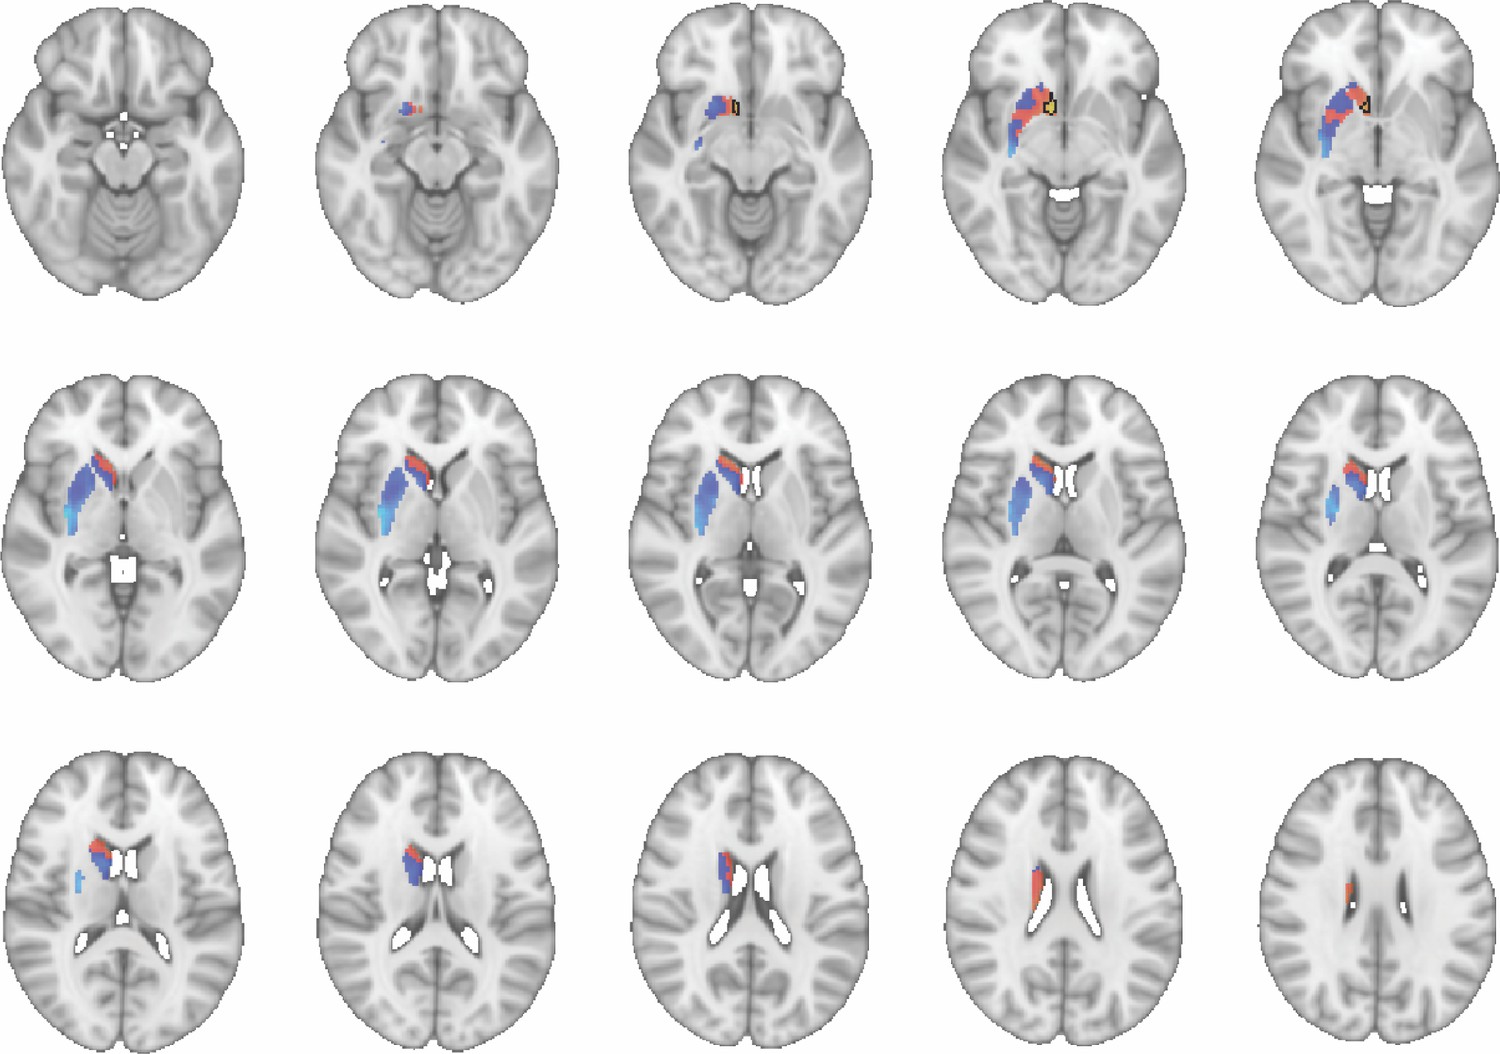
Images show axial slices through the human striatum including the unthresholded t-maps highlighting the similarity in mouse-human connectivity fingerprints for CP.m.
The red-yellow/blue-cyan colourmap shows the degree of positive/negative similarity between mouse seed regions and voxels in the human striatum. Black outlines highlight the voxels that show significant similarity (TFCE p<0.05). These images can be explored in Neurovault at https://neurovault.org/collections/NFGTNVFX/.
Figure 2—figure supplement 2
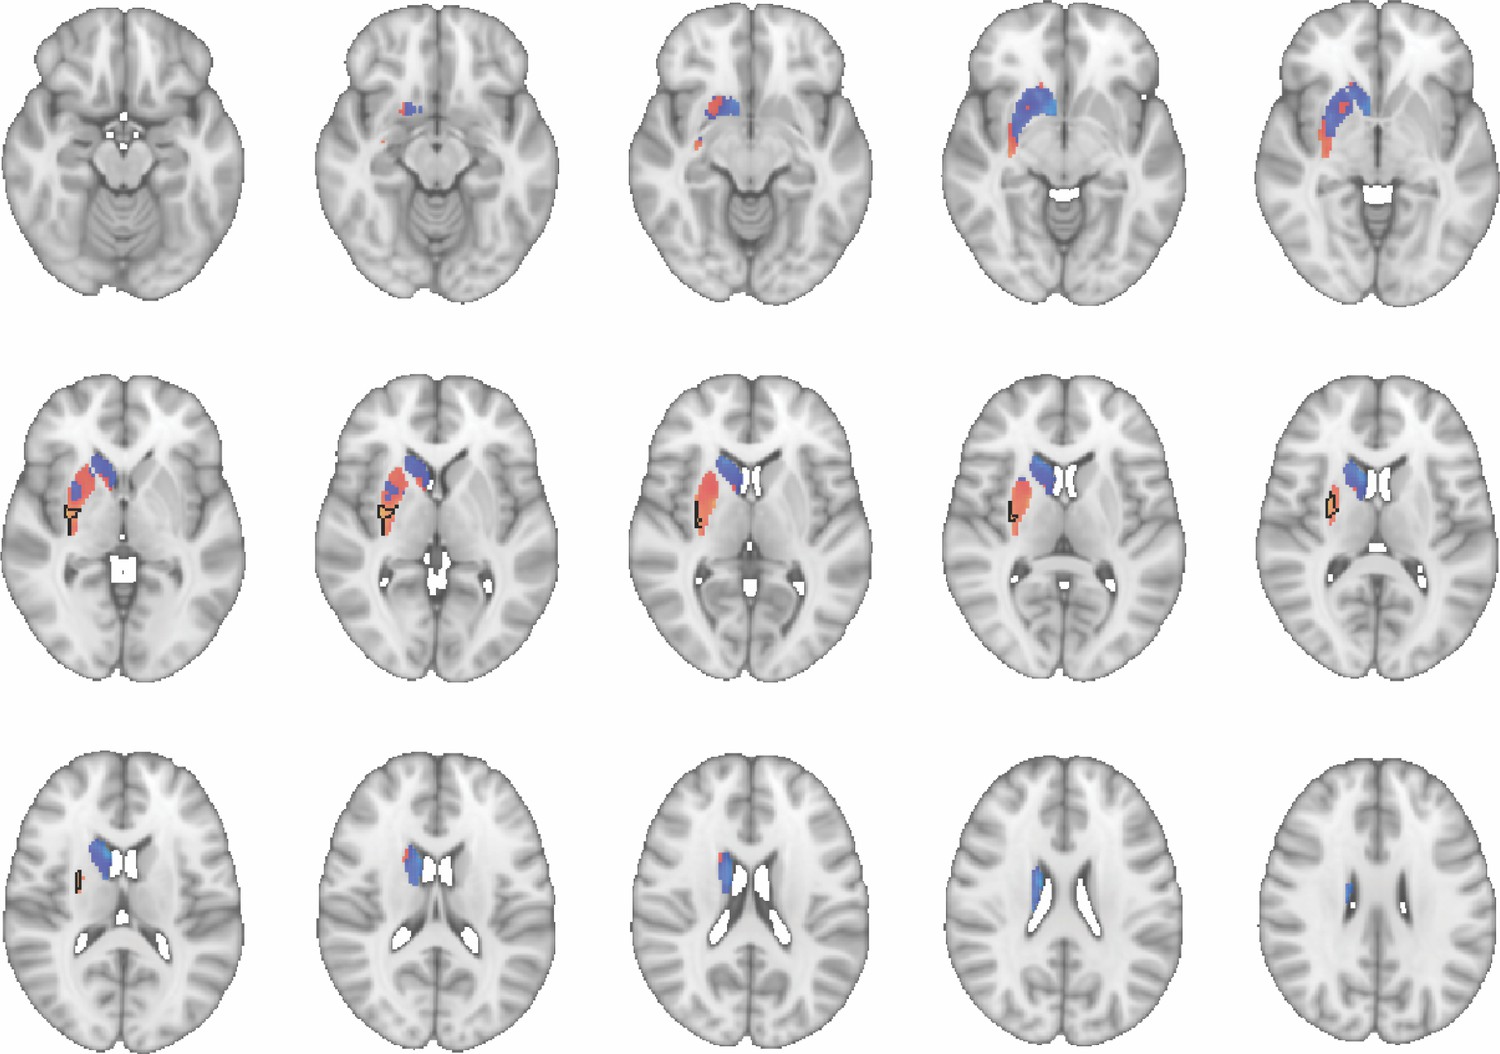
Images show axial slices through the human striatum including the unthresholded t-maps highlighting the similarity in mouse-human connectivity fingerprints for NAcc.
The red-yellow/blue-cyan colourmap shows the degree of positive/negative similarity between mouse seed regions and voxels in the human striatum. Black outlines highlight the voxels that show significant similarity (TFCE p<0.05). These images can be explored in Neurovault at https://neurovault.org/collections/NFGTNVFX/.
Figure 2—figure supplement 3
Images show axial slices through the human striatum including the unthresholded t-maps highlighting the similarity in mouse-human connectivity fingerprints for CP.l.
The red-yellow/blue-cyan colourmap shows the degree of positive/negative similarity between mouse seed regions and voxels in the human striatum. Black outlines highlight the voxels that show significant similarity (TFCE p<0.05). These images can be explored in Neurovault at https://neurovault.org/collections/NFGTNVFX/.
Figure 2—figure supplement 4
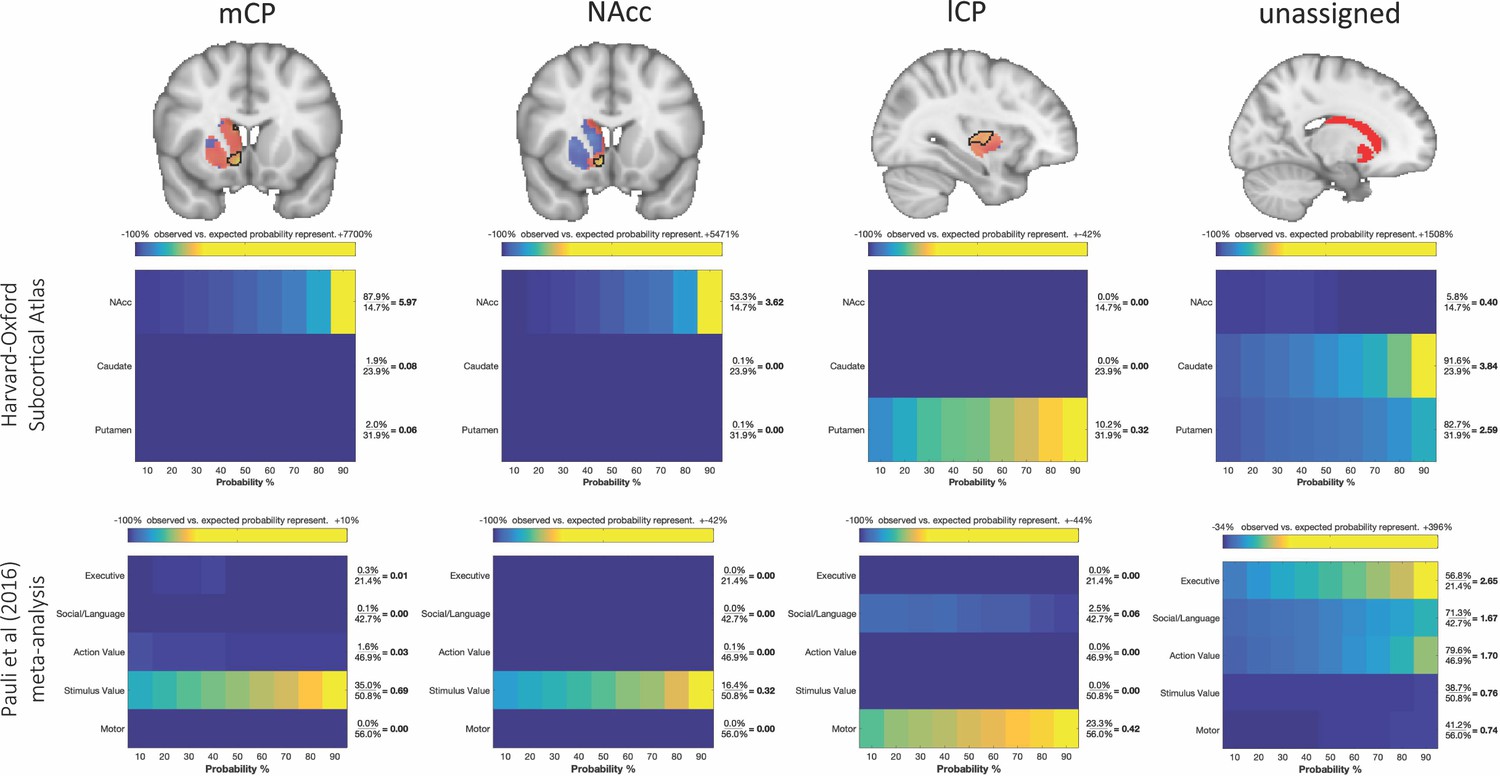
Brain images show unthresholded striatal t-maps of mouse-human similarity for CP.m, NAcc, and CP.l.
Black outlines indicate voxels that showed statistically significant similarity (TFCE p<0.05). The unassigned voxels are a binary mask indicating voxels that did not met the criteria for statistically significance for mCP, NAcc, and lCP. Plots underneath each brain image show the anatomical and functional localisation of assigned and unassigned voxels. To the right of the colour table, the mean probability for each area at the location of a functional activation is divided by the overall mean probability of the respective area. This quotient indicates how much more likely this area was observed in the functionally defined volume as could be expected if the probabilities at that location would follow their overall distribution. Values greater than 1 indicate that a brain indicates a rather central location of the activation with respect to this area whereas values less than 1 indicate a more peripheral one.
Figure 3
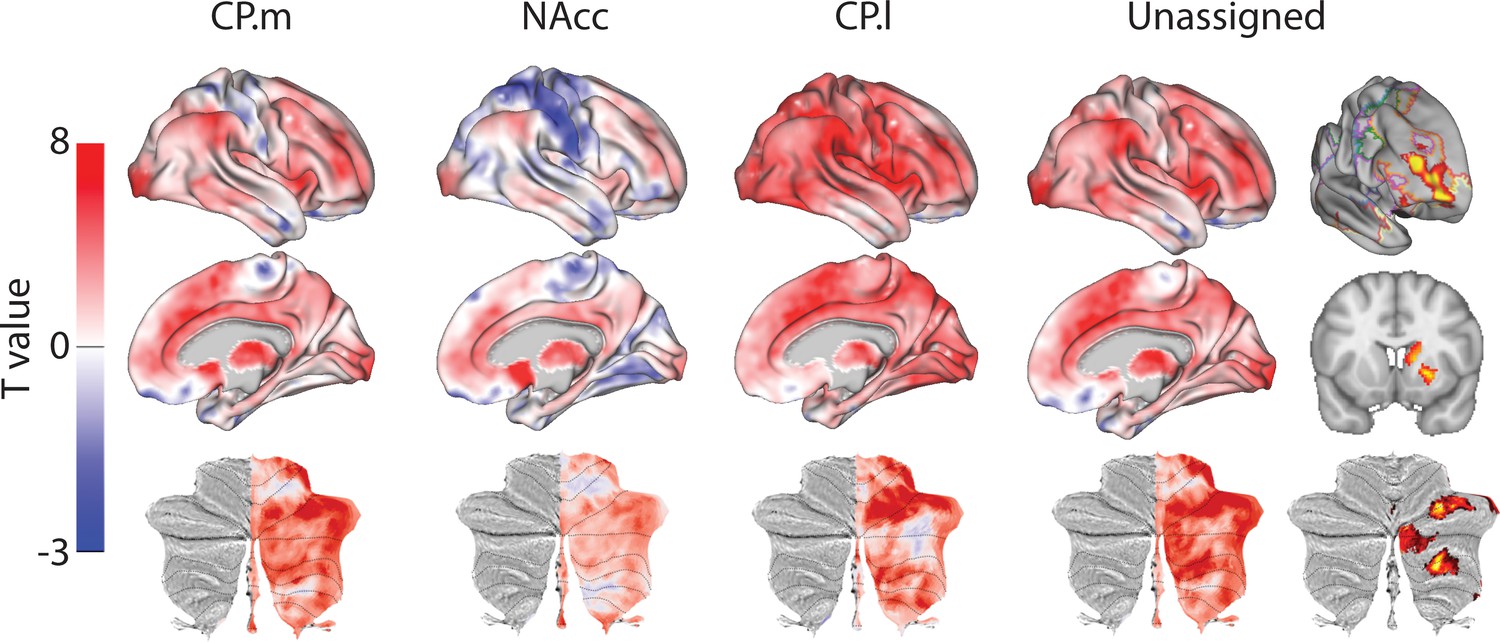
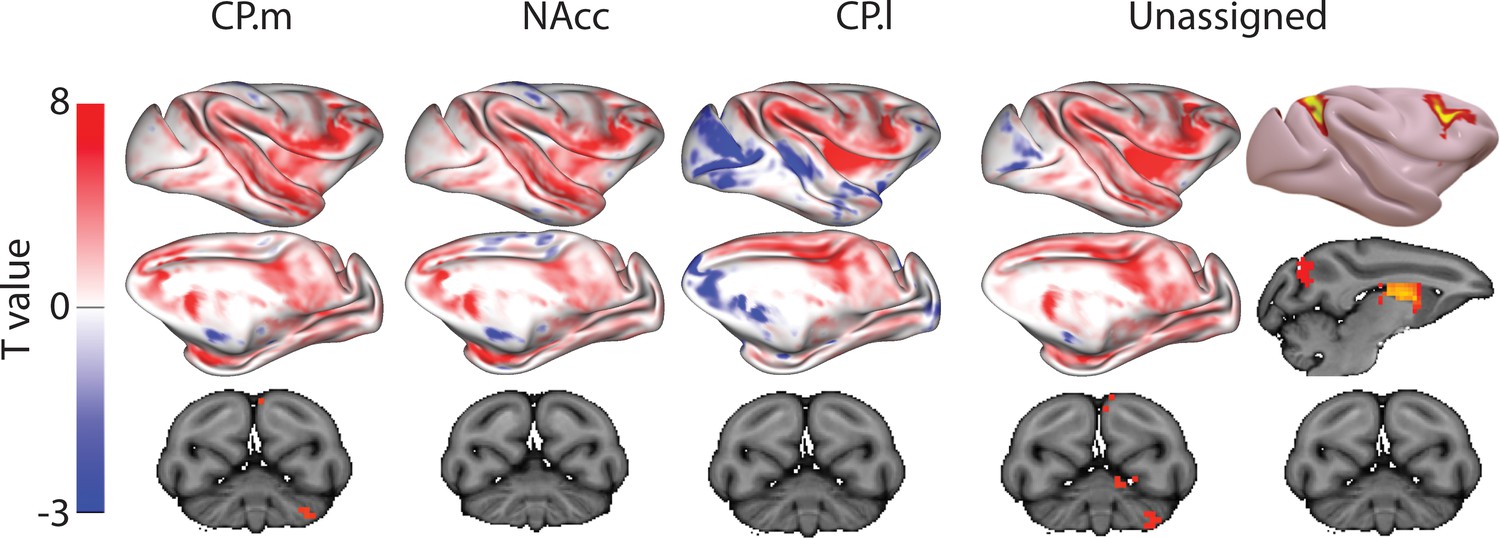
Unthresholded whole-brain connectivity maps showing regions interconnected with human homologs of CP.m, NAcc, CP.l, and unassigned voxels.
The bottom row shows cerebellar activations on a flattened representation of the cerebellum and dotted black lines show the lobular boundaries (Diedrichsen and Zotow, 2015). The far-right column shows a thresholded conjunction analysis of voxels that possess significantly greater connectivity with unassigned voxels compared against all three mouse seeds. Outlines from the Yeo cortical parcellation highlight that the significantly different voxels in humans are principally in regions identified as the frontal -parietal network and the cerebellum.
Figure 4 with 3 supplements
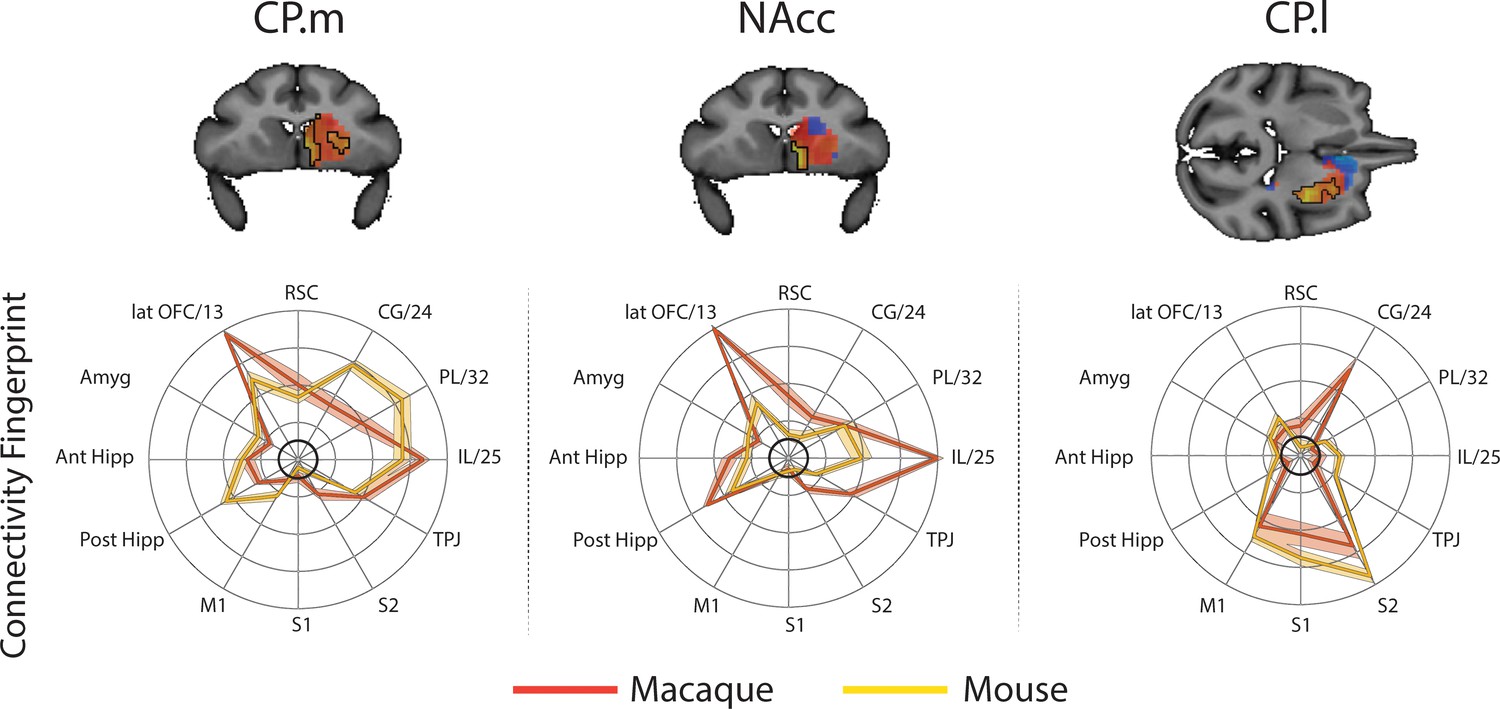
Brain images show unthresholded striatal t-maps of mouse-macaque similarity for CP.m, NAcc, and CP.l.
Red-yellow voxels indicate increasingly positive correlations of connectivity fingerprints across species, blue-cyan voxels indicate increasing negative correlations of connectivity fingerprints across species. Black outlines indicate voxels that showed statistically significant similarity (TFCE p<0.05). Macaque and mouse connectivity fingerprints are shown underneath each brain image to highlight the similarity in the connectivity pattern across species. Shaded error bars show the standard error of the mean. The data ranges from Z-values −0.1 to 0.4 and the thick grey circle shows 0.
Figure 4—figure supplement 1
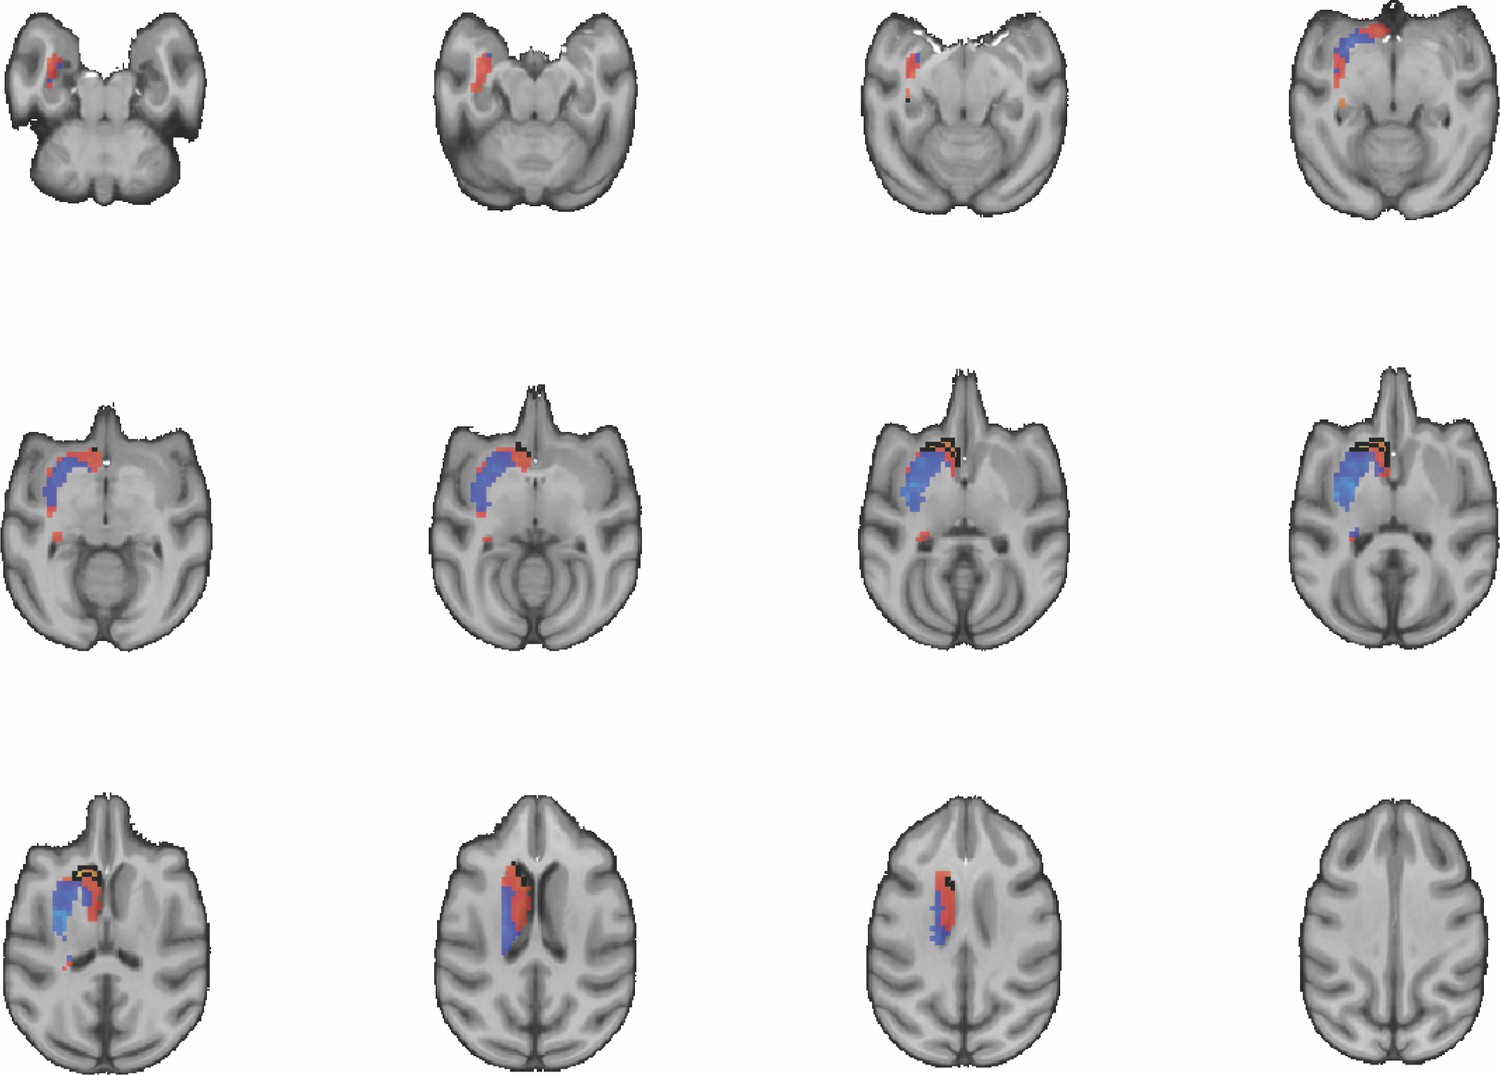
Images show axial slices through the macaque striatum including the unthresholded t-maps highlighting the similarity in mouse-macaque connectivity fingerprints for CP.m.
The red-yellow/blue-cyan colourmap shows the degree of positive/negative similarity between mouse seed regions and voxels in the macaque striatum. Black outlines highlight the voxels that show significant similarity (TFCE p<0.05).
Figure 4—figure supplement 2
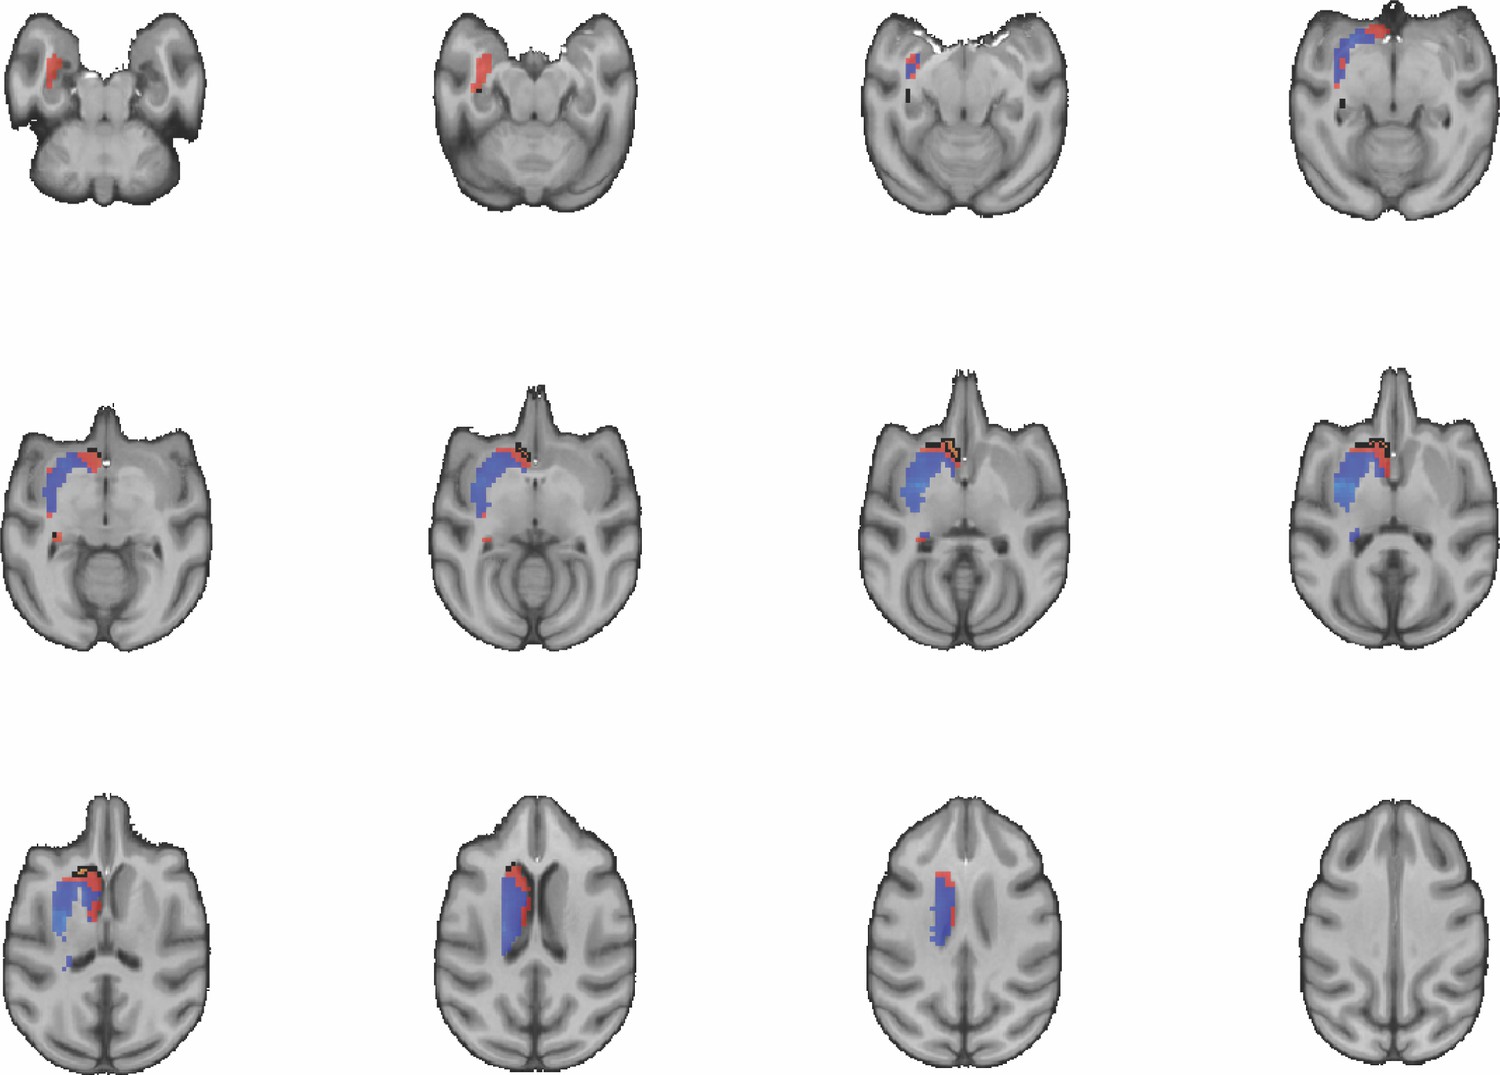
Images show axial slices through the macaque striatum including the unthresholded t-maps highlighting the similarity in mouse-macaque connectivity fingerprints for NAcc.
The red-yellow/blue-cyan colourmap shows the degree of positive/negative similarity between mouse seed regions and voxels in the macaque striatum. Black outlines highlight the voxels that show significant similarity (TFCE p<0.05).
Figure 4—figure supplement 3
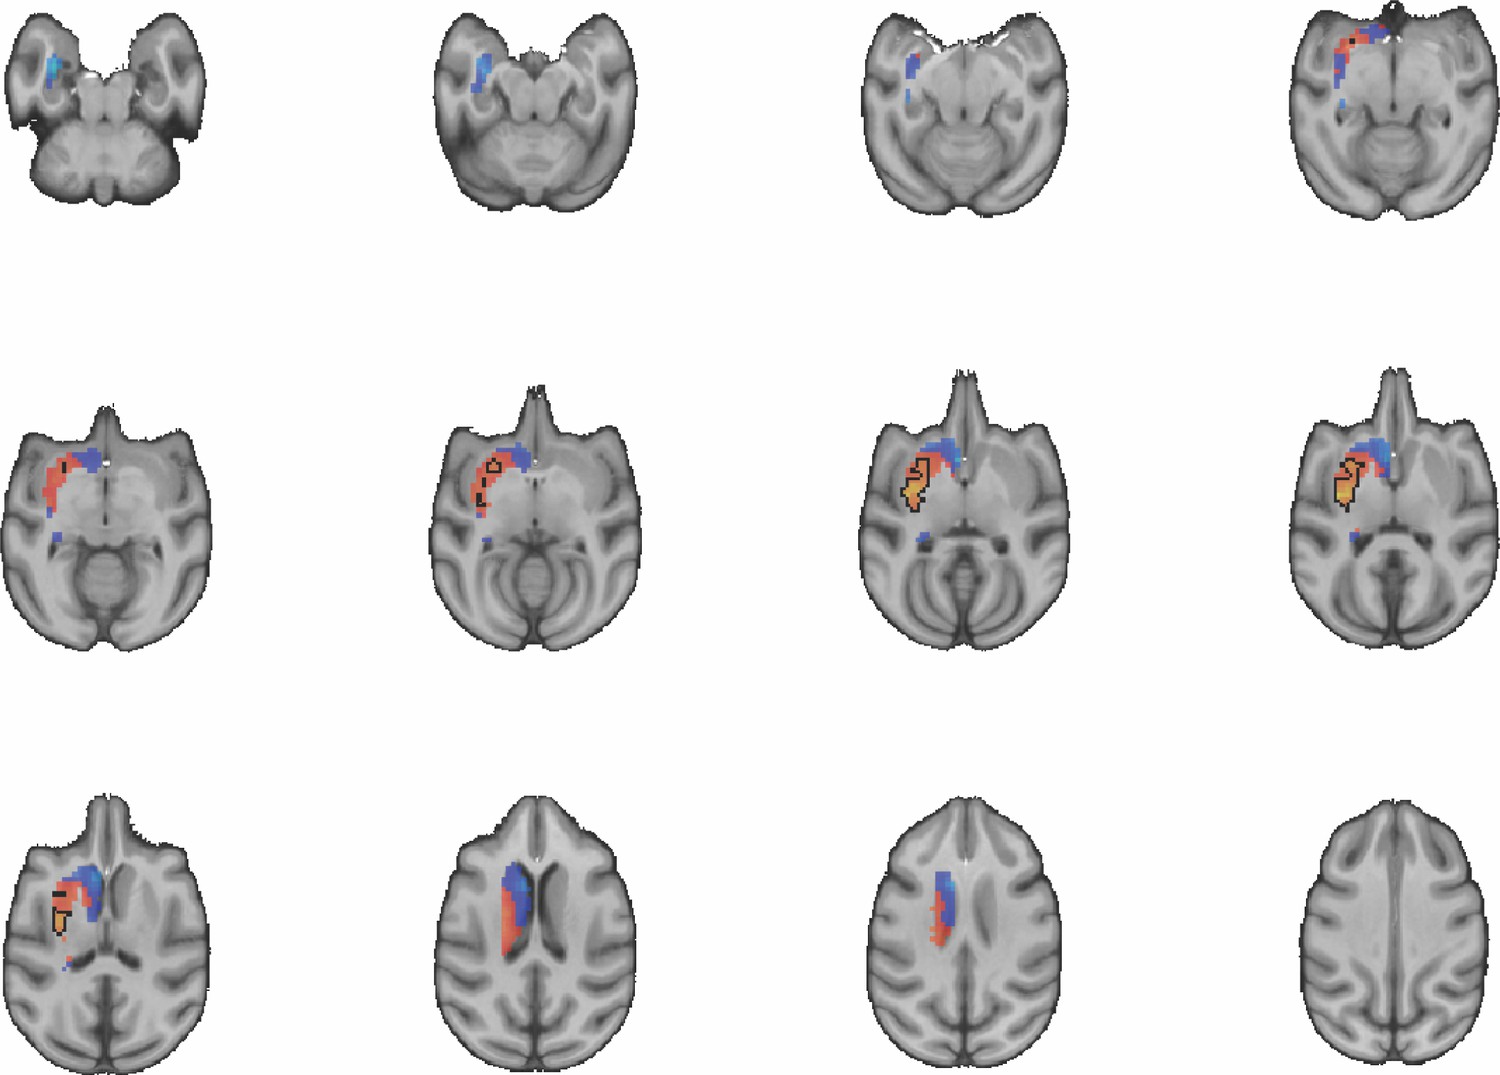
Images show axial slices through the macaque striatum including the unthresholded t-maps highlighting the similarity in mouse-macaque connectivity fingerprints for CP.l.
The red-yellow/blue-cyan colourmap shows the degree of positive/negative similarity between mouse seed regions and voxels in the macaque striatum. Black outlines highlight the voxels that show significant similarity (TFCE p<0.05).
Figure 5
Unthresholded whole-brain connectivity maps showing regions interconnected with CP.m, NAcc, CP.l, and unassigned voxels.
The bottom row shows cerebellar activations. The far-right column shows a thresholded conjunction analysis of voxels that possess significantly greater connectivity with unassigned voxels compared against all three mouse seeds.
Figure 6 with 4 supplements
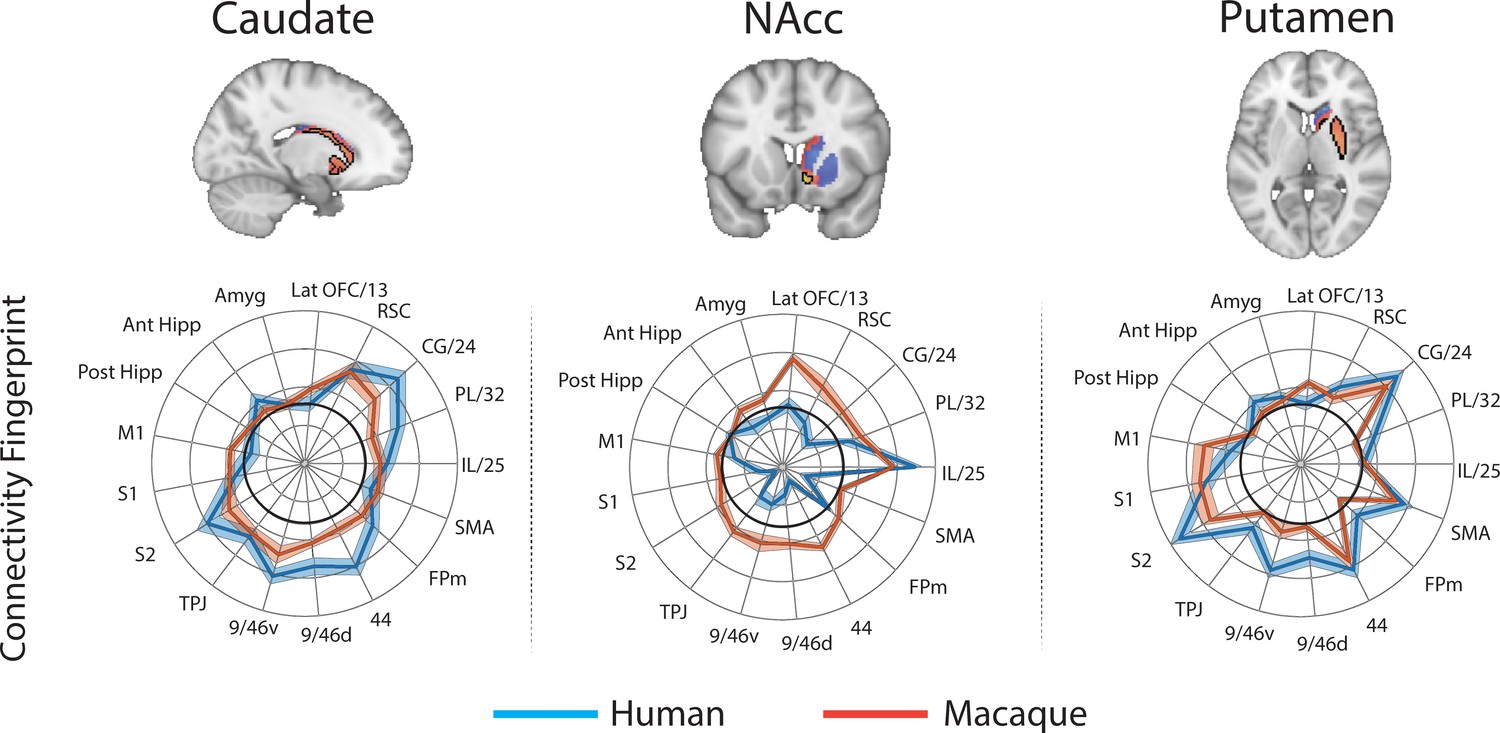
Brain images show unthresholded striatal t-maps of macaque-human similarity for caudate body, NAcc, and putamen.
Red-yellow voxels indicate increasingly positive correlations of connectivity fingerprints across species, blue-cyan voxels indicate increasing negative correlations of connectivity fingerprints across species. Black outlines indicate voxels that showed statistically significant similarity (TFCE p<0.05). Human and macaque connectivity fingerprints are shown underneath each brain image to highlight the similarity in connectivity pattern across species. Shaded error bars show the standard error of the mean. The data ranges from Z-values −0.25–0.4 and the thick grey circle shows 0.
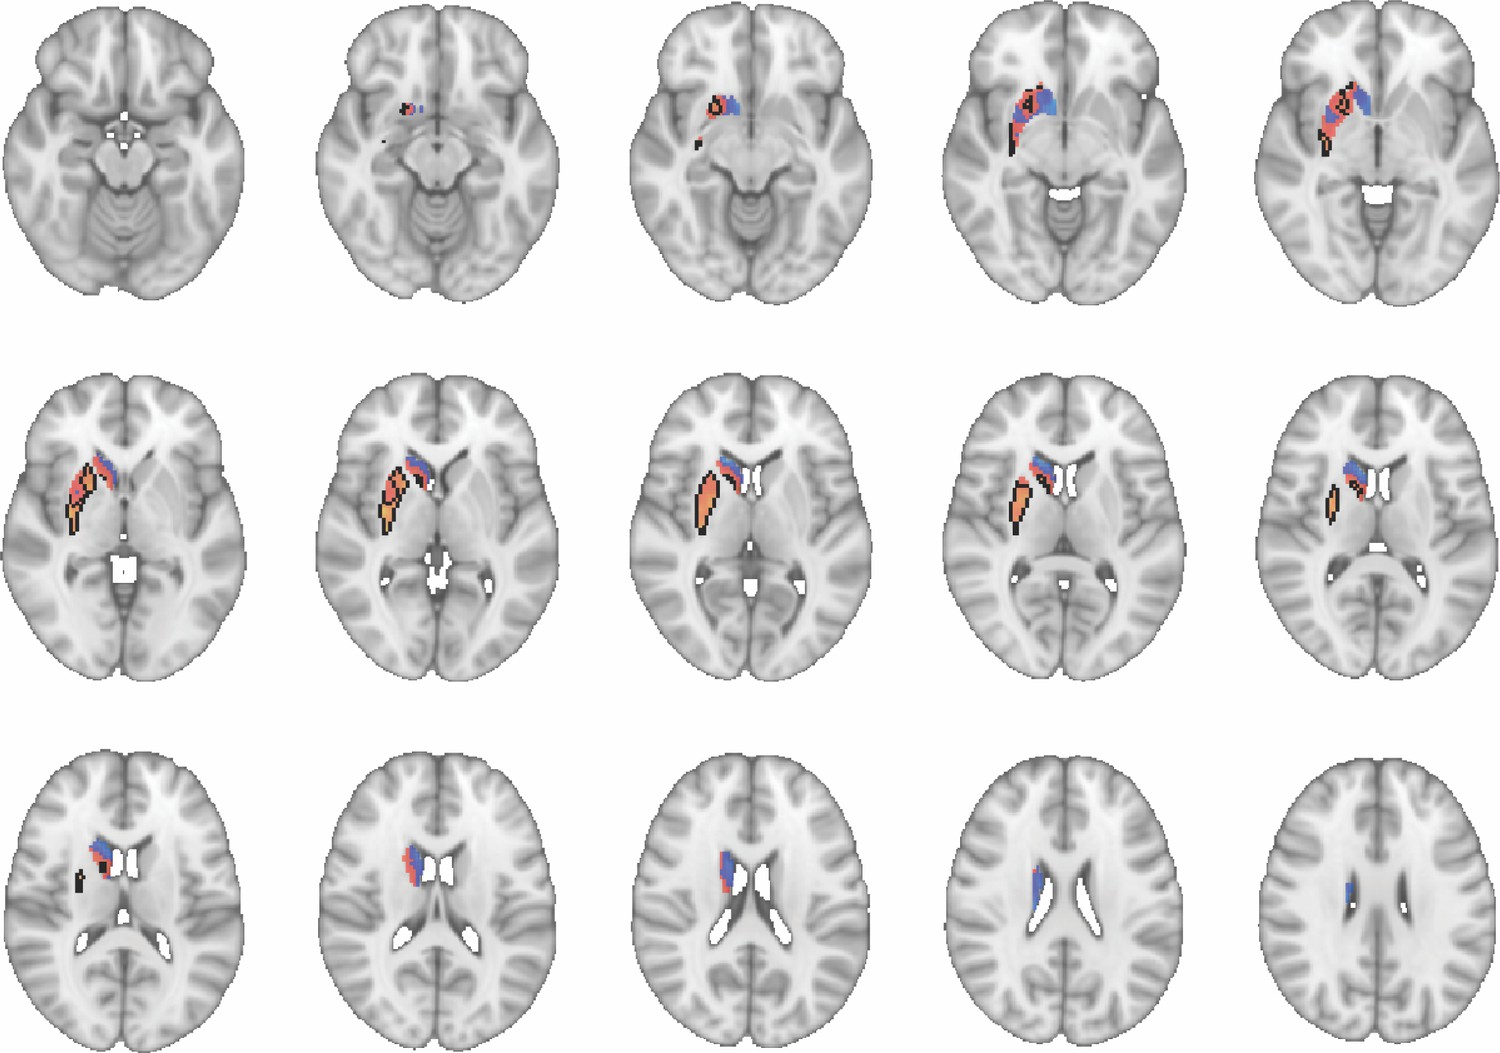
Figure 6—figure supplement 1
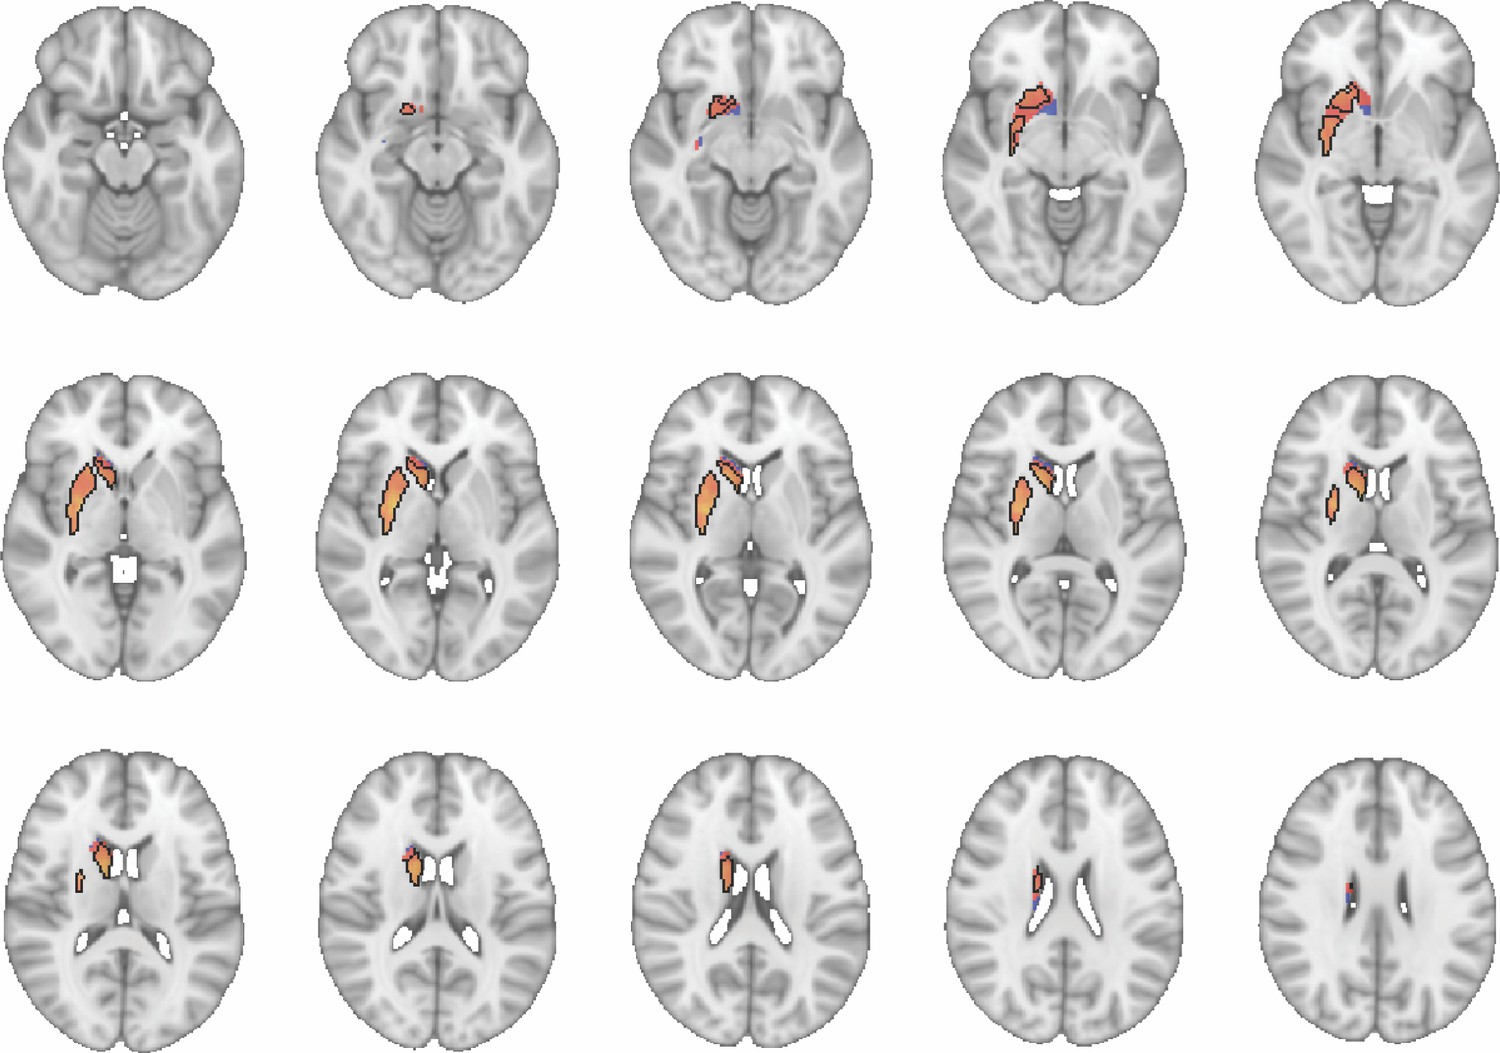
Images show axial slices through the human striatum including the unthresholded t-maps highlighting the similarity in macaque-human connectivity fingerprints for caudate body.
The red-yellow/blue-cyan colourmap shows the degree of positive/negative similarity between mouse seed regions and voxels in the human striatum. Black outlines highlight the voxels that show significant similarity (TFCE p<0.05). These images can be explored in Neurovault at https://neurovault.org/collections/NFGTNVFX/.
Figure 6—figure supplement 2
Images show axial slices through the human striatum including the unthresholded t-maps highlighting the similarity in macaque-human connectivity fingerprints for NAcc.
The red-yellow/blue-cyan colourmap shows the degree of positive/negative similarity between mouse seed regions and voxels in the human striatum. Black outlines highlight the voxels that show significant similarity (TFCE p<0.05). These images can be explored in Neurovault at https://neurovault.org/collections/NFGTNVFX/.
Figure 6—figure supplement 3
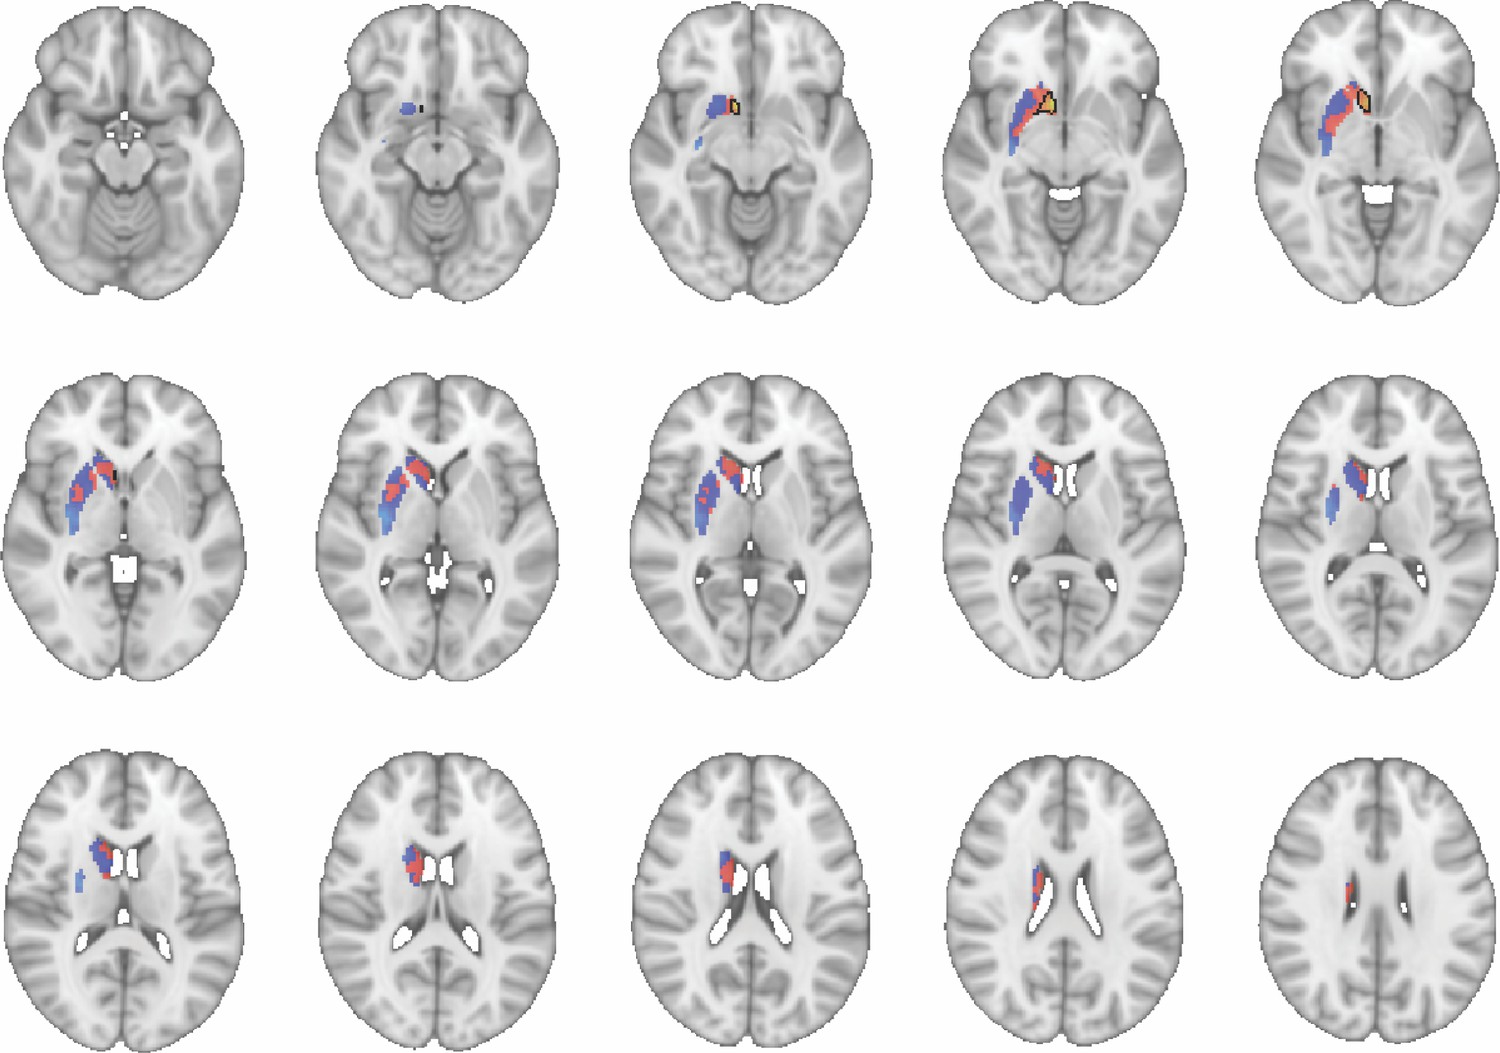
Images show axial slices through the human striatum including the unthresholded t-maps highlighting the similarity in macaque-human connectivity fingerprints for putamen.
The red-yellow/blue-cyan colourmap shows the degree of positive/negative similarity between mouse seed regions and voxels in the human striatum. Black outlines highlight the voxels that show significant similarity (TFCE p<0.05). These images can be explored in Neurovault at https://neurovault.org/collections/NFGTNVFX/.
Figure 6—figure supplement 4
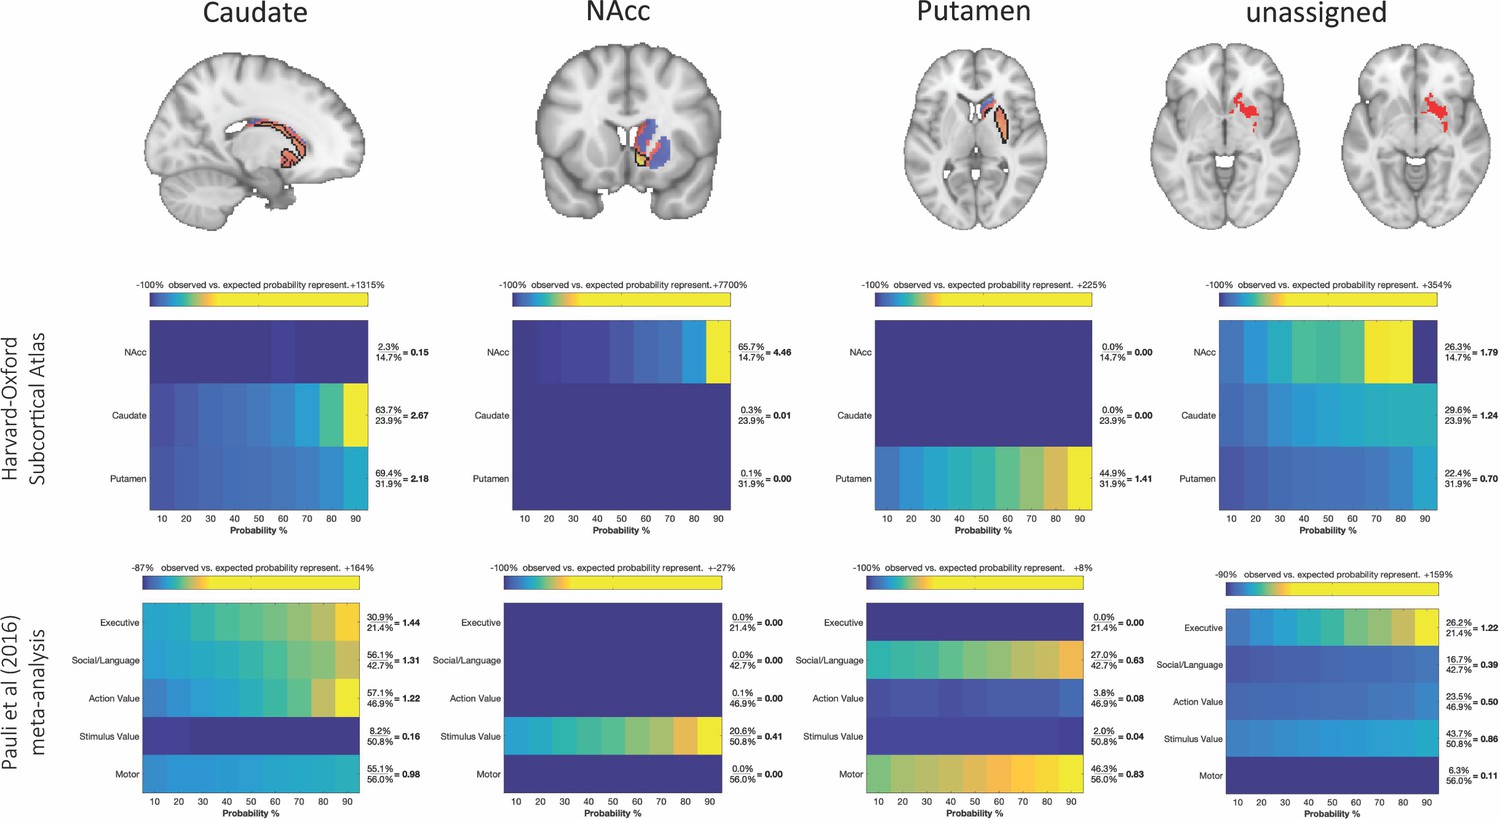
Brain images with unthresholded striatal t-maps showing macaque-human similarity for Caudate Nucleus, NAcc, and Putamen.
Black outlines indicate voxels that showed statistically significant similarity (TFCE p<0.05). The unassigned voxels are a binary mask indicating voxels that did not met the criteria for statistically significance for any of the trhee macaque seeds. Plots underneath each brain image show the anatomical and functional localisation of assigned and unassigned voxels. To the right of the colour table, the mean probability for each area at the location of a functional activation is divided by the overall mean probability of the respective area. This quotient indicates how much more likely this area was observed in the functionally defined volume as could be expected if the probabilities at that location would follow their overall distribution. Values greater than 1 indicate that a brain indicates a rather central location of the activation with respect to this area, whereas values less than 1 indicate a more peripheral one.
Figure 7
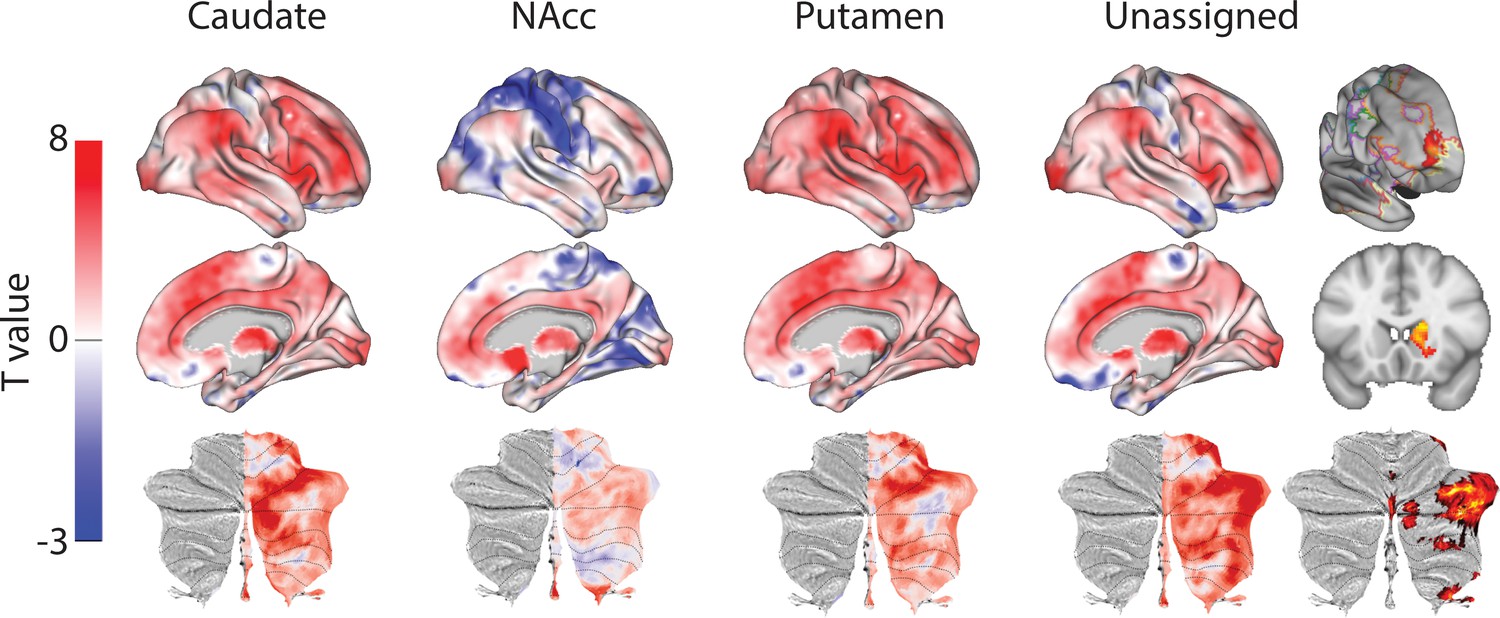
Unthresholded whole-brain connectivity maps showing regions interconnected with caudate body, NAcc, putamen, and unassigned voxels.
The bottom row shows cerebellar activations on a flattened representation of the cerebellum and dotted black lines show the lobular boundaries (Diedrichsen and Zotow, 2015). The far-right column shows a thresholded conjunction analysis of voxels that possess significantly greater connectivity with unassigned voxels compared against all three mouse seeds. Outlines from the Yeo cortical parcellation highlight that the significantly different voxels in humans are principally in regions identified as the frontal -parietal network and the cerebellum.
Figure 8
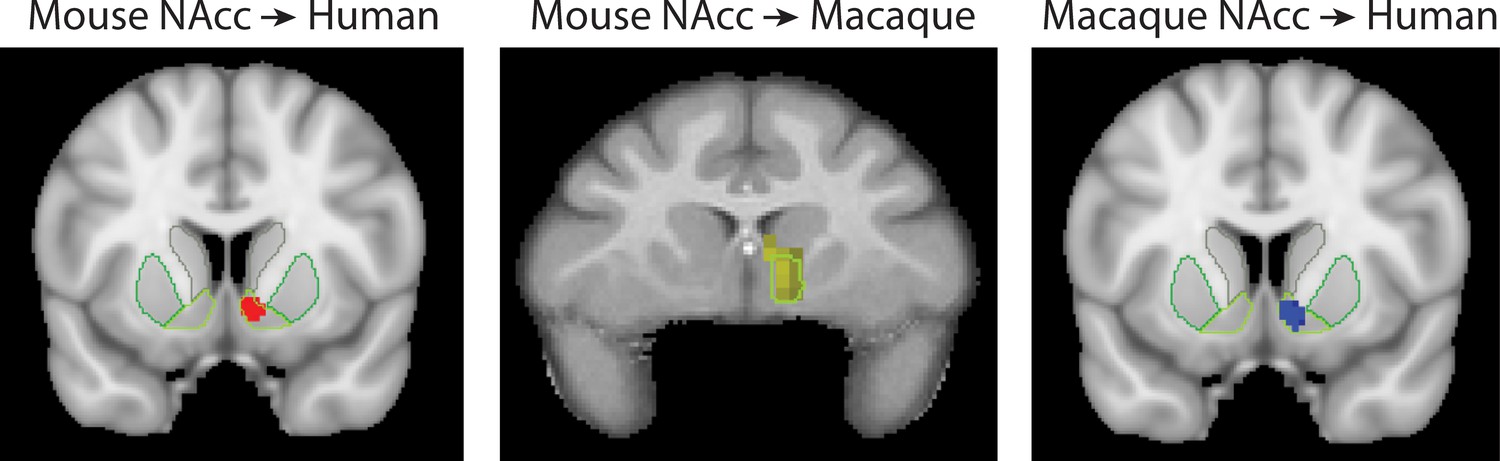
Brain images showing the spatial overlap of the NAcc across species.
Voxels highlight regions of statistically significant similarity across species (TFCE p<0.05). The light green outline in each image shows the anatomical boundaries of the human and macaque NAcc.
Additional files
-
Supplementary file 1
Supplementary tables.
- https://cdn.elifesciences.org/articles/53680/elife-53680-supp1-v1.docx
-
Transparent reporting form
- https://cdn.elifesciences.org/articles/53680/elife-53680-transrepform-v1.docx
Download links
A two-part list of links to download the article, or parts of the article, in various formats.
Downloads (link to download the article as PDF)
Open citations (links to open the citations from this article in various online reference manager services)
Cite this article (links to download the citations from this article in formats compatible with various reference manager tools)
Primate homologs of mouse cortico-striatal circuits
eLife 9:e53680.
https://doi.org/10.7554/eLife.53680


