Structural basis for ion selectivity in TMEM175 K+ channels
- Department of Biochemistry, University of Zürich, Switzerland
- Department Biozentrum, University of Basel, Switzerland
- Laboratory of Biomolecular Research, Paul Scherrer Institut, Switzerland
- VIB-VUB Center for Structural Biology, VIB, Belgium
- Structural Biology Brussels, Vrije Universiteit Brussel, Belgium
- Membrane Biophysics, Technical University of Darmstadt, Germany
- Department of Biosciences, University of Milano, Italy
Figures
Figure 1 with 4 supplements
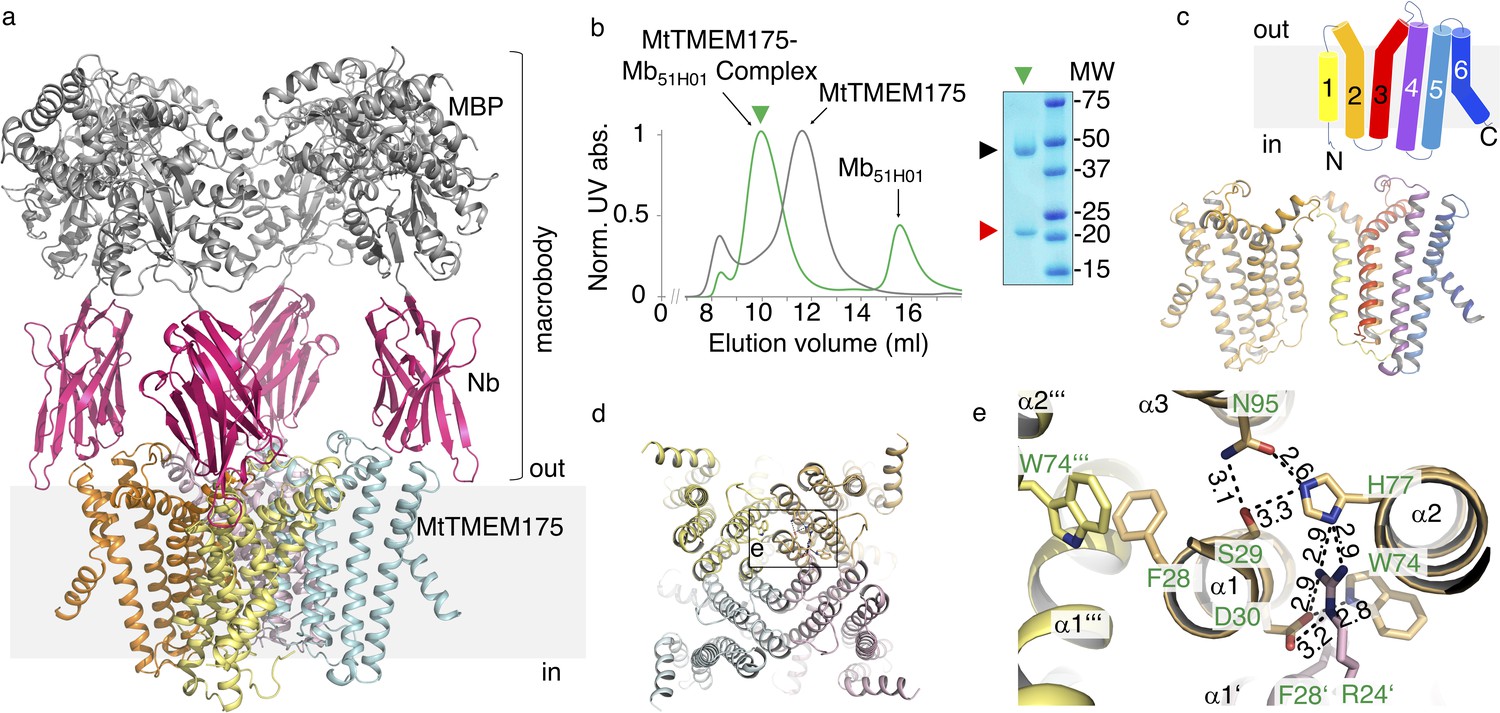
Structure of the MtTMEM175-Mb51H01 complex.
(a) Side view of the complex with MtTMEM175 channel and macrobody. Approximate membrane boundaries are indicated. (b) Left: Size exclusion chromatogram of MtTMEM175 (grey) and MtTMEM175-Mb51H01 complex (green). Right: Coomassie-stained SDS-PAGE gel of the peak fraction (green triangle) indicating complex formation of MtTMEM175 (red triangle) with Mb51H01 (black triangle). (c) Arrangement of transmembrane helices 1–6 in MtTMEM175. N- and C-termini are indicated. Two subunits are omitted for clarity. (d, e) MtTMEM175 tetramer (d) and close-up view on interacting residues with corresponding numbering (e). Distances are given in Å. The view is from the intracellular side.
Figure 1—figure supplement 1
Macrobody, sequence alignment of TMEM175 proteins and tetramer assembly.
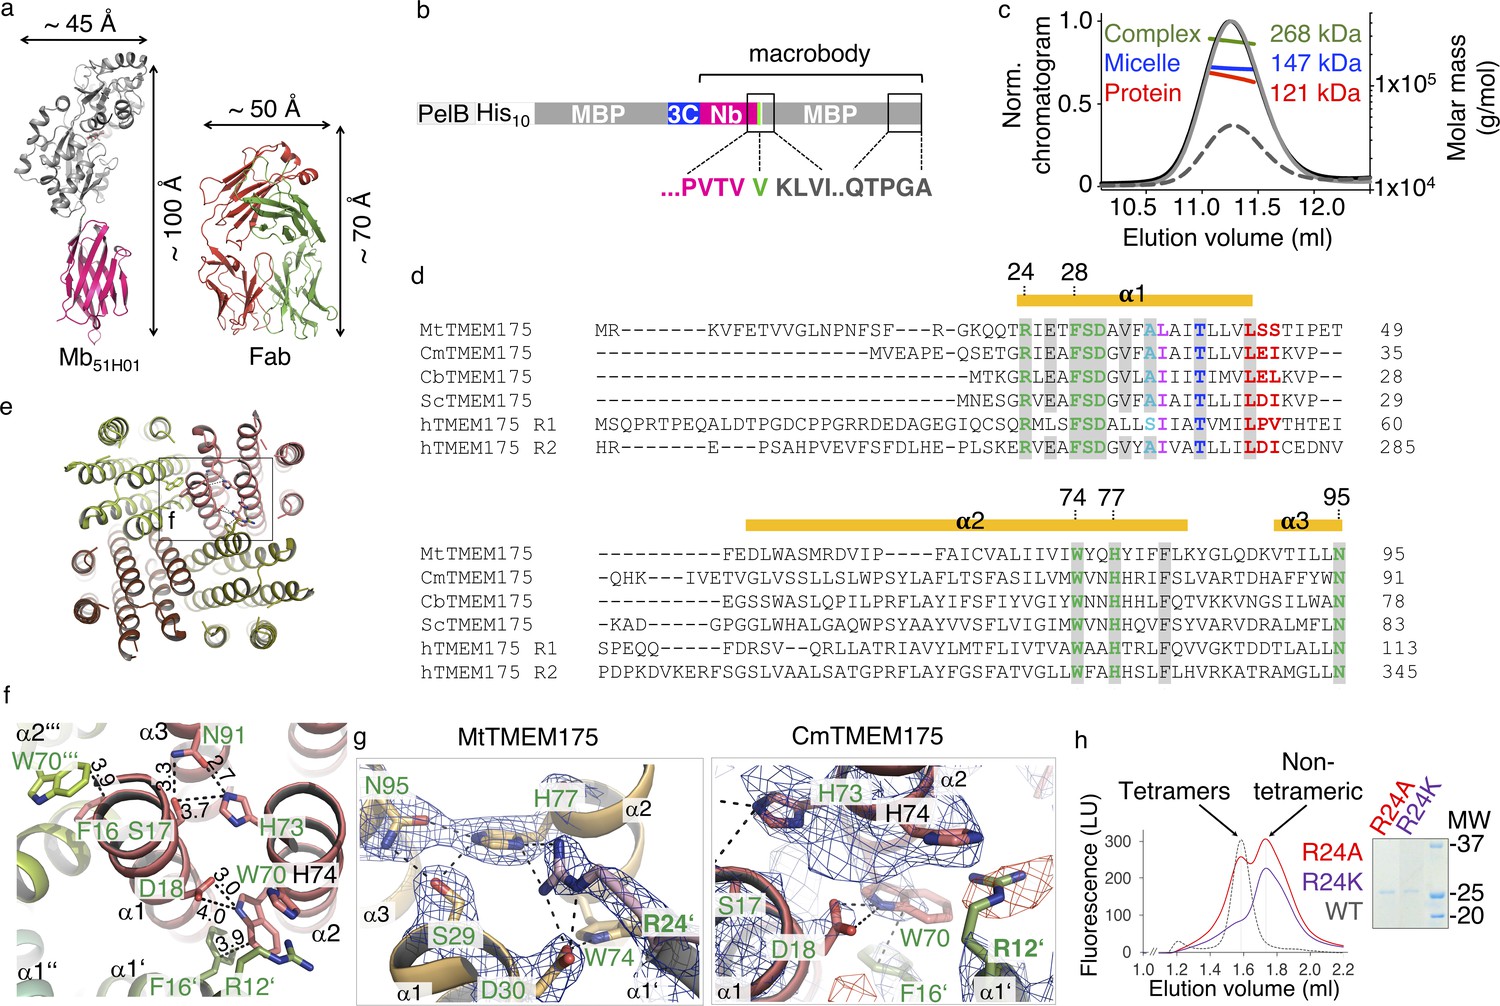
(a) Dimensions of the Mb51H01 fusion protein and a Fab (anti-KcsA, 5J9P) in comparison. (b) Macrobody expression construct. PelB: PelB leader sequence, His10: deca histidine-tag, MBP: maltose binding protein, 3C: 3C protease cleavage site, Nb: nanobody. (c) Multi angle laser light scattering (MALLS) coupled to a Superdex 200 (10/300) column, injected with MtTMEM175, after removal of tags. The molar mass is indicated: red, MtTMEM175, blue, detergent micelle of DDM, green, MtTMEM175 with DDM detergent micelle. The calculated molecular weight of the MtTMEM175 tetramer is 116 kDa. Grey line: UV absorption at 280 nm, dashed grey line: refractive index, black line: light scattering. (d) Sequence alignment of the N-terminal part of characterized TMEM175 family members. Mt: Marivirga tractuosa, Cm: Chamaesiphon minutus, Cb: Chryseobacterium sp., Sc: Streptomyces collinus, h: human. For hTMEM175 both repeats (R1, R2) were included in the alignment. Transmembrane helices from the MtTMEM175 structure are indicated by orange bars with corresponding numbering. Identical amino acids are marked in grey. Residues participating in a conserved hydrogen bond network between helices 1–3 are colored in green. Residues of the ion binding site are colored red while residues that confer K+ selectivity in MtTMEM175 and hTMEM175 are indicated in blue and cyan. Residues that form the gate are shown in magenta. (e,f) Tetramer assembly in CmTMEM175 (5VRE) (e) and close-up view on interacting residues with corresponding numbering (f). Distances are given in Å. The view is from the intracellular side. (g) Interactions of the conserved arginine in helix one in MtTMEM175 and CmTMEM175. The view is from the intracellular side. Left: Close-up view of Arg24 in helix 1 of MtTMEM175, showing the interaction with His77 and Asp30 of the adjacent subunit. The 2Fo-Fc electron density is shown as blue mesh (at 2.4 Å, contoured at 1.8 σ, sharpened with b=-25). Right: Negative difference electron density in the structure of CmTMEM175 at the position of Arg12. The 2Fo-Fc electron density (at 3.3 Å, contoured at 1.55 σ, blue) and the Fo-Fc density (contoured at −3 σ, red) are depicted. (h) Defective tetramer assembly. Left: Size exclusion chromatograms from a Superdex 200 5/150 column of MtTMEM175 Arg24 mutant proteins compared to a WT chromatogram. Right: Coomassie-stained SDS-PAGE gel of purified R24A and R24K mutant proteins that were subjected to SEC.
Figure 1—figure supplement 2
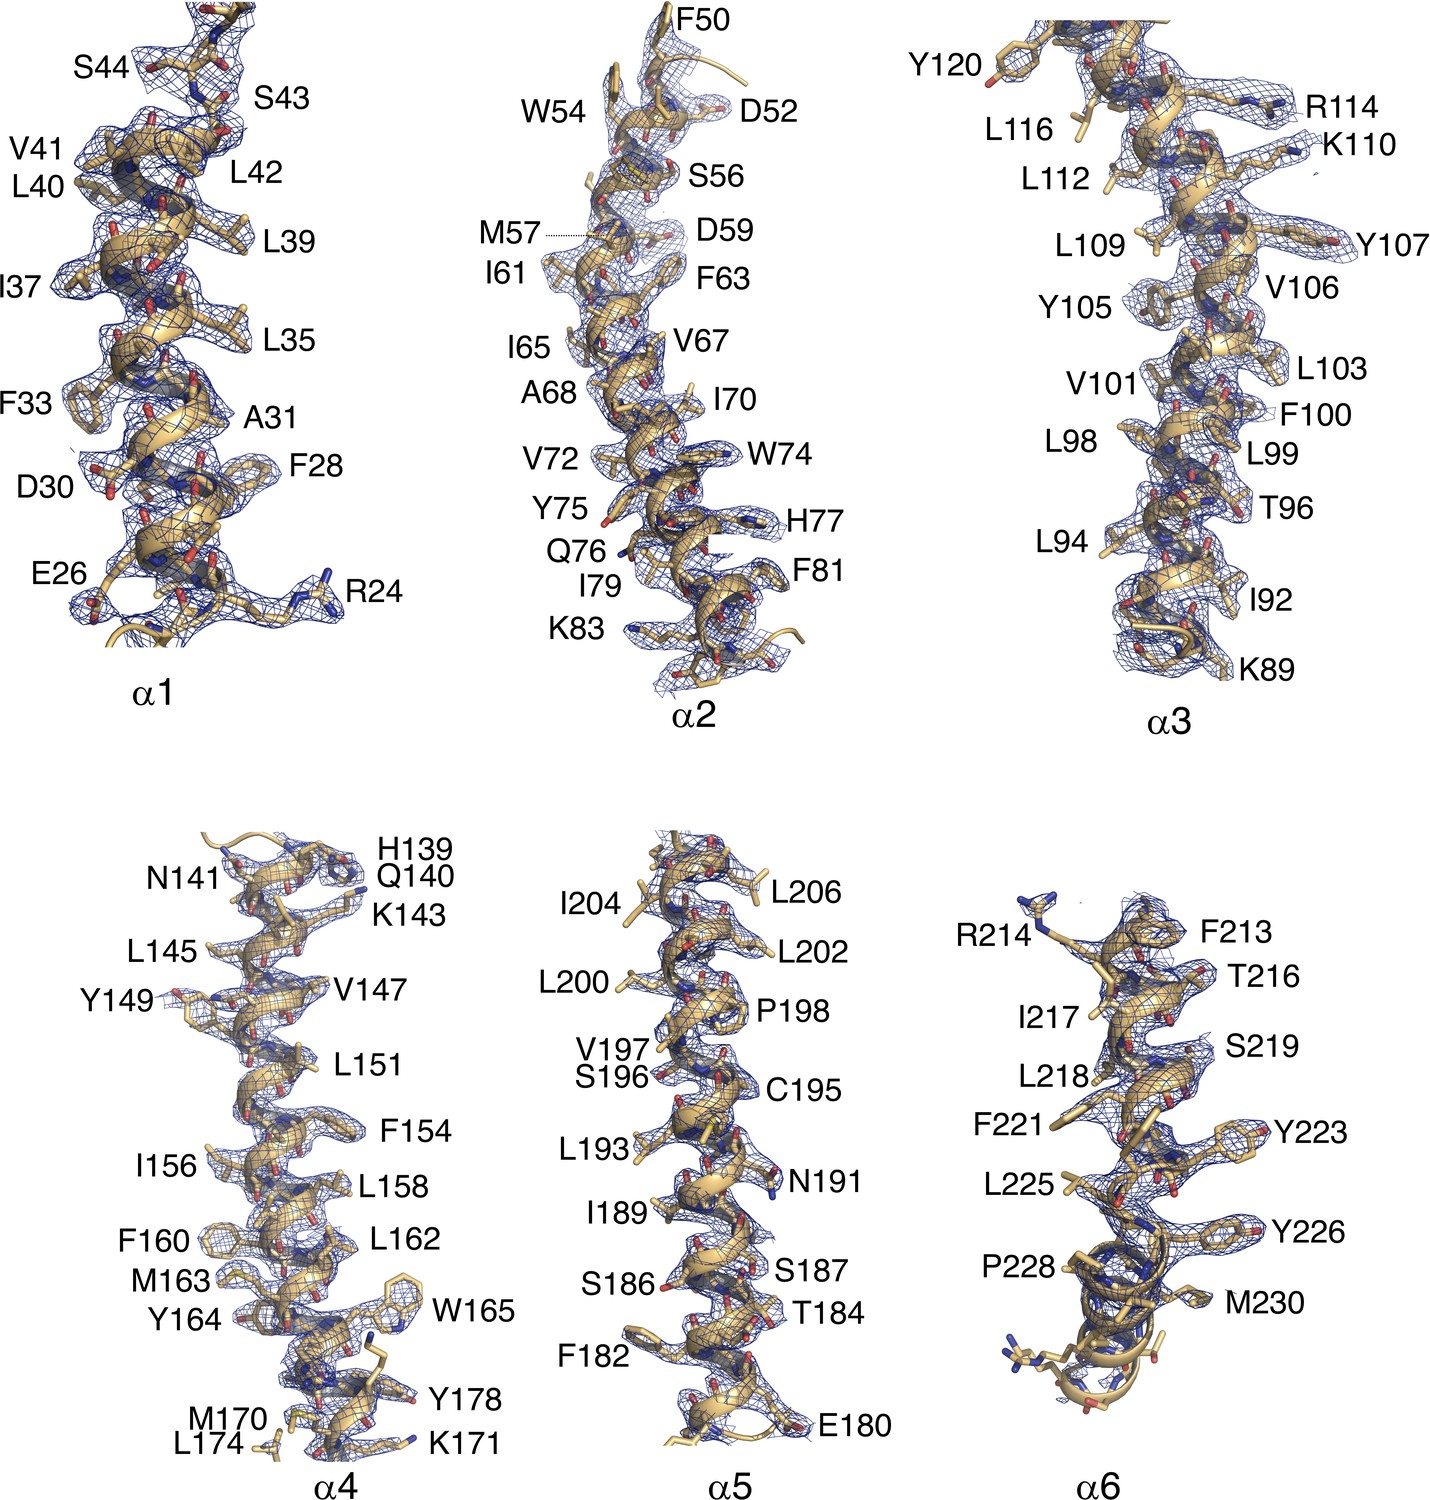
Electron density map of MtTMEM175 transmembrane helices.
Electron density map in helices 1–6 with the model superimposed. Selected residues are labelled. The Fo-Fc density (at 2.4 Å, contoured at 1.5–1.8 σ after sharpening with b=-25, blue) is displayed.
Figure 1—figure supplement 3
Electron density map of MtTMEM175.
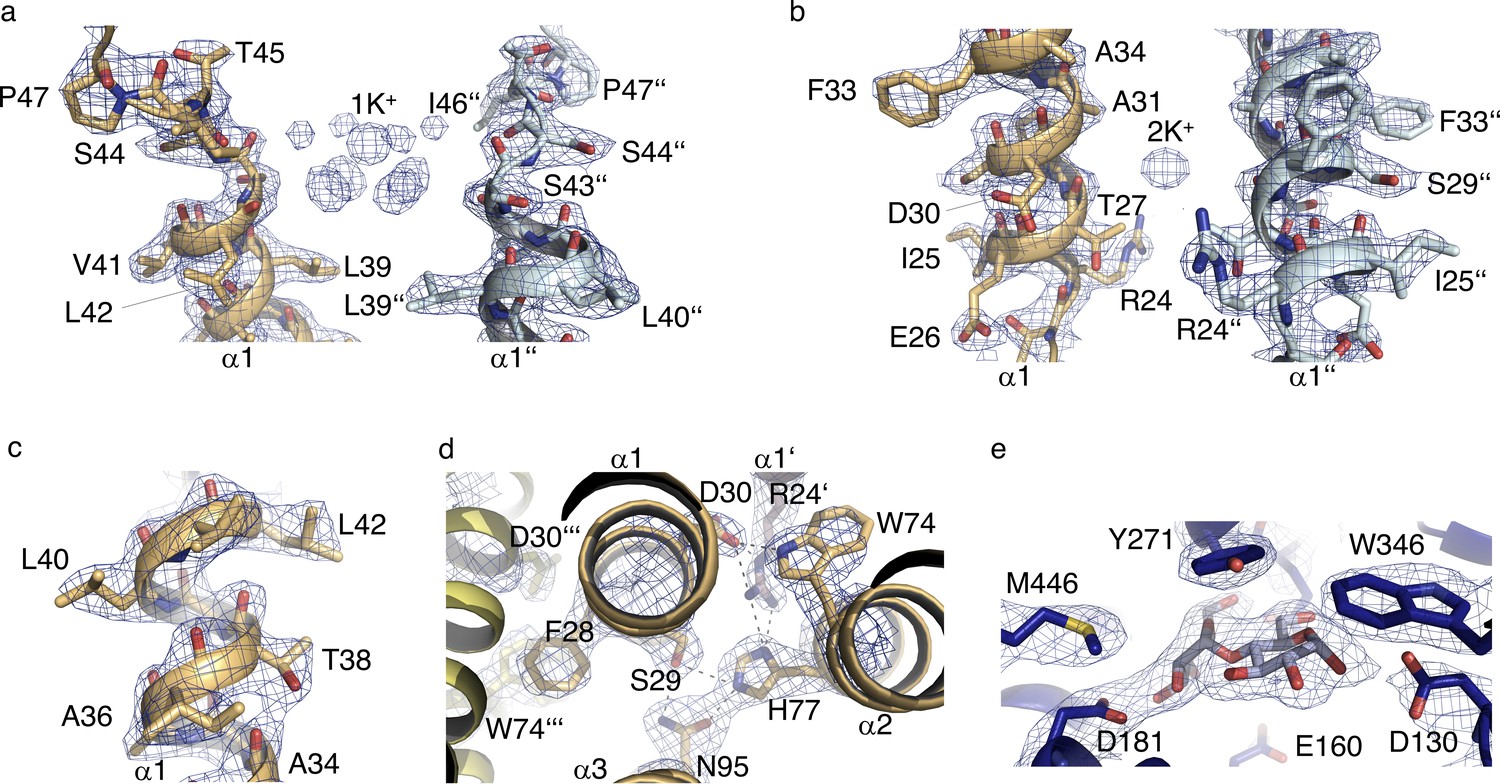
Electron density map at various regions with the model superimposed. Selected residues are labelled. (a) K+ hydrate (1K+) and surrounding. (b) 2K+ and surrounding. (c) A section of helix one showing the electron density for Thr38. (d) Hydrogen-bond network in helices 1–3. The view is from the extracellular side. (e) Interactions of maltose with MBP. The 2Fo-Fc density (at 2.4 Å, contoured at 1.8–2.0 σ after sharpening with b=-25, blue) is displayed.
Figure 1—figure supplement 4
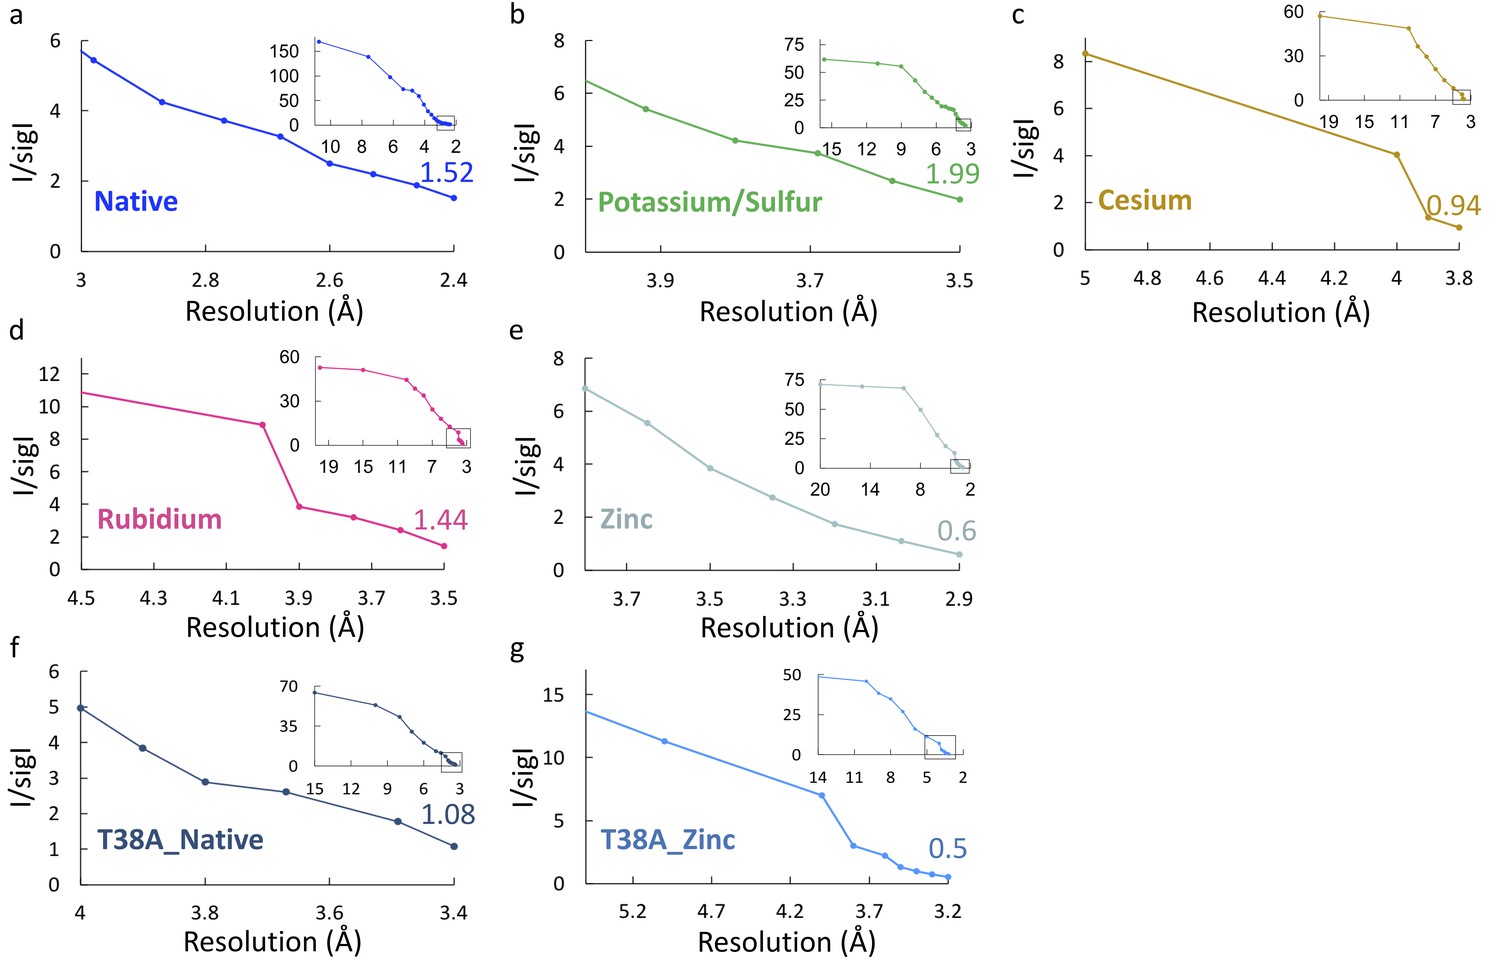
Plots of I/sigI vs. resolution.
Plots of I/sigI vs. resolution for the different crystallographic data sets. (a) Native. (b) Potassium/Sulfur. (c) Cesium. (d) Rubidium. (e) Zinc (f) T38A_Native. (g) T38A_Zinc. A black box in the small insets marks the zoomed main panels at high resolution.
-
Figure 1—figure supplement 4—source data 1
Raw data for Figure 1—figure supplement 4.
- https://cdn.elifesciences.org/articles/53683/elife-53683-fig1-figsupp4-data1-v3.xlsx
Figure 2 with 4 supplements
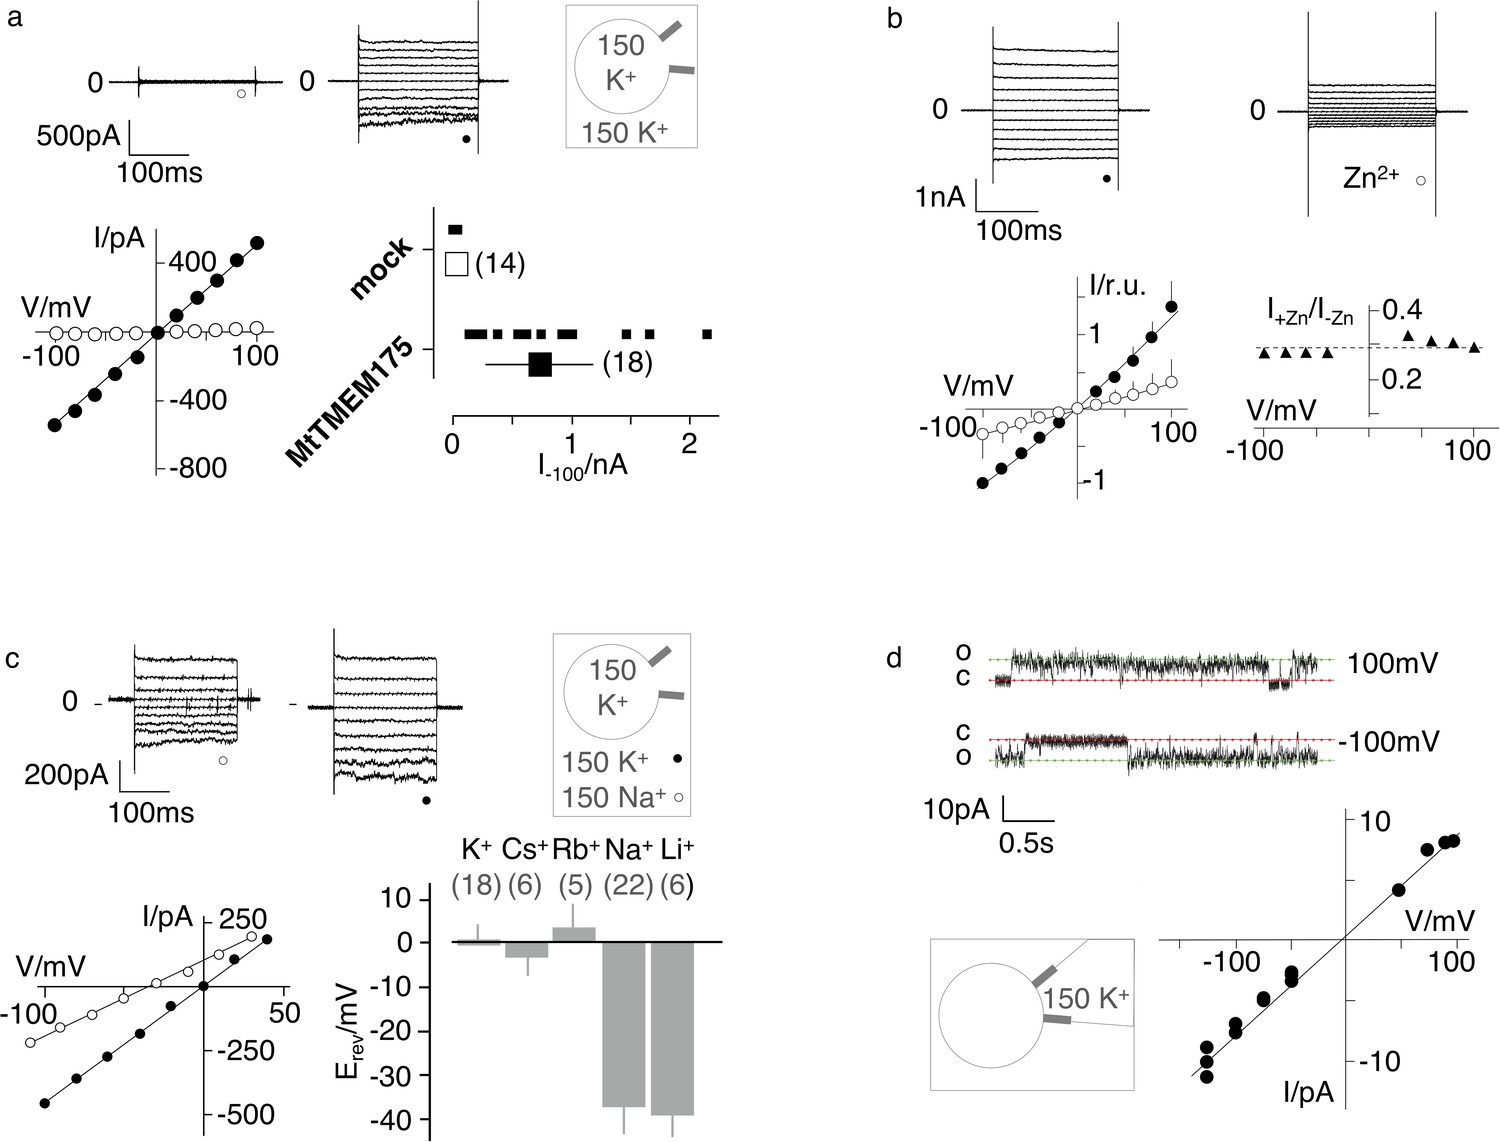
Electrophysiological characterization of MtTMEM175.
(a) Current responses to standard voltage pulse protocol in mock (○) and MtTMEM175 (⚫) transfected HEK293 cells (upper panel) and corresponding steady state I/V relations (lower left). Plot of currents recorded in same manner at −100 mV for individual cells (small symbols) and mean ±s.d. (large symbols) (lower right). Number of cells in brackets. (b) HEK293 cells expressing MtTMEM175 before (⚫) and after (○) adding 5 mM ZnSO4 to the bath solution containing 150 mM K+ (upper panel). Mean I/V relation (bottom left) of n = 4 cells (±s.d.). To compare the effect on different cells the I/V relation was normalized to currents at −100 mV in the absence of blocker (bottom left). The voltage dependency of the Zn2+ block was estimated by dividing currents in the presence and absence of Zn2+ (I+Zn/I-Zn) (bottom right) (c) HEK293 cells expressing MtTMEM175 (top row) before (left) and after (middle) replacing Na+ (○) with K+ (⚫) in the external buffer and corresponding I/V relation (bottom left). Same experiments were performed by exchanging K+ in external buffer by other cations. The mean reversal voltage (Erev) (±s.d., number of cells in brackets) is depicted in lower right panel. (d) Exemplary channel fluctuations at ±100 mV measured in cell-attached configuration on HEK293 cells expressing MtTMEM175 (upper) and pooled unitary I/V relation of single channel events from 10 measurements in four different cells (lower right) using standard bath and pipette solutions.
-
Figure 2—source data 1
Raw data for Figure 2a.
- https://cdn.elifesciences.org/articles/53683/elife-53683-fig2-data1-v3.xlsx
-
Figure 2—source data 2
Raw data for Figure 2b.
- https://cdn.elifesciences.org/articles/53683/elife-53683-fig2-data2-v3.xlsx
-
Figure 2—source data 3
Raw data for Figure 2c.
- https://cdn.elifesciences.org/articles/53683/elife-53683-fig2-data3-v3.xlsx
-
Figure 2—source data 4
Raw data for Figure 2d.
- https://cdn.elifesciences.org/articles/53683/elife-53683-fig2-data4-v3.xlsx
Figure 2—figure supplement 1
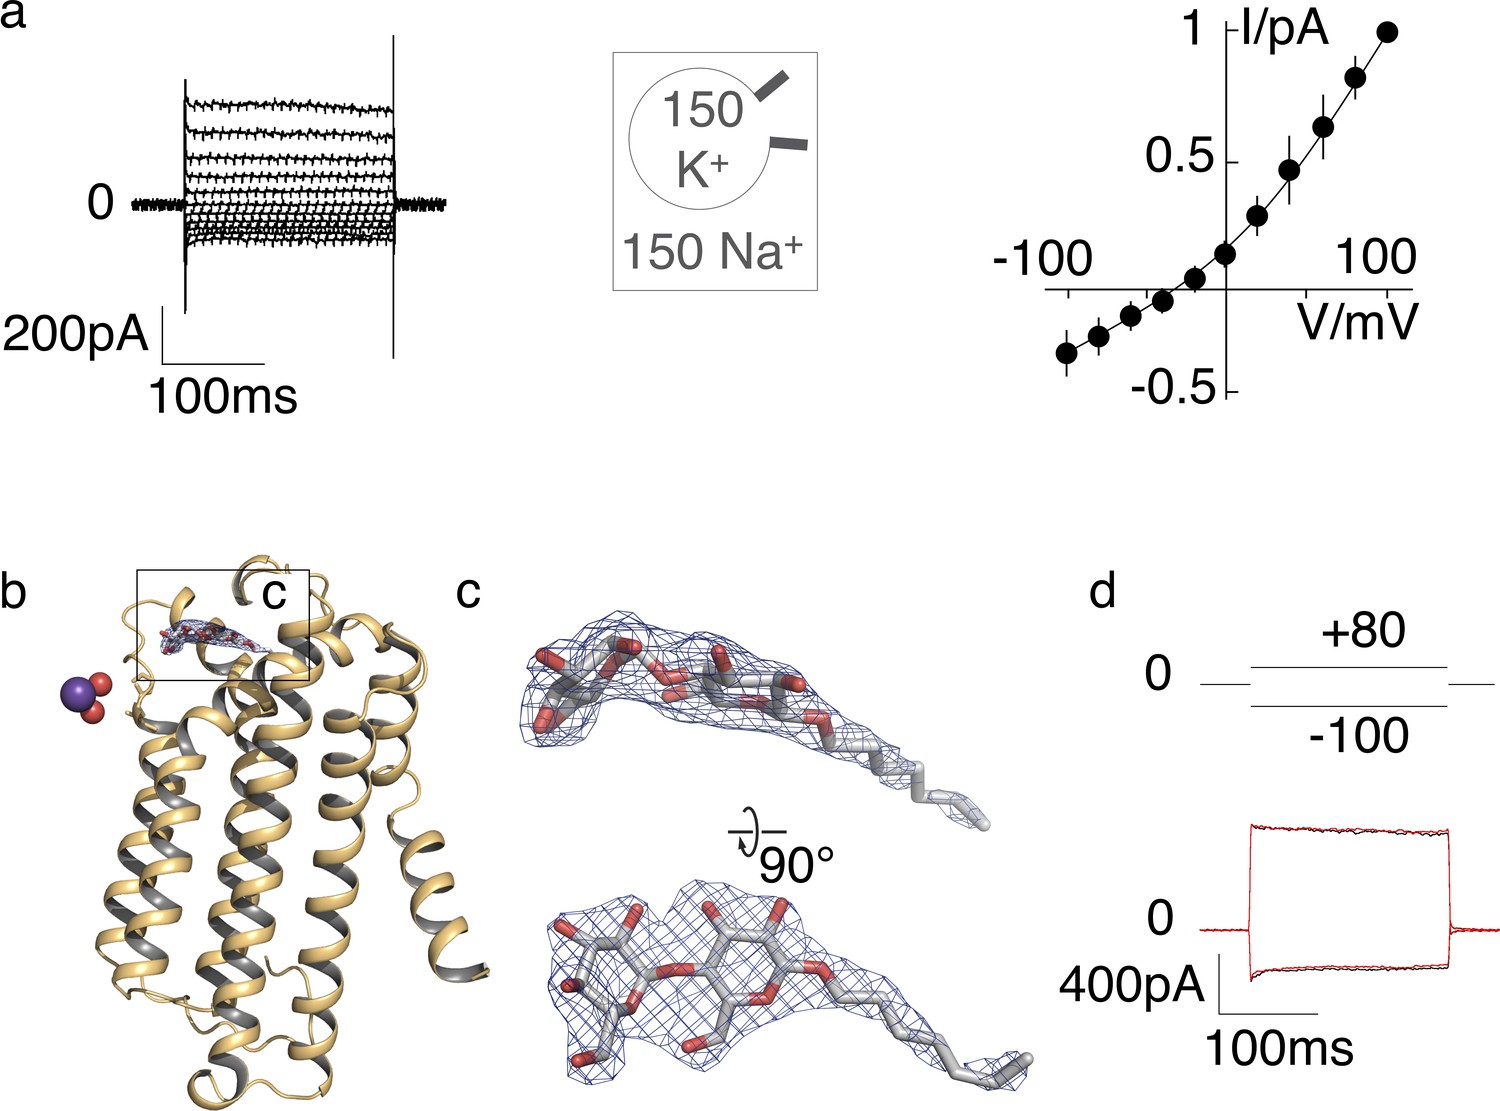
K+ selectivity in ScTMEM175 and electron density of a putative maltoside in the MtTMEM175 structure.
(a) Current responses of ScTMEM175 transfected HEK293 cells to voltage steps between ±100 mV (left). Cells were measured with 150 mM Na+ and 150 mM K+ in the bath and pipette solution, respectively. Mean steady state I/V relation (±s.d.) from 4 cells measured under the same condition. Data were normalized to currents at +100 mV. The mean reversal voltage of the 4 cells is −37 ± 9 mV (right). (b) Residual density on the extracellular entrance of MtTMEM175 was attributed to a detergent molecule (DDM or DM). The 2Fo-Fc density (at 2.4 Å, contoured at 1.5 σ after sharpening with b=-40, blue) is displayed. Only one subunit is shown. (c) Close-up views on the maltoside with overlaid 2Fo-Fc density. (d) Current responses of HEK293 cells expressing MtTMEM175 to voltage steps from 0 mV to +80 /- 100 mV before (black) and after (red) adding 10 mM maltose to the bath solution with 150 mM Na+.
-
Figure 2—figure supplement 1—source data 1
Raw data for Figure 2—figure supplement 1.
- https://cdn.elifesciences.org/articles/53683/elife-53683-fig2-figsupp1-data1-v3.xlsx
Figure 2—figure supplement 2
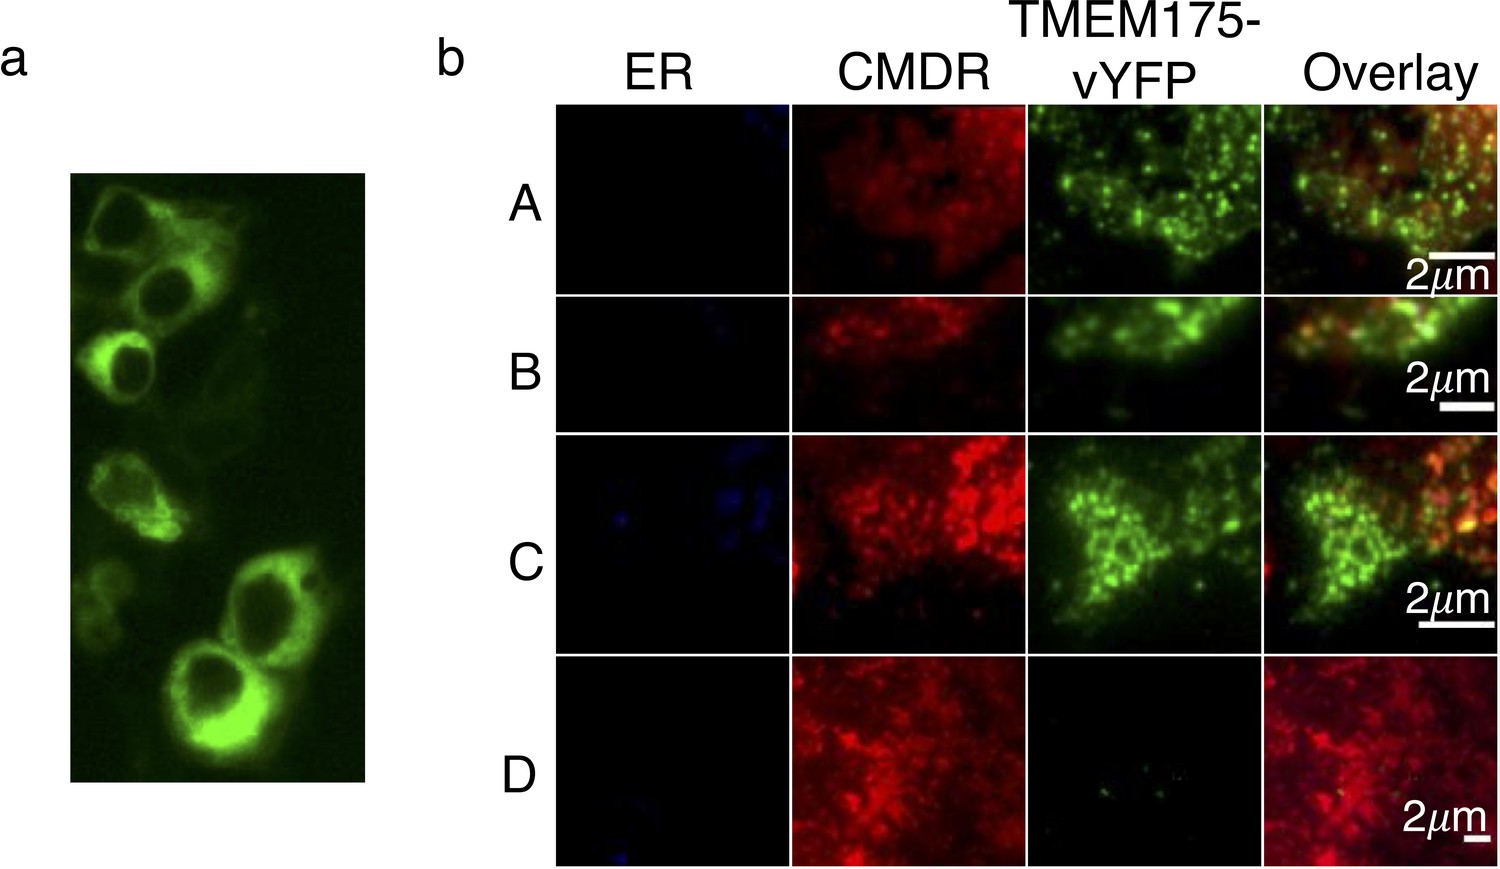
Plasma membrane localization of TMEM175 proteins.
(a) Expression profile of C-terminally vYFP-tagged MtTMEM175 in HEK293 cells. (b) TIRF images of membrane patches from decapitated HEK293 cells. Patches were obtained from cells transiently expressing C-terminally vYFP-tagged hTMEM175 (A), MtTMEM175 (B) or MtTMEM175 T38A mutant (C). Untransfected cells served as a negative control (D). Columns from left to right: ER stained with ER tracker blue, plasma membrane (PM) stained red with CMDR, vYFP-tagged TMEM175 proteins. Last column shows merged images of different vYFP-tagged TMEM175 variants with ER and PM stain. Scale bar = 2 μm.
Figure 2—figure supplement 3
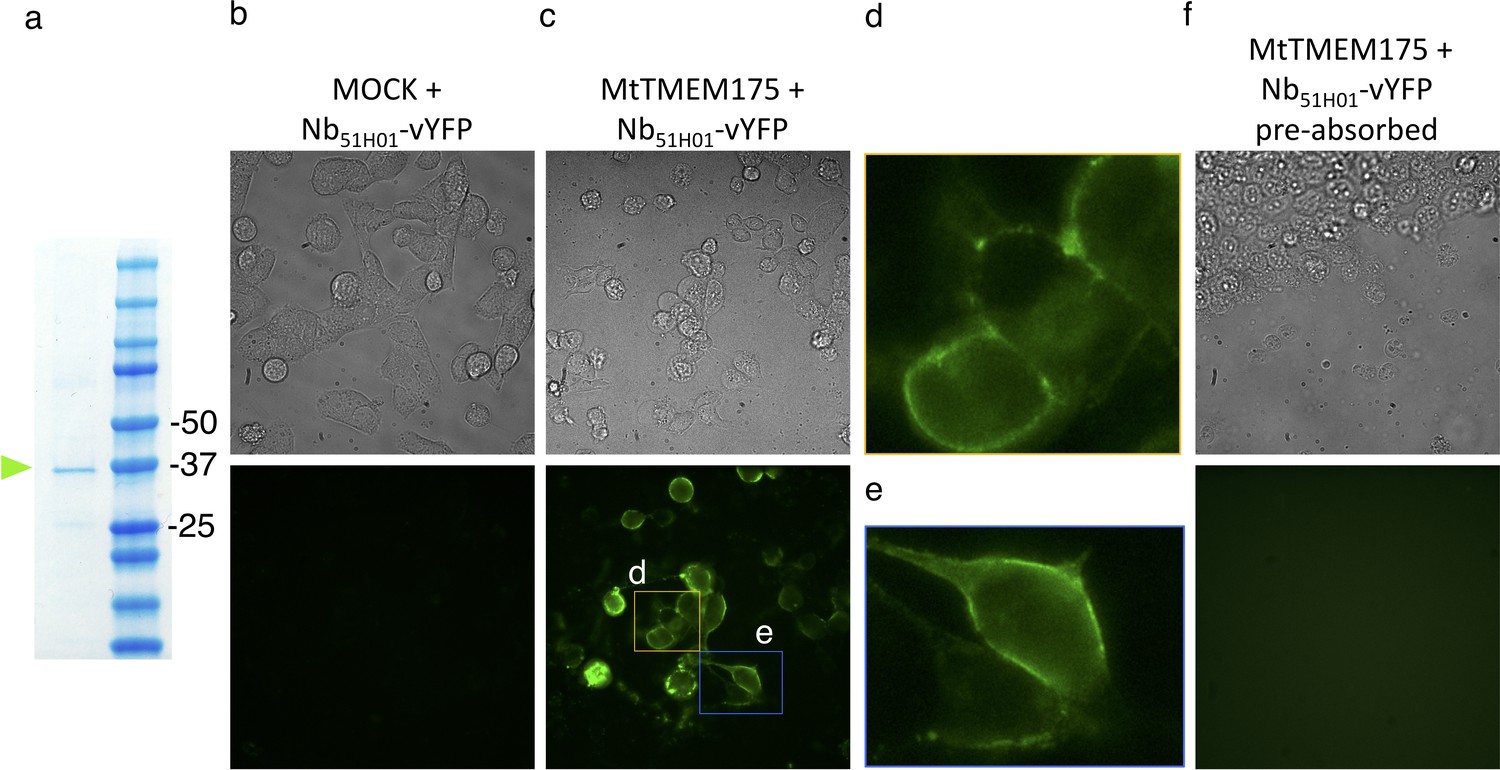
Cell surface labelling of MtTMEM175 using Nb51H01-vYFP.
(a) SDS Page of purified vYFP-tagged Nb51H01 before application in (b,c,f). (b,c,f) Bright field (top row) and GFP-channel images (bottom row) after application of purified Nb51H01-vYFP to MOCK (b) or MtTMEM175 (c,f) transfected HEK cells. (d,e) Enlarged sections of epifluorescence images in (c). In (f) the Nb51H01-vYFP was pre-absorbed with an excess of purified non-fluorescent MtTMEM175 before application to the cells.
Figure 2—figure supplement 4
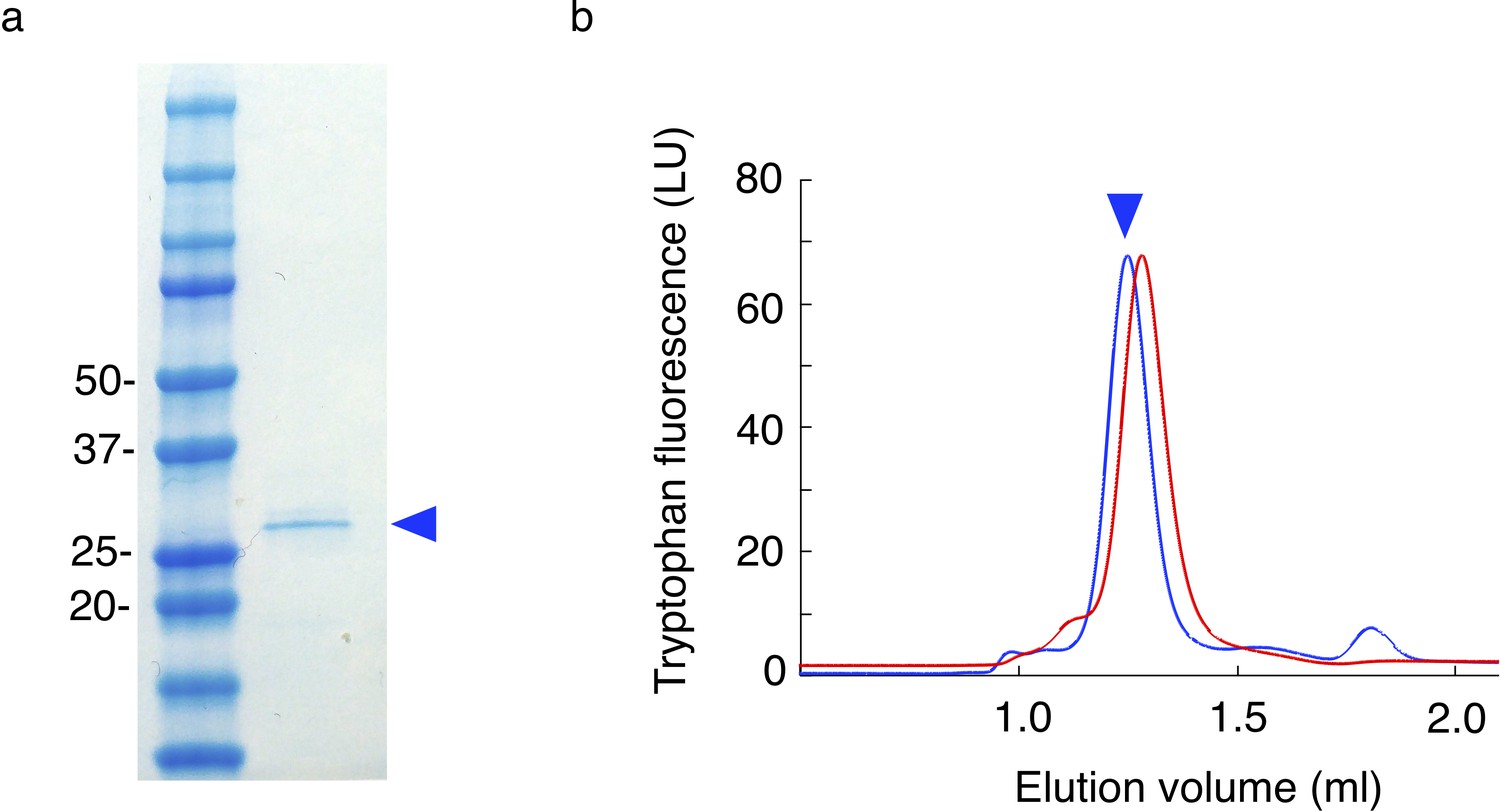
Purification of MtTMEM175 from HEK cells.
(a) Coomassie stained SDS-PAGE of purified MtTMEM175 from HEK cells before subjecting to size exclusion chromatography in (b). (b) Size exclusion chromatography with MtTMEM175 purified from HEK cells (blue) in comparison with MtTMEM175 purified from E. coli (red). The difference in the retention volumes between the two samples arises from the presence (blue) or absence (red) of the purification tags. The peak heights are normalized.
-
Figure 2—figure supplement 4—source data 1
Raw data for Figure 2—figure supplement 4.
- https://cdn.elifesciences.org/articles/53683/elife-53683-fig2-figsupp4-data1-v3.xlsx
Figure 3 with 1 supplement
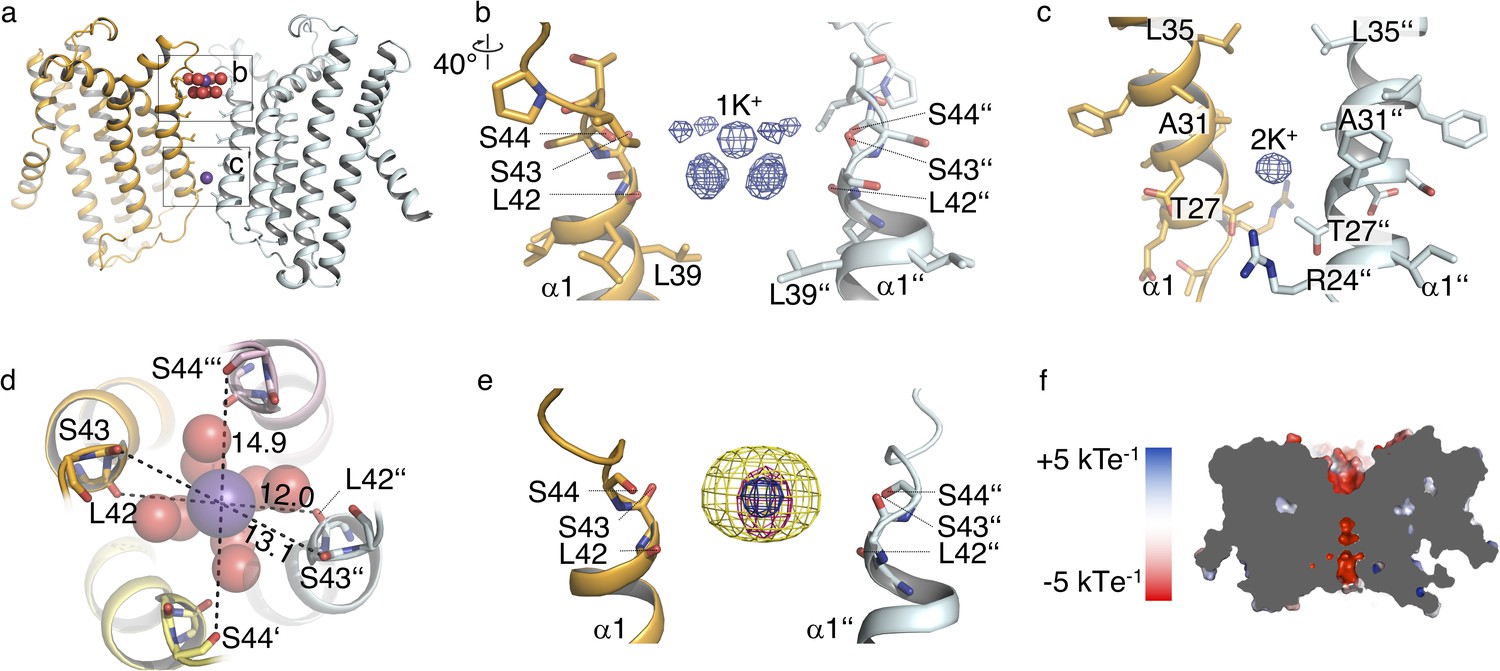
Ions in the MtTMEM175 structure.
(a–c) Side view on MtTMEM175 (a) and close-up views of the ion binding site with a hydrated K+ ion at position 1K+ (b) and another K+ ion within the pore at position 2K+(c). In (a), K+ ions and water molecules are displayed as purple and red spheres, respectively. In (b) and (c) the 2Fo-Fc electron density is depicted as blue mesh at the position 1K+ and 2K+ (at 2.4 Å, contoured at 1.8 σ, sharpened with b=-25). Two subunits are omitted for clarity. (d) Top view of the ion binding site. Distances between opposing backbone oxygens of Leu42, Ser43 and Ser44 are indicated in Å. Side chains are omitted and the size of the spheres is reduced for clarity. (e) Substitution of K+ in the ion binding site with Cs+ and Rb+. The 2Fo-Fc electron density (as in (b) and (c), blue mesh) marks the position of the K+ ion. Anomalous difference electron densities of Cs+ (at 3.8 Å, contoured at 7 σ) and Rb+ (at 3.6 Å, contoured at 7 σ, blurred with b = 125) are shown in yellow and magenta, respectively. (f) Illustration of the surface electrostatic potential across the pore.
Figure 3—figure supplement 1
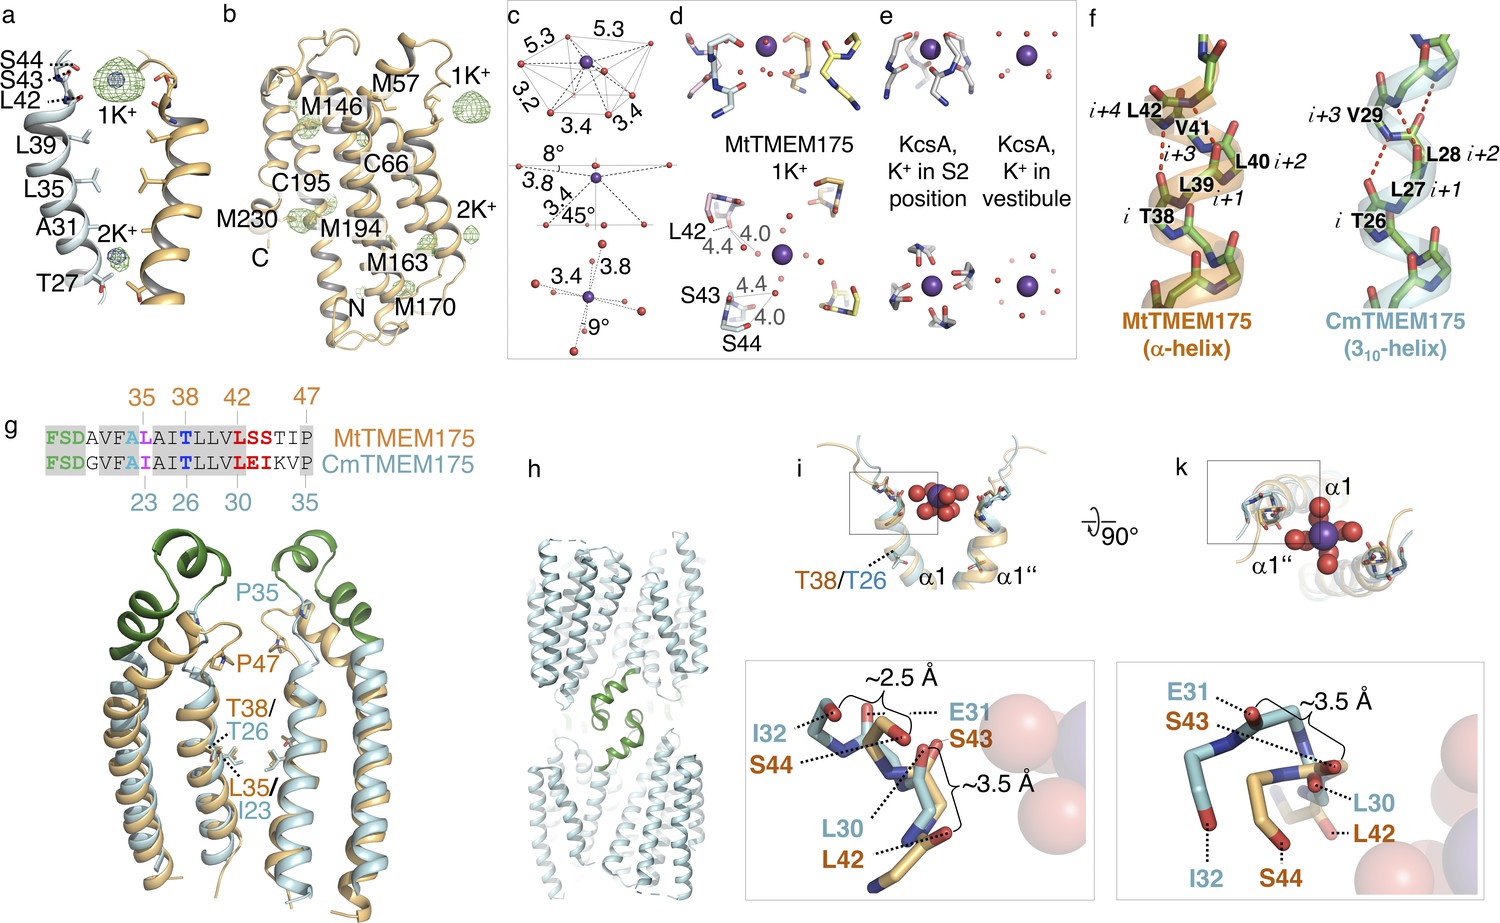
K+ coordination in MtTMEM175, 310-helix in CmTMEM175 and analysis of the ion binding site region in CmTMEM175.
(a–b) Anomalous difference electron density measured at 2.02460 Å in crystals of MtTMEM175. (a) Verification of K+ ions at positions 1K+ at the extracellular entrance and 2K+ within the pore close to the intracellular entrance. The anomalous difference density map at +3 σ is shown as green mesh (at 3.5 Å, blurred with b = 165). For comparison, the 2Fo-Fc electron density from the best dataset (at 2.4 Å, contoured at 1.8 σ, sharpened with b=-25) is illustrated as blue mesh at the respective positions of 1K+ and 2K+. In (b), all methionine and cysteine positions are shown. (c,d) Geometry and dimensions of the hydrated K+ in MtTMEM175. Angles and atom-to-atom distances are indicated in degrees (°) and Å, respectively. (e) Coordination of K+ in KcsA by backbone oxygens (left, 1K4C, S2 position) and geometry of a hydrated K+ ion in the KcsA vestibule in proximity to the selectivity filter (right, 1K4C). (f) Extracellular tips of helix one in CmTMEM175 (cyan) and MtTMEM175 (orange) shown as stick/cartoon representation. Only backbone atoms are displayed. In MtTMEM175 four residues complete a helical turn (alpha helical) while in CmTMEM175 three residues complete a helical turn (310-helix). (g,h) The loop following the 310-helix in CmTMEM175 is colored in green and participates in the formation of crystal contacts (h). Reference residues are displayed in a sequence alignment in (g). (i,k) Superposition of the extracellular ends of helix one in MtTMEM175 and CmTMEM175 with approximate deviations indicated in Å (side and top view of the ion binding site). Thr38 and Leu35 (MtTMEM175, orange) were aligned with corresponding Thr26 and Ile23 (CmTMEM175, cyan). Only main chain atoms are shown. The K+ hydrate from the MtTMEM175 structure is shown as spheres.
Figure 4 with 1 supplement
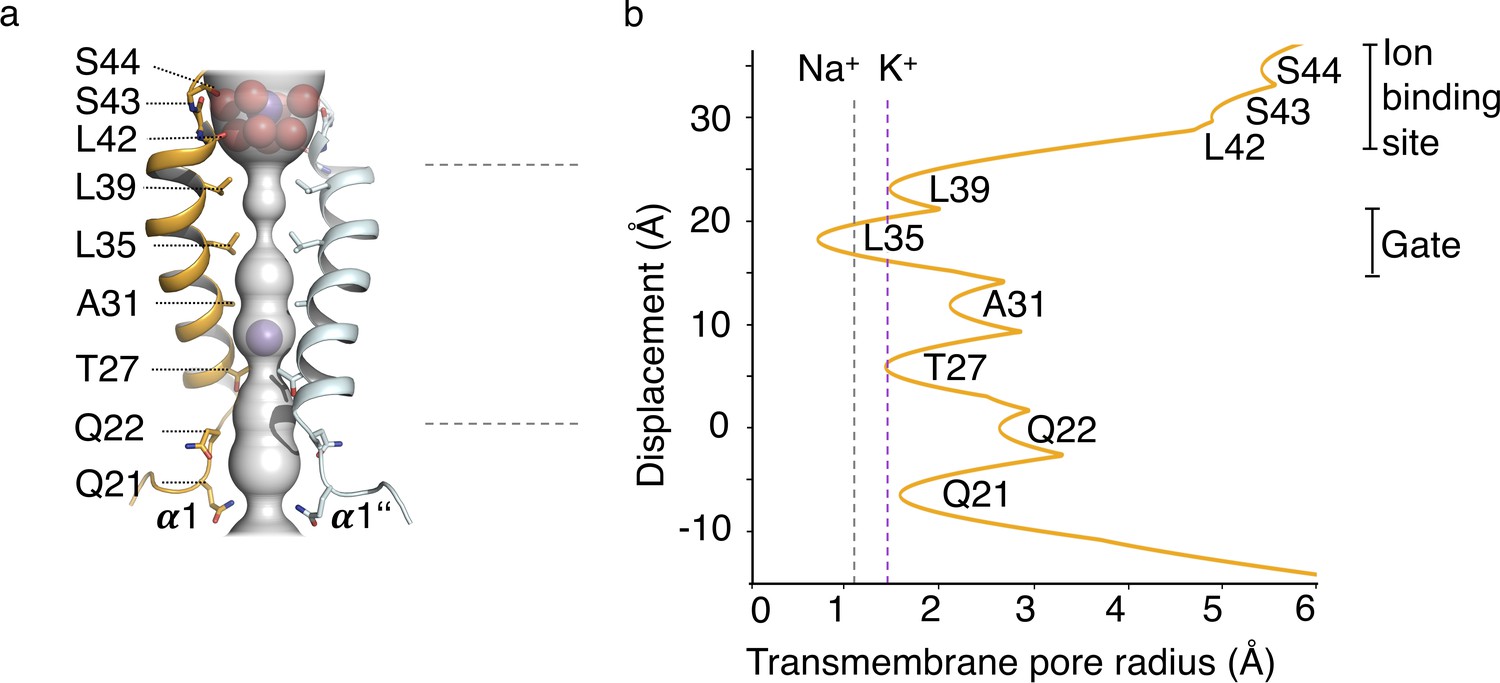
HOLE analysis.
(a) The ion conduction pathway is illustrated as grey surface and pore-lining residues are displayed. K+ ions and water molecules are shown as purple and red spheres, respectively. (b) The pore radius along the central axis is shown in Å. Dashed lines indicate the radii of K+ and Na+ ions without inner hydration shell.
Figure 4—figure supplement 1
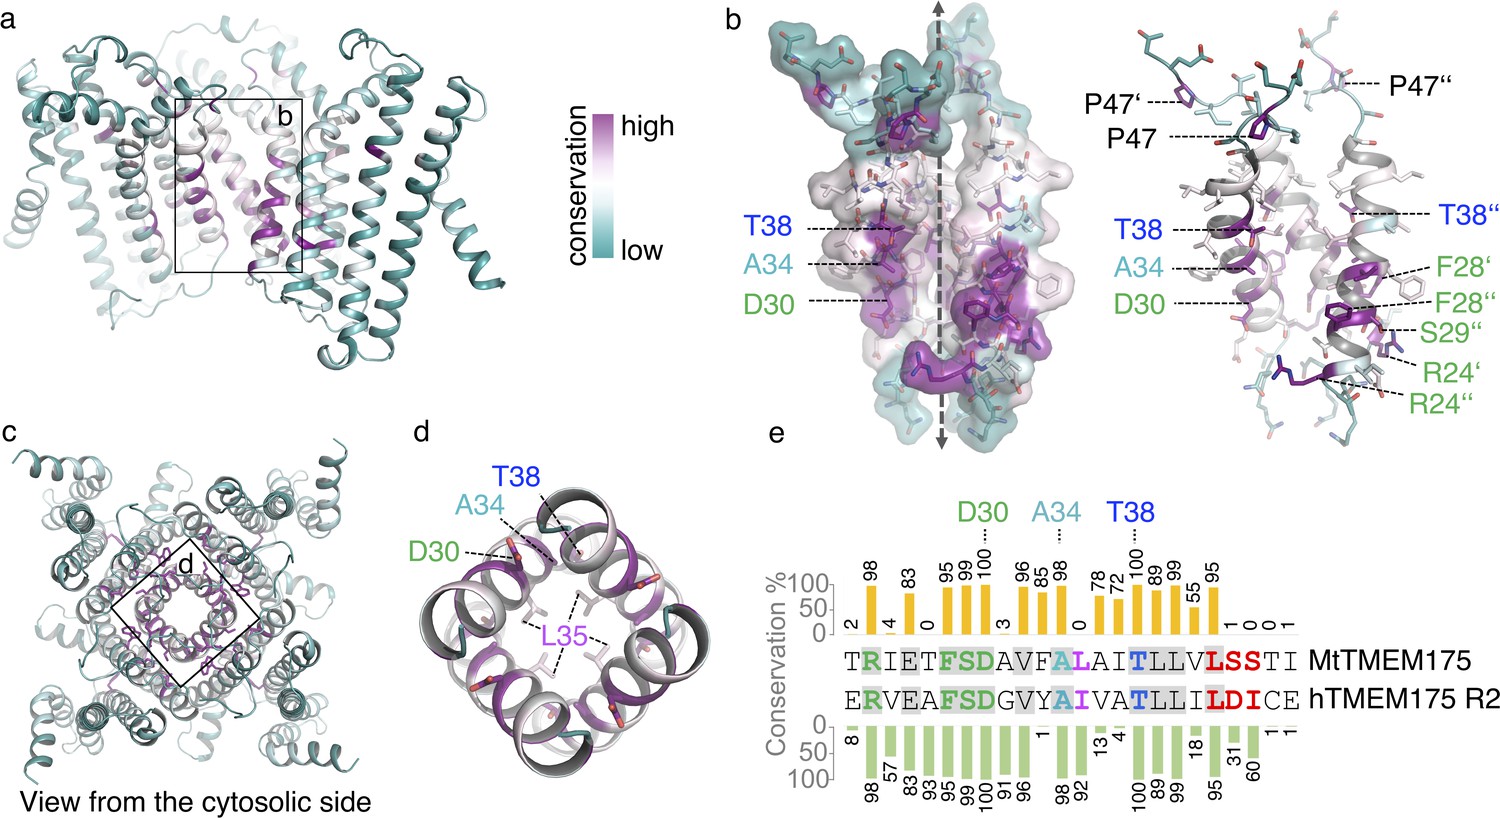
Conservation in TMEM175 proteins.
(a–d) Conservation in TMEM175 projected onto the structure of MtTMEM175 (using AL2CO). Highly conserved residues are indicated and labelled. In (a) and (b), a side view is shown and one subunit has been omitted for clarity. (c, d) View from the intracellular side into the pore. Key residues are shown and pore-lining Leu35 is displayed for orientation. (e) Sequence alignment of helix 1. A BLAST search within the prokaryotic phyla was done using the sequence of hTMEM175 as query and the first 100 hits were aligned against each other. The conservation between helix 1 of the bacterial homologs with helix 1 of MtTMEM175 (top sequence) and hTMEM175 (repeat 2, bottom sequence) is given in percent in a bar chart. Conserved residues between MtTMEM175 and hTMEM175 are marked in grey. Color coding in the alignment is as in Figure 1—figure supplement 1d.
Figure 5 with 1 supplement
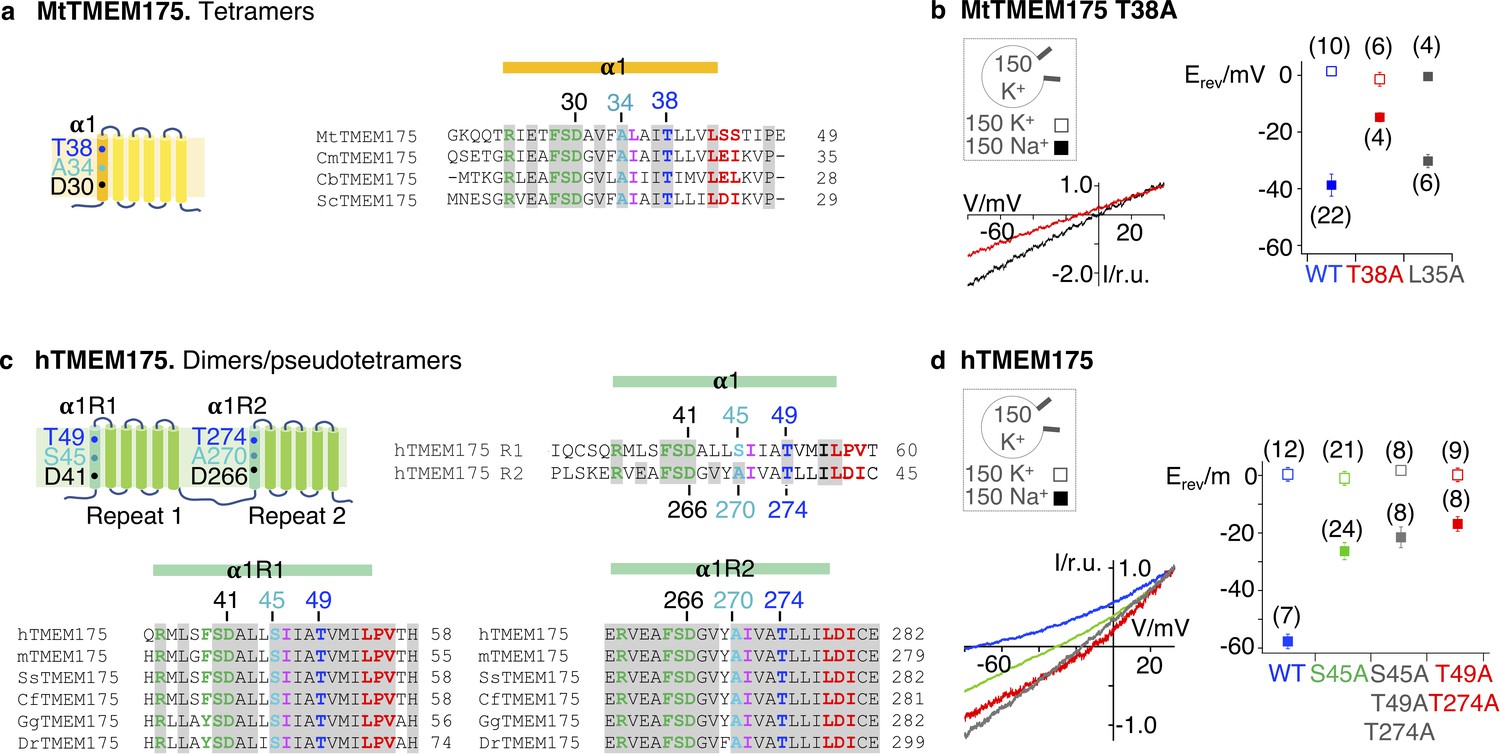
K+selectivity in TMEM175 proteins.
(a) Subunit organization of MtTMEM175 and alignment of bacterial sequences highlighting the most conserved residues in helix 1. (b) Lower left: representative currents elicited by a ramp protocol (−80 to +40 mV in 200 ms) from HEK293 cells transfected with the MtTMEM175 T38A in external solution with 150 mM K+ (black) or Na+ (red); currents normalized to values at +33 mV. Right: plot of the average reversal potentials (Erev ±s.d.) for T38A or L35A mutants in comparison to WT in symmetrical buffer with 150 mM K+ (□) or in external buffer with 150 mM Na+ (■). Number of patched cells in brackets. (c) Subunit organization of hTMEM175 and alignment highlighting conserved residues. m: mouse, Ss: Sus scrofa, Cf: Canis familiaris, Gg: Gallus gallus, Dr: Danio rerio (d) Lower left: representative currents elicited by a ramp protocol as in (a) from HEK293 cells transfected with hTMEM175 WT (blue) or mutants S45A (green), T49A/T274A (red) or S45A/T49A/T274A (grey) in external solution with 150 mM Na+; currents normalized to values at +33 mV. Right: plot of the respective average reversal potentials (Erev ±s.d.) for each construct in symmetrical buffer with 150 mM K+ (□) or in external buffer with 150 mM Na+ (■). Number of patched cells in brackets.
-
Figure 5—source data 1
Raw data for Figure 5b.
- https://cdn.elifesciences.org/articles/53683/elife-53683-fig5-data1-v3.xlsx
-
Figure 5—source data 2
Raw data for Figure 5d.
- https://cdn.elifesciences.org/articles/53683/elife-53683-fig5-data2-v3.xlsx
Figure 5—figure supplement 1
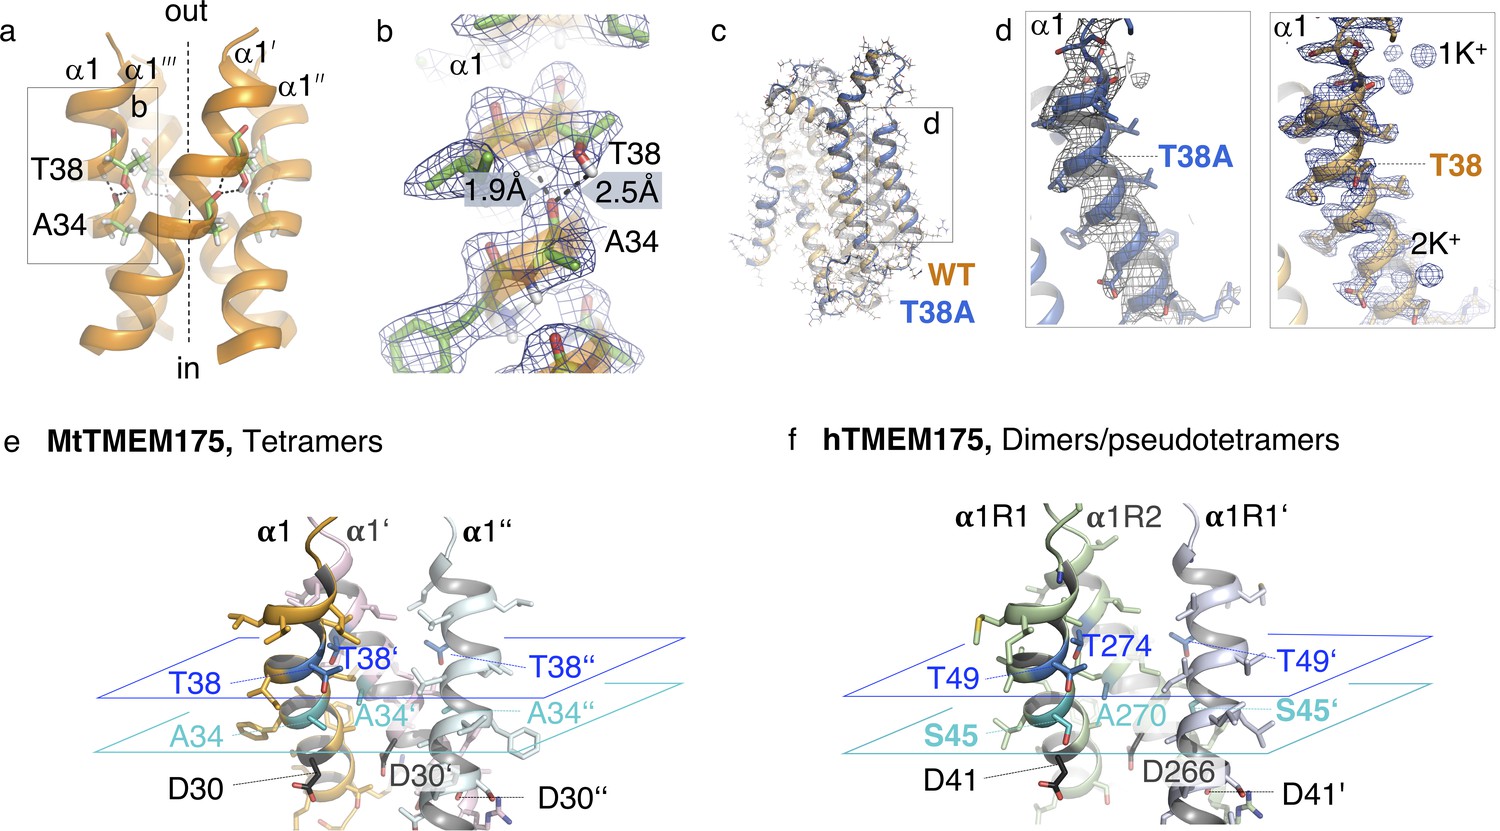
Threonine 38 in MtTMEM175, threonine and serine residues in the pore of MtTMEM175 and hTMEM175.
(a, b) Position of the highly conserved Thr38 in the tetramer. Side view on the pore-forming helices (a) and close-up view of the bifurcated hydrogen bond between Thr38 and Ala34 (b). The 2Fo-Fc density (at 2.4 Å, contoured at 1.8 σ after sharpening with b=-25, blue) is displayed. Distances between carbonyl oxygens and hydrogens are given in Å. (c, d) Overlay of mutant T38A and WT MtTMEM175 structures (c) and close-up view on helix 1 (d). Only one subunit is shown. Key residues Thr38/T38A are indicated. The 2Fo-Fc density of WT (as in b) and of the T38A mutant (at 3.4 Å, contoured at 1.3 σ, grey) are shown. (e, f), Layers comprising selectivity in MtTMEM175 (e) and hTMEM175 (f) with key residues colored in cyan and blue. Front subunit is omitted for clarity.
Figure 6 with 2 supplements

Sensitivity of the hTMEM175 S45A mutant for Zn2+ and 4-AP.
(a) Currents elicited by a ramp protocol (−80 to +40 mV in 200 ms) in HEK293 cells expressing hTMEM175 WT (upper left) or hTMEM175 S45A mutant (lower left) in absence (black) and presence (red) of 5 mM ZnSO4 in external bath solution (150 mM K+). Columns (lower right) summarize average inhibition (± s.d.) of current amplitudes at −60 mV from 3 and 4 recordings in the hTMEM175 WT and S45A mutant, respectively. The ratio of currents in the presence and absence of Zn2+ (I+Zn/I-Zn) show the voltage independence of channel block (upper right). (b), same as in (a) with representative measurements in absence (black) or presence (red) of 100 µM 4-AP in external bath solution (150 mM K+) for hTMEM175 WT (upper left) and S45A mutant (lower left), respectively. Columns show average inhibition (± s.d.) of current amplitudes at −60 mV from four measurements in the hTMEM175 S45A mutant and WT, respectively.
-
Figure 6—source data 1
Raw data for Figure 6a.
- https://cdn.elifesciences.org/articles/53683/elife-53683-fig6-data1-v3.xlsx
-
Figure 6—source data 2
Raw data for Figure 6b.
- https://cdn.elifesciences.org/articles/53683/elife-53683-fig6-data2-v3.xlsx
Figure 6—figure supplement 1
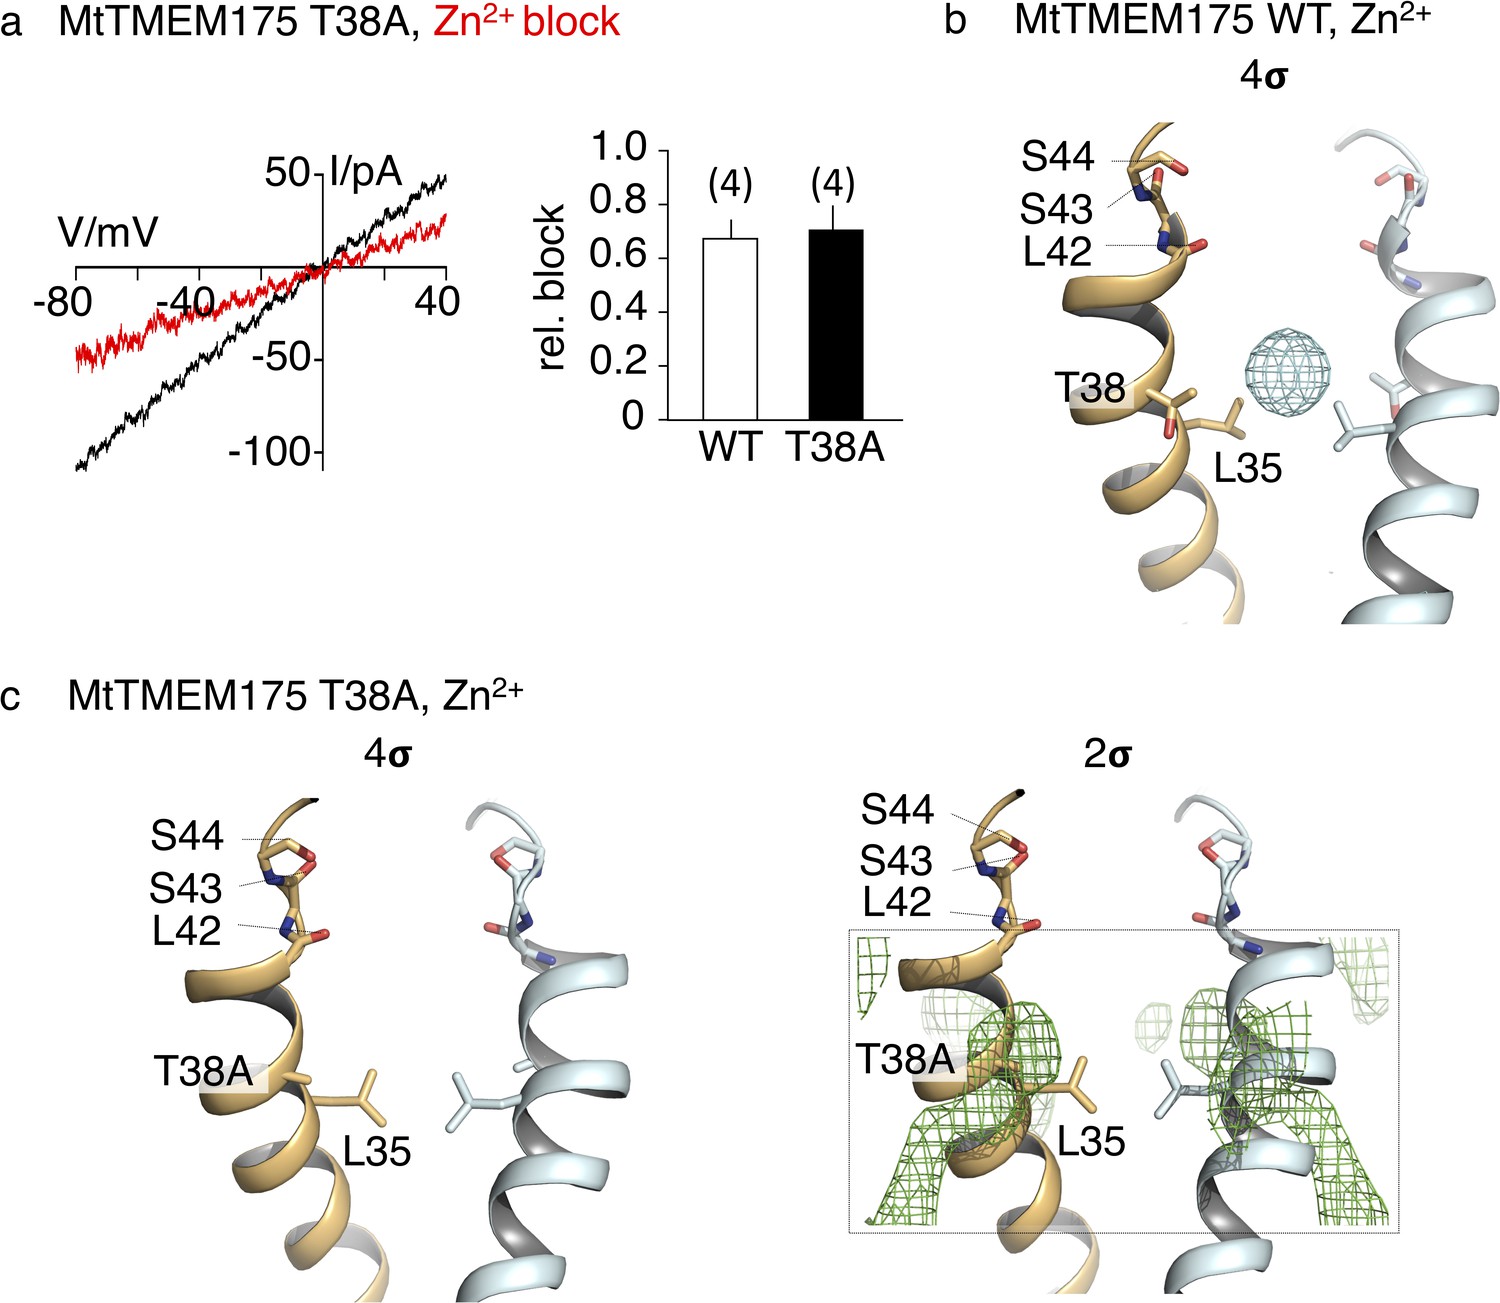
Sensitivity to Zn2+ and anomalous density of Zn in the pore of MtTMEM175.
(a) Representative currents elicited by a ramp protocol (−80 to +40 mV in 200 ms) in HEK293 cells transfected with the MtTMEM175 T38A mutant in absence (black) and presence (red) of 5 mM ZnSO4 in external bath solution containing 150 mM K+. Column summarizes average inhibition (± s.d.) of current amplitudes at −60 mV from four recordings in the MtTMEM175 T38A mutant and WT, respectively. (b) Location of zinc ions within the pore of MtTMEM175. Anomalous difference electron density of Zn2+ is illustrated as cyan mesh (at 2.88 Å, contoured at 4 σ, blurred with b = 200). Front and rear subunits are omitted for clarity. (c) No zinc ions can be detected in the T38A mutant of MtTMEM175 (Fo-Fc density at 3.2 Å, contoured at 4 σ (left) or at 2 σ (right), respectively, blurred with b = 200).
-
Figure 6—figure supplement 1—source data 1
Raw data for Figure 6—figure supplement 1.
- https://cdn.elifesciences.org/articles/53683/elife-53683-fig6-figsupp1-data1-v3.xlsx
Figure 6—figure supplement 2
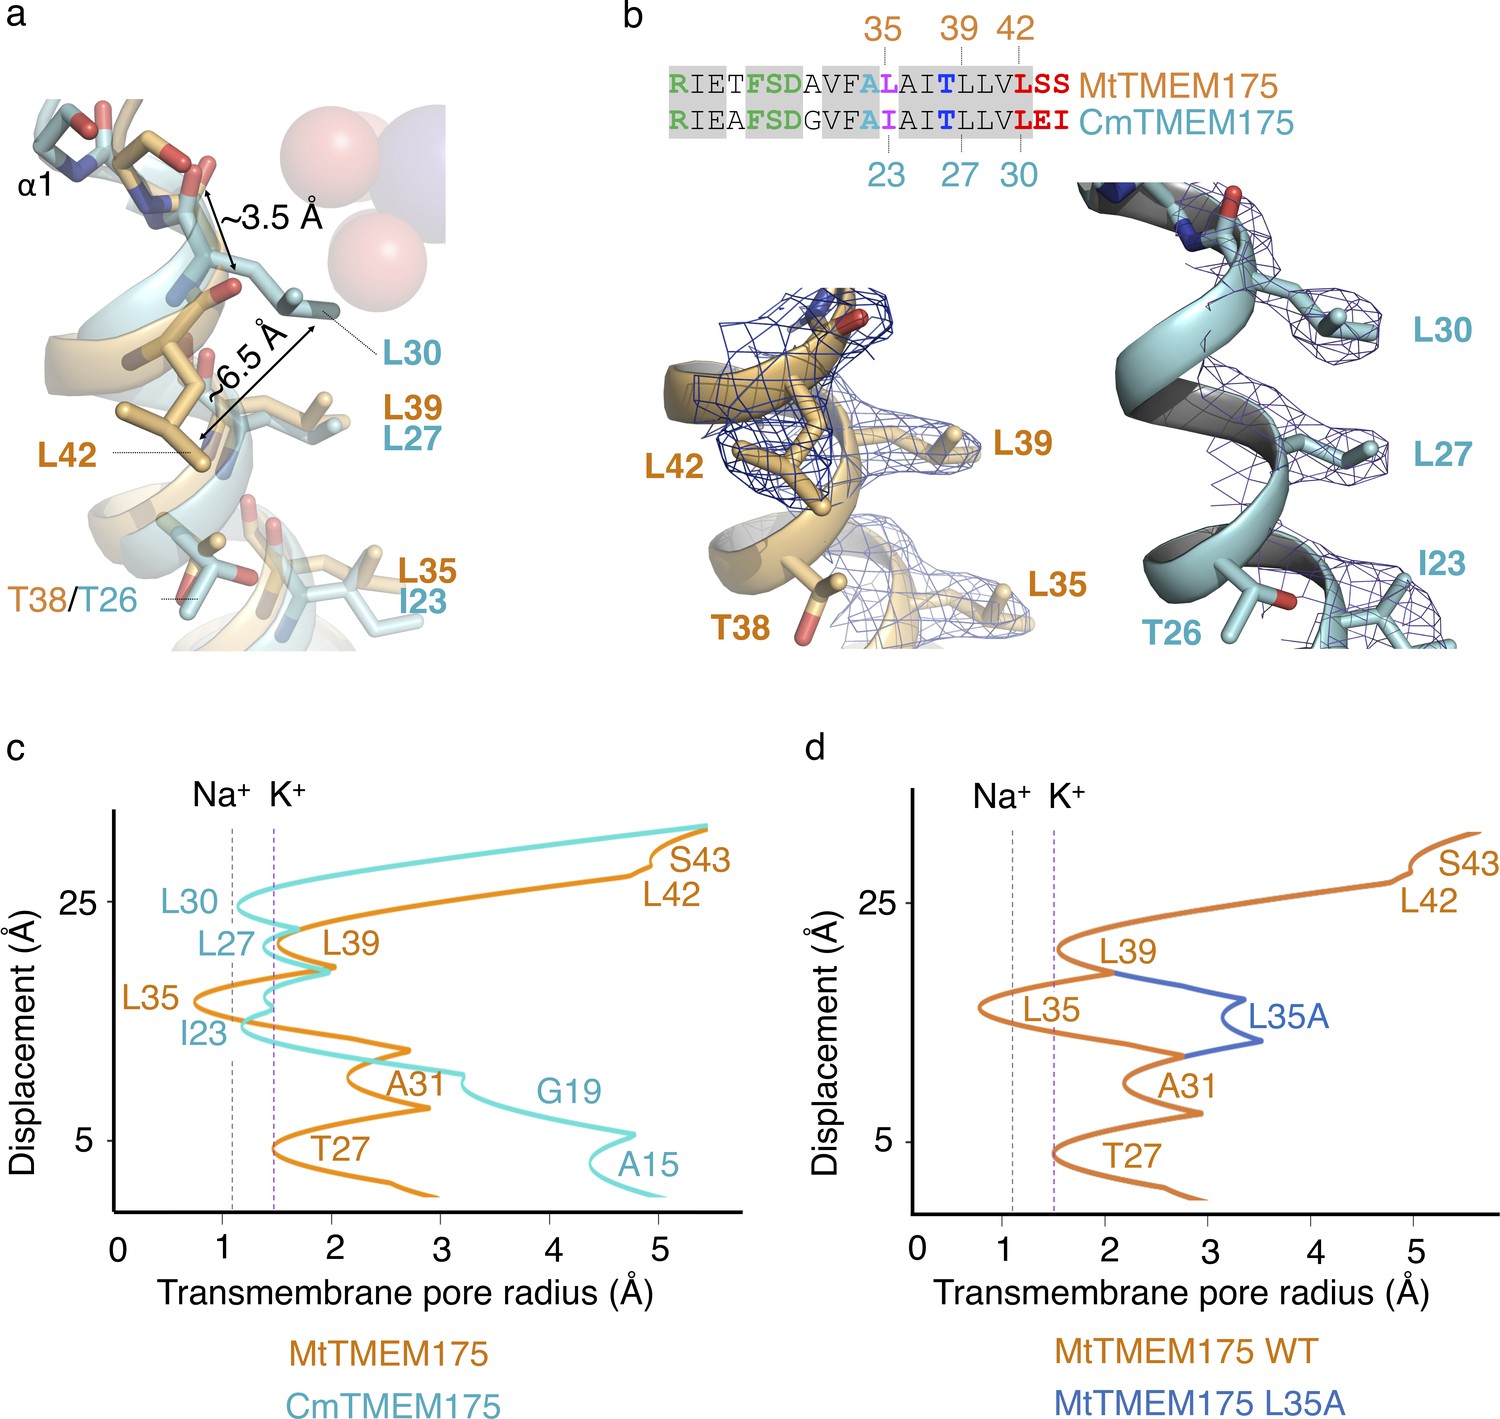
Constriction points in MtTMEM175 and CmTMEM175.
(a) Overlay of helix one from MtTMEM175 (orange) and CmTMEM175 (5VRE, cyan) with close-up view on residues Leu35, Leu39 and Leu42 in MtTMEM175 and Ile23, Leu27 and Leu30 in CmTMEM175, respectively. Deviations between the side chains and backbone oxygens of Leu42 in MtTMEM175 and Leu30 in CmTMEM175 are shown in Å. The view is from the side. (b) The corresponding 2Fo-Fc densities are shown for MtTMEM175 (left, at 2.4 Å, contoured at 1.8 σ after sharpening with b=-25) and CmTMEM175 (right, at 3.3 Å, contoured at 1.55 σ). A sequence alignment of helix one in MtTMEM175 and CmTMEM175 with the respective residues numbered is displayed. (c) Comparison of a HOLE analysis of the pore in MtTMEM175 and CmTMEM175. The pore radius along the central axis is shown in Å. Dashed lines indicate the radii for K+ and Na+ without inner hydration shell. The structures used in the HOLE analysis were aligned to superimpose Leu35 and Thr38 in MtTMEM175 with Ile23 and Thr26 in CmTMEM175. (d) HOLE calculation of MtTMEM175 WT and the mutant L35A. Leu35 corresponds to Ile23 in CmTMEM175. The pore radius along the central axis is shown in Å. Dashed lines indicate the radii for K+ and Na+ without inner hydration shell.
Figure 7
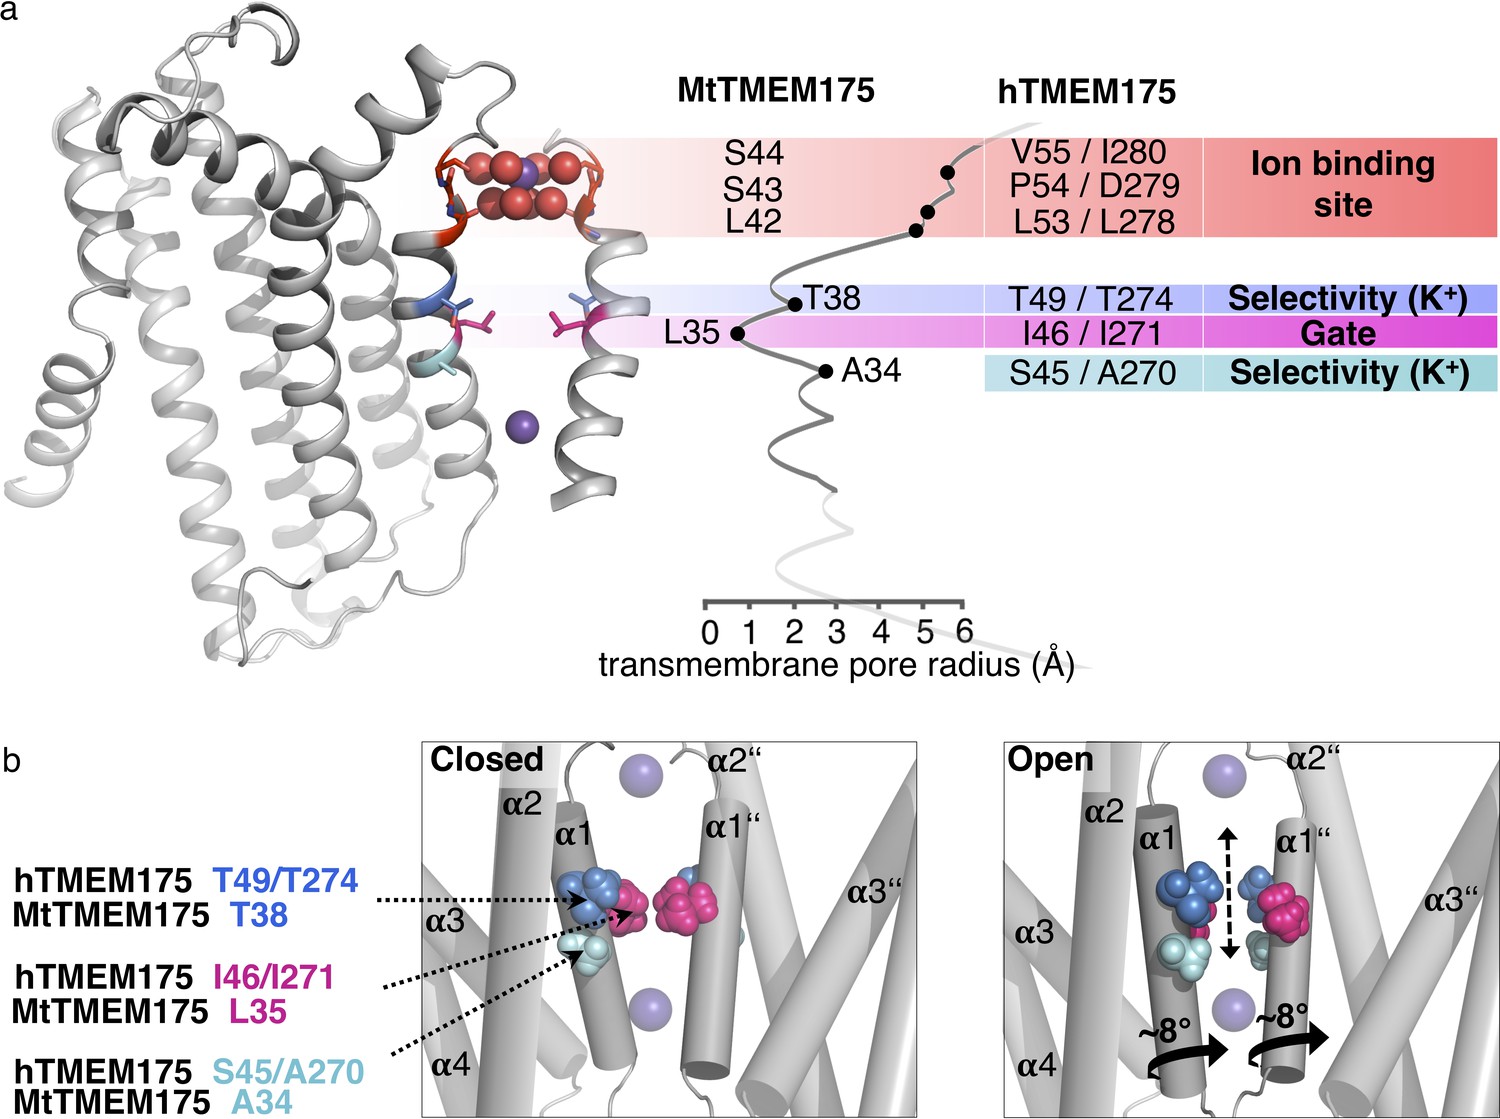
Functional layers and proposed mechanism for channel opening in TMEM175 channels.
(a) Functional layers in the MtTMEM175 pore. Two subunits are shown (right side only partly). Important residues in MtTMEM175 and hTMEM175 and for comparison the pore radius (in Å) are indicated. The ion binding site is shown in red, gate-residues in magenta and residues required for selectivity in blue and cyan. (b) Schematic side view of MtTMEM175 in closed (left) and proposed conductive state (right). Key residues on helix one are shown as spheres. Two subunits are omitted for clarity. K+ ions are shown as purple spheres. A clockwise rotation of helix 1 (viewed from intracellular) of 8–15° would widen the pore sufficiently for K+ ions to permeate (indicated by curved arrows in the bottom panel).
Tables
Key resources table
| Reagent type (species) or resource | Designation | Source or reference | Identifiers | Additional information |
|---|---|---|---|---|
| Gene (Marivirga tractuosa) | MtTMEM175 | DSM 4126 | E4TN31 | |
| Gene (Homo sapiens) | hTMEM175 | Sourcebioscience | Q9BSA9, IRAUp969F1019D | |
| Gene (Streptomyces collinus) | scTMEM175 | Synthesized by GenScript | S5VBU1 | |
| Recombinant DNA reagent | pBXC3H | Dutzler lab | Addgene # 47068 | |
| Recombinant DNA reagent | pcDXC3M | Dutzler lab | Addgene #49030 | |
| Recombinant DNA reagent | pcDXC3GMS | Dutzler lab | Addgene #49031 | |
| Recombinant DNA reagent | pBXNPHM3 | Dutzler lab | Addgene #110099 | |
| Cell line (Homo sapiens) | HEK293 | Germ. Collection Microorg. & cell cultures, Braunschweig, Germany | ACC 305, tested mycoplasma negative | |
| Strain, strain background (Escherichia coli) | MC1061 | Dutzler lab | Made by Malcolm Casadaban https://cgsc.biology.yale.edu/Strain.php?ID=11225 | |
| Commercial assay or kit | Superdex 200 10/300 | GE healthcare | Cat#17517501 | |
| Commercial assay or kit | Pierce Streptavidin Plus UltraLink resin | Thermo Fisher Scientific | Cat#53117 | |
| Commercial assay or kit | Ni-NTA resin | Qiagen | Cat#30230 | |
| Commercial assay or kit | Superdex 200 5/150 increase | GE healthcare | Cat#28990945 | |
| Commercial assay or kit | Strep-Tactin Superflow high capacity 50% suspension | Iba lifesciences | Cat#2-1208-010 | |
| Chemical compound, drug | cOmplete, EDTA-free Protease Inhibitor Cocktail | Roche | Cat#5056489001 | |
| Chemical compound, drug | n-dodecyl-β-d-maltopyranoside, Solgrade | Anatrace | Cat#D310S | |
| Chemical compound, drug | n-decyl-β-d-maltopyranoside, Solgrade | Anatrace | Cat#D322S | |
| Chemical compound, drug | Desthiobiotin | Iba lifesciences | Cat#2-1000-002 | |
| Chemical compound, drug | E. coli polar lipids | Avanti polar lipids | Cat#100600 | |
| Chemical compound, drug | Fugene | Promega | Cat#E2311 | |
| Chemical compound, drug | CellMask Deep Red | Thermo Fisher | Cat#C10046 | |
Chemical compound, drug | ER-tracker Blue-white DPX | Thermo Fisher | Cat#E12353 | |
| Chemical compound, drug | Accutase | Thermo Fischer | Cat#A1110501 | |
| Chemical compound, drug | Dulbecco’s modified Eagle’s medium | Sigma | Cat#D5671 | |
| Chemical compound, drug | L-Glutamine | Sigma | Cat#G7513 | |
| Chemical compound, drug | GeneJuice Transfection Reagent | Millipore Corp | Cat#70967-5 | |
| Chemical compound, drug | Fetal bovine serum (FBS) | Sigma | Cat#BCBV7601 and Cat#F7524 | |
| Other | EPC-9 Amplifier | Heka Electronics | ||
| Software, algorithm | Fiji | Schindelin et al., 2012 | http://imagej.net/Fiji | |
| Software, algorithm | PulseFit | Heka Electronics | ||
| Software, algorithm | PatchMaster V2x90,3 | Heka Electronics | ||
| Software, algorithm | FitMaster V2x90,1 | Heka Electronics | ||
| Software, algorithm | IGOR version 6.3.7.2 | WaveMetrics | ||
| Software, algorithm | JPCalcWin version 1.01 | https://medicalsciences.med.unsw.edu.au/research/research-services/ies/jpcalcwin |
Additional files
-
Supplementary file 1
Crystallographic data collection and refinement statistics.
The resolution cutoff was determined by CC1/2 criterion. For the native data set seven datasets from a single crystal were merged together. For the K+/S data set, two sets from a single crystal have been merged together. For the Cs+ dataset, three datasets from three crystals have been merged together. Six data sets from two crystals have been merged together for the Rb+ data set. For the Zn2+ data set, two data sets from two crystals have been merged together.
- https://cdn.elifesciences.org/articles/53683/elife-53683-supp1-v3.odt
-
Supplementary file 2
Crystallographic data collection and refinement statistics.
The resolution cutoff was determined by CC1/2 criterion. For the datasets of the T38A mutant and the T38A mutant soaked with Zn2+, four datasets from two crystals have been merged together each.
- https://cdn.elifesciences.org/articles/53683/elife-53683-supp2-v3.odt
-
Transparent reporting form
- https://cdn.elifesciences.org/articles/53683/elife-53683-transrepform-v3.docx
Download links
A two-part list of links to download the article, or parts of the article, in various formats.
Downloads (link to download the article as PDF)
Open citations (links to open the citations from this article in various online reference manager services)
Cite this article (links to download the citations from this article in formats compatible with various reference manager tools)
Structural basis for ion selectivity in TMEM175 K+ channels
eLife 9:e53683.
https://doi.org/10.7554/eLife.53683


