DASC, a sensitive classifier for measuring discrete early stages in clathrin-mediated endocytosis
- Lyda Hill Department of Bioinformatics, University of Texas Southwestern Medical Center, United States
- Department of Cell Biology, University of Texas Southwestern Medical Center, United States
Figures
Figure 1 with 1 supplement
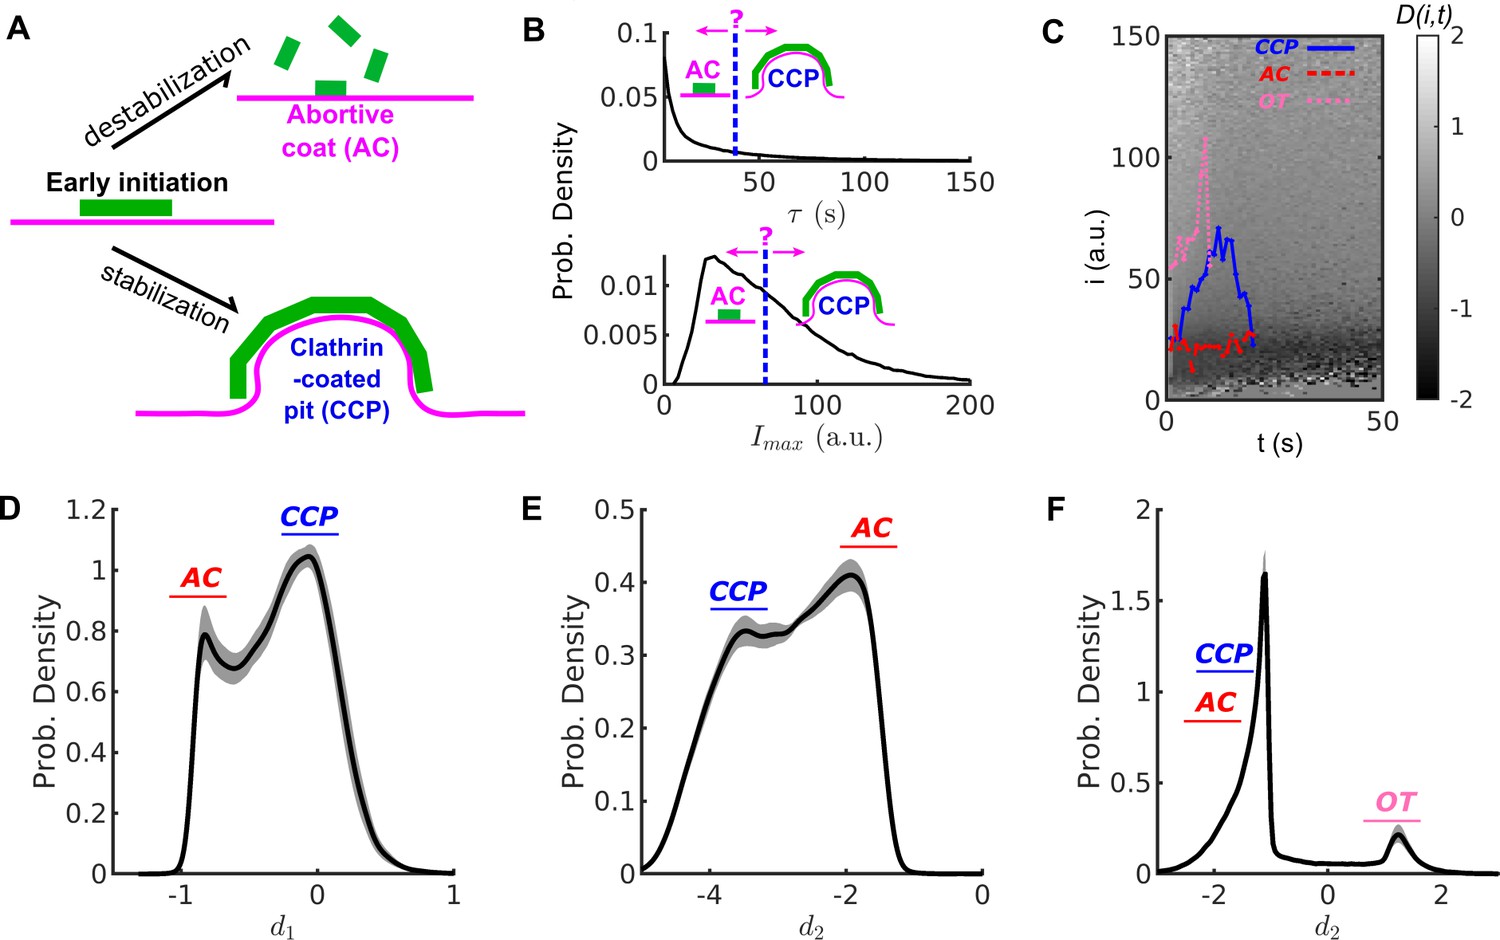
Conventional threshold-based cut-off vs. DAS derived metrics.
(A) Schematic of abortive coat (AC) and clathrin-coated pit (CCP) evolving from early clathrin nucleation. (B) Lifetime () and intensity maxima () characteristics of hypothetical ACs and CCPs. ACs are typically assigned by a user-defined lifetime or threshold. (C) Disassembly risk map represented on a gray value scale indicated by the gradient bar. A representative CCP (blue), AC (red) and outlier trace (OT) (pink) are plotted on the -map. (D) Distribution of counts of values for WT condition in black solid line. AC group near as a subpopulation, and CCP group at as another subpopulation. (E) Distribution of counts of values. Subpopulations of ACs and CCPs present in two modes. (F) Distribution of counts of values resolves the small subpopulation of OTs. Shaded area in (D–E) as 95% confidence intervals.
Figure 1—figure supplement 1

Fluctuation and heterogeneity in the intensity and traces.
(A) Ten randomly selected traces of eGFP-CLCa intensity at CSs in WT cells. (B) Ten randomly selected traces with the same lifetime seconds from the same cells as in (A). (C) values as time series read from the color map corresponding to the three traces in Fig. 1C in the main text. Color scheme: CCP (blue), AC (red) and OT (pink). (D) 20s cohort of CCP, AC and OTs. Same color scheme as in (C). High background (BG) in dashed line observed in OTs.
Figure 2 with 2 supplements
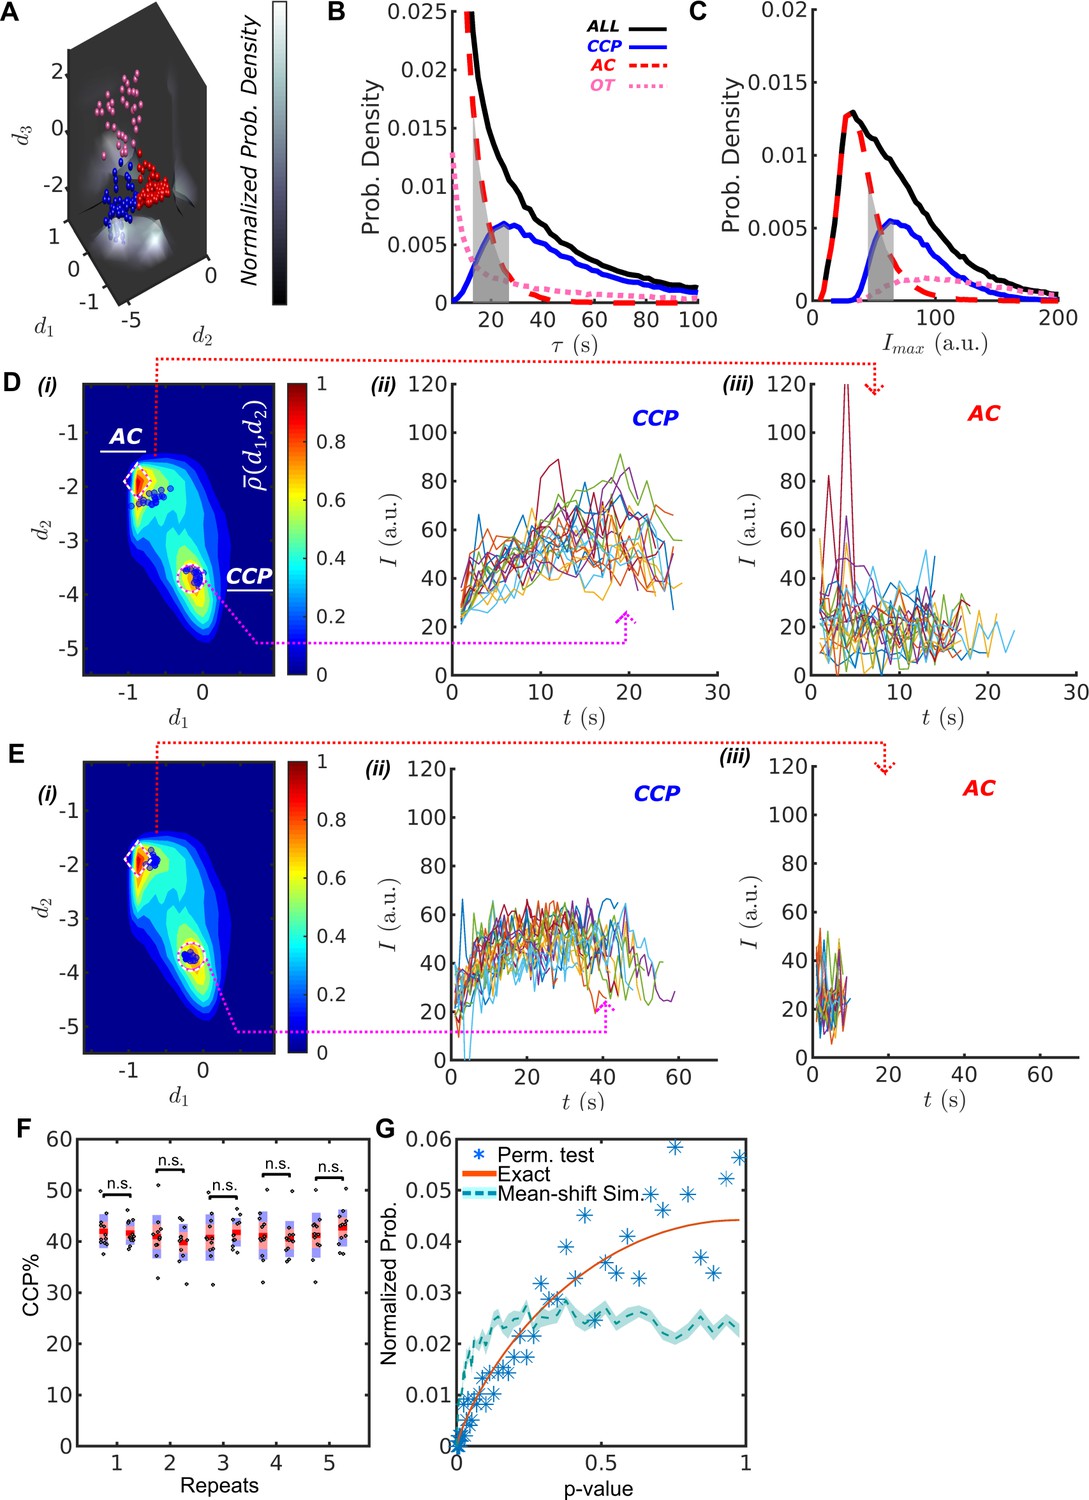
DASC resolves behaviorally distinct ACs and CCPs.
(A) k-medoid classification in three-dimensional feature space , where normalized probability densities , and are shown as three landscape plots. values are scaled according to gray bar. Examples of CCPs (blue), ACs (red) and OTs (pink) concentrate near the maxima of . (B) Lifetime distributions of all CCPs ( traces in blue/solid), ACs ( traces in red/dashed), OTs ( traces in pink/dotted) and all traces ( traces in black/solid). Gray region shows lifetime overlap between CCPs and ACs. (C) distributions and overlap. Color scheme same as in (B). Gray region shows overlap between CCPs and ACs. (D) i. DAS plot: contour map (values indicated by ‘rainbow’ color bar) with modes for CCPs and ACs indicated by circle and diamond, respectively. Ten representative CCPs and ACs (blue dots) from the lifetime overlap in (B) close to the modes are projected onto - coordinate. Traces of the representative CCPs (ii) and ACs (iii) from i. (E) Same as (D) for the representative CCPs and ACs from the overlap in (C). (F) Five repeats of comparing between 12 and another 12 movies of siControl cells imaged on the same day. A total of 24 movies were randomly shuffled to obtained 12-12 pairs. (G) Normalized probability of given p-values using Wilcoxon rank sum test. 1. Blue asters: 1000 repeats of the same shuffle in (F); 2. Red solid line: exact solution to 12-12 random sample test; 3. Light-blue dashed line: simulation of 1000 tests between 12 normally distributed random numbers (NRN) with mean and standard deviation and another 12 NRNs with and . Shaded area as 95% confidence interval obtained from 10 repeated simulations.
Figure 2—figure supplement 1

‘Elbow’ method for estimating optimal cluster number.
Total distance from all the traces to their belonging clusters’ centers are plotted for choosing cluster number in k-medoids clustering. The folloing cell types are tested: (i) H1299, (ii) A549, ARPE with (iii) CLCa labeled by mRuby and (iv) α subunit labeled by eGFP, (v) HPV-RPE, and (vi) SKML.
Figure 2—figure supplement 2
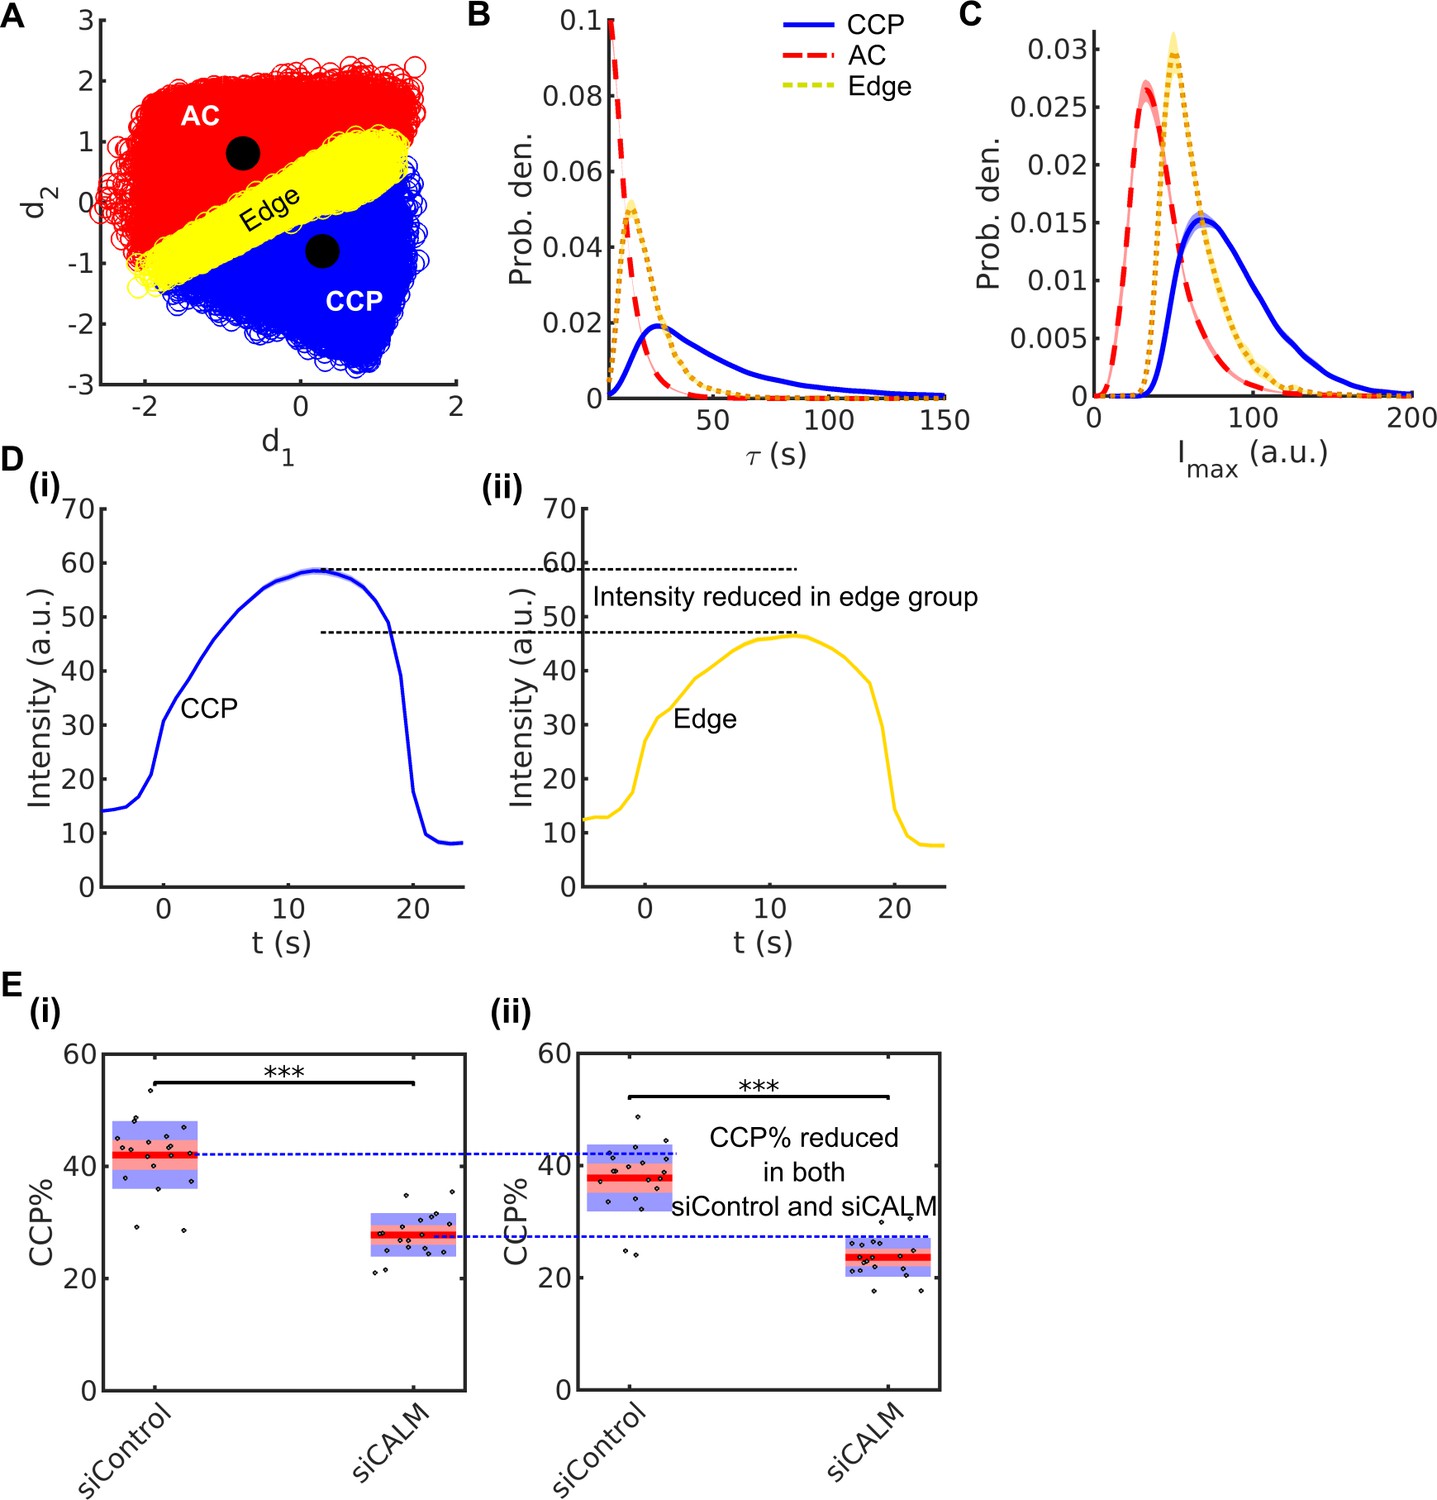
Ambiguity of traces at the hard boundary between AC and CCP populations generated by k-medoids clustering.
(A) All CCPs (blue) and ACs (red) projected in d1-d2 space. Yellow circles represent ‘edge’ traces that fall between the centers of CCP and AC clusters. (B) Lifetime distribution and (C) maximal intensity distribution of AC, CCP and edge traces. (D) 20 second cohorts of (i) CCP and (ii) edge traces. (E) Phenotype of siCALM in CCP% evaluated with (i) and without (ii) edge traces.
Figure 3 with 3 supplements
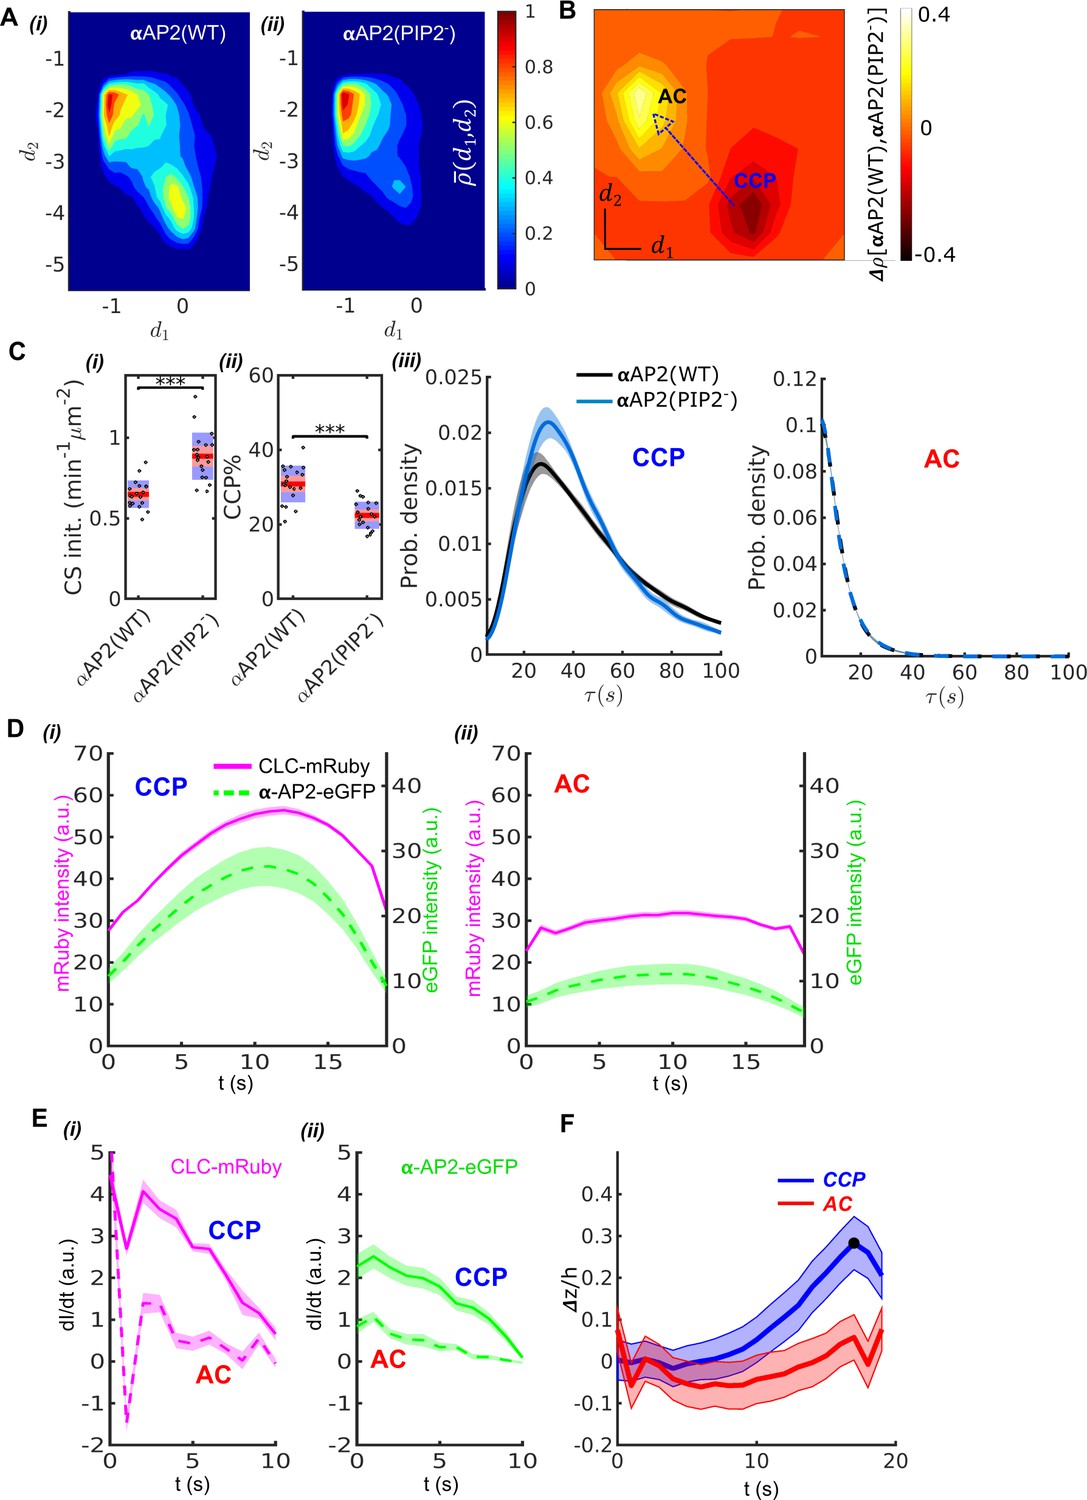
Validation of DASC.
(A) DAS plots showing contour as ‘rainbow’ color map and color bar for αAP2(WT) cells (i) and αAP2(PIP2-) cells (ii). (B) DAS difference plot (difference in distribution) of αAP2(PIP2-) minus αAP2(WT) cells as contour in ‘heat’ map. (C) Comparison of DASC-derived metrics for CCP dynamics in αAP2(WT) vs αAP2(PIP2-) cells, (i) CS initiation rate and (ii) CCP% in αAP2(WT) and αAP2(PIP2-) cells. Dots represent jittered raw data from individual movies, box plots show mean as red line and 95% and 1 standard deviation as red and blue blocks, respectively (see Materials and methods). (iii) CCP lifetime distribution of αAP2(WT) vs αAP2(PIP2-) cells. (iv) distribution of ACs in αAP2(WT) vs αAP2(PIP2-) cells. (D) 20 second cohorts from dual channel movies of CLC-mRuby (magenta, solid) and α-AP2-eGFP (green, dashed) for CCPs (i) and ACs (ii). (E) Time derivative of CLC-mRuby (i) and α-AP2-eGFP (ii) intensities for the first 10 seconds in the dual channel cohorts of CCPs and ACs in (D). (F) Time course of invagination depth (TIRF characteristic depth ) for CCPs (blue) and ACs (red) measured by Epi-TIRF. Statistical analysis of the data used the Wilcoxon rank sum test. *** p-value < 0.001, ** p-value < 0.01, * p-value < 0.05, n.s. (non-significant) p-value > 0.05. Shaded area indicates 95% confidence interval for all plots.
Figure 3—figure supplement 1
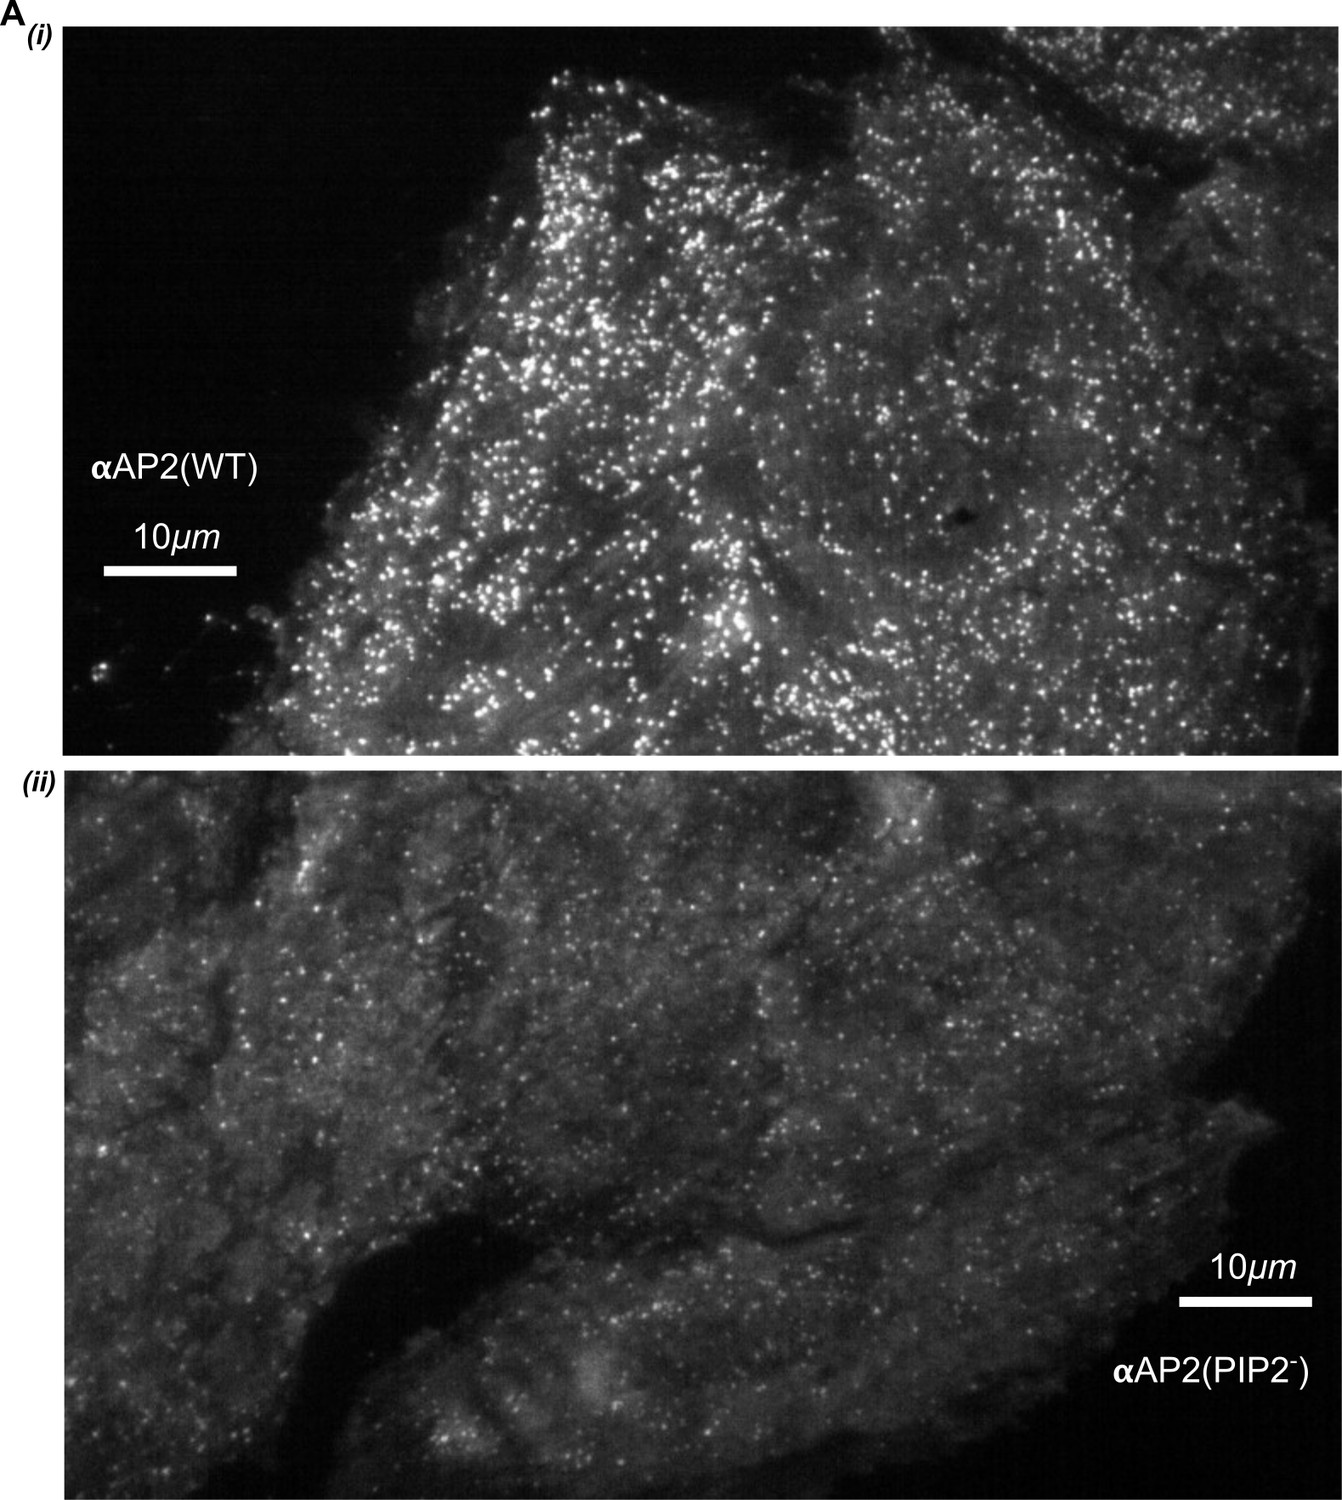
Single frame from movies of αAP2(WT) and αAP2(PIP2-) cells.
Note that CCPs in the αAP2(PIP2-) cells are much dimmer potentially altering the ability to detect valid CS initiation events.
Figure 3—figure supplement 2
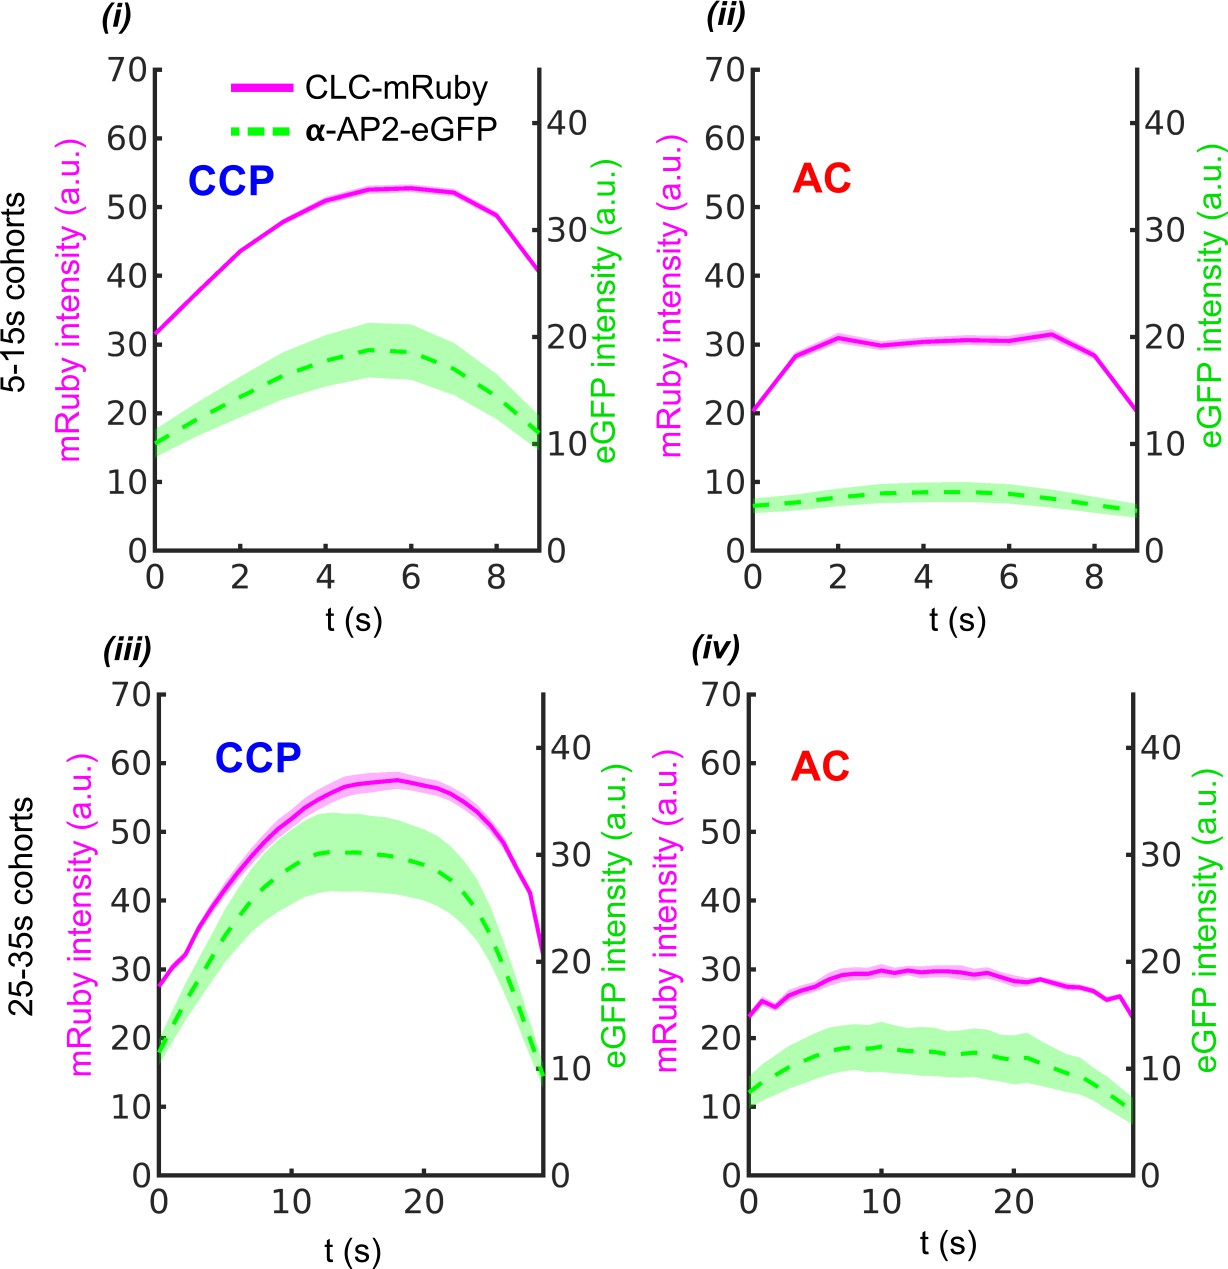
10 s (i–ii) and 30 s (iii-iv) cohorts of CCPs and ACs obtained from CLC-mRuby and α-AP2-eGFP movies.
Figure 3—figure supplement 3
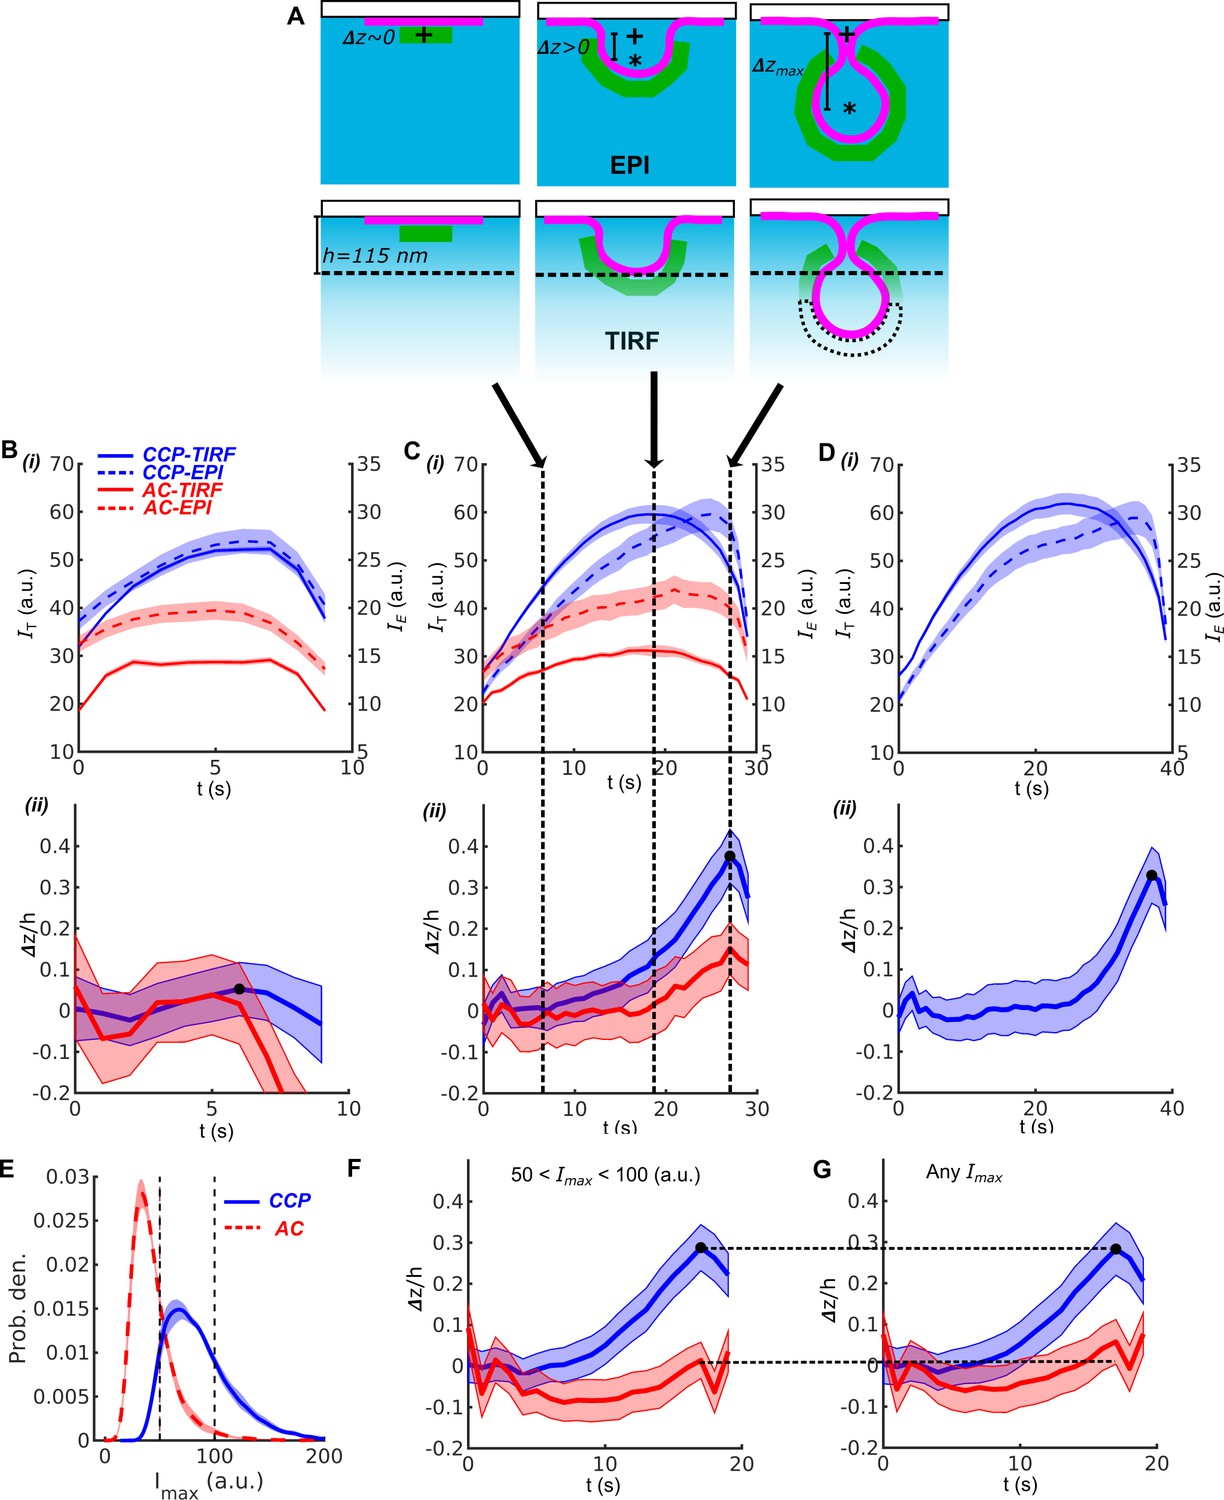
DASC combined with EPI-TIRF approach reveals CME invagination kinetics.
(A) Schematic of CCP in EPI and TIRF microscopy at 0, intermediate and maximal invagination depth (). ‘+’ as starting point and ‘*’ as center of mass of CCP during invagination. TIRF characteristic depth . (B) i. 10s cohorts of CCPs (blue) and ACs (red) in TIRF channel (solid lines) and EPI (dashed lines). ii. time course of CCPs (blue) and ACs (red) derived from EPI-TIRF cohorts in i, indicated as dark dot. (C) i-ii Same as (B) for 30s cohorts and . (D) i-ii Same as (B) for 40s cohort and but without ACs, which are extremely rare in the 40s cohort (Fig. 2B). (E) Maximum intensity distribution of CCPs (blue) and ACs (red). Dashed lines indicate . (F) time course of the subset of CCPs (blue) and ACs (red) exhibiting . (G) Same as (F) but for all CCPs and ACs. Shaded area as 95% confidence interval (Materials and methods).
Figure 4 with 1 supplement
Stage specific phenotypes detected by DASC compared to transferrin uptake measurement.
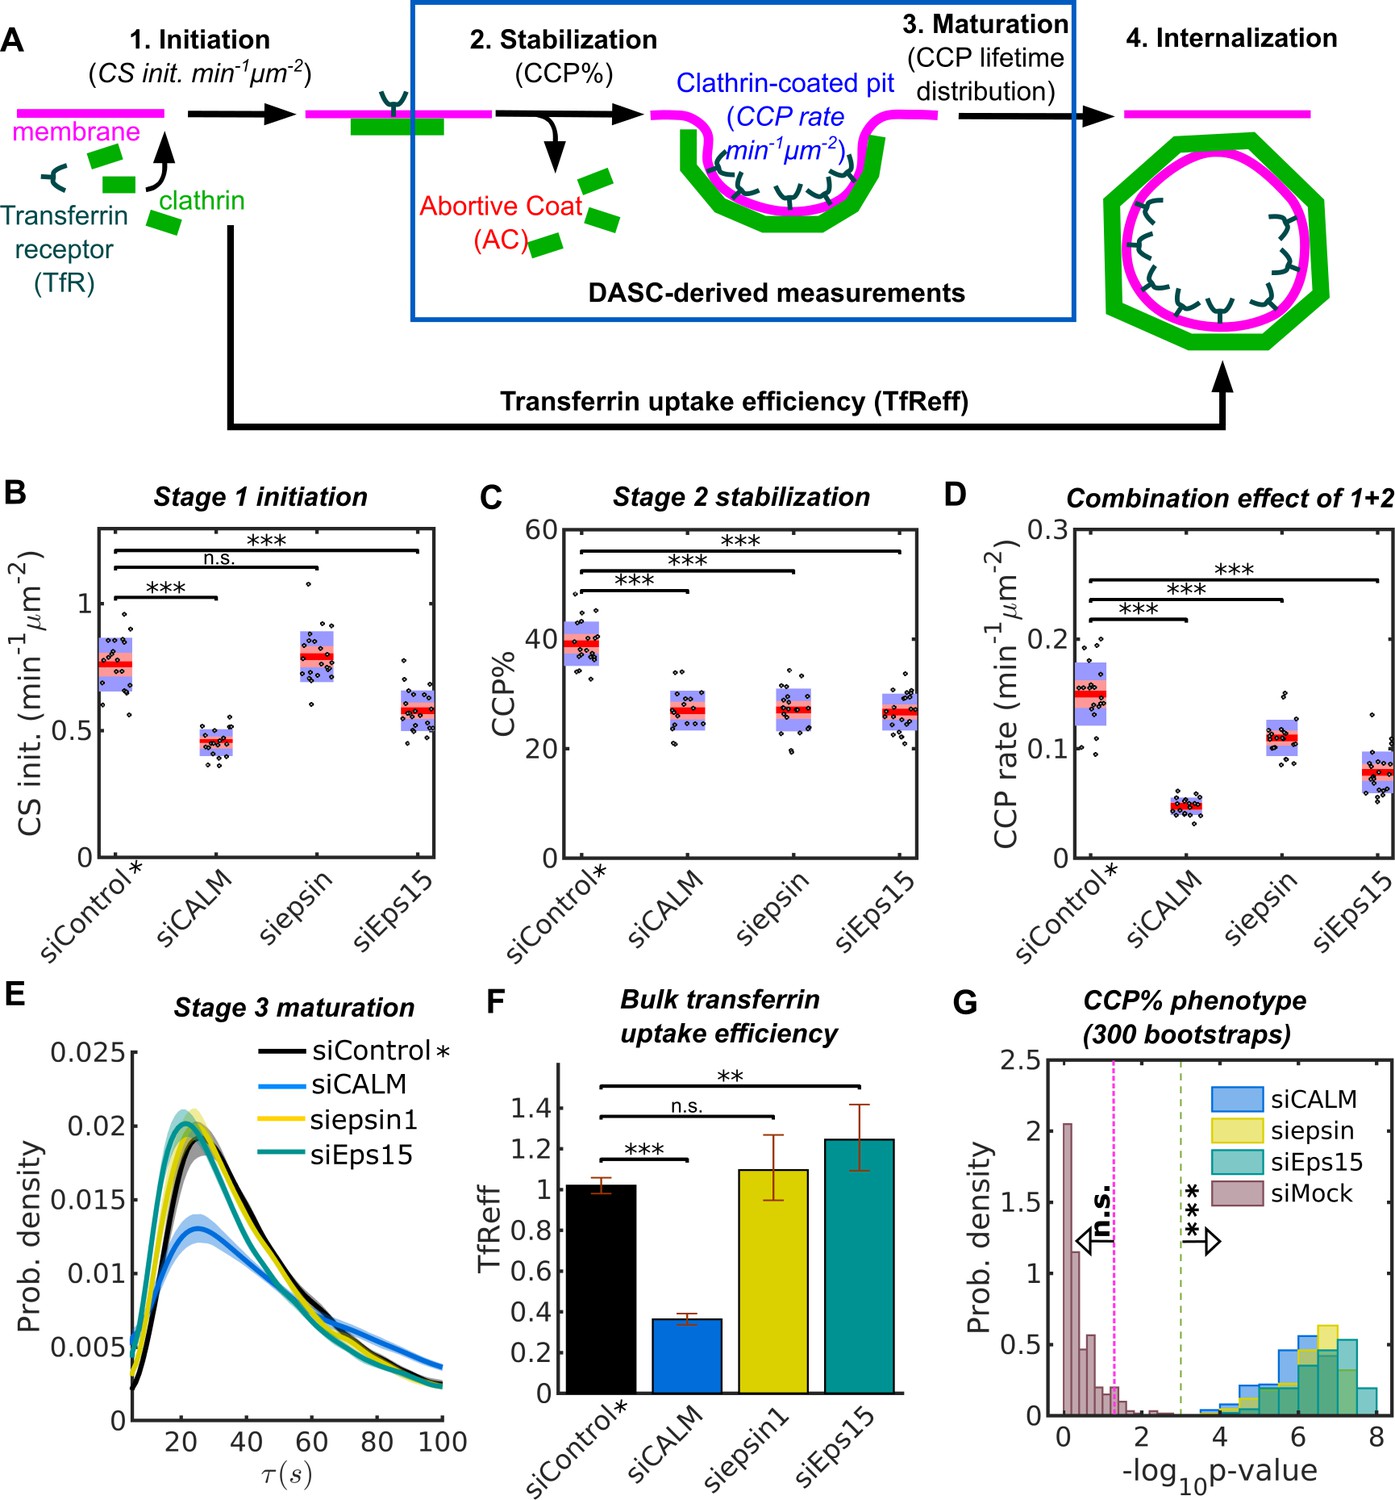
(A) Schematic of 4 stages of CME: CS initiation, CCP stabilization, CCP maturation and CCV internalization. Stage 1-3 are quantified by CS initiation rate (CS init. in min−1μm−2), CCP% and CCP lifetime distribution. Bulk assays for transferrin receptor uptake (TfReff) measure CCV formation are not stage specific. CCP rate (min−1μm−2) measures the combination of initiation and stabilization. Effects of siRNA knockdown of CALM, epsin1 and Eps15 on (B) CS initiation rate, (C) CCP%, (D) CCP rate, (E) CCP lifetime distribution and (F) TfReff (internalized over surface bound transferrin receptors, error bars as 95% confidence interval and statistical significance explained in Materials and methods). 20 bootstrapped siControl movies from all experimental days as siControl* are compared to the specific siRNA conditions to obtained the DASC determined phenotypes in (B–D). (G) Probability distribution of of CCP% for 300 bootstraps. The 3 conditions in (B–D) plus siMock (20 more of bootstrapped siControl movies) are shown. Veridical lines indicates location of n.s. () and *** () significance. See details on data pooling in Materials and methods.
Figure 4—figure supplement 1
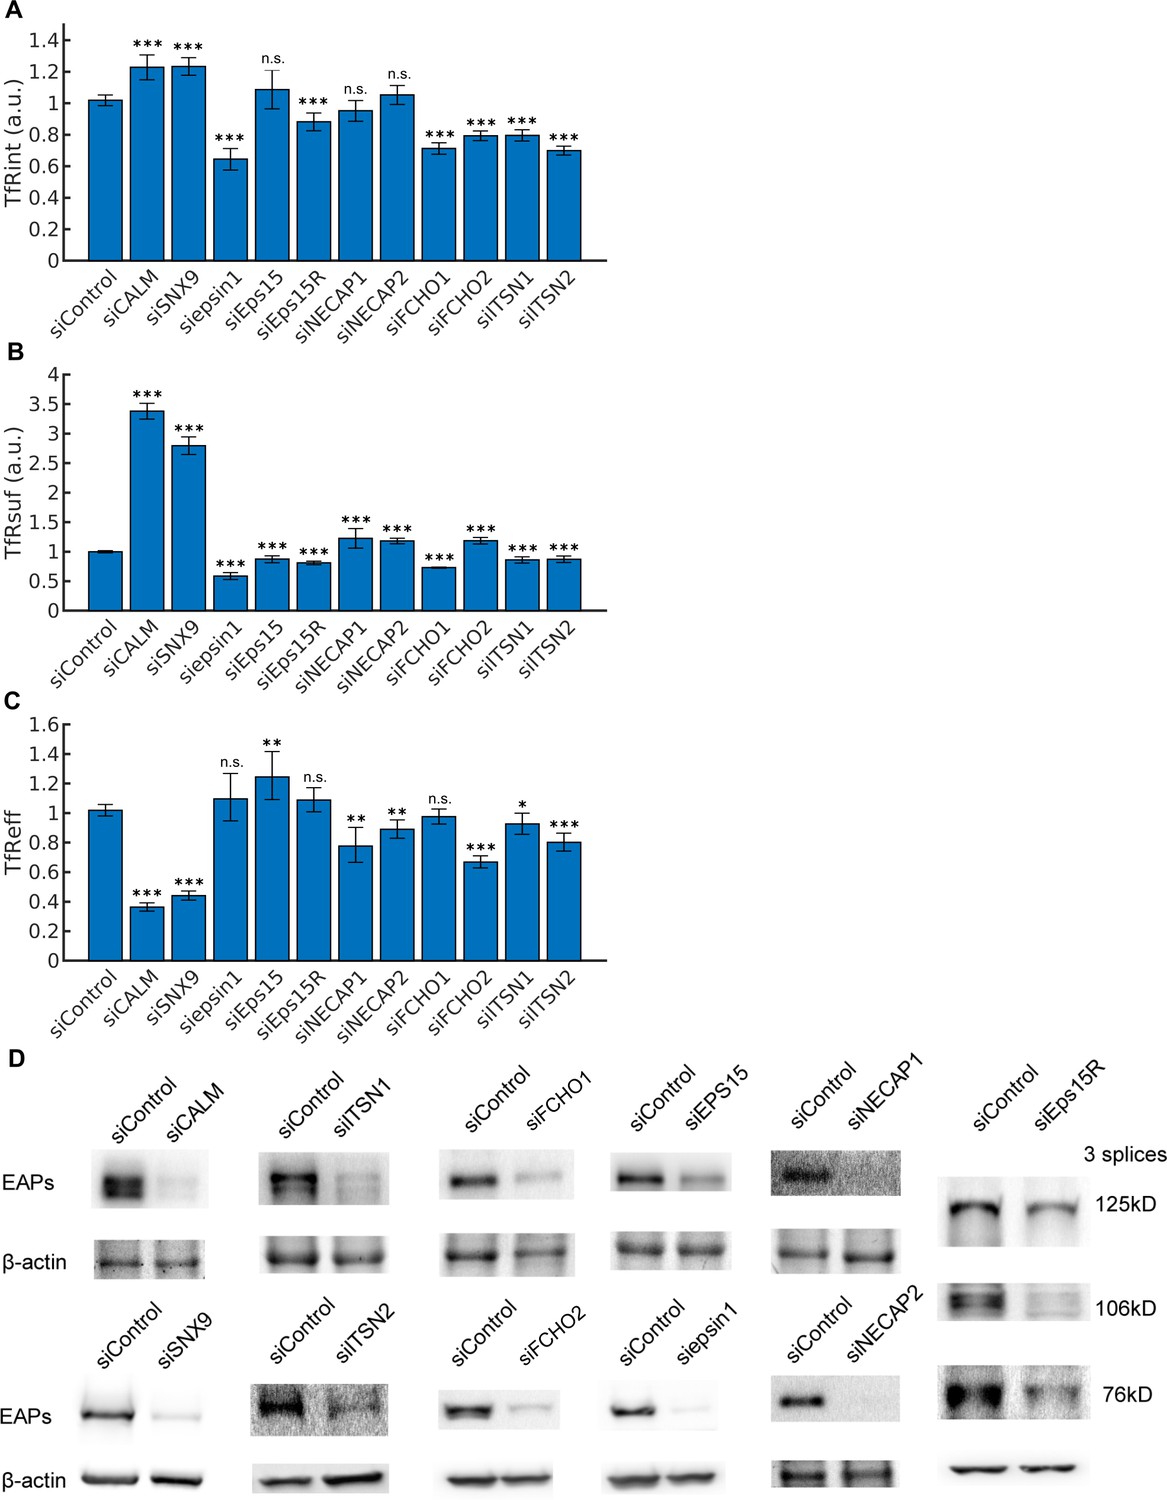
Measurements of transferrin receptor uptake and siRNA knockdown efficiency.
(A) Internalized transferrin receptors (TfRint) after 10 min in arbitrary unit (a.u.) after normalization to control. (B) Surface bound transferrin receptors (TfRsuf) (a.u.) after normalization to control. (C) Efficiency of transferrin receptor uptake (TfReff) as ratio of TfRint over TfRsuf after normalization to control. Error bars represent 95% confidence intervals. Statistical significance of TfRint and TfRsuf are obtained using 2-sample t-test. A statistical test for ratios is applied to calculate the significance of TfReff, see Materials and methods. (D) Representative KD efficiency of 11 EAPs shown by western blots.
Figure 5 with 1 supplement
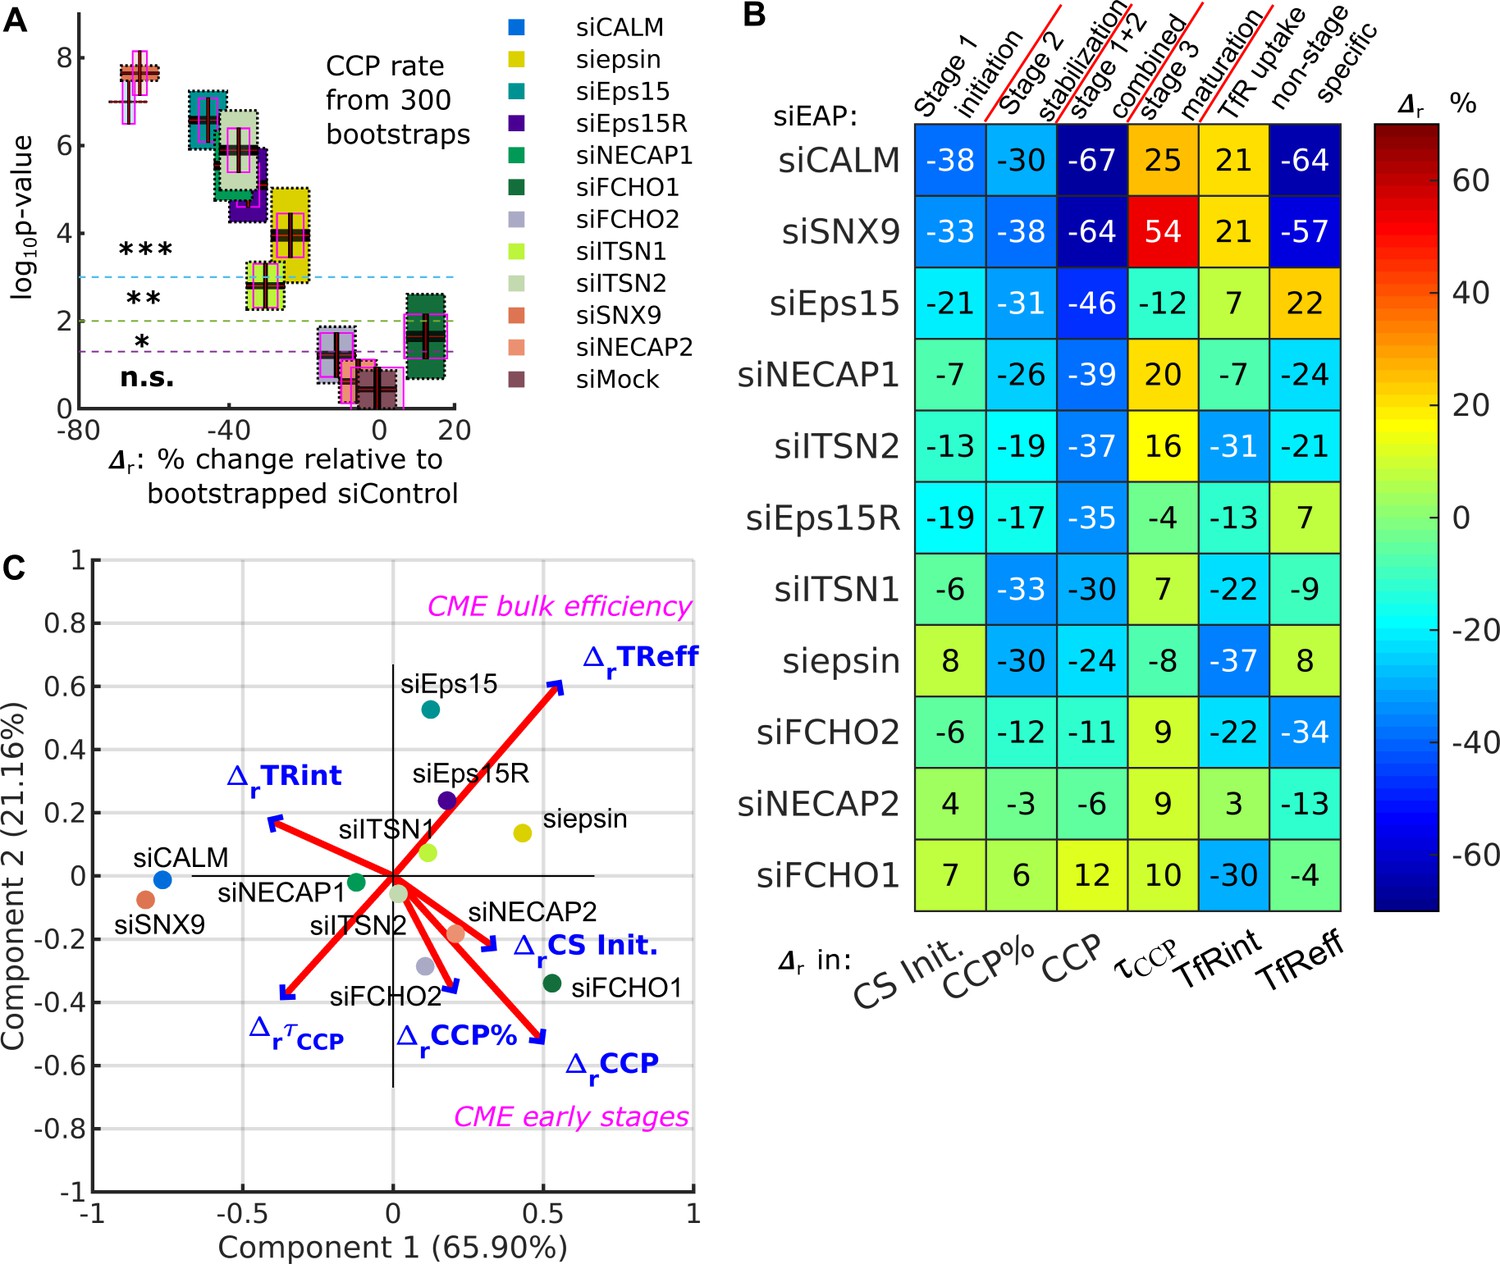
DASC is a sensitive measure of stage-specific defects in CME not detected by bulk measurement of transferrin uptake.
(A) (percentage difference) and p-values in CCP rate by comparing 11 EAP KD conditions plus siMock (Fig. 4G) to bootstrapped siControl*. Both quantities are obtained 300 times through bootstrapping. Colored boxes with black dotted edges, correspond to the p-values in the vertical axis; boxes outlined by magenta edges, correspond to values in the horizontal axis. Red lines represent means ( and ) the black regions represent 95% confidence intervals and 1 standard deviations as colored blocks of the 300 bootstrap results. Legend shows the color for each condition. Significance level is indicated by the dashed horizontal lines. (B) Summary of phenotypes of the 11 conditions evaluated by the in CS initiation rate (CS init.), CCP%, CCP rate, and CCP median lifetime (τCCP), and in transferrin receptor uptake: internalized and efficiency (TfRint and TfReff) relative to control. EAP KD sorted from low CCP rate to high. (C) Principle component analysis (PCA). Projection of 6 variable values from 11 conditions in (B) into principle component space. First and second component (Component 1 and 2) account for 65.90% and 21.16% of total variance, respectively. Projection of original variable axes presented as red vectors with blue arrows.
Figure 5—figure supplement 1
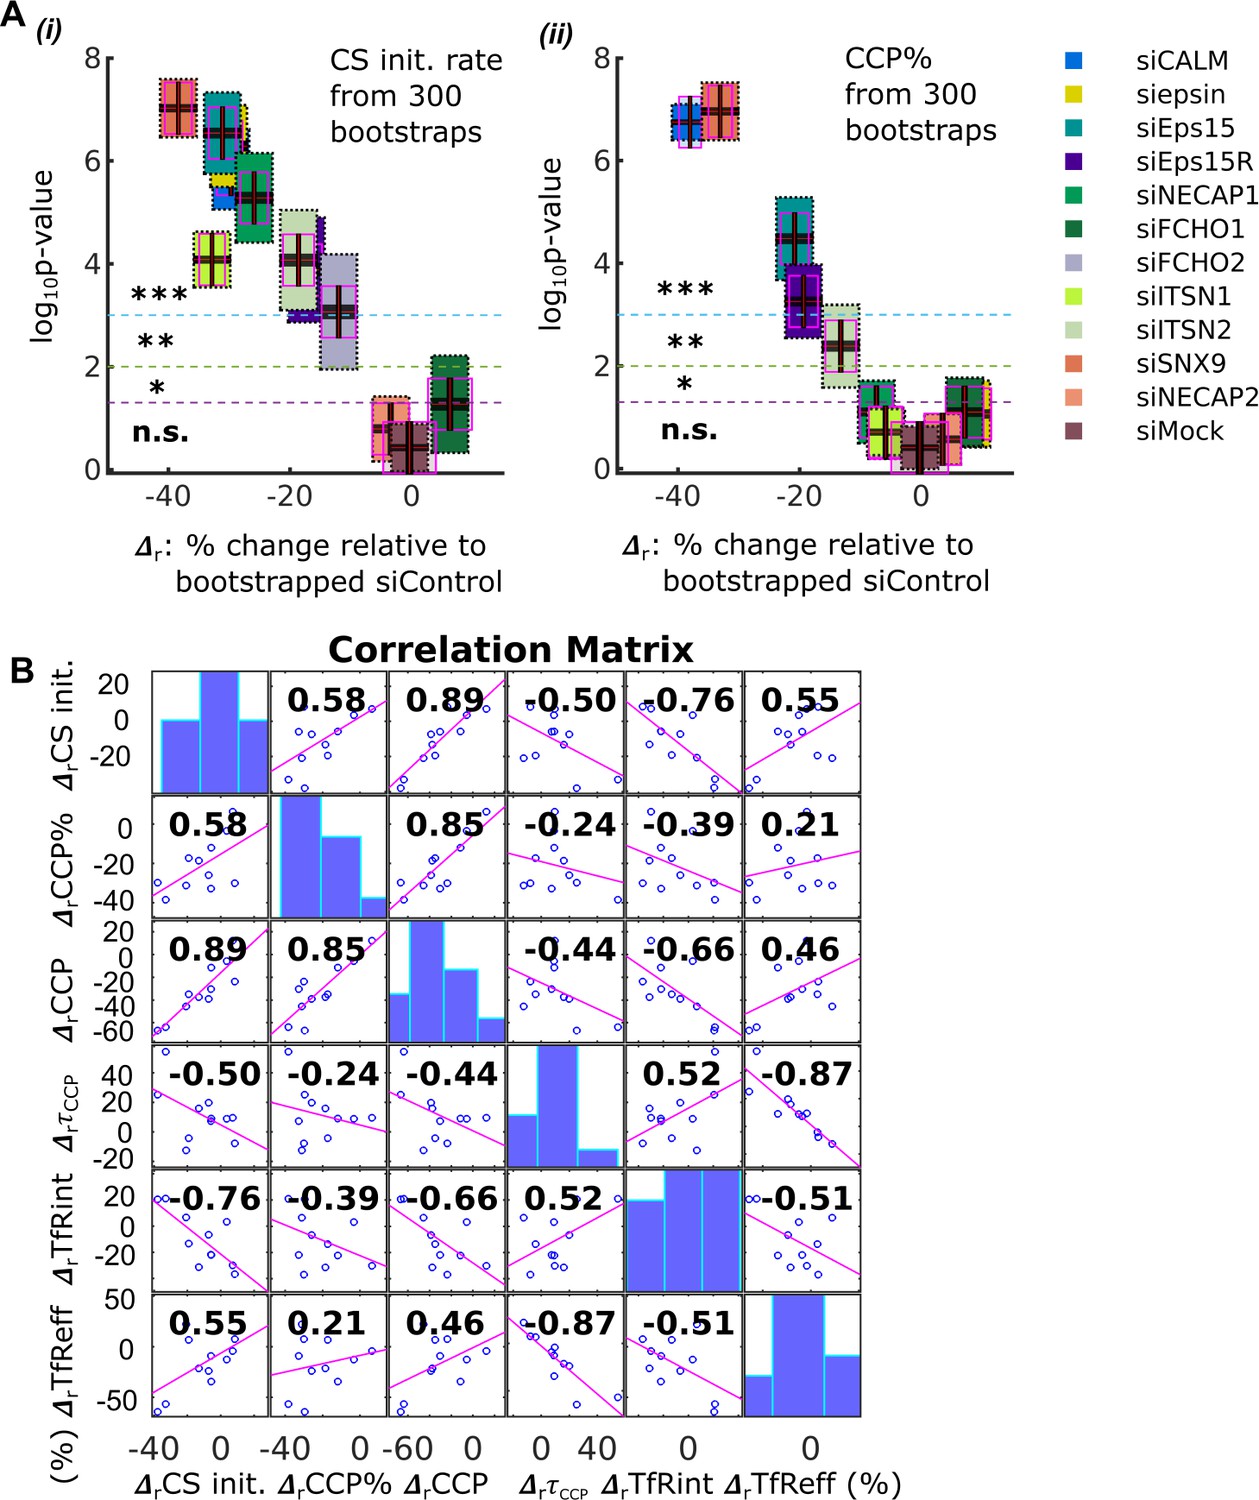
Shifts in CS initiation rate and CCP% upon EAP knockdowns and correlations between all the variables.
(A) (i) CS initiation rate and (ii) CCP% calculated from 300 bootstraps. Same box plot format as in Figure 5A. (B) Correlation matrix of 6 variables in Figure 5A. Diagonal bar graphs showed histogram of individual variable values. Off-diagonal graphs showed pair-wise Pearson linear correlation coefficient. Implemented in Matlab’s function corrplot.
Author response image 1
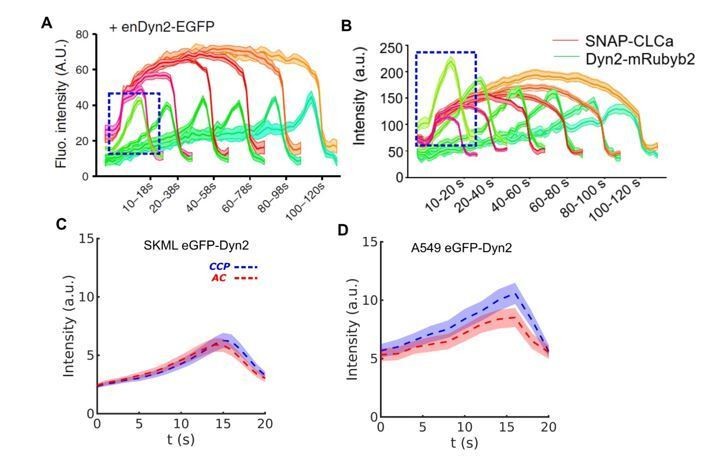
Evidence of early appearance of Dyn2 independent on clathrin dynamics during CME.
(A) Short and bright burst of Dyn2 (blue box) in genome edited SKML cells expressing Dyn2-eGFP (adapted from Aguet et al., 2013). (B) Similar burst in H1299 cells (adapted from Srinivasan et al., 2018). DASC determined CCP and AC groups are very similar with regard to the intensity of endogenous Dyn2-eGPF in both (C) SKML and (D) A549 cells.
Tables
Table 1
Quantitative summary of EAP experiments.
| EAP | Movie number | Initiation | Stabilization | Initiation+Stabilization | Maturation | Biochemical measurements of CME | |
|---|---|---|---|---|---|---|---|
| siRNA or mutant | | CS initiation rate | CCP% | CCP rate | Median lifetime of CCP | TfRint (internal) | TfReff (internal/surface bound) |
| α-PIP2 | 19, 20 | ↑36%*** | ↓27%*** | ↑27%** | ↓* | -- | -- |
| CALM | 20, 19 | ↓38%*** | ↓30%*** | ↓67%*** | ↑25%*** | ↑21%*** | ↓64%*** |
| epsin1 | 23, 22 | → | ↓30%*** | ↓24%** | → | ↓37%*** | → |
| Eps15 | --, 23 | ↓21%*** | ↓31%*** | ↓46%*** | ↓12%** | → | ↑22%** |
| Eps15R | --, 24 | ↓19%** | ↓17%** | ↓35%*** | → | ↓13%*** | → |
| FCHO1 | 24, 24 | → | → | → | ↑10%* | ↓30%*** | → |
| FCHO2 | --, 24 | → | ↓12%** | → | → | ↓22%*** | ↓34%*** |
| ITSN1 | 20, 19 | → | ↓33%*** | ↓30%** | → | ↓22%*** | ↓9%* |
| ITSN2 | --, 22 | ↓13%* | ↓19%*** | ↓37%*** | ↑16%*** | ↓31%*** | ↓21%*** |
| NECAP1 | 22, 21 | → | ↓26%*** | ↓39%*** | ↑20%* | → | ↓24%** |
| NECAP2 | --, 21 | → | → | → | → | → | ↓13%** |
| SNX9 | 24, 24 | ↓33%*** | ↓38%*** | ↓64%*** | ↑54%*** | ↑21%*** | ↓57%*** |
-
↑=increase; ↓=decrease; →=no significant change, p-value>0.05; *** p-value<0.001; ** p-value<0.01; * p-value<0.05 (statistical tests explained in Materials and methods). P-values and percentage changes are mean values obtained from 300 bootstraps comparing between KD conditions and bootstrapped siControl.
Key resources table
| Reagent type (species) or resource | Designation | Source or reference | Identifiers | Additional information |
|---|---|---|---|---|
| Cell line (Homo-sapiens) | ARPE19/HPV16 eGFP_CLCa | This paper | See Materials and methods | |
| Cell line (Homo-sapiens) | ARPE19/HPV16 eGFP_CLCa+α-AP2-WT | This paper | See Materials and methods | |
| Cell line (Homo-sapiens) | ARPE19/HPV16 eGFP_CLCa+α-AP2-PIP2- | This paper | See Materials and methods | |
| Transfected construct (human) | siRNA to EPS15 | Dharmacon | CONJB-000059 | Sense sequence:AAACGGAGCUACAGAUUAUUU |
| Transfected construct (human) | siRNA to EPS15R | Dharmacon | CONJB-000061 | Sense sequence: GCACUUGGAUCGAGAUGAGUU |
| Transfected construct (human) | siRNA to epsin1 | Dharmacon | CONJB-000063 | Sense sequence: GGAAGACGCCGGAGUCAUUUU |
| Transfected construct (human) | siRNA to SNX9 (pool of two) | Dharmacon | Sense sequence: #1: AAGCACUUUGACUGGUUAUU #2:AACAGUCGUGCUAGUUCCUCA | |
| Transfected construct (human) | siRNA to FCHO1 | Santa Cruz | Sc-97726 | transfected construct (human) |
| Transfected construct (human) | siRNA to NECAP1 (stealth) | Invitrogen | HSS177973 | Sense sequence: GCUCUUUGCUCAGGCACCAGUAGAA |
| Transfected construct (human) | siRNA to NECAP2 (stealth) | Invitrogen | HSS148087 | Sense sequence: CCGGCUGAGGAUCACUGCAAAGGGA |
| Transfected construct (human) | siRNA to CALM | Miller et al. Cell 2011 | Sense sequence:ACAGTTGGCAGACAGTTTA | |
| Transfected construct (human) | siRNA to FCHO2 | Santa Cruz | Sc-91916 | transfected construct (human) |
| Transfected construct (human) | siRNA to ITSN1 | Qiagen | Sense sequence: GCAAAUGCUUGGAAGACUU | |
| Transfected construct (human) | siRNA to ITSN2 | Qiagen | Sense sequence: CGUAAAGCCCAGAAAGAAA | |
| Antibody | Anti-alpha Adaptin (Mouse monoclonal, AC1-M11) | ThermoFisher Scientific | MA3-061 | WB (1:1000) |
| Antibody | Anti-PICALM antibody [EPR12177] (Rabbit monocolonal) | Abcam | ab172962 | WB (1:1000) |
| Antibody | Anti-FCHO1 antibody - C-terminal (rabbit polycolonal) | Abcam | ab229255 | WB (1:1000) |
| Antibody | Anti-FCHO2(Rabbit polycolonal) | Novus | NBP2-32694 | WB (1:1000) |
| Antibody | Anti-ITSN1 (rabbit polycolonal) | Sigma | HPA018007 | WB (1:1000) |
| Antibody | Anti-β-Actin (Mouse monoclonal) | Sigma | A1978 | WB (1:5000) |
| Antibody | Anti-SNX9 (Rabbit polyclonal) | Sigma | HPA031410 | WB (1:1000) |
| Antibody | Anti-ITSN2 (Mouse polyclonal) | Abnova | H00050618-A01 | WB (1:1000) |
| Antibody | Anti-Transferrin receptor (mouse monocolonal) | in-house antibody, HTR-D65, PMID:1908470 | generated in-house from hybridomas, recognizes the ectodomain of the transferrin receptor | |
| Antibody | Anti-ESPS15 (Rabbit polycolonal) | Santa Cruz | Sc-534 | WB (1:1000) |
| Antibody | Anti-ESPS15R (Rabbit polycolonal) | in-house antibody | WB (1:1000) | |
| Antibody | Anti-NECAP1 (3585) (Rabbit polycolonal) | Ritter et al. Biochem. Soc. Trans., 2004 | WB (1:1000) | |
| Antibody | Anti-NECAP2 (3148) (Rabbit polycolonal) | From Brigitte Ritter | WB (1:1000) | |
| Antibody | Anti-epsin1 (goat polycolonal) | Santa Cruz | Sc-8673 | WB (1:1000) |
| Software | DASC (integrated to cmeAnalysis) | https://github.com/DanuserLab/cmeAnalysis |
Additional files
Download links
A two-part list of links to download the article, or parts of the article, in various formats.
Downloads (link to download the article as PDF)
Open citations (links to open the citations from this article in various online reference manager services)
Cite this article (links to download the citations from this article in formats compatible with various reference manager tools)
DASC, a sensitive classifier for measuring discrete early stages in clathrin-mediated endocytosis
eLife 9:e53686.
https://doi.org/10.7554/eLife.53686


