Slow oscillation-spindle coupling predicts enhanced memory formation from childhood to adolescence
- Department of Psychology, Laboratory for Sleep, Cognition and Consciousness Research, University of Salzburg, Austria
- Centre for Cognitive Neuroscience Salzburg (CCNS), University of Salzburg, Austria
- Hertie-Institute for Clinical Brain Research, University of Tübingen, Germany
Figures
Figure 1 with 1 supplement

Study design and behavioral results.
(A) Longitudinal study design. Participants were recorded during childhood (blue) and adolescence (red). Recording periods were separated by 7 years. Participants underwent two full-night ambulatory polysomnographies in their habitual sleep environment at both time points respectively. The first night served adaptation purposes. At the following experimental night, participants performed a declarative word pair learning task during which they encoded and recalled semantically non-associated word pairs before sleep. The post-sleep recall was separated by a 10 hr (childhood) and 8 hr sleep during the retention interval (adolescence). (B) Word pair task design. Participants encoded 50 word pairs during childhood (blue) and 80 word pairs during adolescence (red). Every word pair presentation was followed by a fixation cross. Participants were instructed to imagine a visual connection between the two words. Timing parameters are indicated in the respective colors for childhood (blue) and adolescence (red). During the recall trial, only the first word of the word pair was presented and participants had to recall the corresponding word. Participants received no performance feedback. (C) Behavioral results for the word pair task. Performance was measured as percentage of correctly recalled word pairs. Participants showed a higher performance during adolescence. Black circles indicate individual recall scores.
Figure 1—figure supplement 1
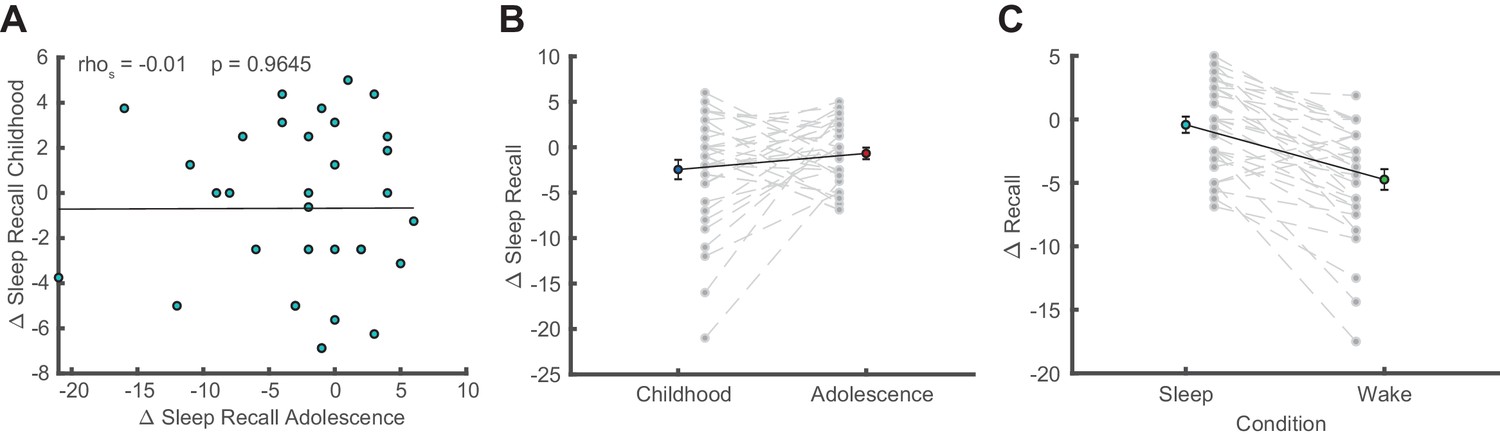
Additional behavioral analyses.
(A) Correlation of sleep-dependent memory consolidation between childhood and adolescence (rho = −0.01, p=0.965). (B) Direct comparison of sleep-dependent memory consolidation (delayed recall – immediate recall; mean ± SEM) between childhood and adolescence. There was no significant difference between childhood and adolescence (t(32) = −1.43, p=0.161, d = −0.35). (C) Comparison of memory consolidation between the sleep and wake condition during adolescence (delayed recall – immediate recall; mean ± SEM). Memory consolidation in the sleep condition was superior to the wake condition (t(30) = 6.04, p<0.001, d = 1.08). Please note that data of a wake condition were only available for 31 instead of 33 subjects during adolescence.
Figure 2 with 2 supplements
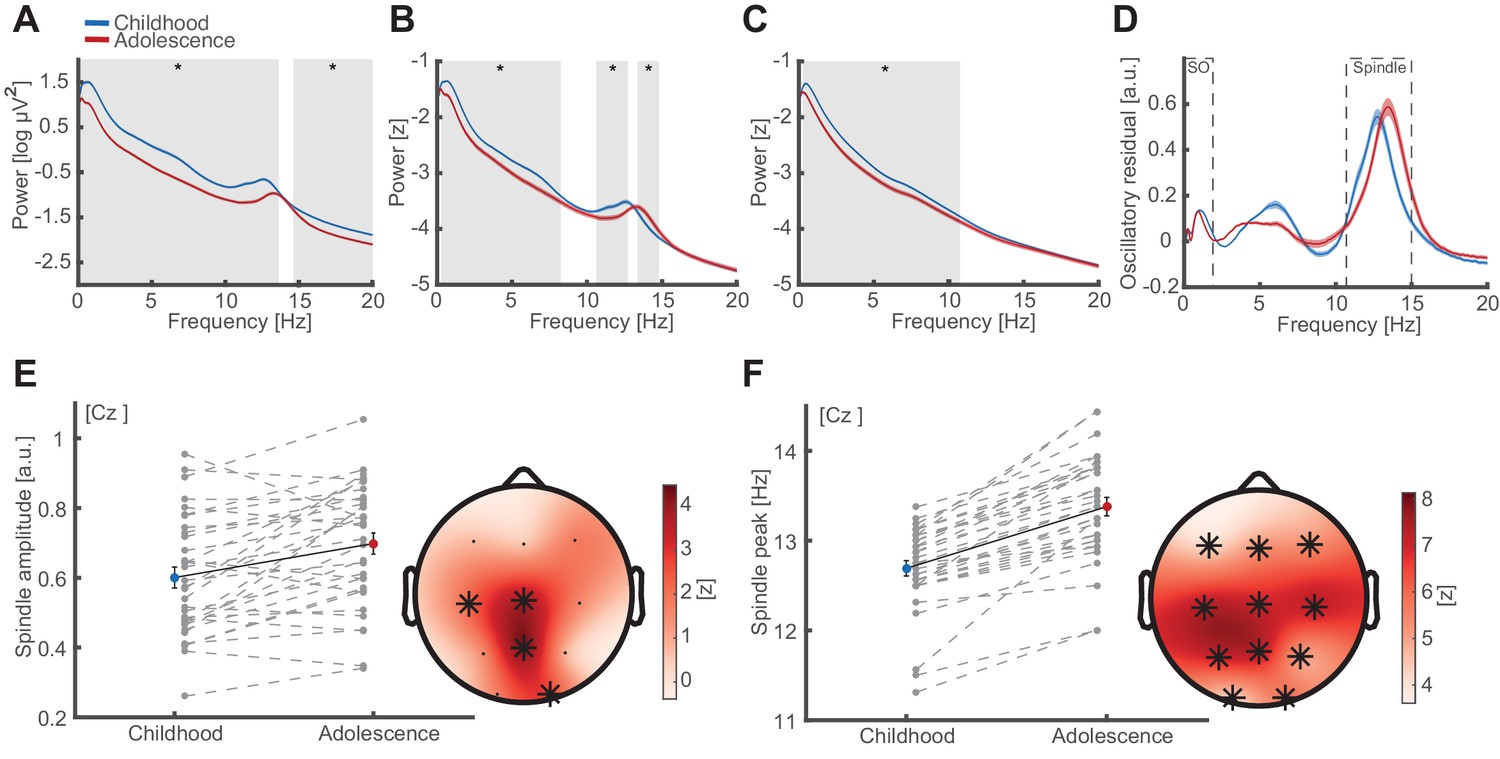
Oscillatory signatures of NREM sleep.
(A) Uncorrected EEG power spectra (mean ± standard error of the mean [SEM]) during NREM (NREM2 and NREM3) sleep at Cz during childhood (blue) and adolescence (red). Grey overlays indicate significant differences (cluster-corrected). Note the overall power decrease from childhood to adolescence. (B) Z-normalized EEG power spectra. Same conventions as in (A). Significant differences indicate a change in the fractal component of power spectra (0.3–8.4 Hz) and a spindle frequency peak shift (10.6–14.8 Hz) from childhood to adolescence. (C) Extracted 1/f fractal component. Same conventions as in (A). Decrease of the fractal component (0.3–10.8 Hz) from childhood to adolescence. (D) Oscillatory residual of the NREM power spectra obtained by subtracting the fractal component (C) from the z-normalized power spectrum (B). Oscillatory residual shows clear dissociable peaks in the SO and sleep spindle frequency range (dashed boxes) during both time points, indicating true oscillatory activity. (E) Spindle amplitude development. Spindle amplitude (exemplary depiction at Cz, left, mean ± SEM) as extracted from the oscillatory residuals (D) indicating an increase in 1/f corrected amplitude within a centro-partial cluster (right) from childhood to adolescence. Grey dots represent individual values. Asterisks denote cluster-corrected two-sided p<0.05. T-scores are transformed to z-scores to indicate the difference between childhood and adolescence. (F) Spindle frequency peak development. Spindle frequency peak (mean ± SEM) as extracted from the oscillatory residual (D). Same conventions as in (E). Spindle peak frequency increases at all electrodes from childhood to adolescence.
Figure 2—figure supplement 1
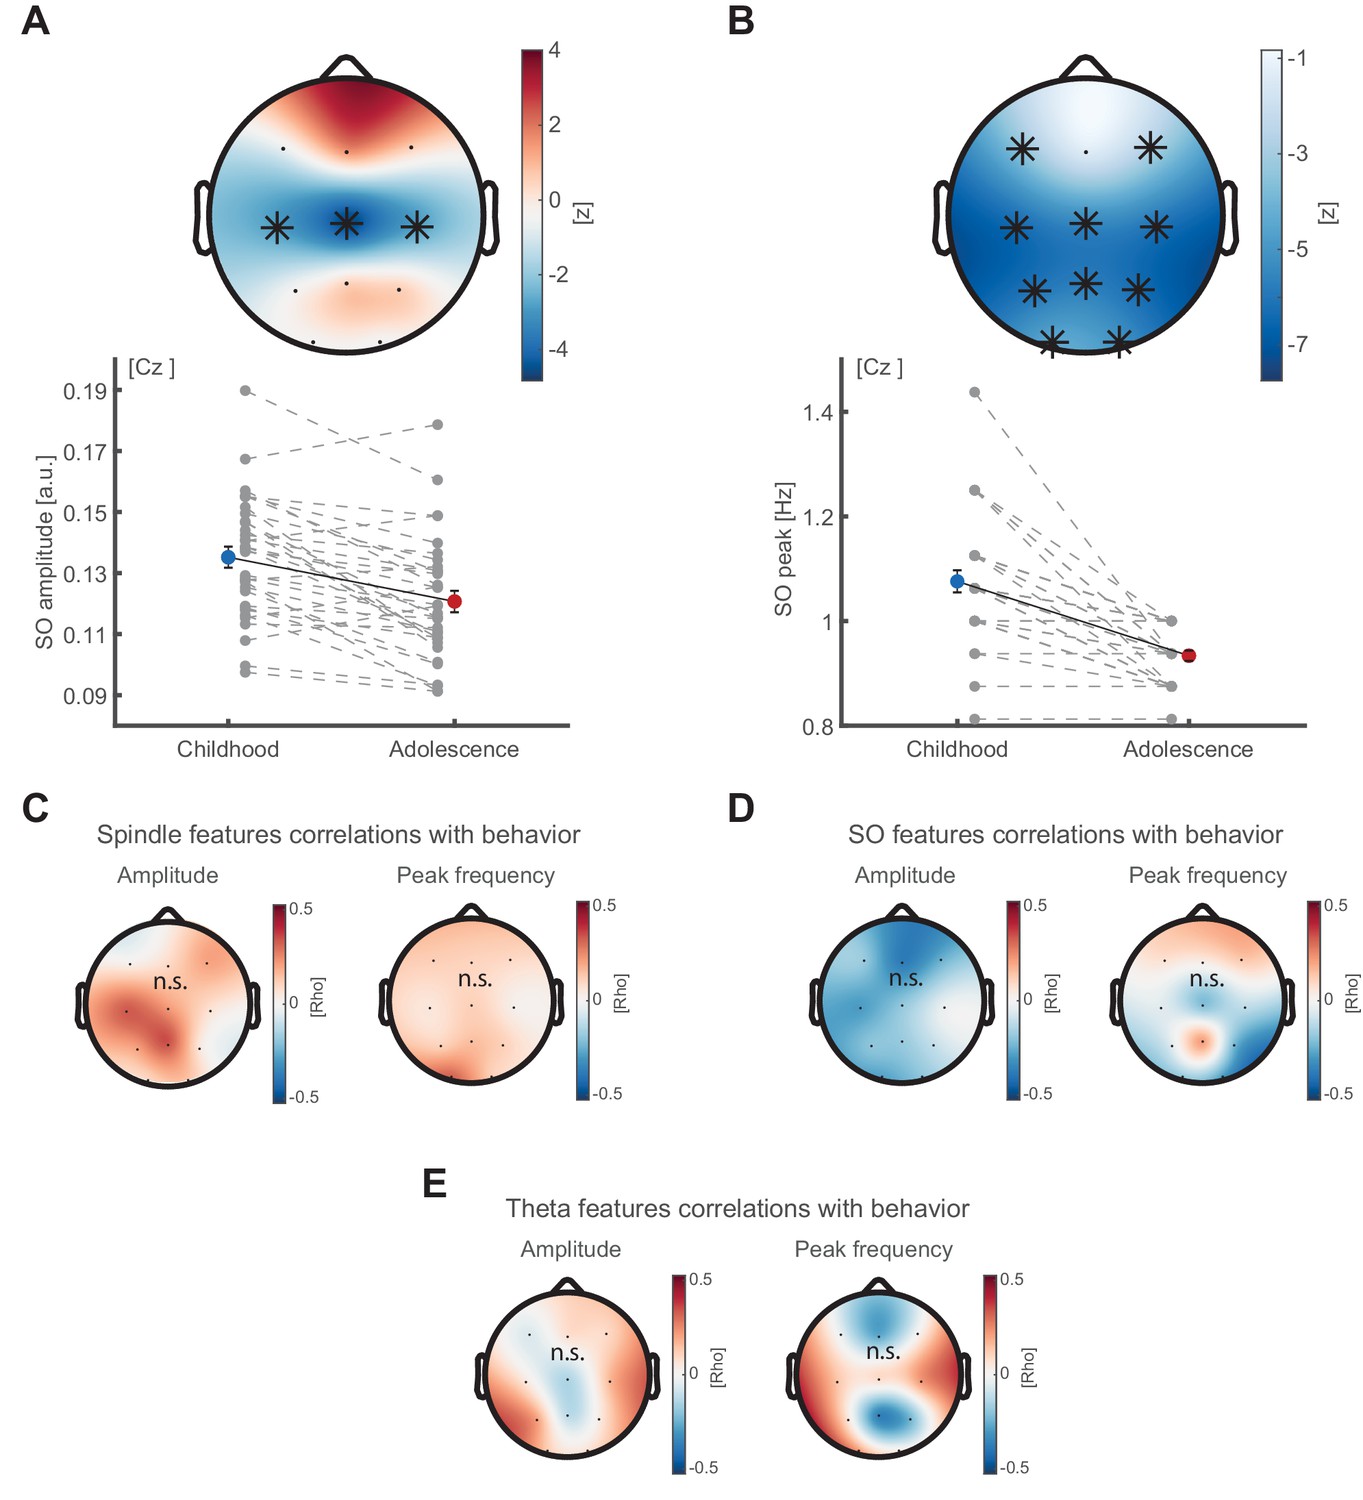
SO feature development and correlations between oscillatory features and behavior.
(A) SO amplitude development. SO amplitude (exemplary depiction at Cz, lower panel, mean ± SEM) as extracted from the oscillatory residual (peak <2 Hz, Figure 2D) indicating a decrease in 1/f corrected amplitude within a central cluster (top panel) from childhood to adolescence. Grey dots represent individual values. Asterisks denote cluster-corrected two-sided p<0.05. T-scores are transformed to z-scores to indicate the difference between childhood and adolescence. (B) SO frequency peak development. Spindle frequency peak (mean ± SEM) as extracted from the oscillatory residual (Figure 2D). Same conventions as in (A). SO peak frequency decreases at all sensors but Fz from childhood to adolescence. (C) Cluster-corrected correlations between developmental change in sleep spindle amplitude (left) and peak frequency (right) with recall performance improvement in the delayed recall from childhood to adolescence. No significant clusters emerged. (D) Same convention as in (C) but for SO amplitude (left) and peak frequency (right). No significant clusters emerged. (E) To extract theta oscillatory features, we detected the peaks in the oscillatory residual (Figure 2D) during NREM sleep in theta frequency range (4–7 Hz) and extracted the maximum (theta amplitude) and corresponding frequency (peak frequency). Cluster-corrected correlations between developmental change in theta amplitude (left) and peak frequency (right) with recall performance improvement in the delayed recall from childhood to adolescence. No significant clusters emerged.
Figure 2—figure supplement 2
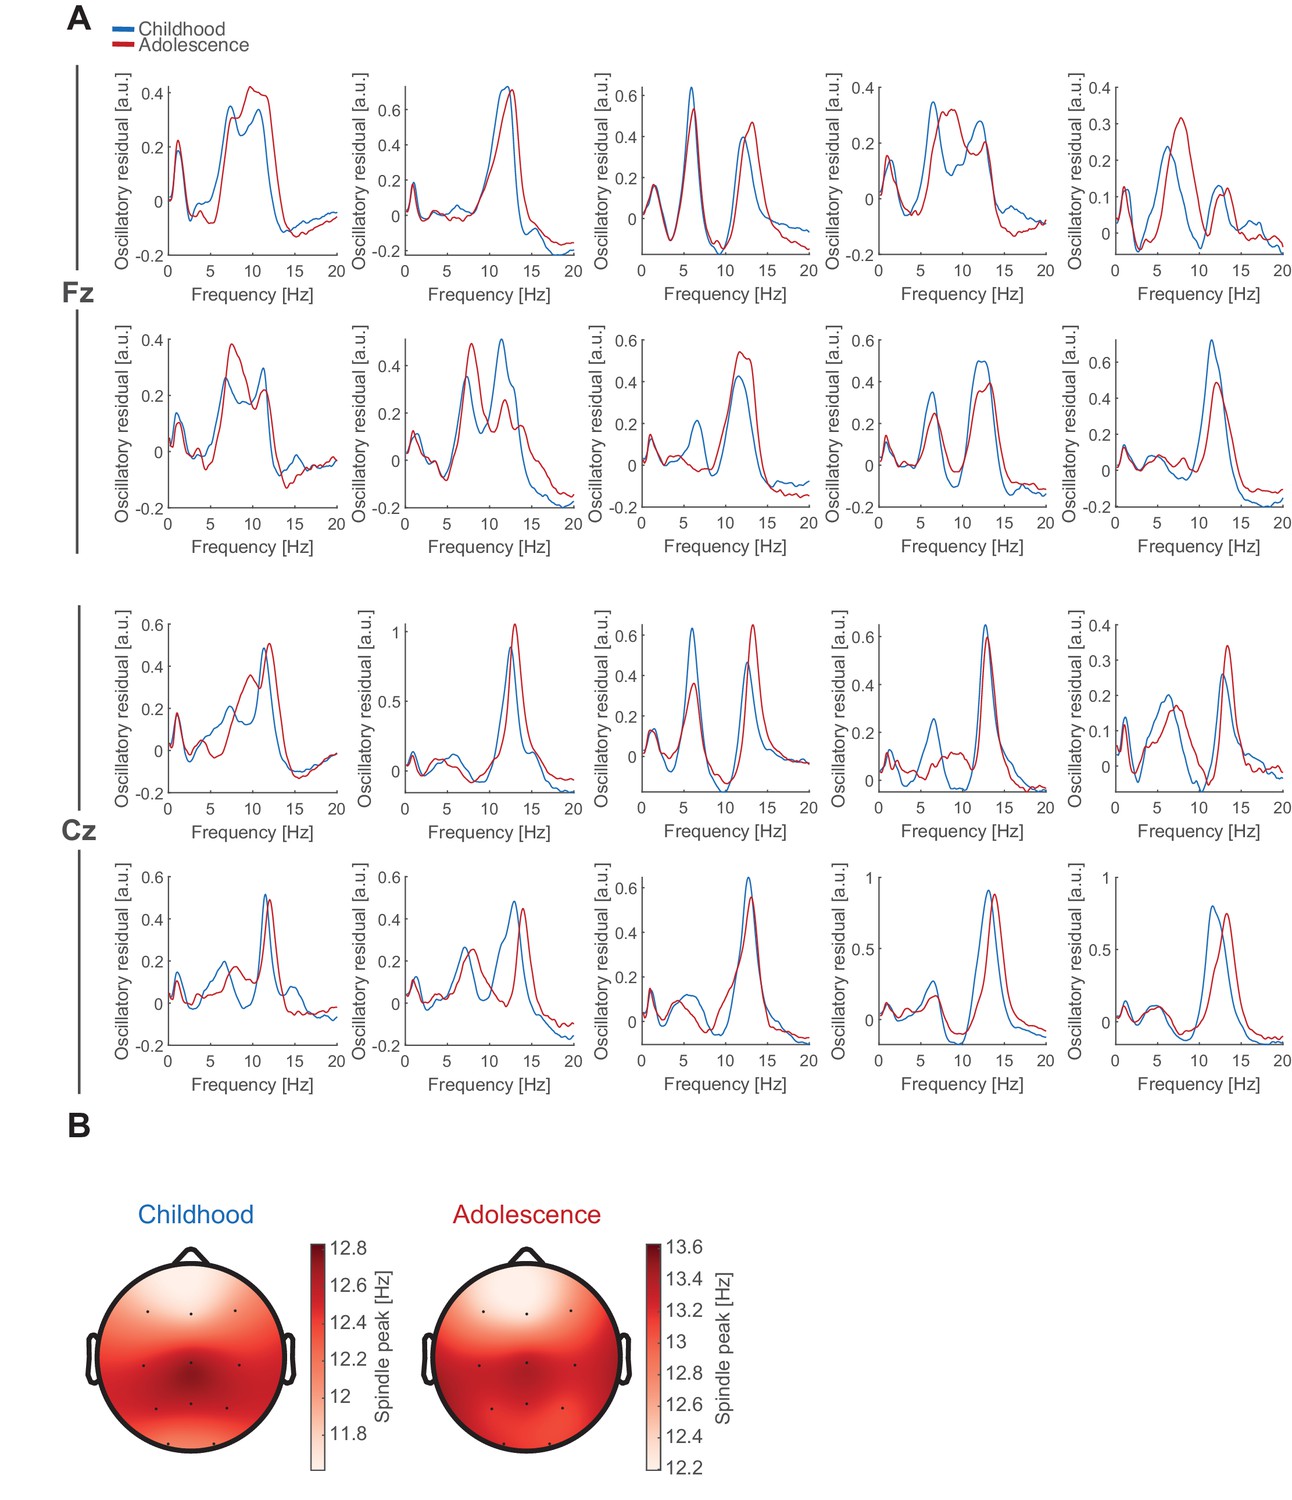
Individual oscillatory residuals and spindle frequency gradient.
(A) Exemplary NREM oscillatory residual during childhood (blue) and adolescence (red) for 10 subjects at Fz and Cz. Note, most subjects did not express two clear spindle frequency peaks (Fz: 16/66 nights; Cz 8/66 nights). (B) Topographical plots of spindle peak frequency during childhood (left) and adolescence (right) during NREM sleep showing the typical antero-posterior spindle frequency gradient with slower frontal and fast centro-parietal spindles. Note the change in the colorbar scaling due to the overall spindle frequency increase (Figure 2F).
Figure 3 with 1 supplement
Individual features of discrete SO and sleep spindle events.
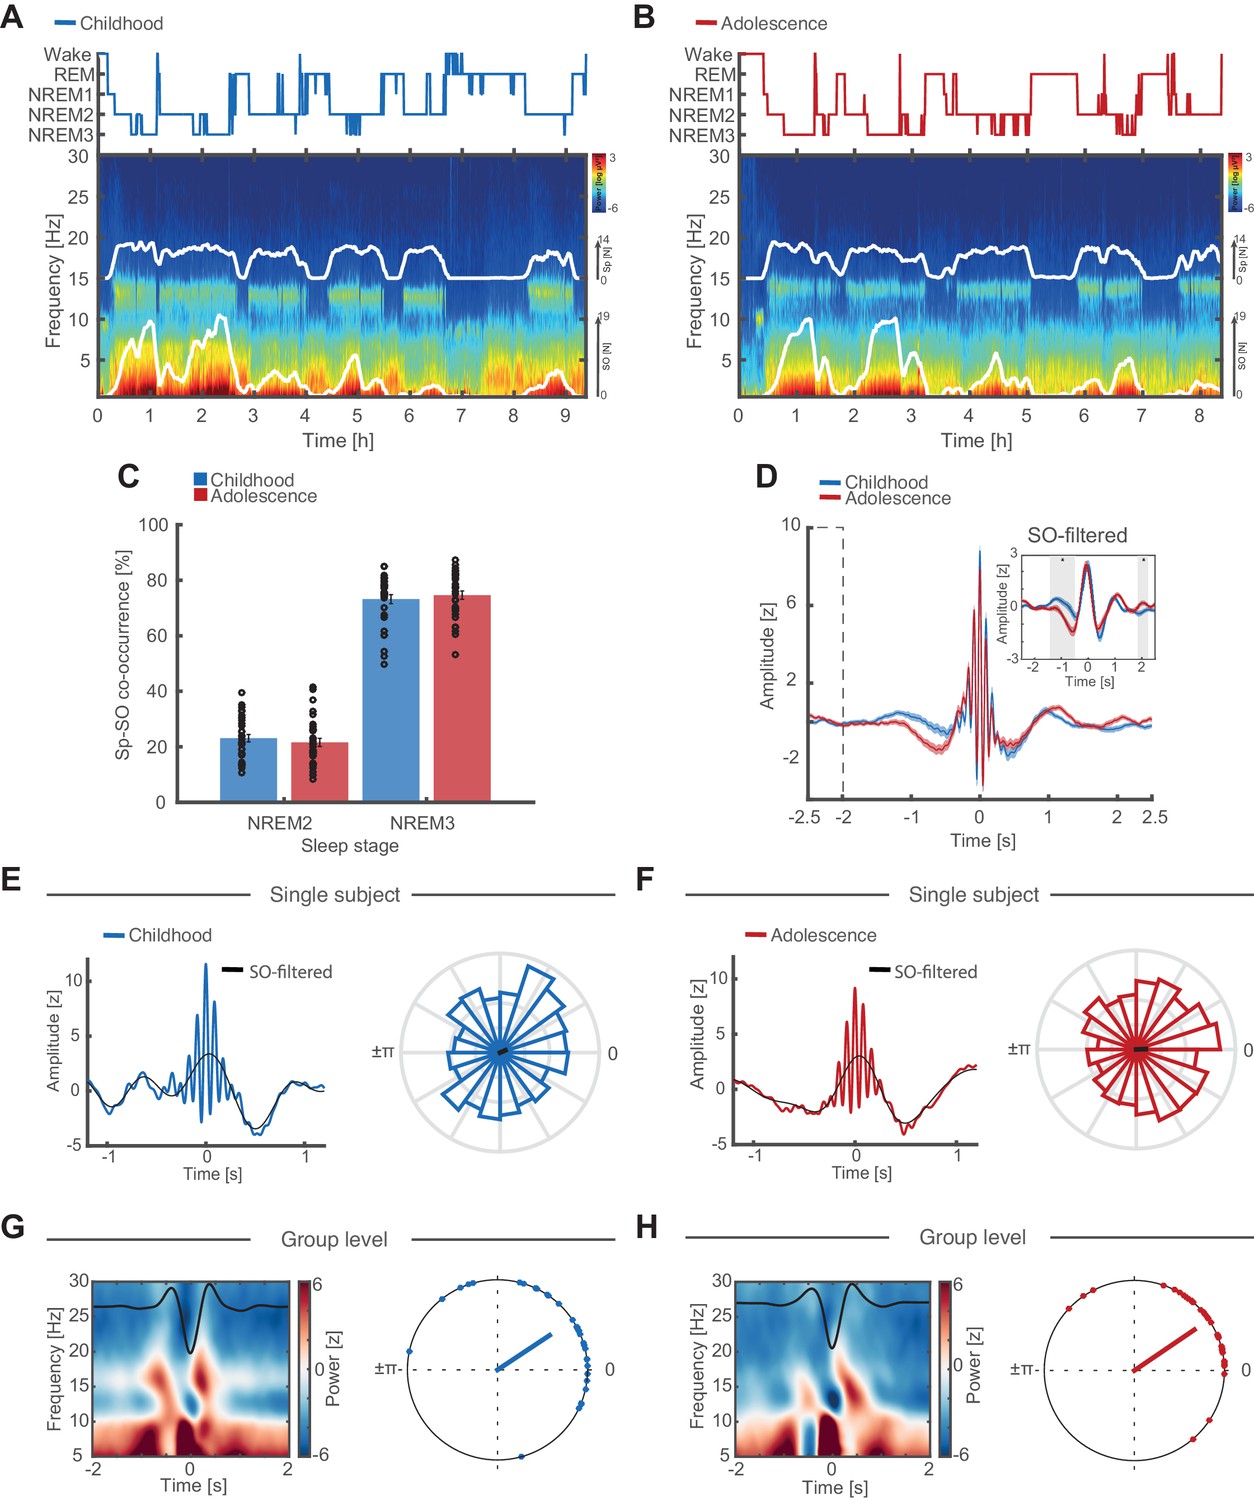
(A) Hypnogram (top) and full-night spectrogram (bottom) at electrode Cz of an exemplary subject during childhood. White lines in the spectrogram indicate the amount of events detected by the individually adjusted detection algorithms for sleep spindles (upper trace) and SO (lower trace). (B) Same conventions as in (A) but for the same individual during adolescence. (C) Spindle-SO co-occurrence expressed as the percentage of SO detections that coincide ±2.5 s with a sleep spindle detection at electrode Fz during NREM2 and NREM3 sleep during childhood (blue) and adolescence (red). Note the high co-occurrence of spindles and SOs during NREM3 at both recording time points. (D) Grand average of z-normalized sleep spindle events (mean ± SEM) during childhood (blue) and adolescence (red) at electrode Fz with the corresponding SO-low-pass filtered (<2 Hz) EEG-trace (inset). Note that there is no baseline difference between −2.5 s and −2 s (dashed box). The significant difference in the −1.5 to -0.5 s interval (grey shaded area, SO-filtered inset) indicates an increased amount of coupled SO-sleep spindle events during adolescence. Further note, no amplitude differences in the SO-filtered signal around the spindle peak at 0 s (i.e. time point of the phase readout). Grand average spindle frequency is distorted by the individually adjusted event detection criteria. (E) SO-spindle coupling features. Data are shown for electrode Fz during NREM3. Left: Exemplary spindle-locked average for a single subject during childhood with the corresponding SO-filtered signal in black. Note that the spindle amplitude peak coincides with the maximum peak in the SO-component. Right: Normalized phase histograms of spindle events relative to SO-phase of an exemplary subject during childhood. 0° denotes the positive peak whereas ±π denotes the negative peak of the SO. (F) Same conventions as in (E). Left: Exemplary spindle-locked average of the same single subject as in (E) during adolescence. Note the clearer outline of a SO-component compared to during childhood indicating a stronger SO-spindle coupling. Right: Normalized phase histograms of spindle events relative to SO-phase of same exemplary subject as in (E) during adolescence. Note the reduced spread in SO-phase. (G) Left: Grand average baseline-corrected (−2 to −1.5 s) SO-trough-locked time frequency representation (TFR). Schematic SO-component is superimposed in black. Note the alternating pattern within the spindle frequency range indicating a modulation of spindle activity by SO-phase. Right: Circular plot of preferred phase (SO phase at spindle amplitude maximum) per subject during childhood. Dots indicate the preferred phase per subject. The line direction shows the grand average preferred direction. The line length denotes the mean resultant vector (i.e. sample variance of preferred phase and therefore does not represent coupling strength). Note that most subjects show spindles coupled to or just after the positive SO-peak at 0°. Data are shown for electrode Fz during NREM3. (H) Same conventions as in (G). Left: SO-trough-locked TFR indicating a modulation in spindle activity depending on SO-phase. Right: Circular plot of preferred phase per subject during adolescence. Note that there are no preferred phase changes but an overall reduced spread in preferred phase on the group level during adolescence as indicated by a longer mean resultant vector (red line).
Figure 3—figure supplement 1
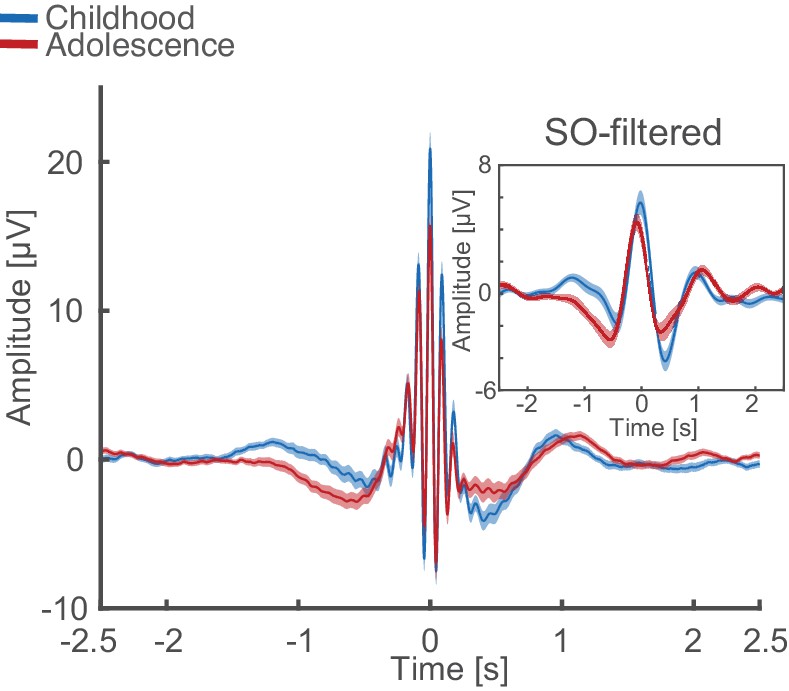
Uncorrected (non z-normalized) spindle-locked grand average during NREM3 at Cz for childhood (blue) and adolescence (red) with corresponding SO-filtered (<2 Hz) EEG-trace.
Figure 4 with 1 supplement
Coupling strength development and correlations with memory formation.
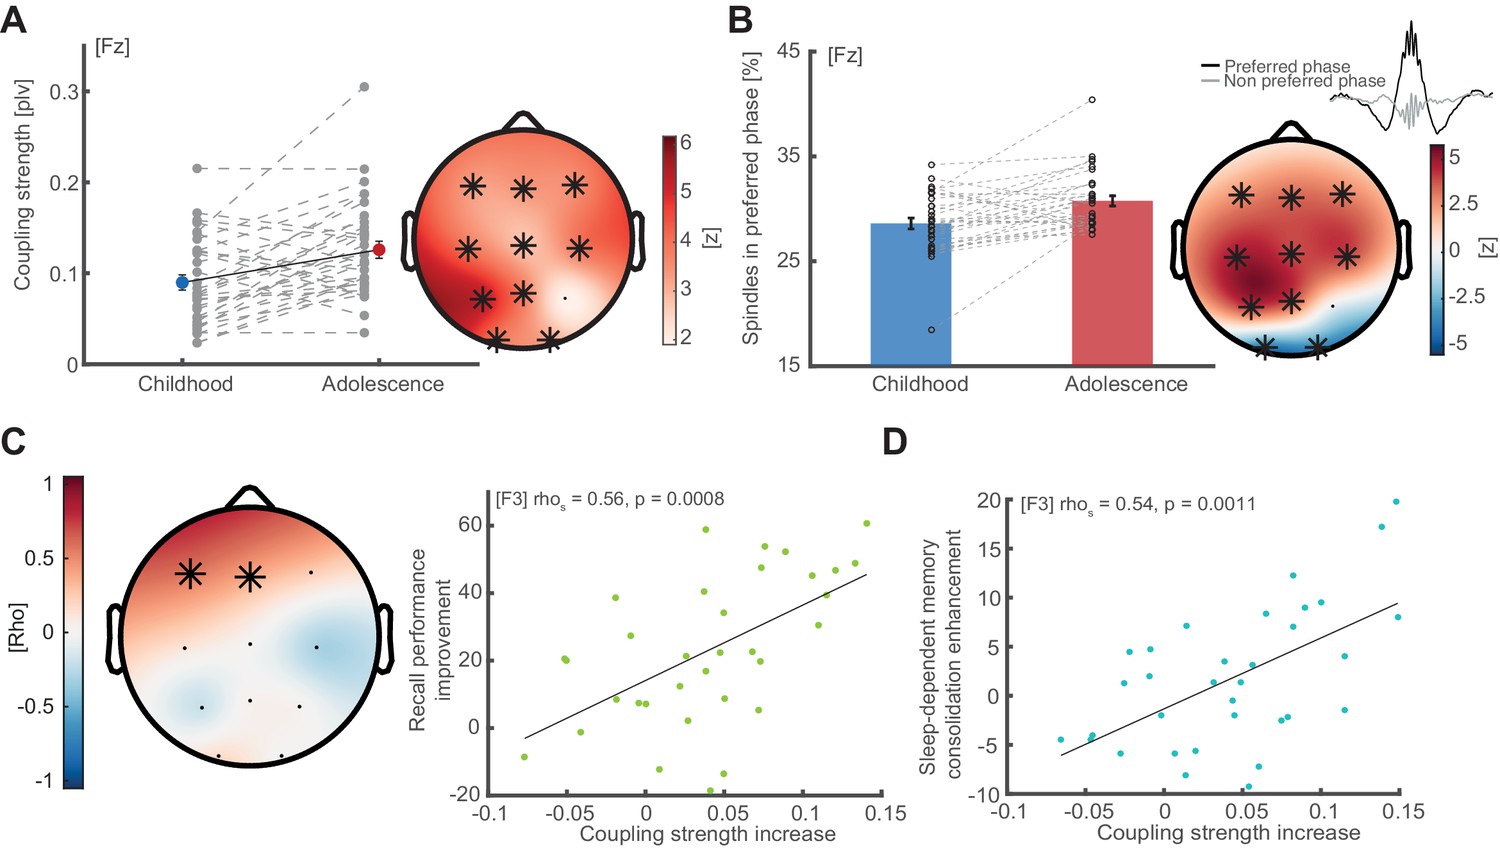
(A) Coupling strength development. Coupling strength (phase locking value; mean ± SEM) increases from childhood to adolescence (exemplary data at Fz, left, grey dots indicate individual values) at all electrodes except P4 (topographical plot, right), indicating that more spindles arrive within the preferred phase during adolescence than during childhood. Asterisks indicate cluster-corrected two-sided p<0.05. T-scores are transformed to z-scores to indicate the difference between childhood and adolescence. (B) Spindles in preferred phase. Same conventions as in (A). Bar plot depicts the percentage of sleep spindles (mean ± SEM) that arrive in a ± 22.5° radius around the individual preferred phase. Like coupling strength, spindles in preferred phase increase from childhood to adolescence in a fronto-parietal cluster but decrease in an occipital cluster. (C) Left: Cluster-corrected correlation between the individual coupling strength increases from childhood to adolescence (difference adolescence – childhood) and recall performance improvement (delayed recalladolescence – delayed recallchildhood). Asterisks denote significant electrodes. Subjects with higher coupling strength increases showed stronger recall performance improvements from childhood to adolescence. This effect was strongest at electrode F3: rho = 0.56, p=0.0008 (right, scatter plot with linear trend line). (D) Correlation between coupling strength increase (co-occurrence corrected) and sleep-dependent memory consolidation enhancement ([delayed recalladolescence – immediate recalladolescence] - [delayed recallchildhood – immediate recallchildhood]) from childhood to adolescence at electrode F3: rho = 0.54, p=0.0011. This indicates that subjects with a higher developmental increase in coupling strength show higher sleep benefits on memory consolidation.
Figure 4—figure supplement 1
Preferred phase development, correlations with behavior and non-individualized parameters.
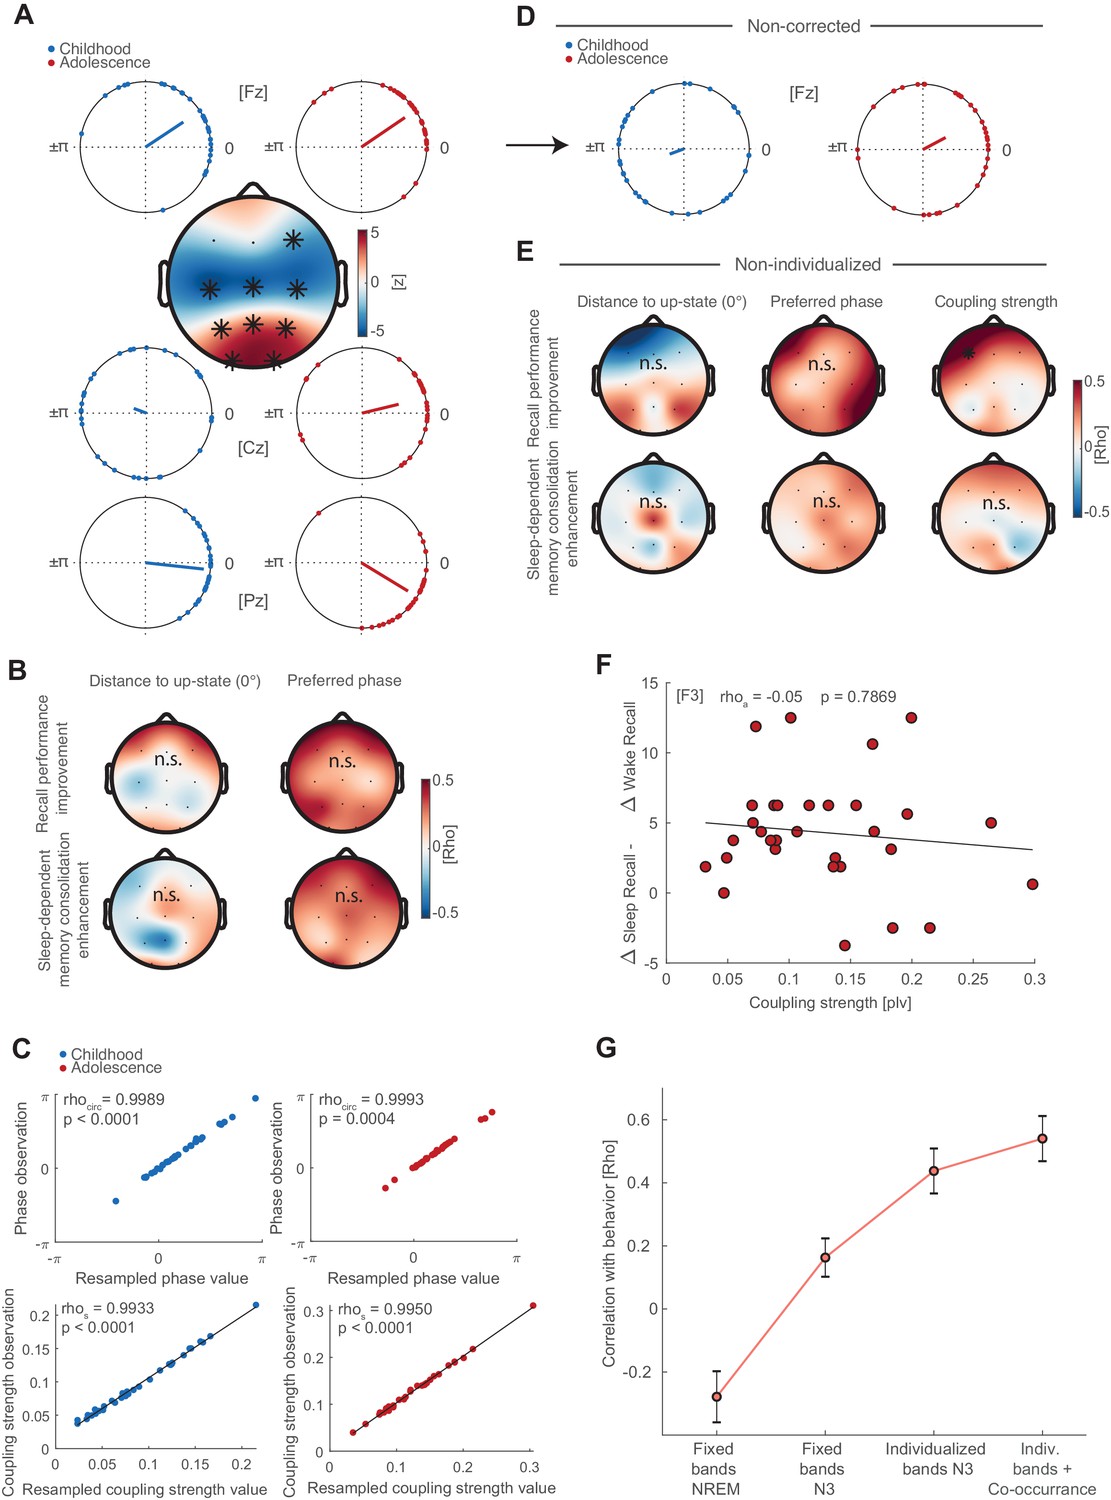
(A) Preferred phase development from childhood to adolescence. Circular plots of preferred phase (SO phase at spindle amplitude maximum) per subject during childhood and adolescence at electrodes Fz, Cz and Pz. The dots indicate the preferred phase per subject. Circular plot are for descriptive purposes only because circular statistics (Watson Williams Test) were not applicable for repeated measures. At Fz, spindles are locked to and shortly after (falling flank) the positive SO peak (‘up-state’) during childhood (33.5°±44.8°;circular mean ± SD) and adolescence (34.2°±35.8°; circular mean ± SD). During childhood subject did not express a specific coupling direction at Cz (159.6°±72.1°) as indicated by the wide spread on the unit circle. However, spindles became locked to the SO-peak during adolescence (13.7°±52.9°). At Pz, spindles were coupled around the SO-peak during childhood (−6.2°±25.8°) and shortly before the SO-peak at the rising flank of the oscillation during adolescence (−31.3°±32.9°). Topographical plot: We transformed circular measures (phase) to parametric values by calculating the absolute distance to 0° (i.e. SO ‘up-state’) to allow for repeated measure testing. Cluster-corrected dependent t-tests showed that subjects decreased the coupling distance to the SO-peak in a fronto-central cluster (p<0.001, d = −0.84) but increased the coupling distance in parieto-occipital cluster (p<0.001, d = 0.74). Indicating that spindles become increasingly locked to the SO up-state centrally but less so at parieto-occipital sites throughout development. (B) Left: Cluster-corrected correlations between the developmental changes in distance to up-state (adolescence – childhood) with difference in recall performance (delayed recalladolescence – delayed recallchildhood; top row) and difference in sleep-dependent memory consolidation ([delayed recalladolescence – immediate recalladolescence] - [delayed recallchildhood – immediate recallchildhood]); bottom row). No significant clusters emerged. Right: Cluster-corrected circular linear correlation between change in preferred phase (calculated as distance between preferred phase during adolescence and childhood) and behavior. No significant clusters emerged. (C) To control for differences in event number, we used bootstrapping by randomly drawing 500 spindle events 100 times and recalculating the preferred phase and coupling strength. Scatter plots depict spearman correlations (coupling strength) and circular-circular correlations (phase) for observed and resampled coupling metrics during childhood (blue) and adolescence (red). The strong correlations show that the coupling metrics where not influenced by differences in event number between childhood and adolescence. (D) Circular plots for non-corrected (NREM), non-individualized (fixed spindle band 11–15 Hz, SO <1.25 Hz) phase estimates at electrode Fz. Note the strong spread of individual preferred phase compared to individualized and corrected circular plot in (A). (E) Cluster corrected correlations of non-individualized coupling metrics (fixed bands) during NREM3 with behavior (difference in recall performance, top row; difference in sleep-dependent memory consolidation, bottom row) for preferred phase and distance to up-state difference. No significant clusters emerged. Note that the predictive power of a frontal coupling strength increase for recall performance improvement (Figure 4C) declined (rho = 0.50, p=0.035; cluster-corrected) and vanished for sleep-dependent memory consolidation enhancements (Figure 4D) for non-individualized (bottom row, right) coupling metrics when accounting for factors that impair accurate cross-frequency coupling estimation (Aru et al., 2015). (F) Correlation analysis between coupling strength at F3 and the difference of memory consolidation between the sleep and wake condition during adolescence ([(delayed recallsleep –immediate recallsleep)- (delayed recallwake –immediate recallwake)]). This analysis was conducted in order to validate whether the coupling strength is related to enhanced performance after sleep compared to a wake. (G) Bootstrapped mean correlation coefficients (mean ± SEM) of sleep-dependent memory enhancement and coupling strength increase at F3 as a function of analytical choice. Mean and SEM of the correlation coefficients were obtained via a bootstrapping procedure by computing the correlation 1000 times for ~90% (N = 27) randomly drawn subjects. The obtained values were first Fisher Z-transformed to calculate the mean and SEM and subsequently retransformed to rho-values. Note the increase for every analytical choice, which reveals the necessity for controlling for individual oscillatory signatures and event co-occurrence.
Author response image 1
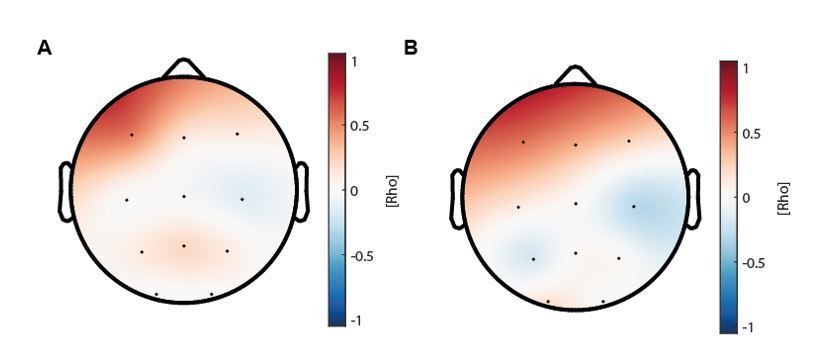
(A) Topographical distribution of the correlations between maturational coupling strength increase and enhanced sleep-dependent memory consolidation (related to Figure 4D).
(B) Topographical distribution of the correlations between maturational coupling strength increase and recall performance increase.
Tables
Key resources table
| Reagent type (species) or resource | Designation | Source or reference | Identifiers | Additional information |
|---|---|---|---|---|
| Software, algorithm | Brain Vision Analyzer 2.2 | Brain Products GmbH https://www.brainproducts.com | RRID:SCR_002356 | |
| Software, algorithm | CircStat 2012 | Berens, 2009 https://philippberens.wordpress.com/code/circstats/ | RRID:SCR_016651 | |
| Software, algorithm | EEGLAB 13_4_4b | Delorme and Makeig, 2004 https://sccn.ucsd.edu/eeglab/index.php | RRID:SCR_007292 | |
| Software, algorithm | FieldTrip 20161016 | Oostenveld et al., 2011 http://www.fieldtriptoolbox.org/ | RRID:SCR_004849 | |
| Software, algorithm | IRASA | Wen and Liu, 2016 https://purr.purdue.edu/publications/1987/1 | ||
| Software, algorithm | MATLAB 2015a | MathWorks Inc | RRID:SCR_001622 | |
| Software, algorithm | Presentation software | Neurobehavioral Systems, Inc http://www.neurobs.com | RRID:SCR_002521 | |
| Software, algorithm | Somnolyzer 24 × 7 | Koninklijke Philips N.V. https://www.philips.co.in |
Additional files
Download links
A two-part list of links to download the article, or parts of the article, in various formats.
Downloads (link to download the article as PDF)
Open citations (links to open the citations from this article in various online reference manager services)
Cite this article (links to download the citations from this article in formats compatible with various reference manager tools)
Slow oscillation-spindle coupling predicts enhanced memory formation from childhood to adolescence
eLife 9:e53730.
https://doi.org/10.7554/eLife.53730


