Structure-based discovery of potent and selective melatonin receptor agonists
- Department of Biological Sciences and Department of Chemistry, Bridge Institute, USC Michelson Center for Convergent Biosciences, University of Southern California, United States
- Department of Pharmacology, University of North Carolina Chapel Hill Medical School, United States
- National Institute of Mental Health Psychoactive Drug Screening Program, Department of Pharmacology, University of North Carolina Chapel Hill Medical School, United States
- Division of Chemical Biology and Medicinal Chemistry, University of North Carolina Chapel Hill Medical School, United States
Figures
Figure 1 with 2 supplements
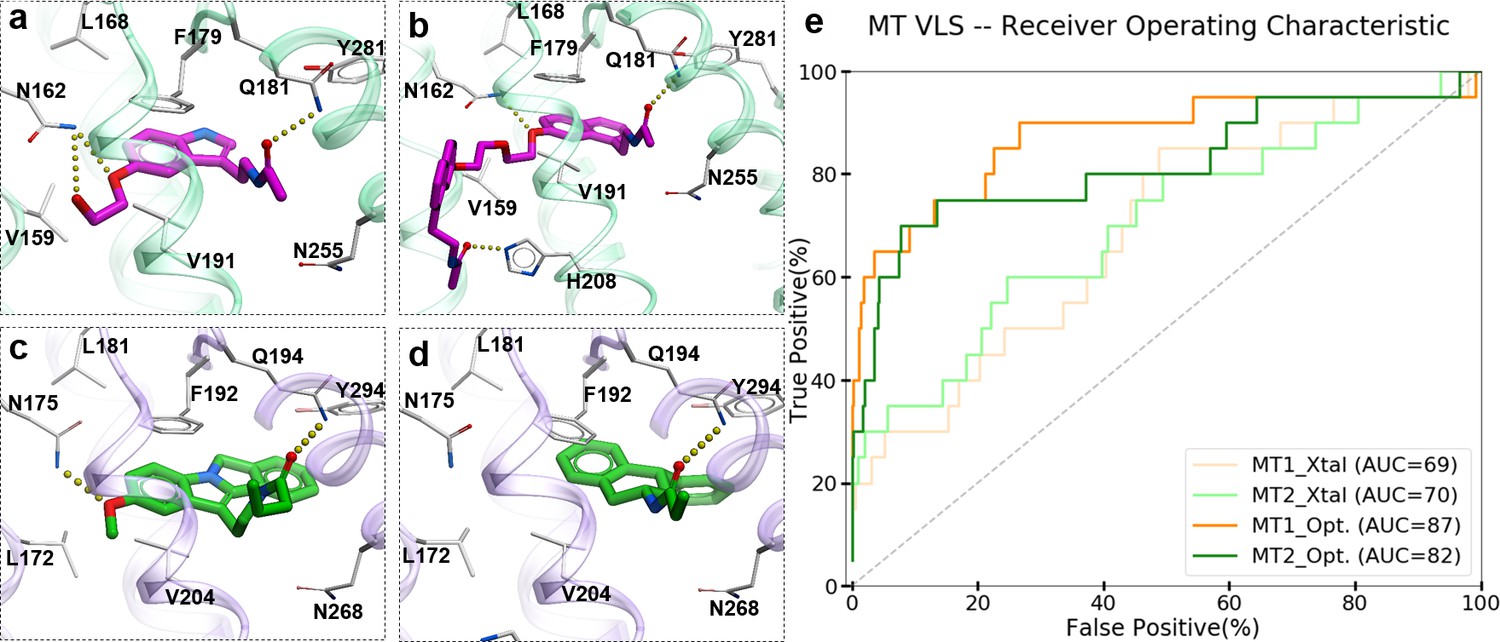
Predicted binding modes of selected known MT ligands.
(a) 5-HEAT and (b) S-26131 docked into MT1_Opt model; whereas (c) IIK-7 and (d) 4P-PDOT docked into MT2_Opt model. (e) ROC plots for MT receptor crystal structures and optimized models.
Figure 1—figure supplement 1
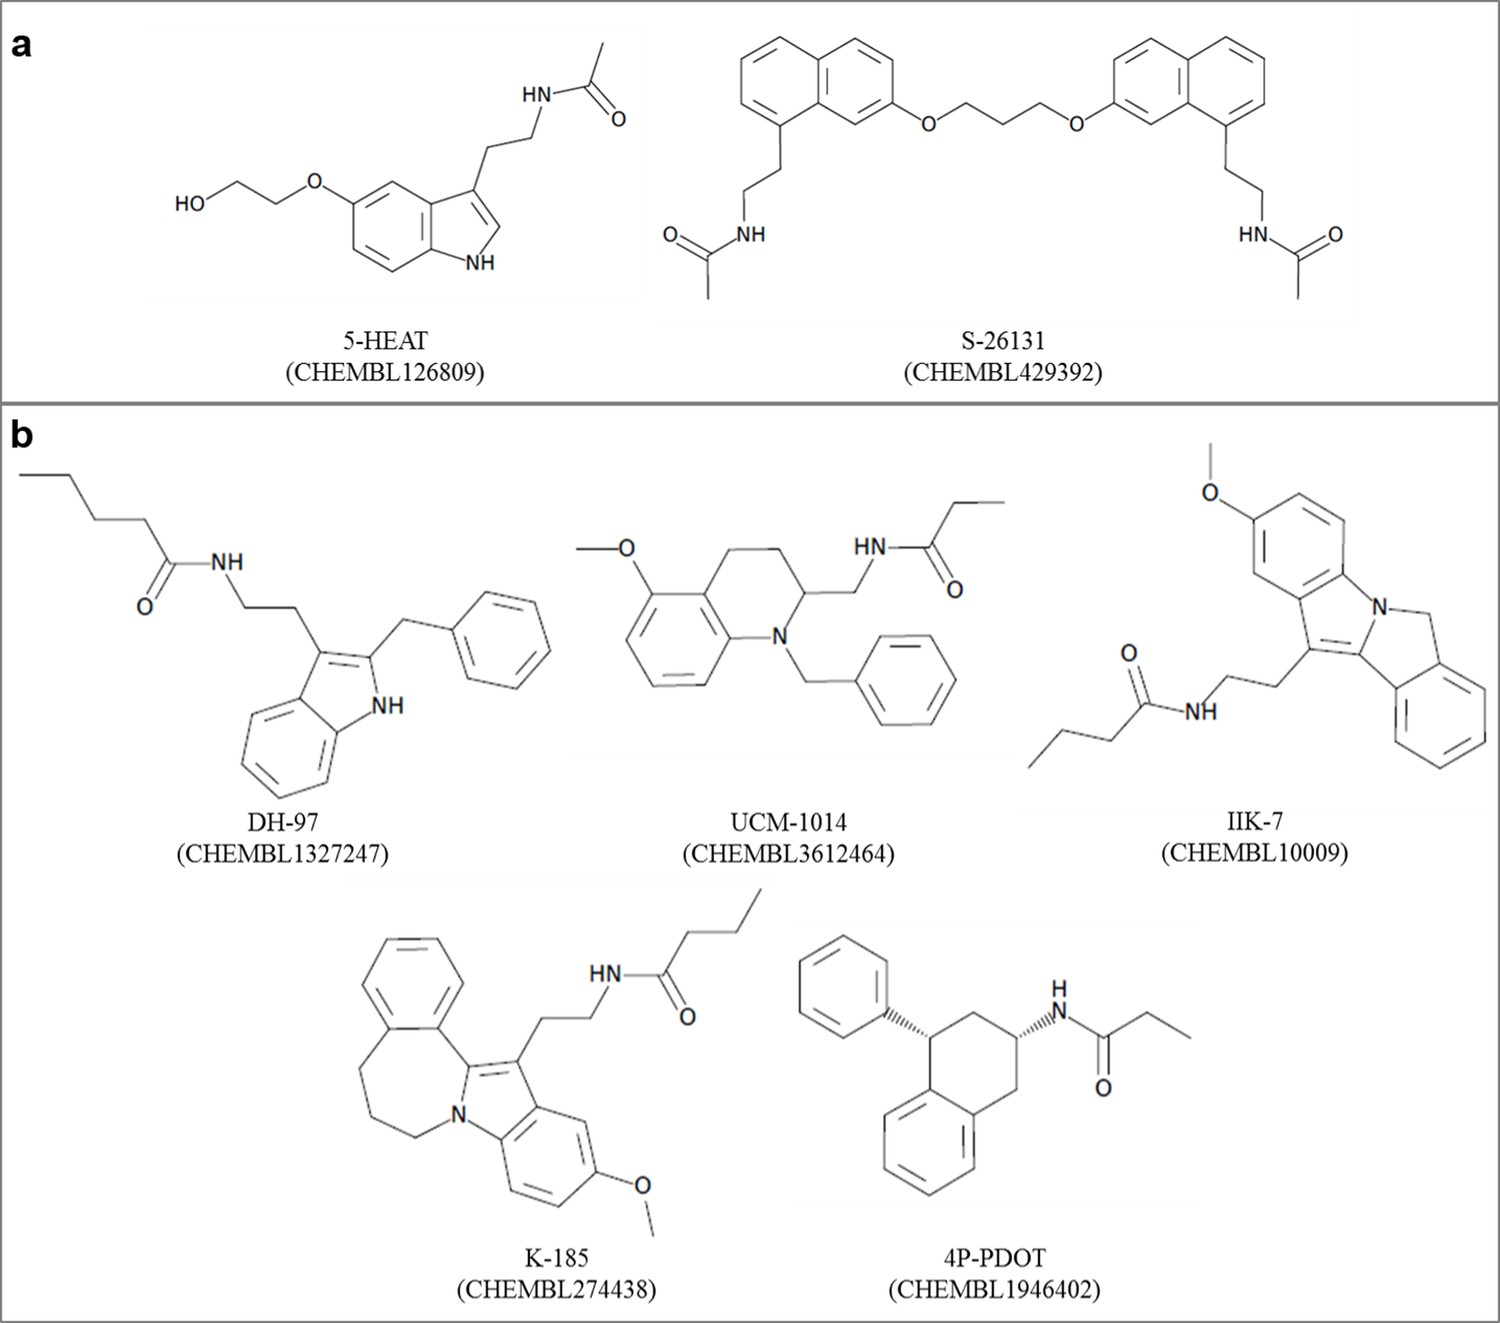
Chemical structures of known (a) MT1-selective and (b) MT2-selective ligands, used in the benchmark.
Figure 1—figure supplement 2
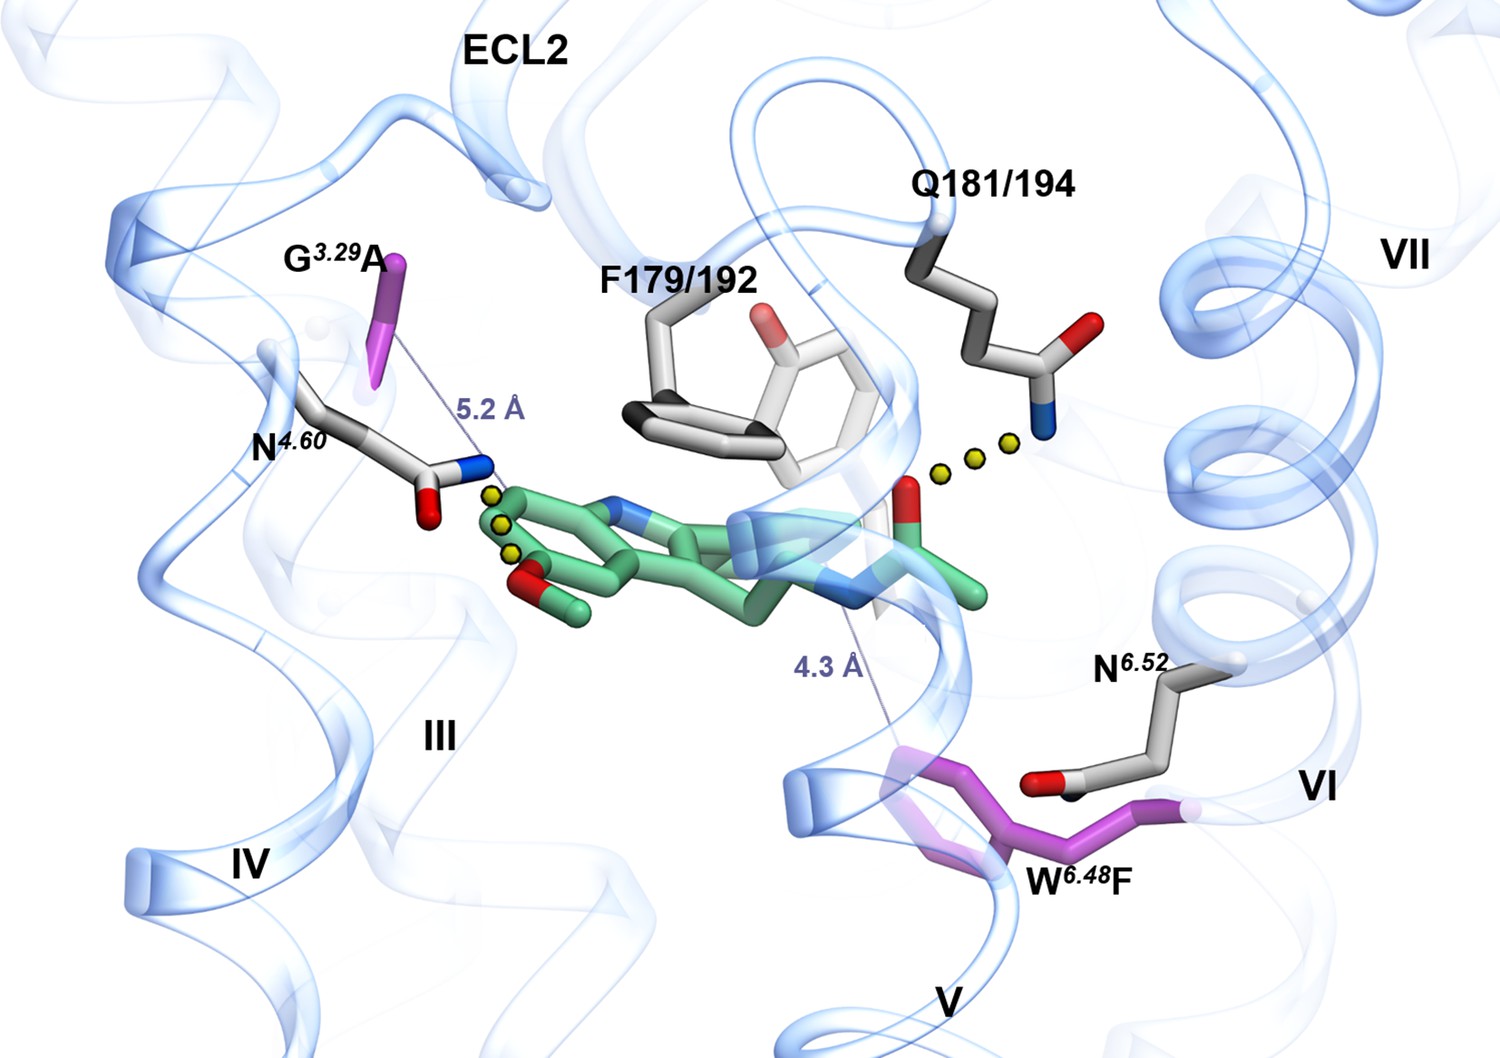
MT1 crystal structure in complex with 2-PMT (PDB id: 6ME3) displaying mutated residues near orthosteric ligand binding pocket.
Side chain heavy atoms displayed as stick representation in purple color for residues G3.29104A (in MT1 receptor) and W6.48251/264F (in MT1/MT2 receptors, respectively).
Figure 2 with 1 supplement
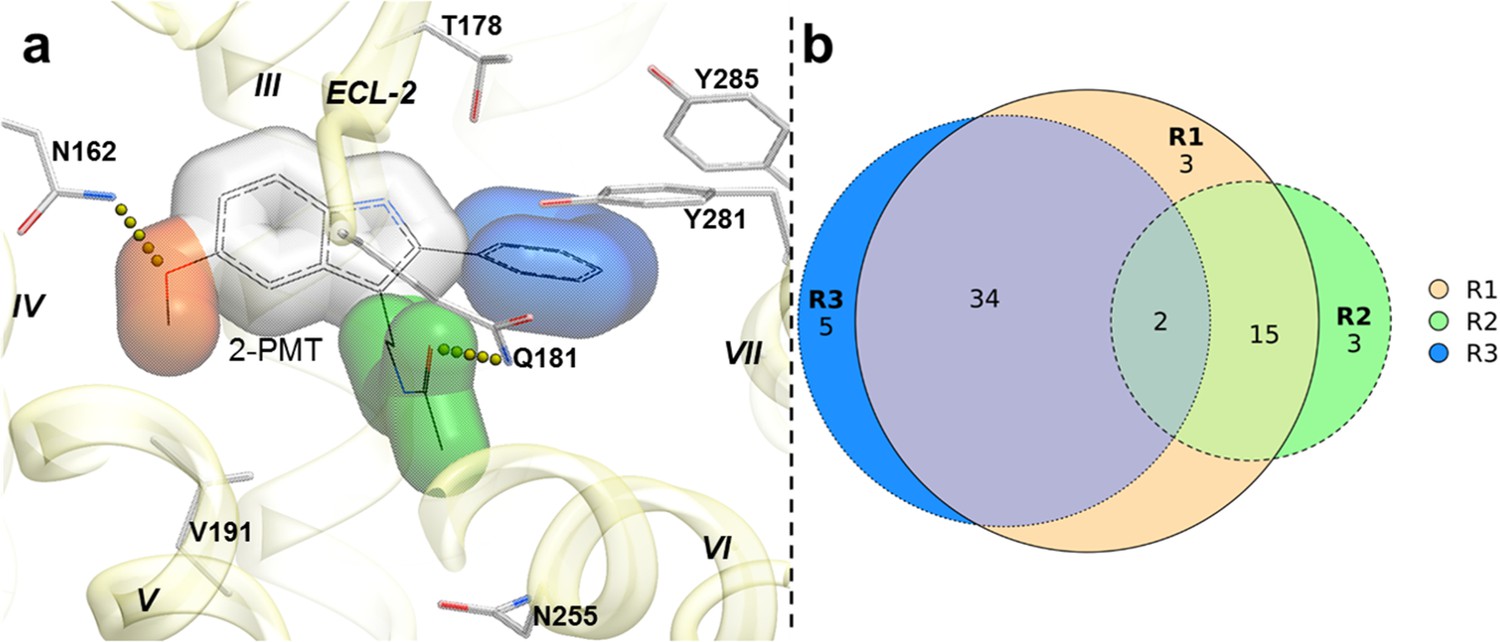
Structural features in selected hit candidate compounds.
(a) 2-phenylmelatonin in complex with MT1 receptor with the topology of chemical features shown as colored spheres indicating R1 (orange) = 5-methoxy, R2 (green) = alkylamido chain, and R3 (blue) = 2-phenyl substitutions, (b) Venn diagram summarizing the topologically equivalent chemical features in selected 62 candidate compounds from MT1 and MT2 VLS.
Figure 2—figure supplement 1
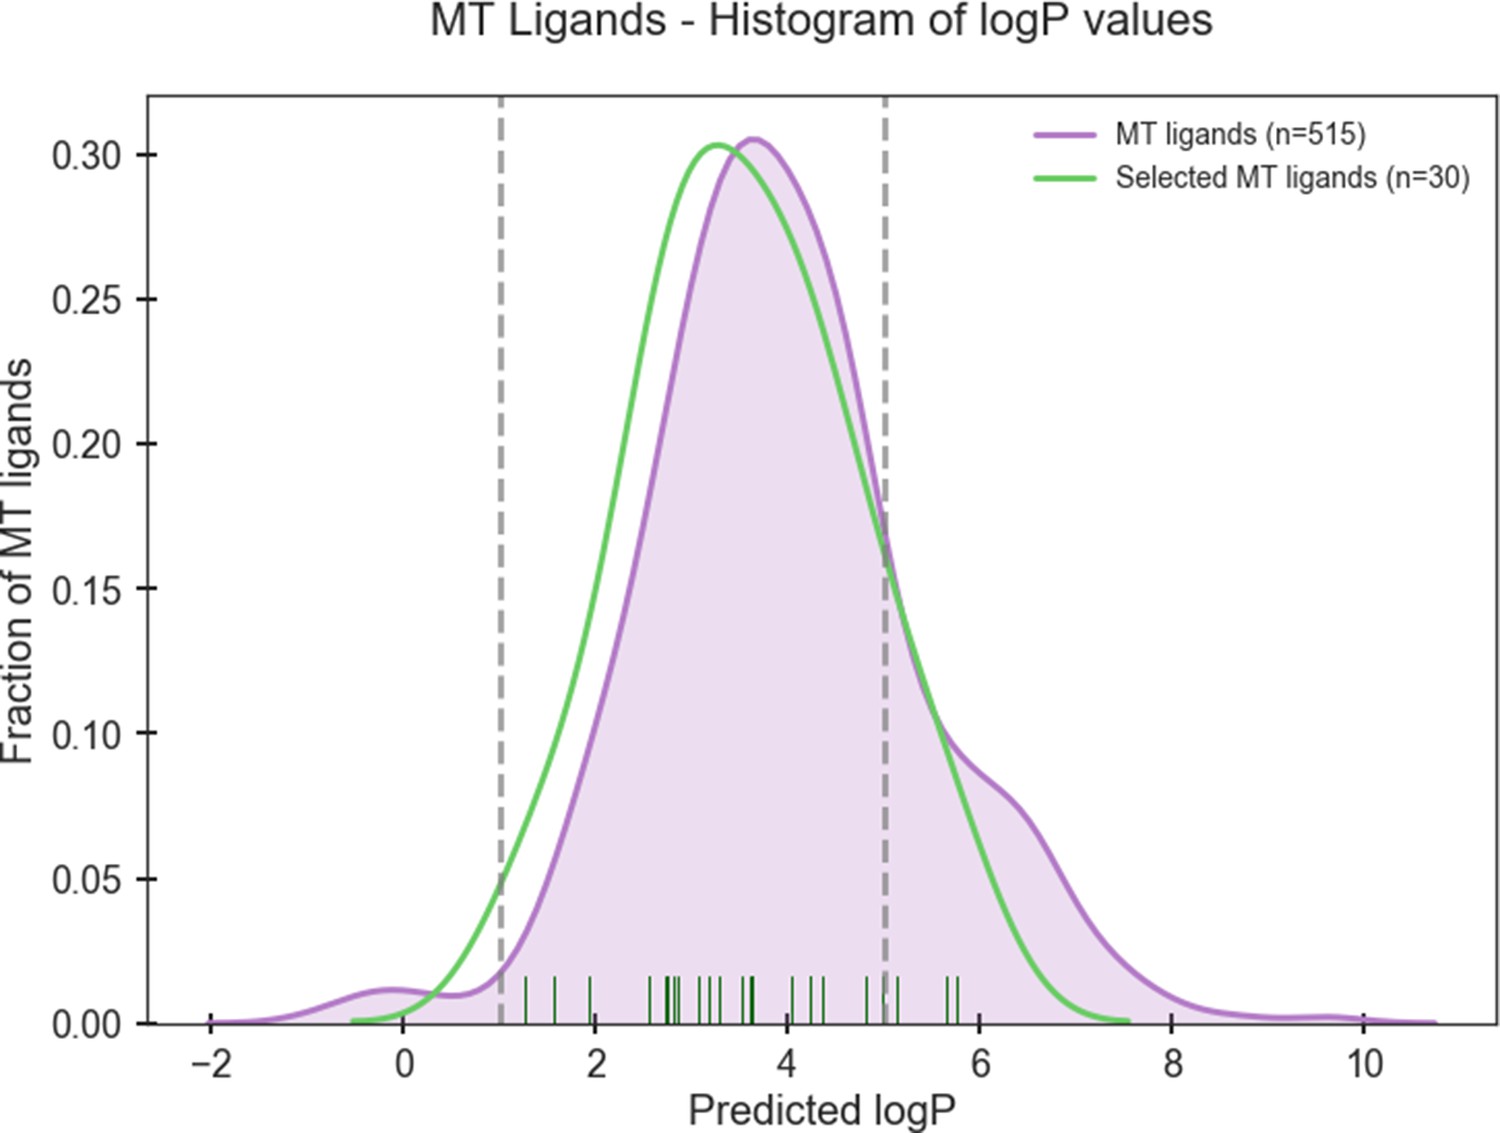
Histogram of predicted logP values of known high-affinity MT ligands (Nref = 515) from ChEMBL and selected MT ligands (Nsel = 30).
Figure 3 with 3 supplements
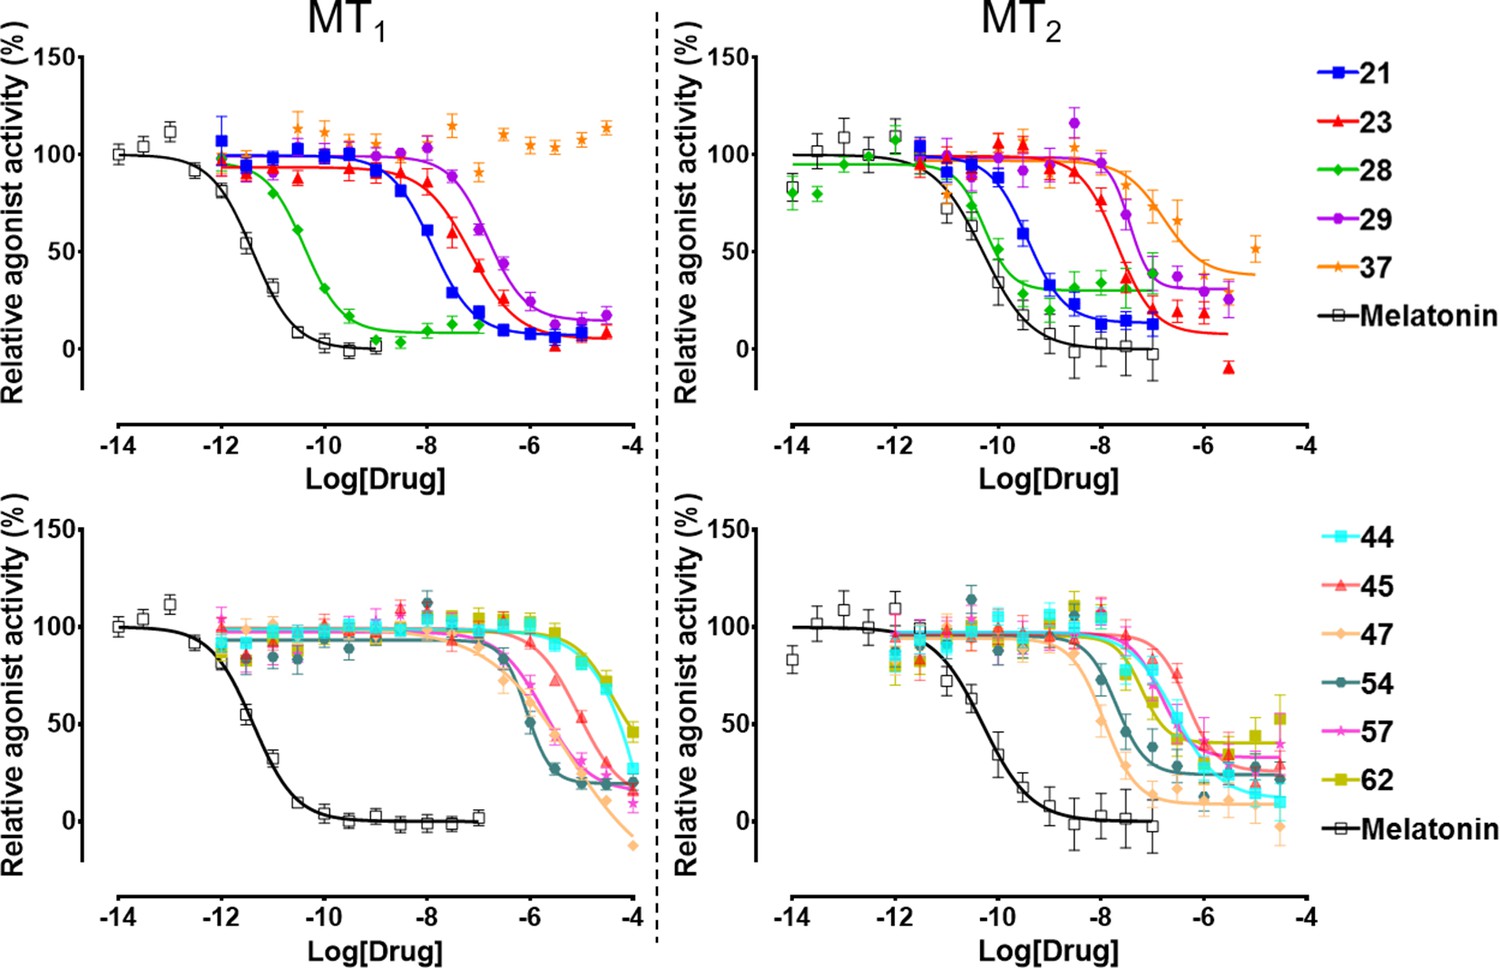
Functional characterization of selected VLS hits for agonist activity at MT1 and MT2 receptors in Gi/o-mediated cAMP production inhibition assays.
Results were normalized to the Emax value (%) of receptor activation by melatonin. These VLS hits showed no activity at control HEK293 T cells without transiently transfected MT1 or MT2 receptors (results not shown).
Figure 3—figure supplement 1
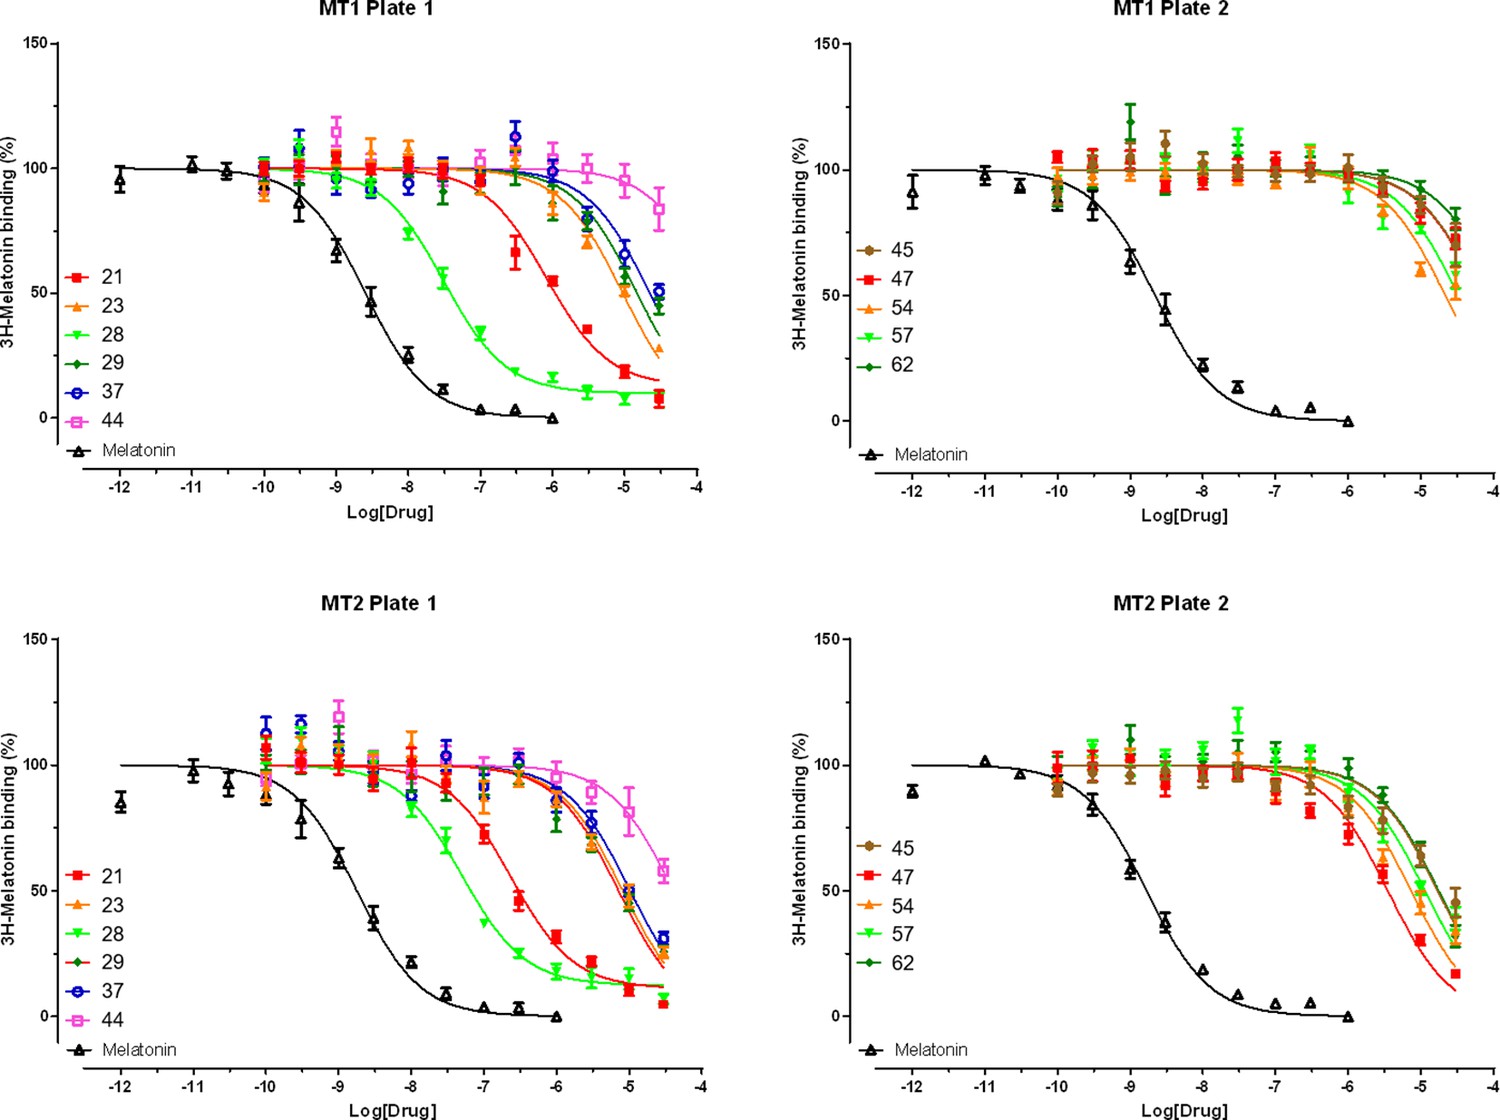
Radioligand 3H-Melatonin competition binding data for selected hit compounds.
Results are normalized (mean ± SEM) from three independent assays, pooled and analyzed in GraphPad Prism 7.0.
Figure 3—figure supplement 2

Tango assay measuring agonist-induced β-arrestin recruitment by MT1receptor.
Results were normalized to reference Melatonin (100%, mean ± SEM) from a minimum of three independent assays and pooled for analysis in GraphPad Prism 7.0.
Figure 3—figure supplement 3

Tango assay measuring agonist-induced β-arrestin recruitment by MT2receptor.
Results were normalized to reference Melatonin (100%, mean ± SEM) from a minimum of three independent assays and pooled for analysis in GraphPad Prism 7.0.
Chemical structure 1
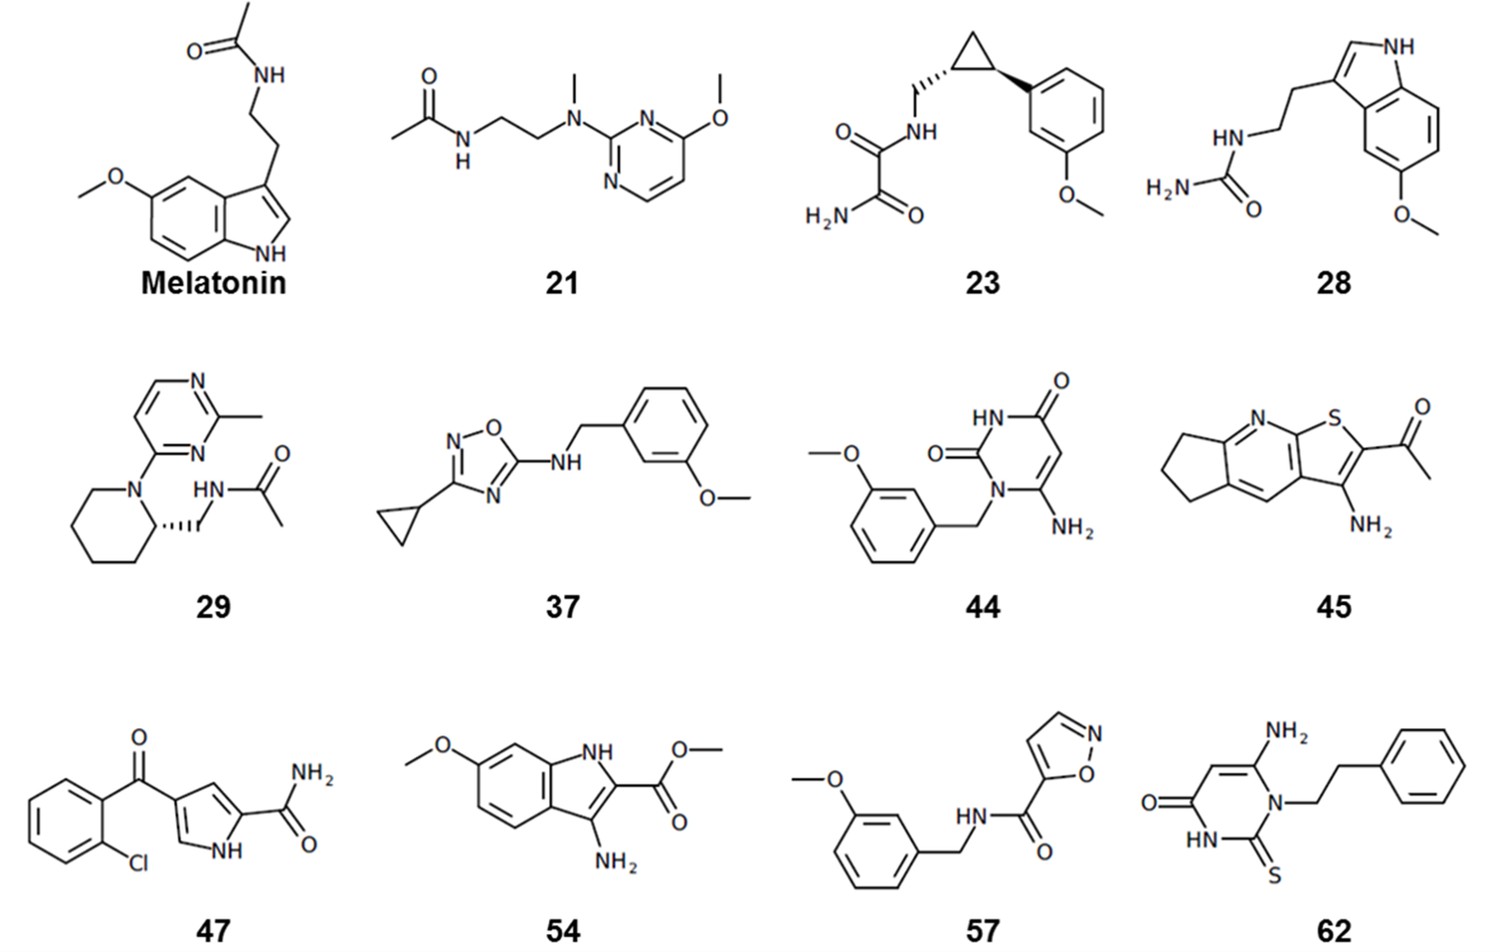
Chemical structures of hit compounds with EC50 <1 μM at the MT receptors.
Figure 4
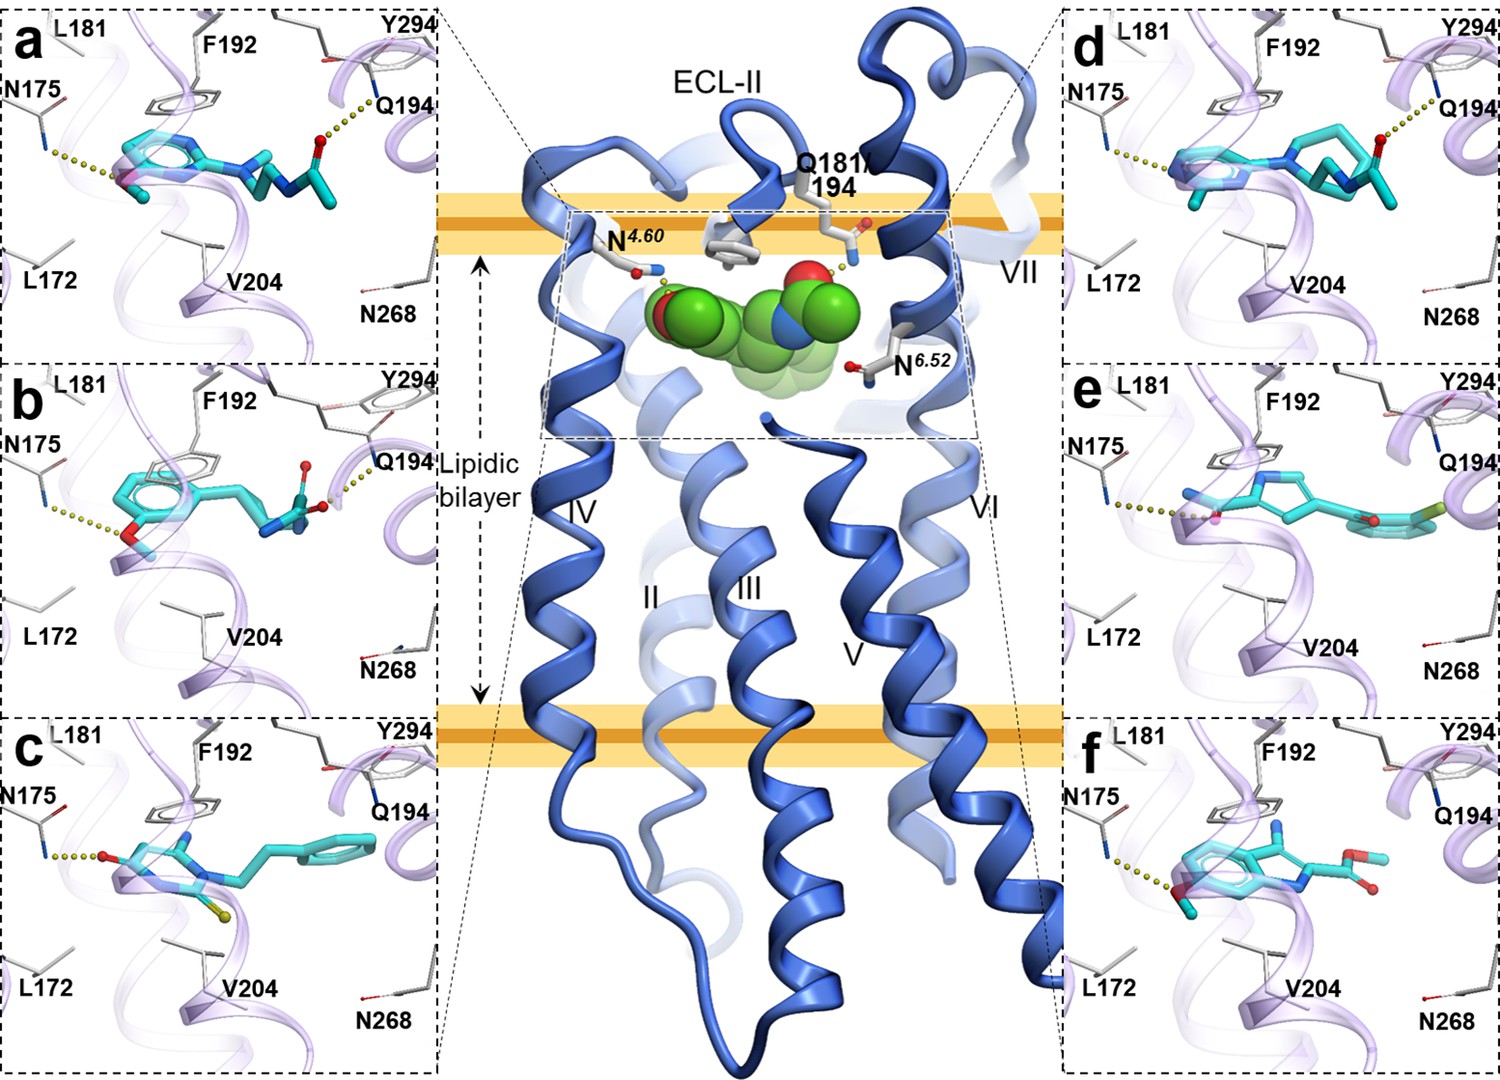
Predicted binding poses for top six new chemotypes discovered with VLS.
(a) 21, (b) 23, (c) 62, (d) 29, (e) 47 and (f) 54 inthe MT2receptor (purple). The center panel shows a canonical 7-TM receptor structure of MT2 receptor (blue helices; part of TM-V is not displayed for clarity) in complex with 2-phenylmelatonin shown as green spheres (PDB id: 6ME6).
Figure 5
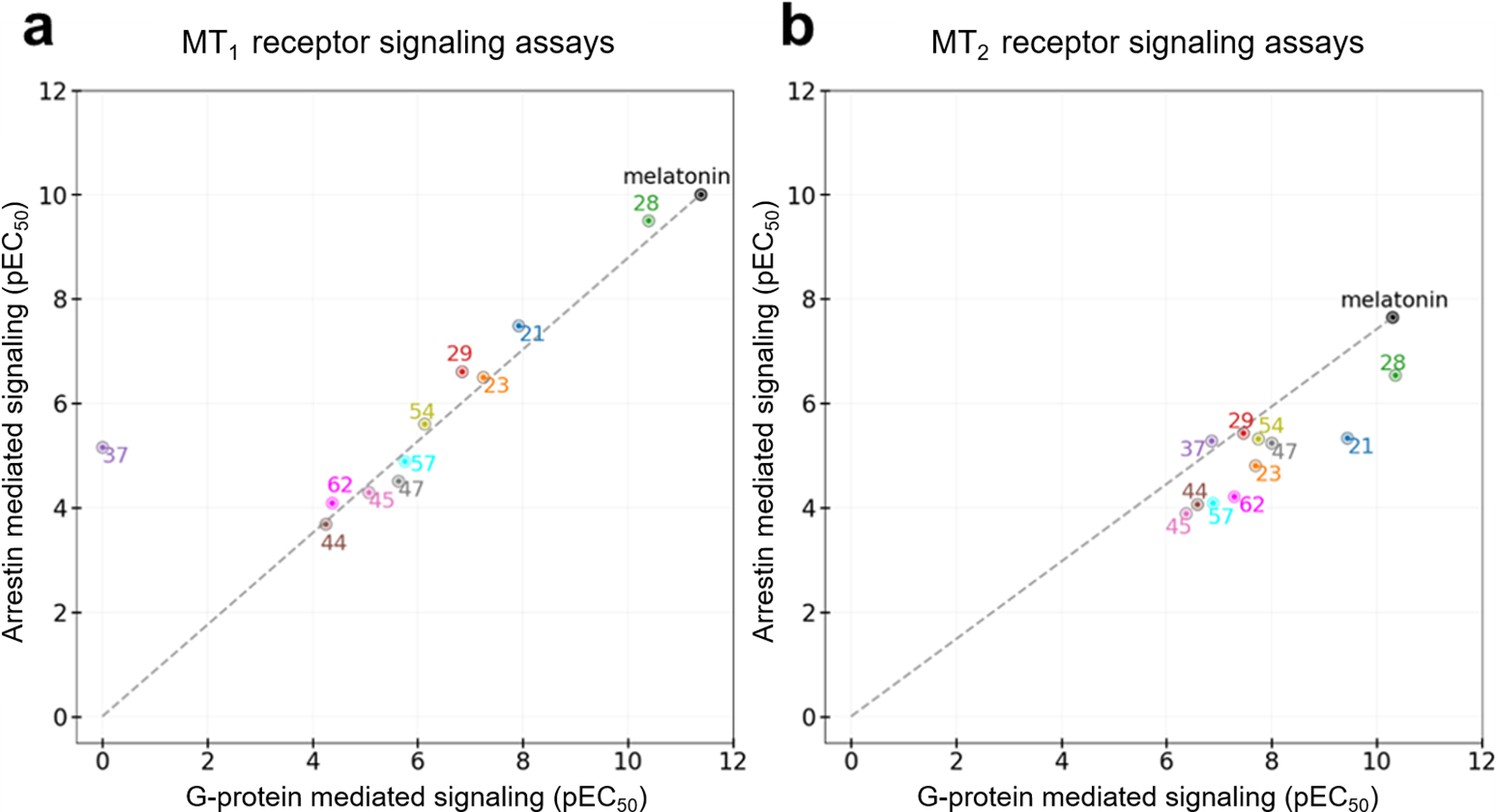
Functional selectivity of selected VLS hits at MT1 (a) and MT2 (b) receptors.
The pEC50 values of the ligands in G-Protein and Arrestin-mediated signaling assays are shown. The dashed lines for each receptor trace the melatonin datapoint to the origin, with compounds far above or below the line showing functional selectivity.
Figure 6 with 2 supplements
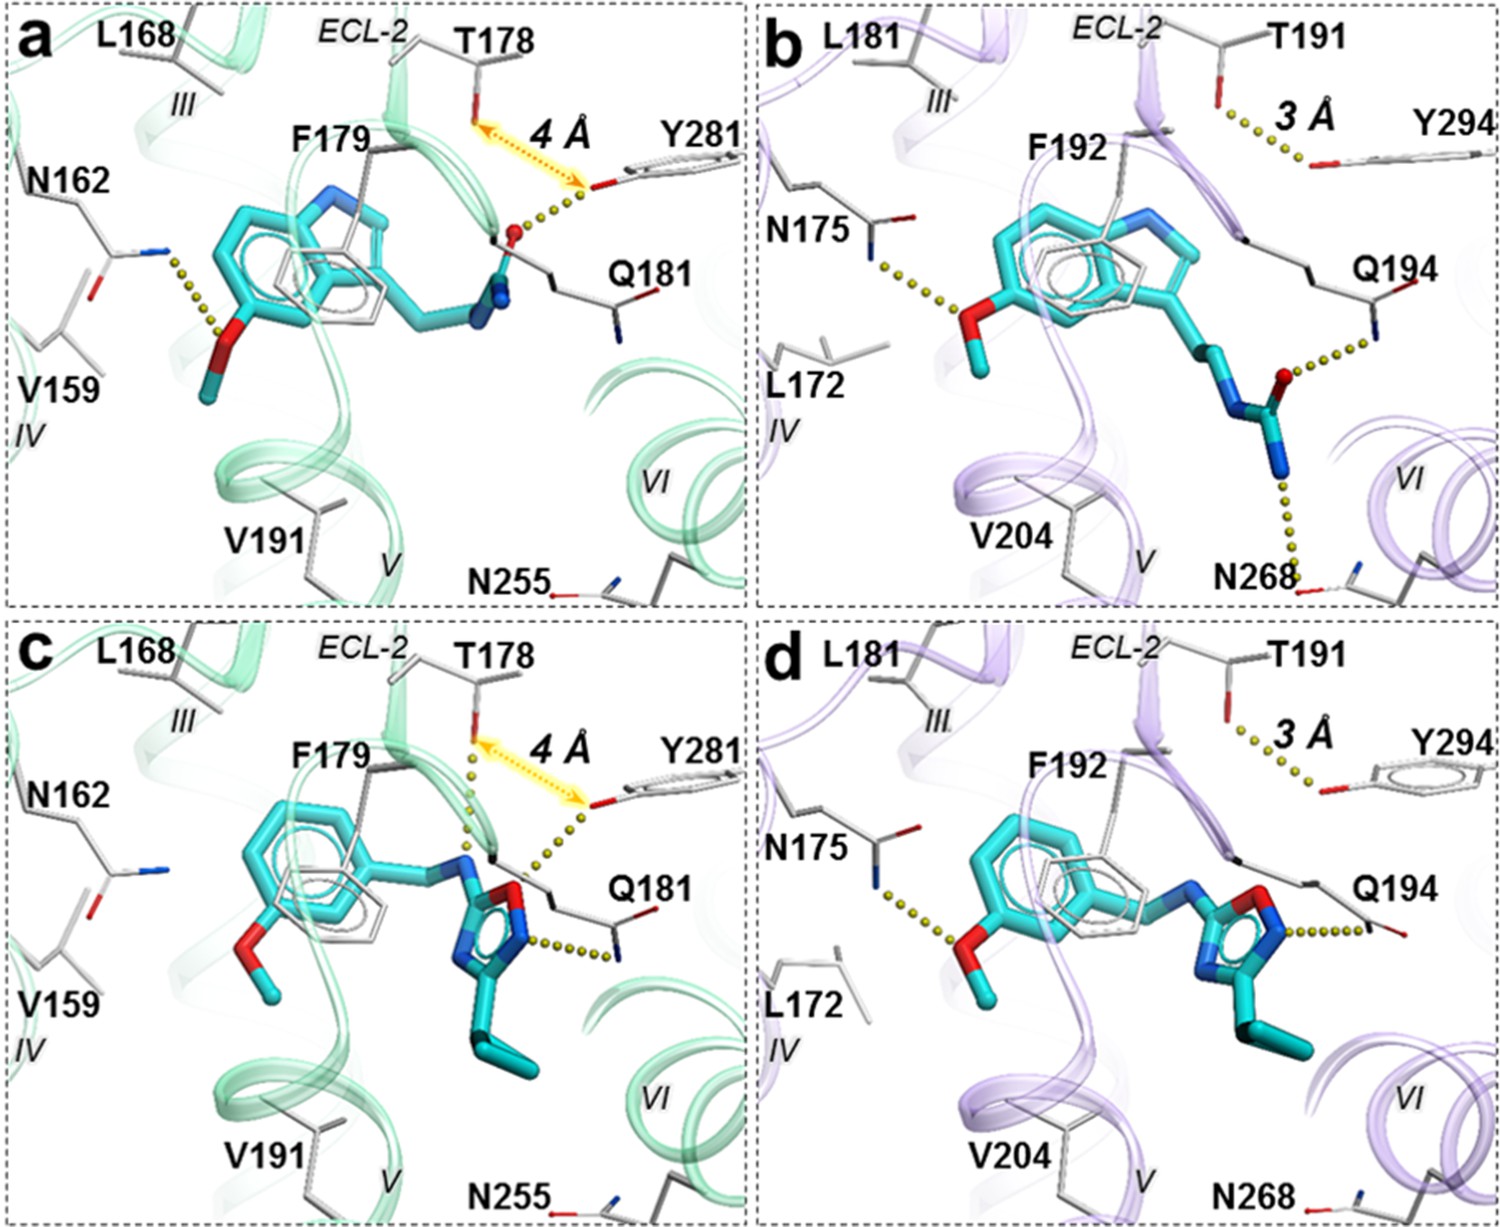
Predicted binding poses for compounds 28 (a, b), and 37 (c, d) in MT1 (light green) and MT2 (lavender) receptors, respectively.
The red dotted lines with arrows indicate a missing hydrogen bond between residues T178 and Y281 in MT1 receptor, while the yellow dots show hydrogen bonding interactions.
Figure 6—figure supplement 1
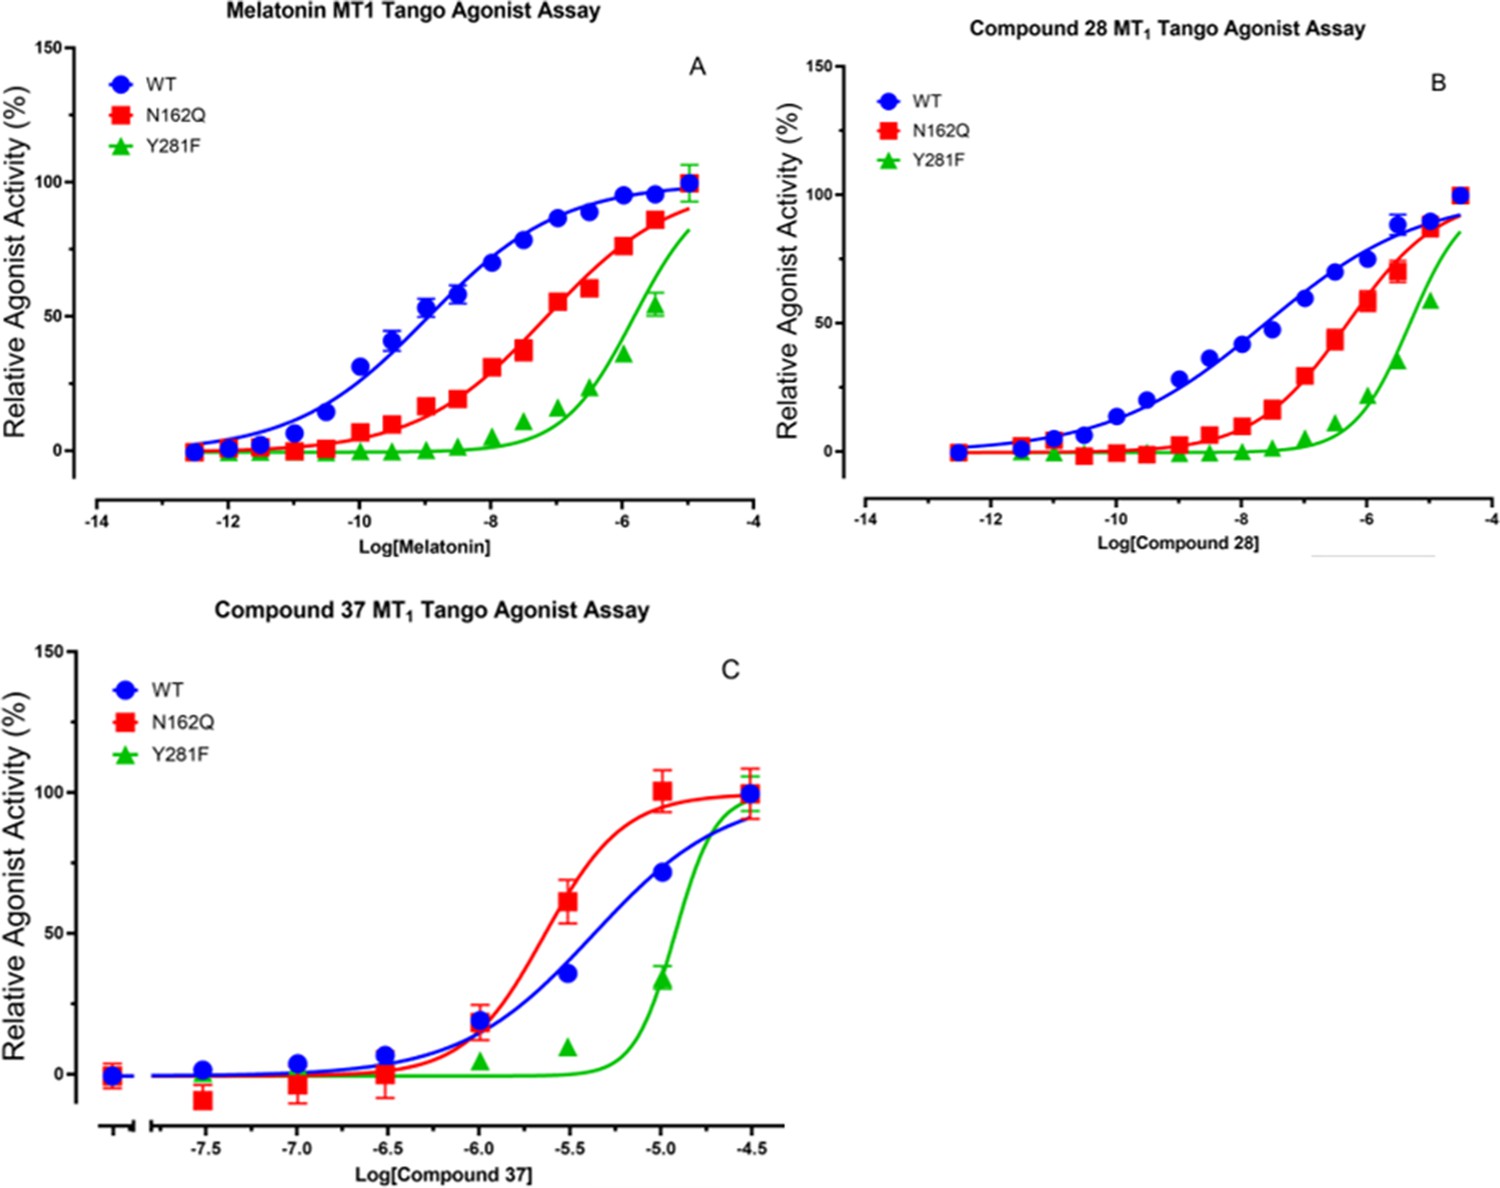
Tango functional assays with MT1 mutants for melatonin.
(A) Compound 28 (B) and 37 (C) at MT1 wildtype (WT), N162Q, and Y281F mutant receptors. Because mutations dramatically changed basal activity compared with MT1 WT receptor (N162Q increased and Y281F reduced), results were normalized individually (basal = 0% and maximum activity = 100%), represented means ± SEM from a minimum of 3 assays, each in triplicate or quadruplicate, and analyzed in Prism 8.0 with the built-in logistic function (variable slope). The resulting values of pEC50 are: Melatonin: WT: pEC50 = 8.98 ± 0.04; N162Q: pEC50 = 7.18 ± 0.04; Y281F: pEC50 = 5.85 ± 0.03 Comp 28: WT: pEC50 = 7.64 ± 0.04; N162Q: pEC50 = 6.33 ± 0.04; Y281F: pEC50 = 5.33 ± 0.02 Comp 37: WT: pEC50 = 5.38 ± 0.02; N182Q: pEC50 = 5.65 ± 0.05; Y281F: pEC50 = 4.93 ± 0.02.
Figure 6—figure supplement 2
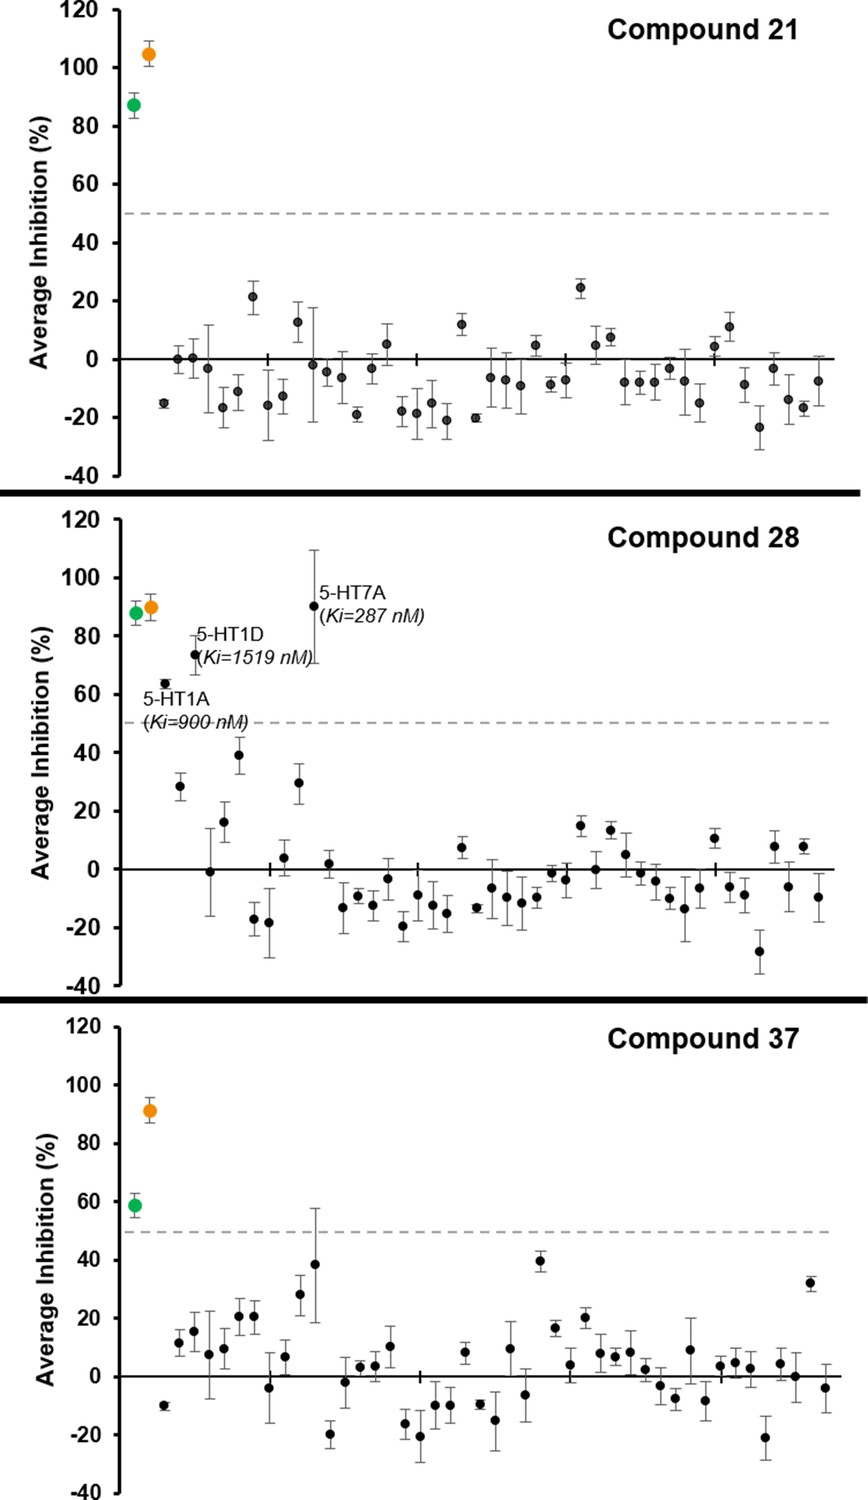
Binding activities of Compounds 21, 28 and 37 at a set of 47 potential off-targets.
The panle includes GPCRs, ion-channels and transporters in radioligand binding assay. Values represent average target inhibition (%) at 10 μM concentration and corresponding SEM values from 4 replicates. Targets with ≥50% inhibition at 10 μM concentration are labeled in the plots with average affinity (Ki) values from 3 independent assays, each in triplicate. Dashed line indicate 50% inhibition level, and green and orange dots mark MT1 and MT2 receptors’ average inhibition values, respectively.
Tables
Table 1
Hit compounds from VLS with Gi/o mediated potency EC50 <1 µM for at least one MT receptor.
| MT1 | MT2 | MT2/MT1 | ||||||||||
|---|---|---|---|---|---|---|---|---|---|---|---|---|
| Compound | pKi ± SEM* | pEC50 ± SEM | EC50(nM) | Emax† ± SEM | LE‡c | pKi ± SEM | pEC50 ± SEM | EC50(nM) | Emax ± SEM | LE | Selectivity§ | Tanimoto¶ |
| 21 | 6.31 ± 0.11 | 7.91 ± 0.05 | 12.0 | 93.8 ± 2.5 | 0.69 | 6.91 ± 0.05 | 9.44 ± 0.08 | 0.36 | 86.1 ± 3.2 | 0.83 | 30.6 | 0.50 |
| 23 | 5.42 ± 0.03 | 7.16 ± 0.09 | 57.5 | 96.9 ± 5.3 | 0.56 | 5.56 ± 0.13 | 7.69 ± 0.08 | 20.42 | 91.7 ± 3.0 | 0.60 | 2.7 | 0.22 |
| 28 | 7.78 ± 0.10 | 10.39 ± 0.04 | 0.04 | 95.3 ± 2.6 | 0.86 | 7.63 ± 0.08 | 10.35 ± 0.10 | 0.04 | 69.4 ± 4.0 | 0.85 | 0.7 | 0.05 |
| 29 | 5.22 ± 0.07 | 6.83 ± 0.06 | 144.5 | 87.5 ± 4.5 | 0.53 | 5.61 ± 0.05 | 7.46 ± 0.10 | 34.67 | 69.4 ± 8.0 | 0.58 | 3.3 | 0.43 |
| 37 | 5.07 ± 0.13 | ND | >30000 | ND | ND | 5.45 ± 0.10 | 6.85 ± 0.19 | 141.25 | 61.1 ± 9.1 | 0.53 | >1000.0 | 0.57 |
| 44 | 4.19 ± 0.36 | 3.33 ± 0.36 | 57544.0 | 72.8 ± 4.7 | 0.33 | 4.95 ± 0.30 | 6.58 ± 0.13 | 263.03 | 88.9 ± 6.3 | 0.51 | 267.2 | 0.59 |
| 45 | 4.54 ± 0.15 | 5.06 ± 0.12 | 8709.6 | 90.6 ± 14.3 | 0.44 | 5.26 ± 0.19 | 6.37 ± 0.13 | 426.58 | 75.0 ± 7.4 | 0.56 | 16.9 | 0.59 |
| 47 | 4.58 ± 0.07 | 5.25 ± 0.16 | 2344.2 | 112.4 ± 5.2 | 0.46 | 5.91 ± 0.12 | 7.99 ± 0.10 | 10.23 | 91.7 ± 3.0 | 0.66 | 186.9 | 0.60 |
| 54 | 5.03 ± 0.06 | 6.06 ± 0.07 | 741.3 | 82.8 ± 4.3 | 0.54 | 5.56 ± 0.10 | 7.74 ± 0.10 | 18.20 | 75.0 ± 3.7 | 0.68 | 36.9 | 0.43 |
| 57 | 4.84 ± 0.03 | 5.72 ± 0.11 | 1778.3 | 87.5 ± 9.1 | 0.47 | 5.37 ± 0.04 | 6.88 ± 0.15 | 131.83 | 66.7 ± 8.3 | 0.57 | 10.3 | 0.53 |
| 62 | 4.32 ± 0.11 | 4.39 ± 0.42 | 42658.0 | 54.1 ± 10.0 | 0.36 | 5.49 ± 0.33 | 7.28 ± 0.14 | 52.48 | 58.3 ± 4.8 | 0.60 | 875.9 | 0.64 |
| Melatonin | 9.06 ± 0.14 | 11.38 ± 0.06 | 0.004 | 100.0 ± 5.6 | 0.93 | 9.27 ± 0.14 | 10.30 ± 0.14 | 0.05 | 100.0 ± 5.6 | 0.84 | 0.1 | 0.00 |
-
Standard error of the mean, N = 3.
† Activation compared to melatonin.
-
Ligand efficiency (based on EC50).
§Selectivity in folds (calculated as: Antilog (log(Emax/EC50) MT2- log (Emax/EC50) MT1)). MT1 selectivity is shown as underlined values.
-
¶ Tanimoto distance from closest MT receptor ligands in ChEMBL database with pAct >6. Hits with EC50 <100 nM are displayed in bold, and with Emax <70% in italic.
Key resources table
| Reagent type (species) or resource | Designation | Source or reference | Identifiers | Additional information |
|---|---|---|---|---|
| Cell line (Homo sapiens) | HTLA cells (HEKT based) | PMID:25895059 | ||
| Transfected construct (Homo sapiens) | MTNR1A | PMID:25895059 | AddGene #66443 | |
| Recombinant DNA reagent, PCR primers | MTNR1A N162Q Forward | This paper | CTGCCGTCCTGCCGcaaCTGAGGGCAGGCAC | |
| Recombinant DNA reagent, PCR primers | MTNR1A N162Q Reverse | This paper | GTGCCTGCCCTCAGttgCGGCAGGACGGCAG | |
| Recombinant DNA reagent, PCR primers | MTNR1A Y281F Forward | This paper | GTTCGTAGCGAGCTtCTACATGGCTTAC | |
| Recombinant DNA reagent, PCR primers | MTNR1A Y281F Reverse | This paper | GTAAGCCATGTAGaAGCTCGCTACGAAC | |
| Commercial assay or kit | BrightGlo Reagent | Promega.com | Cat # E2610 | |
| Chemical compound, drug | Hit compounds | Enamine, Molport, Chembridge | See 62 compounds listed in Supplementary file 1 | |
| Software, algorithm | ICM-Pro, V3.8–7 | Molsof.com | ||
| cell line (Homo sapiens) | HEK293 T | ATCC | CRL-11268 | |
| transfected construct (Homo sapiens) | Human MT1 | PMID:31019306 | ||
| Chemical compound, drug | Luciferin | Goldbio.com | Cat#: LUCNA-1G |
Additional files
-
Supplementary file 1
Selected 62 compounds from VLS that were acquired and tested experimetnally.
The table lists vendors invormation, and Tanimo distances to the closest known MT ligands in ChEMBL database.
- https://cdn.elifesciences.org/articles/53779/elife-53779-supp1-v2.docx
-
Supplementary file 2
Detailed QC data for the selected 62 compounds.
- https://cdn.elifesciences.org/articles/53779/elife-53779-supp2-v2.zip
-
Transparent reporting form
- https://cdn.elifesciences.org/articles/53779/elife-53779-transrepform-v2.docx
Download links
A two-part list of links to download the article, or parts of the article, in various formats.
Downloads (link to download the article as PDF)
Open citations (links to open the citations from this article in various online reference manager services)
Cite this article (links to download the citations from this article in formats compatible with various reference manager tools)
Structure-based discovery of potent and selective melatonin receptor agonists
eLife 9:e53779.
https://doi.org/10.7554/eLife.53779


