Stimulus salience determines defensive behaviors elicited by aversively conditioned serial compound auditory stimuli
- F.M. Kirby Neurobiology Center, Boston Children's Hospital and Harvard Medical School, United States
- Program in Neuroscience, Harvard Medical School, United States
- Departments of Psychiatry and Neurology, Boston Children's Hospital, United States
Figures
Figure 1 with 2 supplements

White noise elicits active fear responses during SCS conditioning regardless of temporal relationship to the US.
(A–C) Protocol and structure of stimuli applied during conditioning for paired and unpaired groups. (D–F) Motion indices (mean ± SEM) showing movement in the absence or presence of stimuli (10 × 7.5 kHz pips, 75 dB, 0.5 s each at 1 Hz, blue; 10x white noise (WN) pips, 75 dB, 0.5 s each at 1 Hz, pink; 1 × 0.9 mA footshock, 1 s, yellow) for all 10 conditioning trials (Days 1 and 2). (G–I) Percentage time spent freezing during baseline (BL, 3 min prior to the first stimulus presented each day) and trials across each conditioning day. (J–L) Average motion during BL and trials. (M–O) Active fear behavior during each trial quantified as an escape score (see Materials and methods). CS order and pairing: group 1 (D,G,J,M: CS1 = 7.5 kHz, CS2 = WN; n = 15), group 2 (E,H,K,N: CS1 = WN, CS2 = 7.5 kHz; n = 10), and group 3 (F,I,L,O: CS1 = 7.5 kHz, CS2 = WN, gap; n = 10). Asterisks indicate significant difference between stimuli for a given trial (Two-way Repeated Measures ANOVA with Sidak multiple comparison test. Error bars indicate the SEM.
-
Figure 1—source data 1
Raw data used to generate freezing, motion, and escape score plots and traces.
- https://cdn.elifesciences.org/articles/53803/elife-53803-fig1-data1-v2.xlsx
-
Figure 1—source data 2
All statistical tests and significant comparisons with F and P values.
- https://cdn.elifesciences.org/articles/53803/elife-53803-fig1-data2-v2.xlsx
Figure 1—figure supplement 1

Mice trained in a paired SCS protocol acutely freeze to tone presentation in a novel context, demonstrating Pavlovian Conditioning.
(A,B) Protocol and structure of stimuli applied during conditioning. (C,D) Motion indices (mean ± SEM) in a novel context tone test for mice trained on a paired (C, n = 8) or gap (D, n = 7) SCS conditioning protocol, showing a single 10 s presentation of 7.5 kHz tone pips; onset of tone stimuli is indicated by light blue shading. Blue segments of the motion trace indicate statistically-significant decreases from the baseline (p<0.05; multivariate permutation tests). (E) Paired but not gap trained mice show significantly increased freezing in response to 7.5 kHz tone presentations. Error bars indicate SEM.
-
Figure 1—figure supplement 1—source data 1
Raw data used to generate motion traces and freezing graph.
- https://cdn.elifesciences.org/articles/53803/elife-53803-fig1-figsupp1-data1-v2.xlsx
-
Figure 1—figure supplement 1—source data 2
All statistical tests and significant comparisons with F and P values.
- https://cdn.elifesciences.org/articles/53803/elife-53803-fig1-figsupp1-data2-v2.xlsx
Figure 1—figure supplement 2
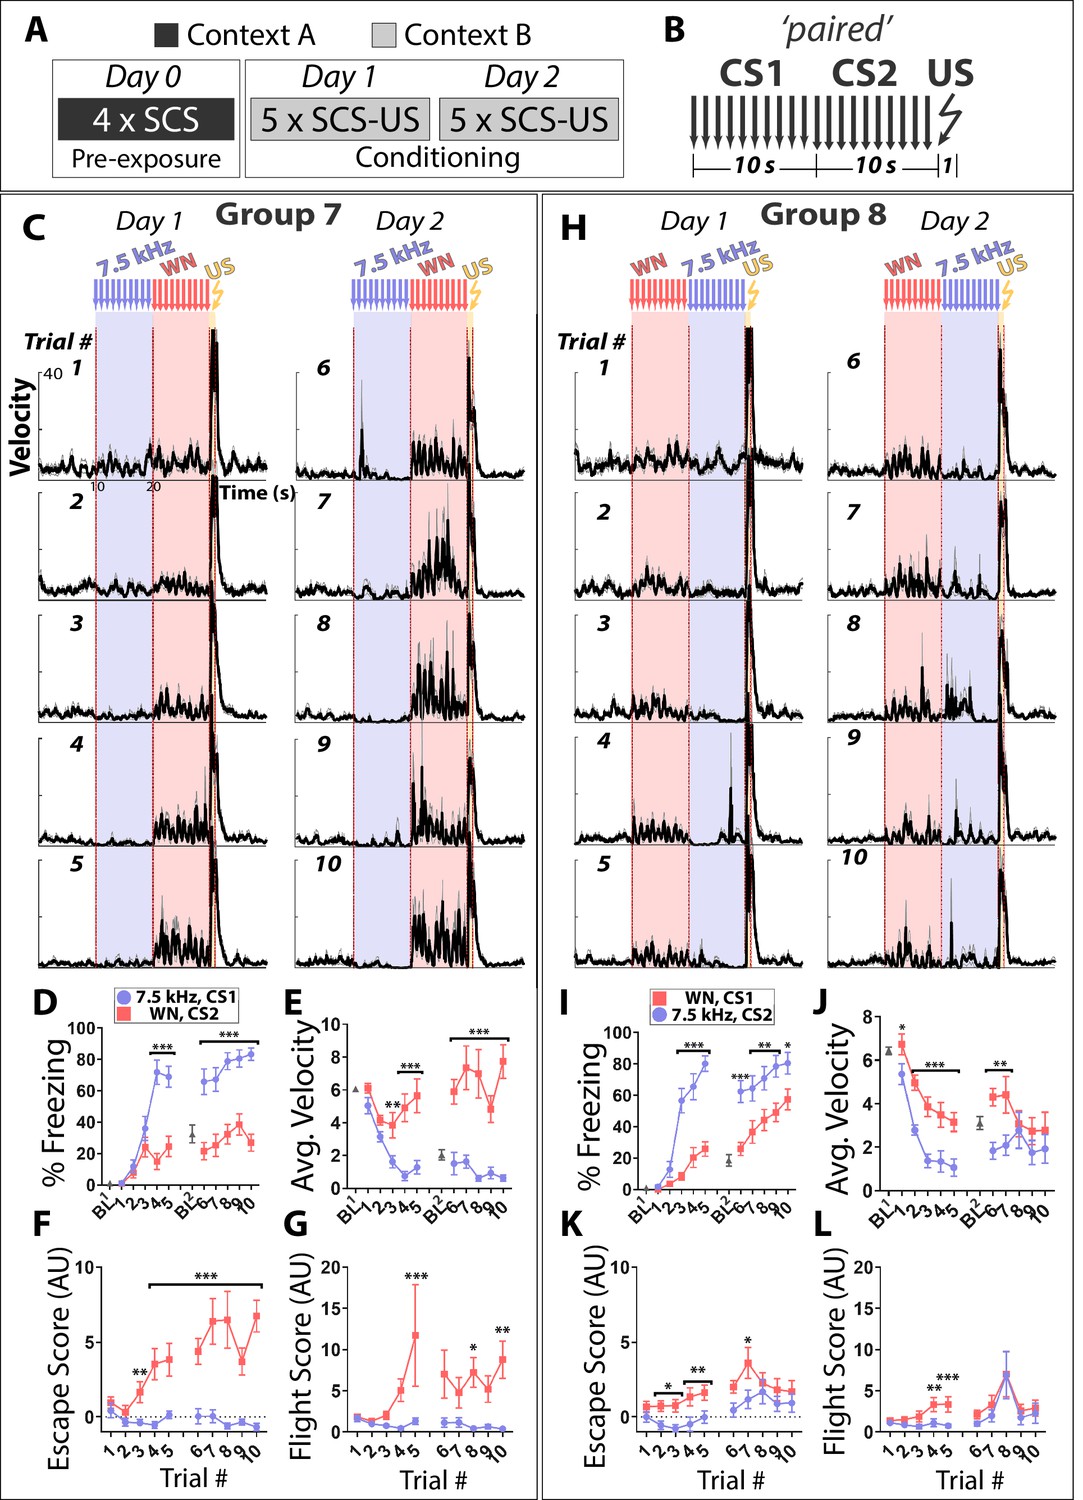
Reversing order of tone and white noise presentation during SCS conditioning does not reverse the behaviors these stimuli elicit in C57Bl6/J mice.
(A,B) Protocol and structure of stimuli applied during conditioning for two paired groups. (C,H) Motion indices (mean ± SEM) showing movement in the absence or presence of stimuli (10 × 7.5 kHz pips, 75 dB, 0.5 s each at 1 Hz, blue; 10x white noise (WN) pips, 75 dB, 0.5 s each at 1 Hz, pink; 1 × 0.9 mA footshock, 1 s, yellow) for all 10 conditioning trials (Days 1 and 2) Group 7 (C) was trained with a tone-white noise SCS; Group 8 (H) was trained with a white noise-tone SCS. (D,I) Percentage time spent freezing during baseline (BL, 3 min prior to the first stimulus presented each day) and each trial (SCS presentation) across each conditioning day. (E,J) Average velocity during BL and trials. (F,K) Active fear behavior during each trial quantified by escape score (G) or flight Score (Fadok et al., 2017) (L), which yielded similar results. Both groups, n = 12 per group. Black asterisks indicate significant difference between groups for a given trial. Asterisks indicate significant difference between stimuli for a given trial. Error bars indicate SEM.
-
Figure 1—figure supplement 2—source data 1
Raw data used to generate freezing, velocity, escape score, and flight score plots and traces.
- https://cdn.elifesciences.org/articles/53803/elife-53803-fig1-figsupp2-data1-v2.xlsx
-
Figure 1—figure supplement 2—source data 2
All statistical tests and significant comparisons with F and P values.
- https://cdn.elifesciences.org/articles/53803/elife-53803-fig1-figsupp2-data2-v2.xlsx
Figure 2
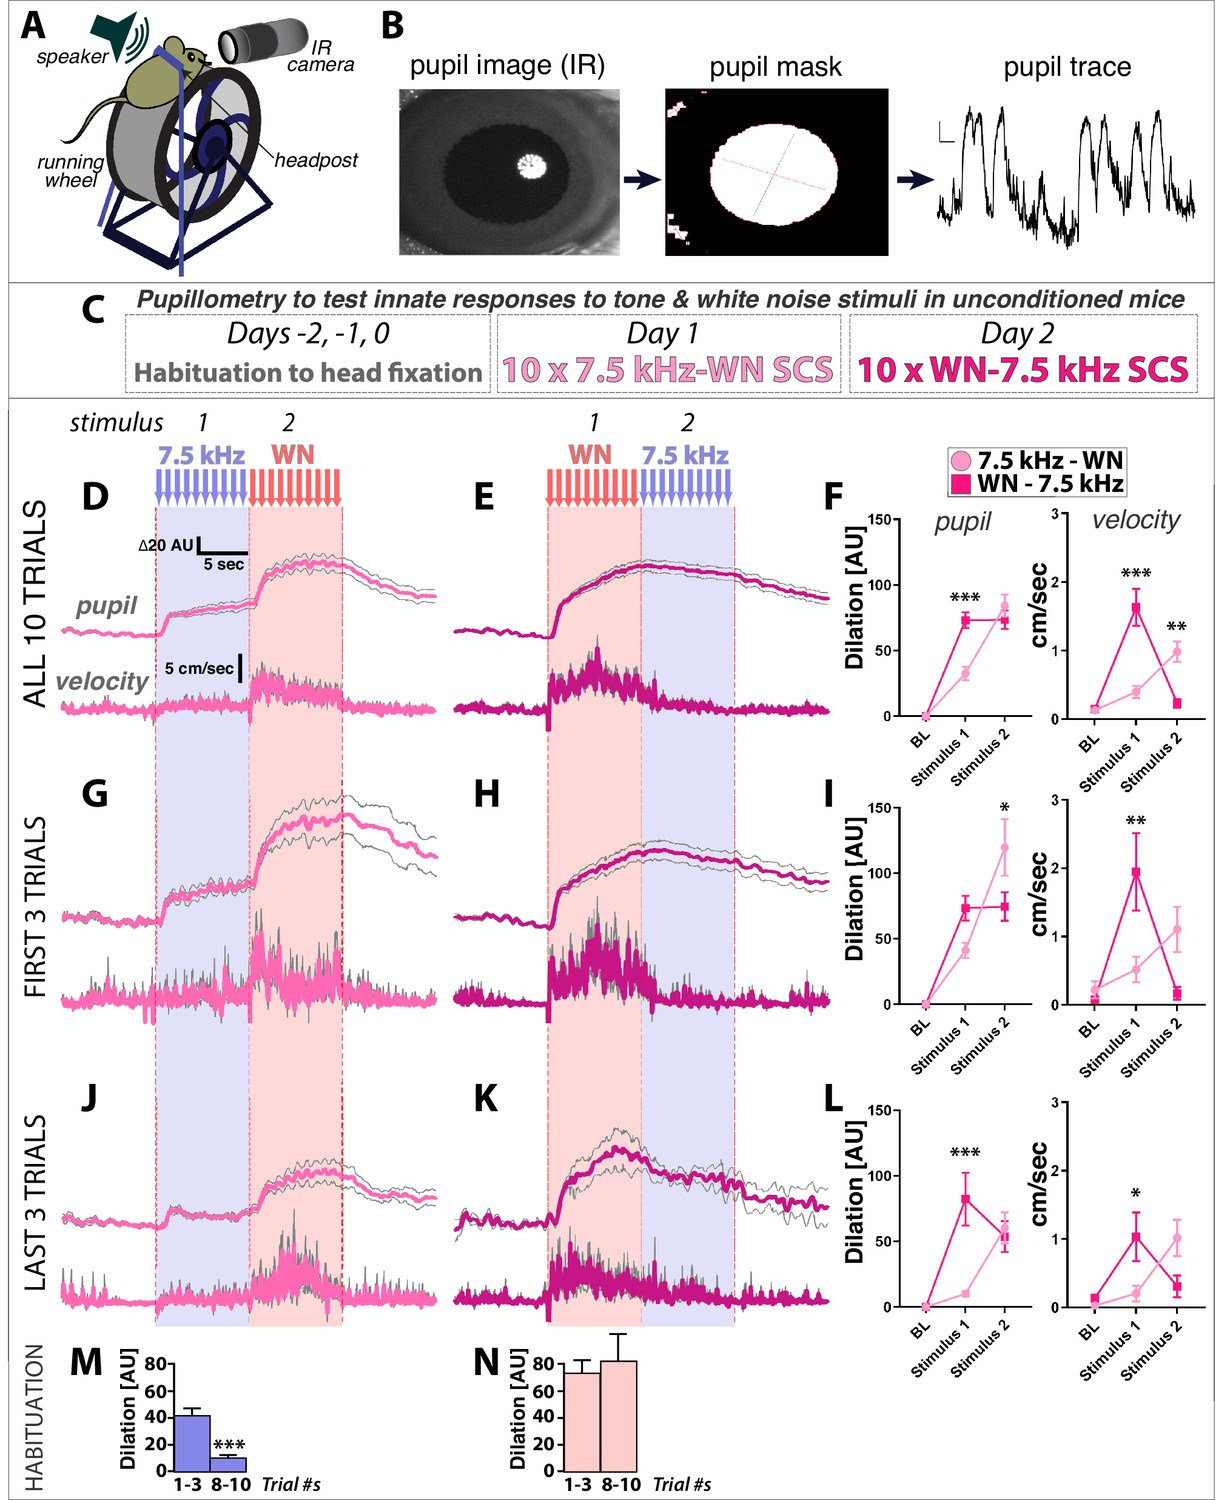
White noise is more innately arousing than 7.5 kHz tones in naïve, unconditioned mice.
(A–C) Pupillometry setup, data processing, and protocol for measuring innate physiological responses to 7.5 kHz tone and white noise (WN) stimuli in unconditioned mice. (D,E) Pupil diameter relative to baseline (top traces) and running wheel velocity (bottom traces) are (F) both significantly greater in response to WN than tones. (G–L) Comparison of the first three (G–I) versus last three (J–L) trials reveals that responses to tones habituate more rapidly than to WN (insets, (J,K). Two-Way ANOVA (stimulus, group) with Sidak’s multiple comparison tests (F,I,L) for pupil dilation relative to baseline (left) were done using mean values during the last 5 s of stimulus presentations (to account for slow kinetics of dilation), and for running wheel velocity (right) on mean values over the full 10 s stimulus presentations. (M,N) Comparison of first three versus last three trials of Tone response (M) shows habituation, while Noise response (N) does not. Traces and graphs plotted as mean ± SEM.
-
Figure 2—source data 1
Raw data used to generate pupil and velocity plots and traces.
- https://cdn.elifesciences.org/articles/53803/elife-53803-fig2-data1-v2.xlsx
-
Figure 2—source data 2
All statistical tests and significant comparisons with F and P values.
- https://cdn.elifesciences.org/articles/53803/elife-53803-fig2-data2-v2.xlsx
Figure 3

Stimulus intensity, not training order, determines the defensive behaviors elicited by SCS stimuli.
(A) Mice conditioned in groups 1 and 3 (Figure 1) were run through a tone SPL step test on day 4. (B) The tone step SCS (sSCS) is composed of two 7.5 kHz tone stimuli in which CS1 is held constant at 75 dB while CS2 begins at 55 dB and is stepped up by 5 dB each trial. (C) Schematic of tone SPL step test. (D,E) Percentage time spent freezing. (F,G) Average motion. (H,I) Escape score. Paired sSCS (D, F, H); n = 15); gap sSCS (E, G, I); n = 10). Asterisks indicate significant difference between stimuli for a given trial. ns, not significant. (J) On day 6, a WN SPL step test was done in a novel context. (K) The WN step CS (sCS) is a white noise stimulus which begins at 40 dB and is stepped up by 5 dB each trial. (L) Schematic of WN SPL step test. (M) Percentage time spent freezing, (N) average motion, and (O) escape score. Paired sSCS (D,F,H; n = 15); gap sSCS (E,G,I; n = 10). Black asterisks indicate significant difference between groups for a given trial. Dashed horizontal gray brackets indicates significant main effect of SPL. Statistical comparisons were 2-Way Repeated Measures ANOVA, with Trial and Stimulus as factors. Dashed vertical gray brackets indicate significant main effect of group. Error bars indicate SEM.
-
Figure 3—source data 1
Raw data used to generate freezing, motion, and escape score plots.
- https://cdn.elifesciences.org/articles/53803/elife-53803-fig3-data1-v2.xlsx
-
Figure 3—source data 2
All statistical tests and significant comparisons with F and P values.
- https://cdn.elifesciences.org/articles/53803/elife-53803-fig3-data2-v2.xlsx
Figure 4

Active fear behaviors are more potently elicited by 12 kHz than 3 kHz stimuli during pure tone SCS conditioning.
(A) Contribution of CS audio frequency, order presented relative to US, and pairing were assessed by conditioning with a SCS composed of 3 and 12 kHz pure tones; conditioning was done as in Figure 1A. (B–D) Motion indices (mean ± SEM) show locomotor responses to stimuli (3 kHz pips, blue; 12 kHz pips, green; 0.9 mA footshock, yellow) for trials 1 (Day 1, top) and 10 (Day 2, bottom). (E–G) Percent time spent freezing. (H–J) Average motion. (K–M) Escape score. CS order and pairing: group 4 (B,E,H,K: CS1 = 3 kHz, CS2 = 12 kHz; n = 10), group 5 (C,F,I,L: CS1 = 12 kHz, CS2 = 3 kHz; n = 10), and group 3 (D,G,J,M: CS1 = 3 kHz, CS2 = 12 kHz, unpaired; n = 10). (N–P) Tone tests established that lack of active responses to the 75 dB 3 kHz CS was not due to it being inaudible, as paired mice exhibited robust freezing to this stimulus when presented at an even lower SPL (60 dB) outside of the conditioning context. Black asterisks indicate significant difference between groups for a given trial. Dashed vertical gray brackets indicate significant main effect of CS type. Error bars indicate the SEM.
-
Figure 4—source data 1
Raw data used to generate freezing, motion, escape plots and traces.
- https://cdn.elifesciences.org/articles/53803/elife-53803-fig4-data1-v2.xlsx
-
Figure 4—source data 2
All statistical tests and significant comparisons with F and P values.
- https://cdn.elifesciences.org/articles/53803/elife-53803-fig4-data2-v2.xlsx
Tables
Key resources table
| Reagent type (species) or resource | Designation | Source or reference | Identifiers | Additional information |
|---|---|---|---|---|
| Strain, strain background (Mus musculus) | FVBB6 F1 | Taconic stock #FVB/Ntac x Envigo stock #C57Bl/6NHsd | RRID:MGI:5653121 RRID:MGI:5658877 | cross of FVB/N to B6N |
| Strain, strain background (Mus musculus) | C57BL/6J | The Jackson Laboratory (Bar Harbor, ME) | RRID:IMSR_JAX:000664 | JAX stock # 000664 |
| Software, algorithm | SPSS | IBM | RRID:SCR_002865 | |
| Software, algorithm | Bonsai | Open Ephys | RRID:SCR_017218 | Version 2.3 |
| Software, algorithm | MATLAB | Mathworks (Natick, MA) | RRID:SCR_001622 | Version R2017b |
Additional files
Download links
A two-part list of links to download the article, or parts of the article, in various formats.
Downloads (link to download the article as PDF)
Open citations (links to open the citations from this article in various online reference manager services)
Cite this article (links to download the citations from this article in formats compatible with various reference manager tools)
Stimulus salience determines defensive behaviors elicited by aversively conditioned serial compound auditory stimuli
eLife 9:e53803.
https://doi.org/10.7554/eLife.53803


