Microneedle manipulation of the mammalian spindle reveals specialized, short-lived reinforcement near chromosomes
- Biophysics Graduate Program, University of California, San Francisco, United States
- Department of Cell and Tissue Biology, University of California, San Francisco, United States
- Department of Bioengineering and Therapeutic Sciences, University of California, San Francisco, United States
- Tetrad Graduate Program, University of California, San Francisco, United States
Figures
Figure 1 with 2 supplements
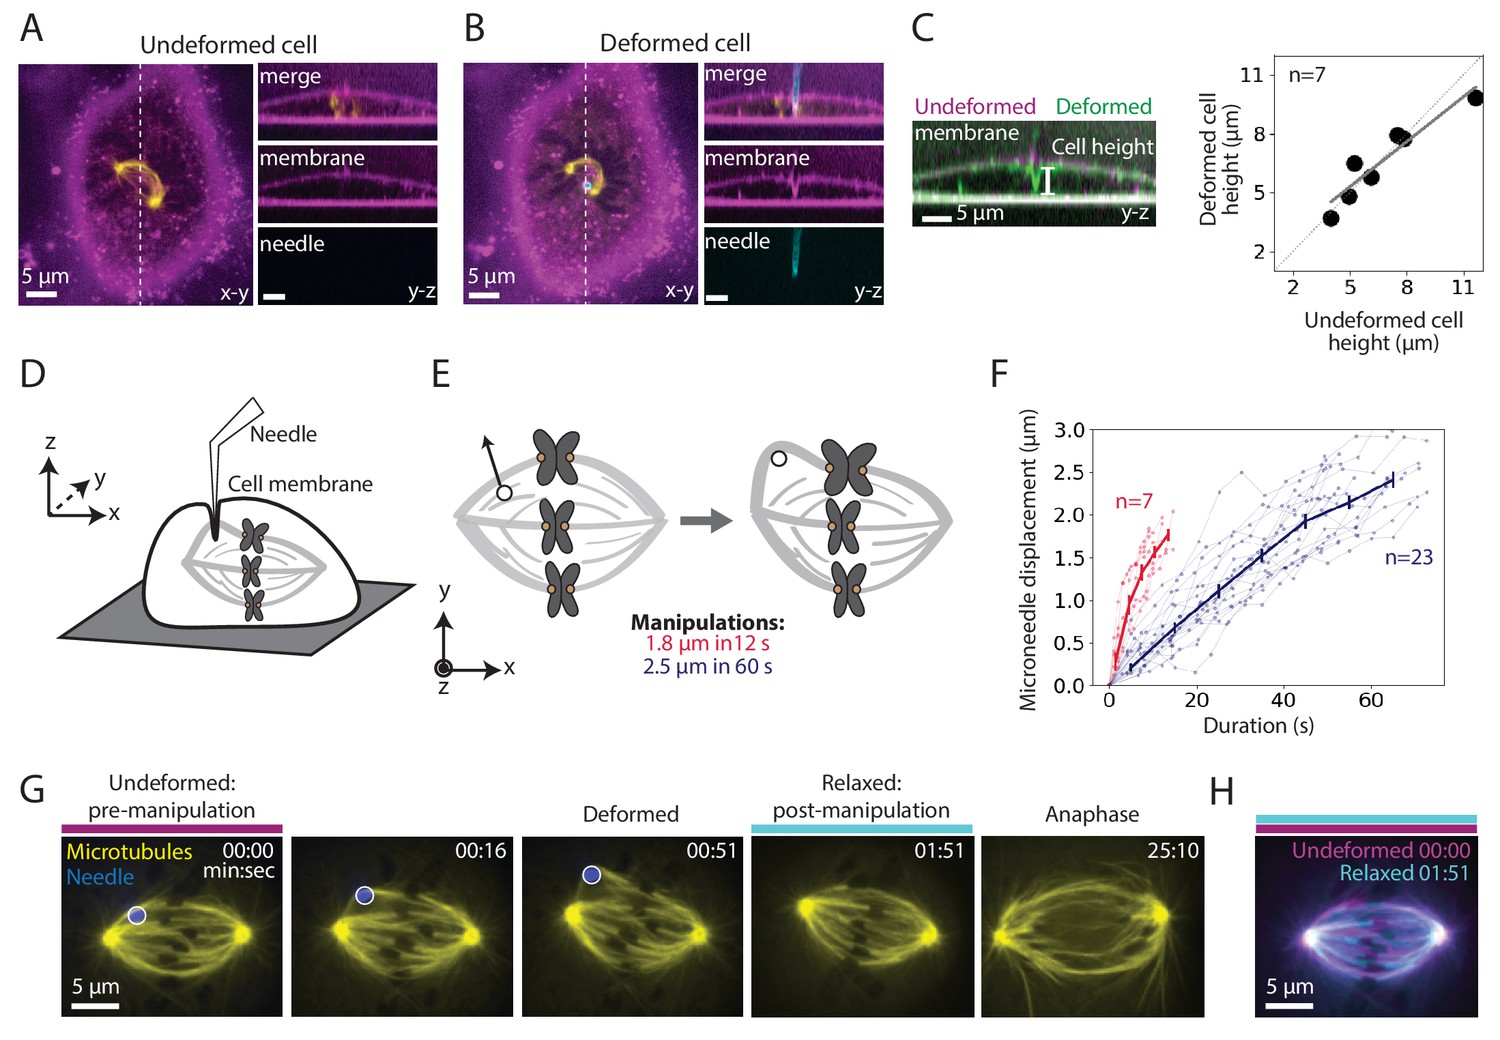
Microneedle manipulation can exert local forces with spatiotemporal control on the mammalian spindle.
See also Figure 1—figure supplement 1 and Figure 1—video 1. (A–B) Representative PtK2 cell (GFP-tubulin, yellow) and membrane label (CellMask Orange, magenta) (A) before (undeformed cell) and (B) during (deformed cell) microneedle (Alexa-647, blue) manipulation. x-y and y-z views displayed (left and right panels). y-z view taken along the white dashed line shown in the left panels. (C) Left: Overlay of the y-z view of the membrane labeled images before (undeformed, magenta) and during (deformed, green) microneedle manipulation, in order to compare membrane shape and cell height (white line) adjacent to the microneedle due to manipulation. Right: Cell height adjacent to the microneedle, measured using the membrane label, in its undeformed versus deformed state (n = 7 cells, Spearman R coefficient = 0.93, p=0.003, Pearson R coefficient = 0.94, p=0.002). Dashed line represents no change in cell height. Solid grey line is the linear regression fit to the data (r2 = 0.88). (D) Schematic showing a very local deformation of the cell by the microneedle during manipulation, based on (A–C). (E) Schematic of the microneedle (black circle) manipulation assay used throughout this study, pulling (arrow) on a spindle’s outer k-fiber for two different magnitudes and durations. (F) Microneedle displacement over time for two different manipulation datasets: 12 s (red, n = 7 cells) and 60 s (navy, n = 23 cells) pulls. Plot shows mean ± SEM. (G) Timelapse images of the representative response of a metaphase spindle in a PtK2 cell (GFP-tubulin, yellow), when its outer k-fiber is deformed by the microneedle (Alexa-647, blue, white circle) by 2.5 μm over 60 s. The spindle enters anaphase about 20 min after manipulation. Microneedle begins moving at 00:00 (first frame). Scale bar = 5 μm. Time in min:sec. (H) Overlay of the tubulin labeled images of the spindle (G) pre-manipulation (undeformed, magenta) and post-manipulation and microneedle removal (relaxed, cyan). The spindle’s structure is similar pre- and post-manipulation, after correcting for spindle movement.
-
Figure 1—source data 1
This spreadsheet contains the height of a PtK2 cell when it is undeformed versus deformed by the microneedle (Figure 1C), and the microneedle displacement over time for both 12 s and 60 s manipulations (Figure 1F).
- https://cdn.elifesciences.org/articles/53807/elife-53807-fig1-data1-v2.xlsx
Figure 1—figure supplement 1
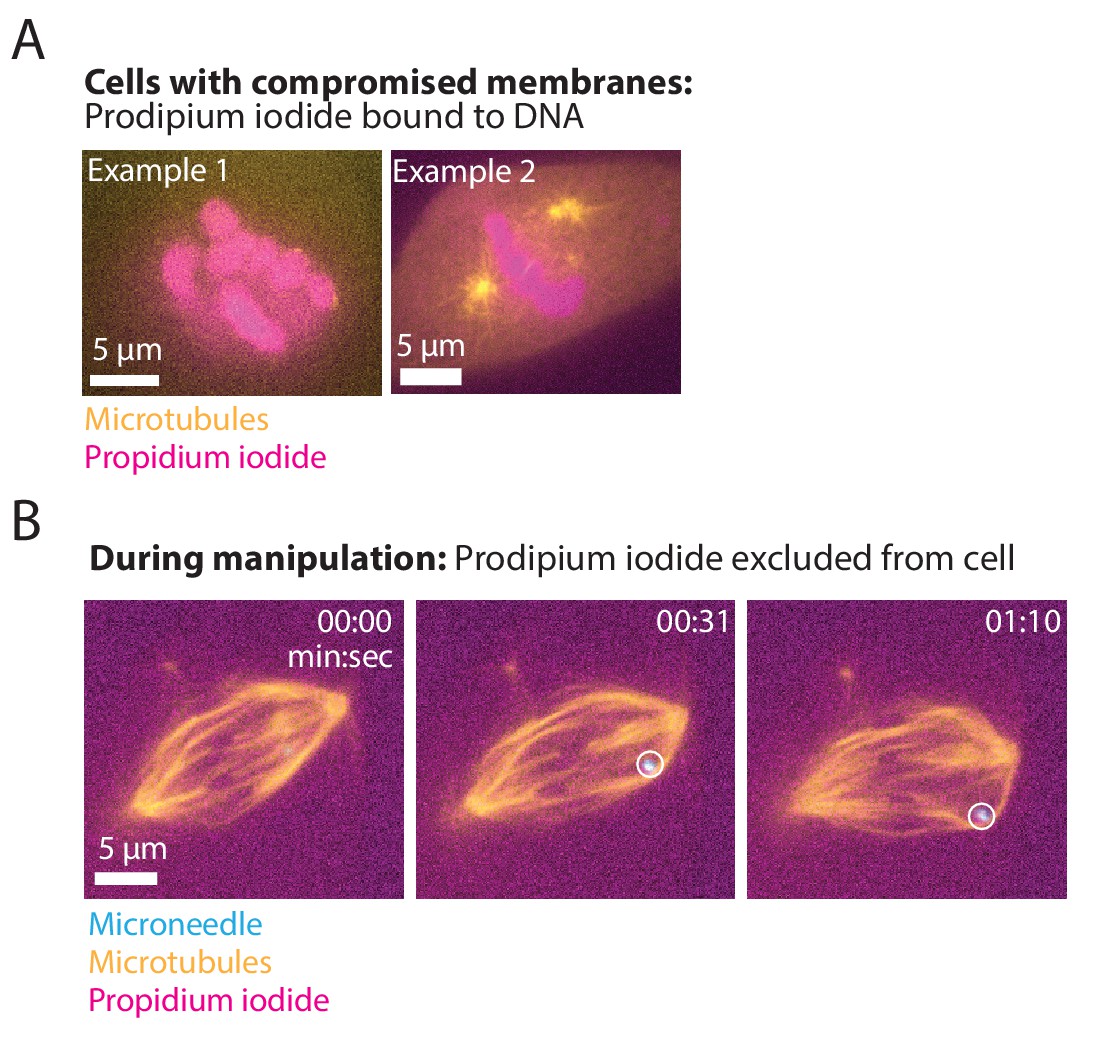
Propidium iodide remains outside cells during microneedle manipulation.
(A) Representative images of two PtK2 cells (GFP-tubulin, yellow) with compromised membranes in which cell impermeable propidium iodide binds and labels DNA (magenta). Scale bar = 5 μm. (B) Timelapse images of a PtK2 spindle (GFP-tubulin, yellow) during a 60 s manipulation in which propidium iodide (magenta) in the media does not enter the cell, suggesting that the membrane is sealed and does not rupture due to the microneedle (Alexa-647, blue, white circle) during this process. Scale bar = 5 μm. Time in min:sec.
Figure 1—video 1
Microneedle manipulation of a mammalian mitotic spindle at metaphase showing spindle relaxation and anaphase entry post-manipulation.
Microneedle manipulation of a metaphase spindle in a PtK2 cell. The microneedle (Alexa-647, blue) pulls (time 00:00) on the spindle’s outer k-fiber (GFP-tubulin, yellow) over 60 s and deforms the spindle. Upon needle removal (time 00:51), the spindle typically returns to its original structure. About 20 min after manipulation, the spindle has progressed to anaphase (time 25:10), consistent with cell health post manipulation. Scale bar = 5 μm. Time in min:sec. Video was collected using a spinning disk confocal microscope, at a rate of 1 frame every 5 s before and during manipulation. Video has been set to play back at constant rate of 5 frames per second. Movie corresponds to still images from Figure 1G.
Figure 2 with 5 supplements
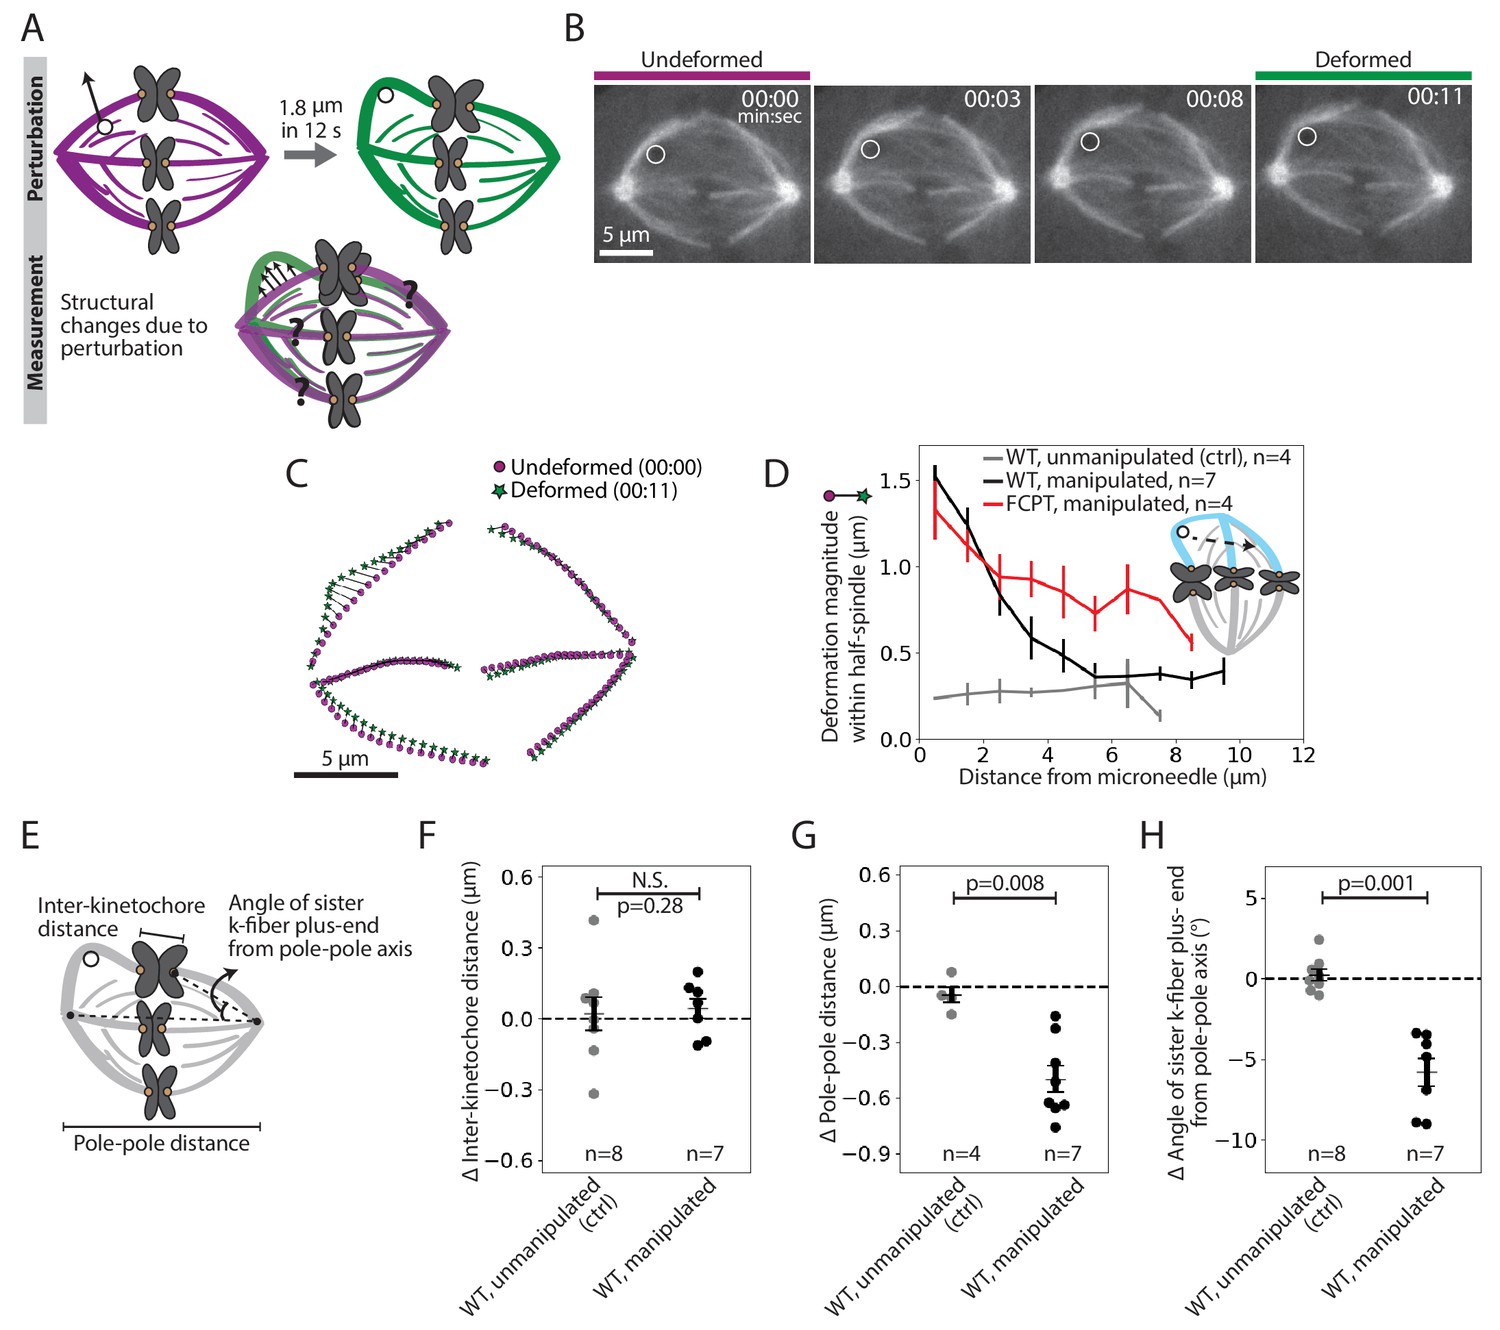
Pulling on kinetochore-fibers reveals the spindle’s ability to retain local architecture near chromosomes under seconds-long forces.
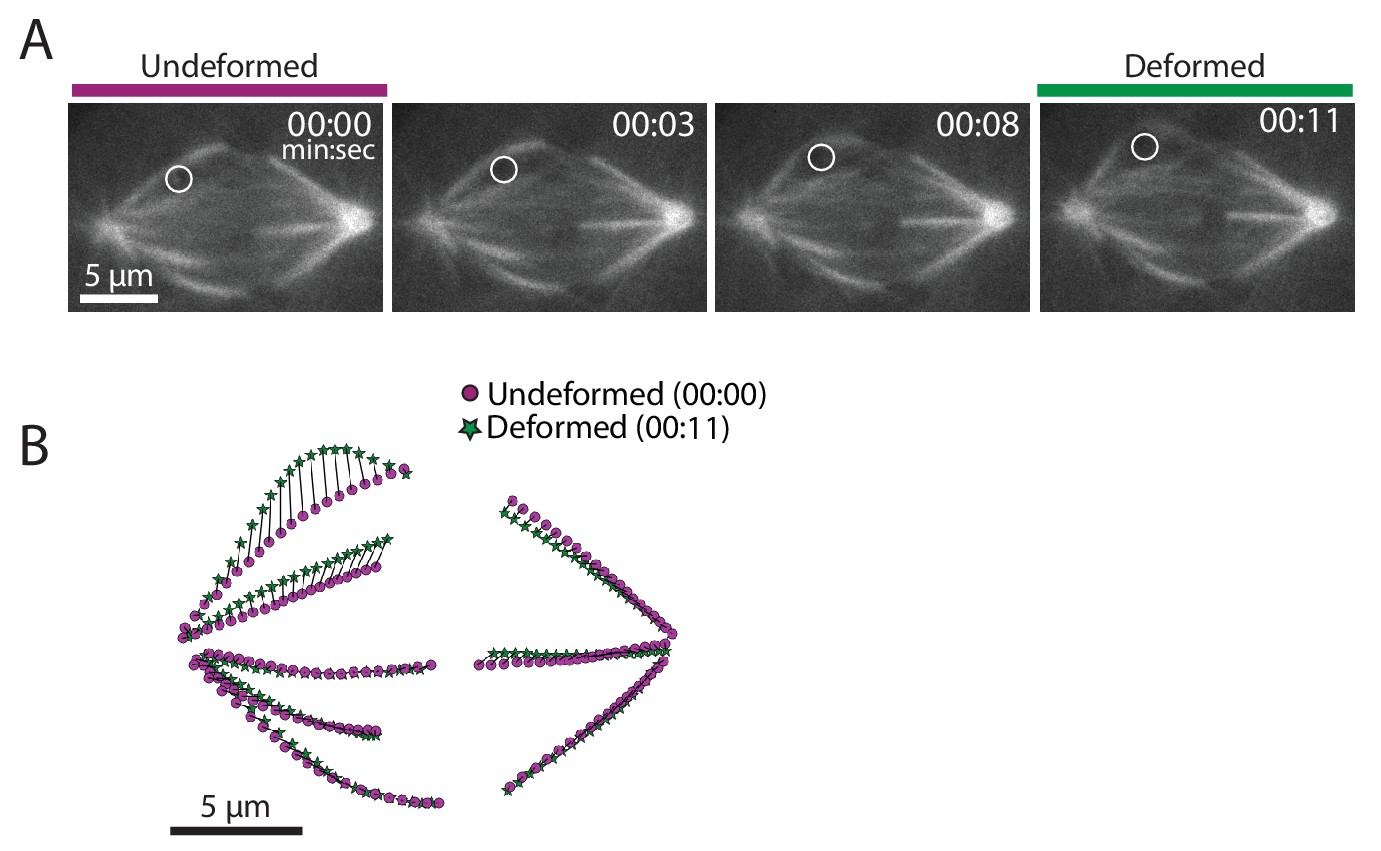
See also Figure 2—figure supplements 1–4 and Figure 2—video 1. (A) Schematic of the assay to measure spindle deformation under local force: manipulation of the outer k-fiber for 12 s (perturbation) and generation of strain maps between undeformed (magenta) and deformed (green) spindles (measurement). (B) Timelapse images of a representative PtK2 metaphase spindle (GFP-tubulin, grey) during a 12 s manipulation, with microneedle position (white circle) displayed on images. Scale bar = 5 μm. Time in min:sec. (C) Strain map showing structural changes between undeformed (00:00, magenta circles) and deformed (00:11, green stars) spindles shown in (B), after correcting for spindle movement. Strain corresponds to the distance (black line) between magenta circles (undeformed spindle) and green stars (deformed spindle). (D) Magnitude of deformation in the structure (mean ± SEM) versus distance from the microneedle in unmanipulated WT (control, grey, n = 4 cells), manipulated WT (black, n = 7 cells) and manipulated FCPT-treated (positive control, red, n = 4 cells) spindles. (E) Schematic of the three measurements made in (F,G,H): Inter-kinetochore distance (measured between the manipulated k-fiber’s and its sister’s plus-ends), pole-pole distance, and angle between the sister k-fiber plus-end (opposite the manipulated k-fiber) and the pole-pole axis. (F) Change in inter-kinetochore distance in WT unmanipulated (control, n = 8 kinetochore pairs from 4 cells) and WT manipulated (between undeformed and deformed, n = 7 kinetochore pairs from 7 cells) spindles, measured over 12 s. There is no significant difference in the inter-kinetochore distance upon manipulation (p=0.28, Mann-Whitney U test). (G) Change in pole-pole distance in WT unmanipulated (control, n = 4 cells) and WT manipulated (between undeformed and deformed, n = 7 cells) spindles, measured over 12 s. Pole-pole distance decreases in manipulated spindles (p=0.008, Mann-Whitney U test). Plot shows mean ± SEM. (H) Change in angle of sister k-fiber plus-end with respect to the pole-pole axis, in WT unmanipulated (control, n = 8 k-fibers from 4 cells) and WT manipulated (between undeformed and deformed, n = 7 k-fibers from 7 cells) spindles, measured over 12 s. The sister k-fiber moves in towards the pole-pole axis in manipulated spindles (p=0.001, Mann-Whitney U test). Plot shows mean ± SEM.
-
Figure 2—source data 1
This spreadsheet contains the magnitude of deformation within the half-spindle versus the distance from the microneedle position in WT unmanipulated, WT manipulated and FCPT manipulated spindles manipulated over 12 s in PtK2 cells (Figure 2D).
- https://cdn.elifesciences.org/articles/53807/elife-53807-fig2-data1-v2.xlsx
Figure 2—figure supplement 1
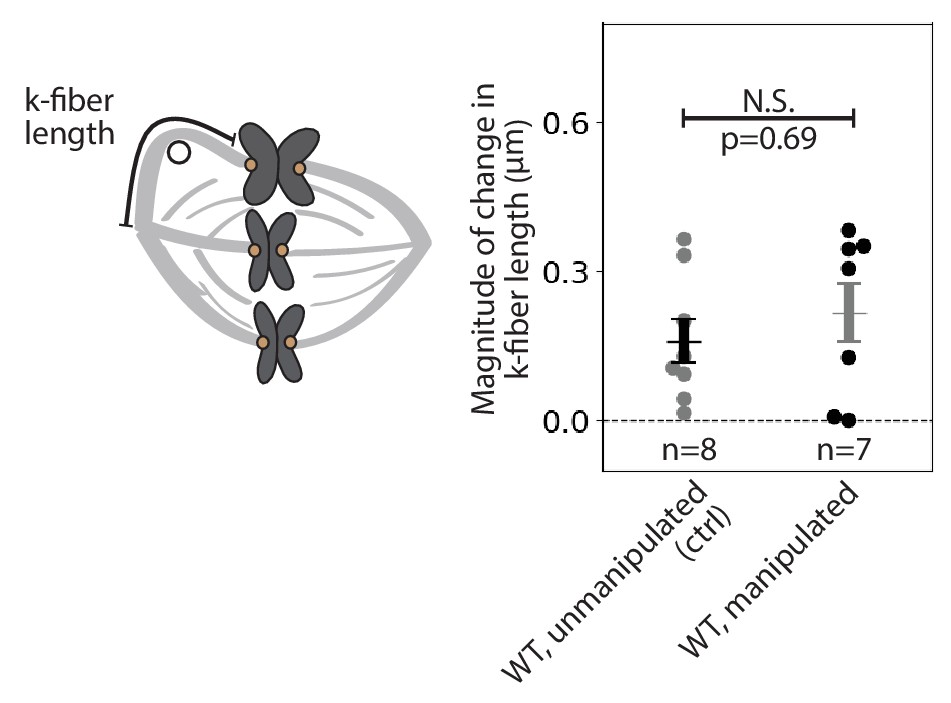
Kinetochore-fiber length does not change over 12 s manipulations.
Magnitude of change in k-fiber length in PtK2 unmanipulated (control, n = 8 k-fibers from 4 cells) and manipulated spindles (between undeformed and deformed, n = 7 k-fibers from 7 cells), measured over 12 s. Mean ± SEM displayed over points. There is no significant difference in k-fiber length during manipulation over this timescale (p=0.69, Mann-Whitney U test).
-
Figure 2—figure supplement 1—source data 1
This spreadsheet contains the change in k-fiber length in unmanipulated and manipulated spindles from 12 s manipulations in PtK2 cells.
- https://cdn.elifesciences.org/articles/53807/elife-53807-fig2-figsupp1-data1-v2.xlsx
Figure 2—figure supplement 2
Additional example of a spindle manipulated for 12 s and its corresponding strain map.
(A) Timelapse images of a PtK2 metaphase spindle (GFP-tubulin, grey) during a 12 s manipulation, with microneedle position (white circle) displayed on images. Scale bar = 5 μm. Time in min:sec. (B) Strain map showing structural changes between undeformed (00:00, magenta circles) and deformed (00:11, green stars) spindles shown in (A), after correcting for spindle movement. Strain corresponds to the distance (black line) between magenta circles (undeformed spindle) and green stars (deformed spindle).
Figure 2—figure supplement 3
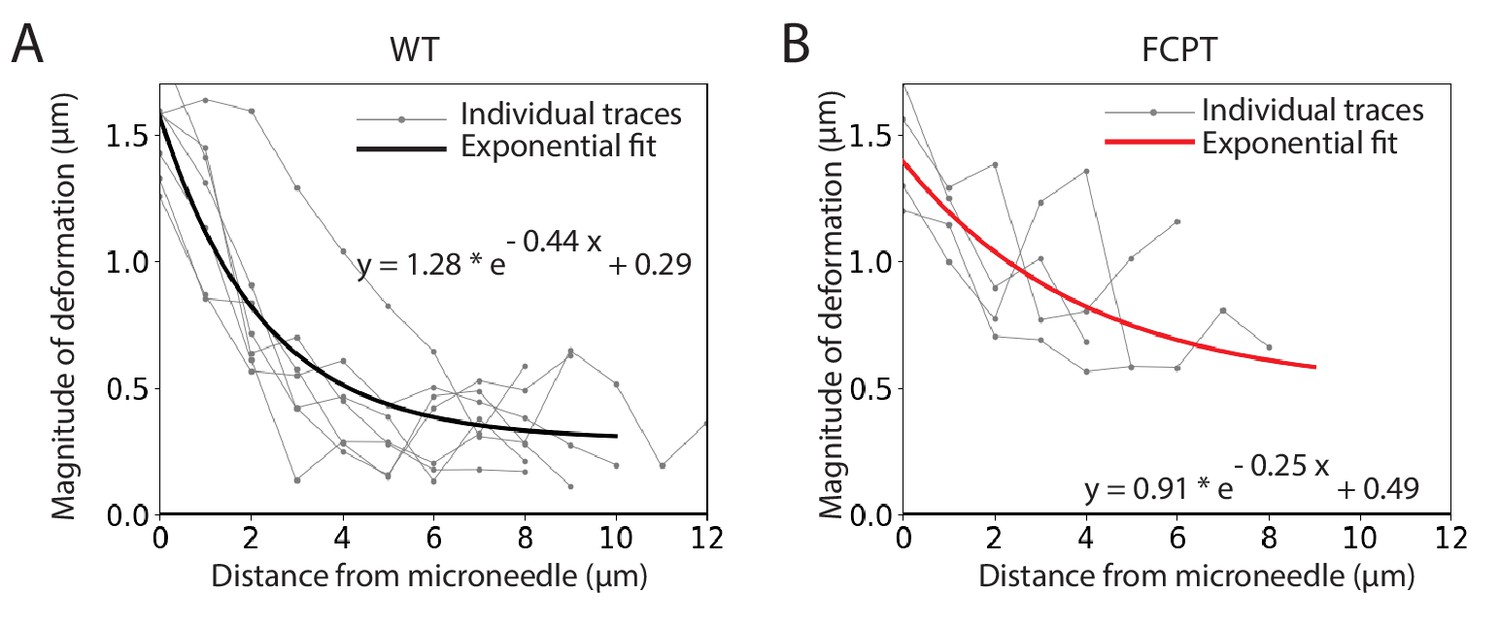
Estimating the exponential decay rate of spindle deformations over space.
Magnitude of deformation in the structure versus distance from the microneedle in PtK2 GPF-tubulin (A) WT manipulated (n = 7 cells) and (B) FCPT-treated manipulated (n = 4 cells) spindles, due to 12 s manipulations. Thin grey lines are individual traces, thick lines (WT, black; FCPT, red) are exponential decay functions fit to the data. The equation that produced the best fits to the data is displayed.
-
Figure 2—figure supplement 3—source data 1
This spreadsheet contains the magnitude of deformation within the half-spindle vs. the distance from the microneedle position in WT and FCPT spindles manipulated over 12 s in PtK2 cells (same as Figure 2D).
- https://cdn.elifesciences.org/articles/53807/elife-53807-fig2-figsupp3-data1-v2.xlsx
Figure 2—figure supplement 4
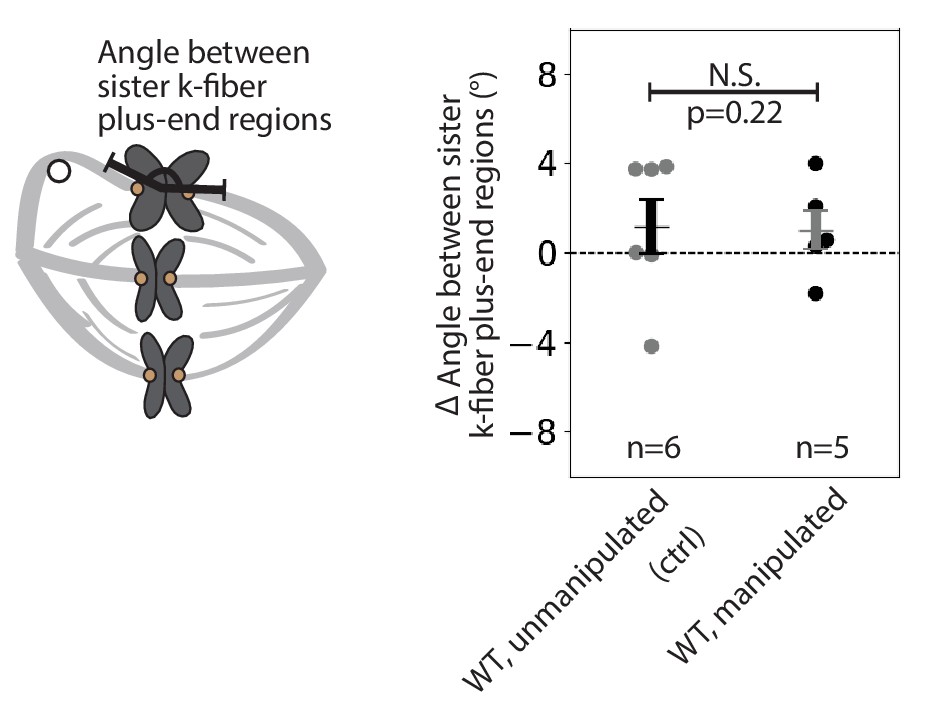
The angle between sister kinetochore-fibers is preserved in 12 s manipulations.
Change in angle between sister k-fiber plus-end regions in the outer pair, in PtK2 unmanipulated (control, n = 6 k-fiber pairs from 4 cells) and manipulated (n = 6 k-fiber pairs from 6 cells) spindles, measured over 12 s. There is no significant change in angle between sister k-fibers due to the manipulation (p=0.22, Mann-Whitney U test).
-
Figure 2—figure supplement 4—source data 1
This spreadsheet contains the change in angle between sister k-fiber plus-ends in unmanipulated and manipulated spindles over 12 s, in PtK2 cells.
- https://cdn.elifesciences.org/articles/53807/elife-53807-fig2-figsupp4-data1-v2.xlsx
Figure 2—video 1
The spindle locally deforms under seconds-long forces.
Microneedle manipulation of a metaphase spindle in a PtK2 cell. The microneedle (Alexa-647, white circle) pulls (time 00:00) on the spindle’s outer k-fiber (GFP-tubulin, grey) over 12 s and deforms the spindle. The k-fiber bends around the microneedle and the rest of the spindle structure appears unaffected by the force exerted, indicating a local structural response. Scale bar = 5 μm. Time in min:sec. Video was collected using a spinning disk confocal microscope, at a rate of 4 frames per second during manipulation. Video has been set to play back at constant rate of 5 frames per second. Movie corresponds to still images from Figure 2B.
Figure 3 with 5 supplements
The deformed kinetochore-fiber’s shape indicates specialized, short-lived crosslinking to the spindle near chromosomes.
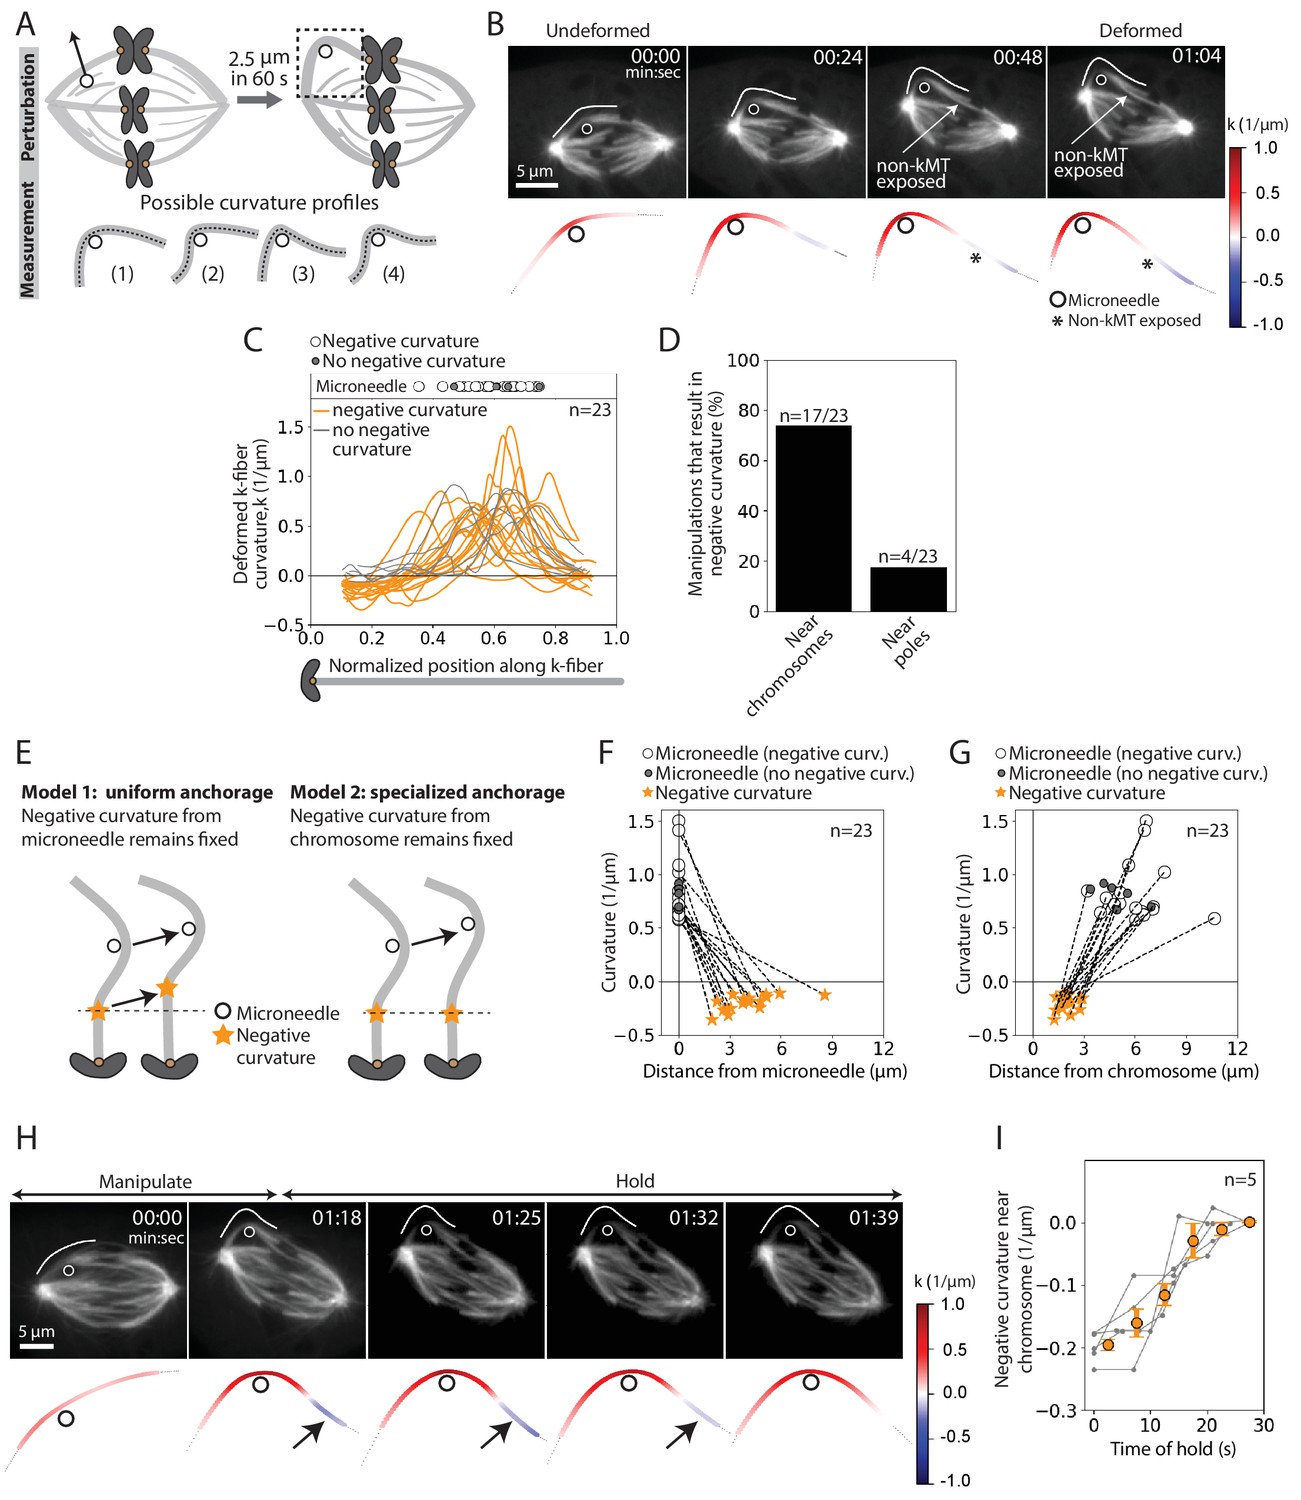
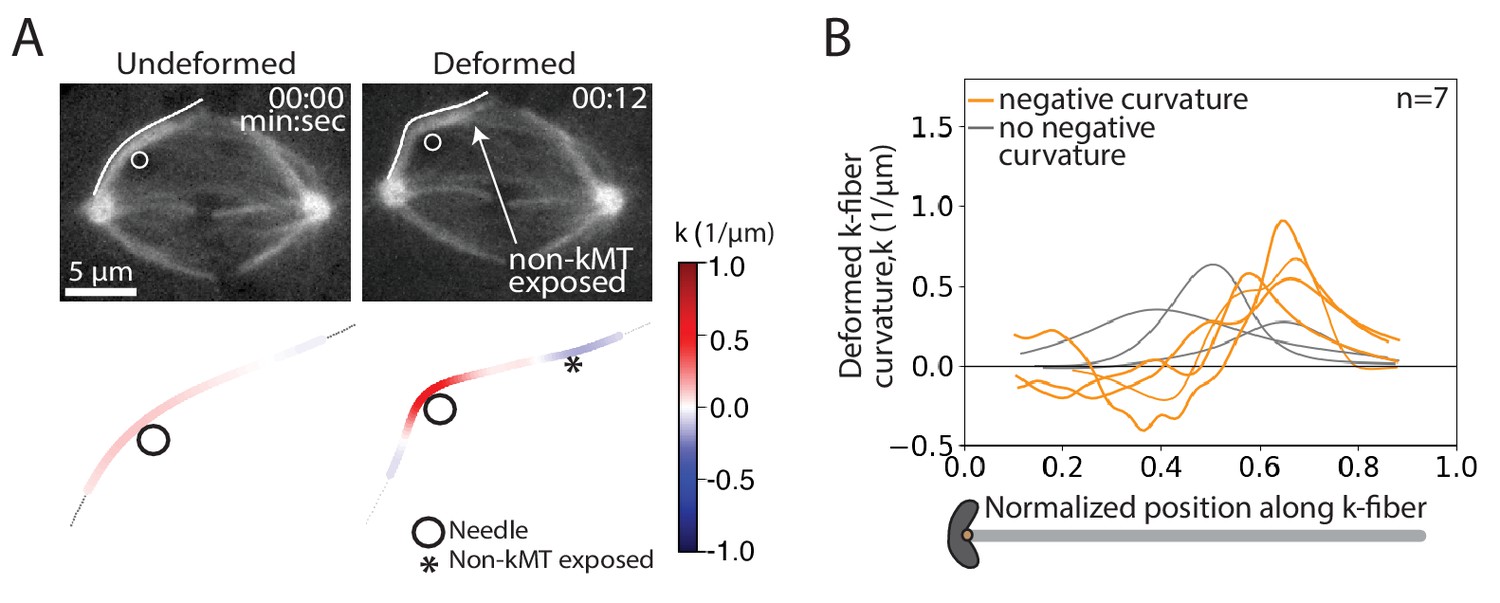
See also Figure 3—figure supplements 1–3 and Figure 3—videos 1 and 2. (A) Schematic of the assay to probe the physical basis of k-fiber anchorage in the spindle: manipulation of the outer k-fiber for 60 s and quantification of local curvature along its length. The absence of k-fiber negative curvature (1) would suggest pivoting at poles and chromosomes. K-fiber negative curvature at poles (2) or chromosomes (3) or at both (4) would suggest it is laterally anchored there and prevented from pivoting. (B) Top: Timelapse images of a representative PtK2 metaphase spindle (GFP-tubulin, grey) during a 60 s manipulation, with microneedle position (white circle) and traced manipulated k-fiber (white) displayed on the images. Scale bar = 5 μm. Time in min:sec. Bottom: Curvature mapped along highlighted k-fiber for each time point in the top panel (blue, negative curvature; red, positive curvature). This manipulation can expose contact points (asterisk) between the k-fiber and non-kMTs. (C) Local curvature of deformed k-fibers for normalized positions along the k-fiber (n = 23 cells). Most k-fibers exhibit negative curvature near the chromosome (orange), and a few show no negative curvature (grey) near the chromosome. Few k-fibers also show negative curvature near poles. Scatter plot of microneedle positions shown above (inset). (D) Percentage of k-fiber curvature profiles with negative curvature less than −0.1 1/μm, proximal to chromosomes (n = 17/23 cells) and the pole (n = 3/23 cells). (E) Schematic of two possible outcomes of manipulating the outer k-fiber at different locations along its length: either the negative curvature position (orange star) remains fixed relative to the microneedle (black circle) position (uniform anchorage along the k-fiber, Model 1) or remains fixed relative to the chromosome (specialized, non-uniform anchorage near chromosome, Model 2). (F–G) Position of the curvature maxima (microneedle, white circle) and curvature minima (negative curvature, orange star) (F) measured from the microneedle position (n = 23 cells), and (G) measured from the chromosome (n = 23 cells). Dashed lines connect the maxima (microneedle) and minima (negative curvature) for a given manipulation. The negative curvature position is tightly distributed near chromosomes, regardless of the microneedle’s position, supporting a specialized crosslinking model (Model 2, E). Plot also shows microneedle positions of manipulations that do not result in negative curvature (grey circles). (H) Top: Timelapse images of a PtK2 metaphase spindle (GFP-tubulin, grey) manipulate-and-hold experiment to probe the timescale of k-fiber reinforcement in the spindle center, performing a 60 s manipulation and then holding the microneedle (white circle) in place to measure when the negative curvature in the manipulated k-fiber (white trace) disappears (1:39, 21 s after 1:18 hold started). Scale bar = 5 μm. Time in min:sec. Bottom: Curvature mapped along highlighted k-fiber for each point in the top panel (blue, negative curvature; red, positive curvature). Negative curvature (black arrow) disappears over 21 s of holding time. (I) Curvature minima near chromosome as a function of time the microneedle has been held in place (n = 5 cells). Negative curvature disappears after holding for 20 s. Plot shows mean ± SEM (orange).
-
Figure 3—source data 1
This spreadsheet contains the local curvature along k-fibers manipulated over 60 s in PtK2 cells (Figure 3C), the positions of the microneedle and negative curvature with respect to the plus-end and the microneedle as well as their respective curvature values (Figure 3F–G), and the negative curvature near chromosomes during the hold time of the ‘manipulate-and-hold’ assays (Figure 3I).
- https://cdn.elifesciences.org/articles/53807/elife-53807-fig3-data1-v2.xlsx
Figure 3—figure supplement 1
Deformed kinetochore-fibers exhibit negative curvature in 12 s manipulations.
(A) Top: Timelapse images of a representative PtK2 spindle (GFP-tubulin, grey) during a 12 s manipulation.
Microneedle position (white circle) and traced manipulated k-fiber (white) displayed on the images. Scale bar = 5 μm. Time in min:sec. Bottom: Curvature mapped along highlighted k-fiber for each point in the top panel (blue, negative curvature; red, positive curvature). This manipulation can expose contact points between the k-fiber and non-kMTs (asterisk). (B) Local curvature of deformed k-fibers for normalized positions along the k-fiber (n = 7 cells). Some k-fibers exhibit negative curvature near the chromosome (orange), and others do not (grey).
-
Figure 3—figure supplement 1—source data 1
This spreadsheet contains the local curvature along k-fibers manipulated over 12 s in PtK2 cells (Figure 3—figure supplement 1B).
- https://cdn.elifesciences.org/articles/53807/elife-53807-fig3-figsupp1-data1-v2.xlsx
Figure 3—figure supplement 2
Tight coupling between sister kinetochore-fibers in 60 s manipulations.
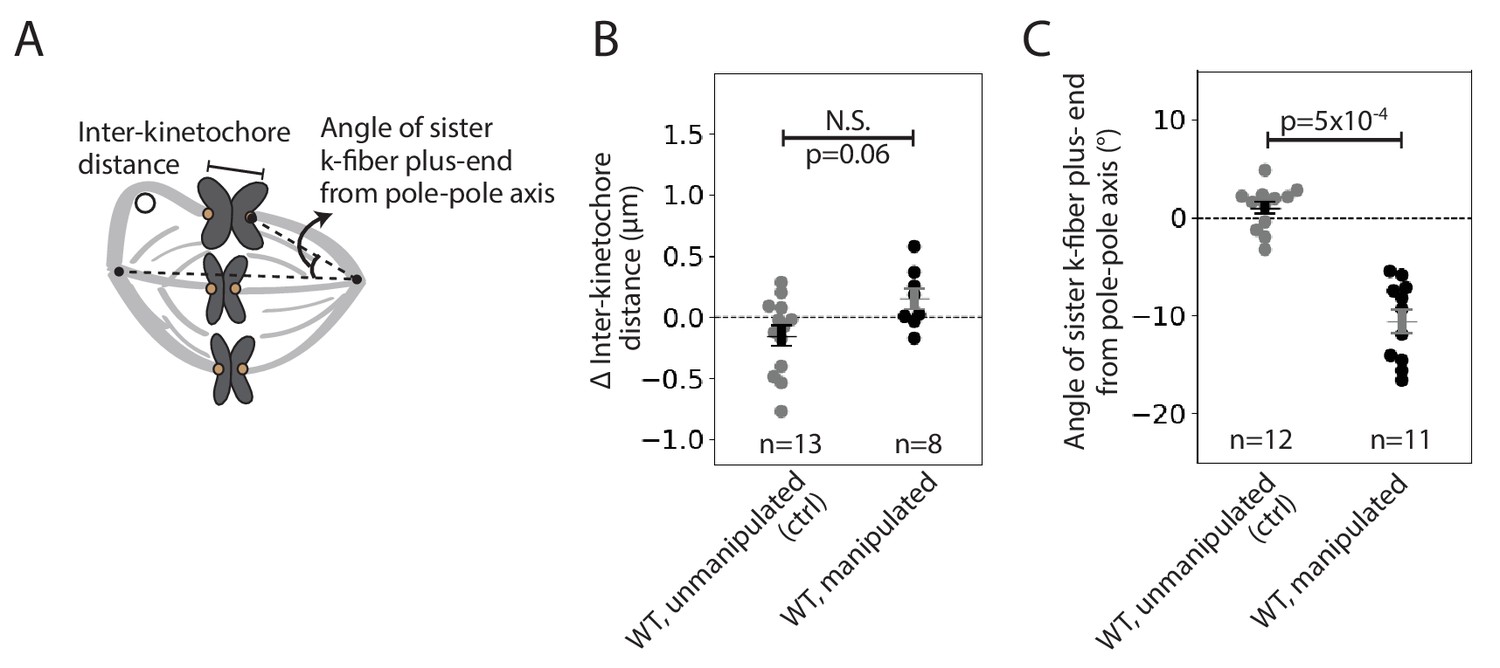
(A) Schematic of the two measurements made in (B–C): Inter-kinetochore distance measured between sister k-fiber plus-ends of the manipulated k-fiber, and angle measured between the sister k-fiber plus-end (opposite the manipulated k-fiber) and the pole-pole axis, measured over 60 s. (B) Change in inter-kinetochore distance in PtK2 unmanipulated (control, n = 13 kinetochore pairs from 6 cells) and manipulated (n = 8 kinetochore pairs from 8 cells) spindles, measured over 60 s. There was no significant difference in inter-kinetochore distance after manipulation (p=0.06, Mann-Whitney U test). Plot shows mean ± SEM. (C) Change in angle of sister k-fiber plus-end with respect to the pole-pole axis, in PtK2 unmanipulated (control, n = 12 k-fibers from 6 cells) and manipulated (n = 11 k-fibers from 11 cells) spindles, measured over 60 s. The sister k-fiber in manipulated spindles moves in towards the pole-pole axis (p=5×10⁻⁴, Mann-Whitney U test). Plot shows mean ± SEM.
-
Figure 3—figure supplement 2—source data 1
This spreadsheet contains the change in inter-kinetochore distance (Figure 3—figure supplement 2B) and angle of sister k-fiber plus-end from the pole-pole axis (Figure 3—figure supplement 2C) in unmanipulated and manipulated spindles over 60 s.
- https://cdn.elifesciences.org/articles/53807/elife-53807-fig3-figsupp2-data1-v2.xlsx
Figure 3—figure supplement 3
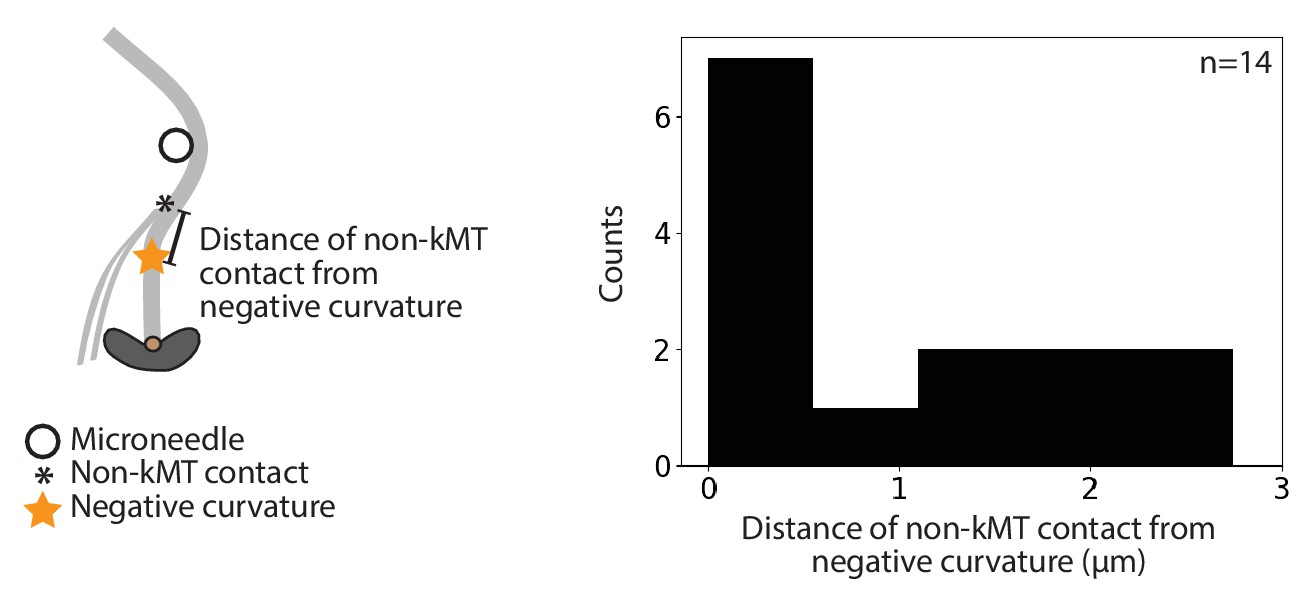
Non-kinetochore microtubule contacts distributed close to observed negative curvature.
Frequency distribution of the distance from a contact point between the k-fiber and non-kMTs (non-kMT contact) to the curvature minima (negative curvature) position, exposed during 60 s manipulations in PtK2 spindles. The average distance between a non-kMT contact and the negative curvature near chromosomes is 1 ± 0.1 μm (mean ± SEM, n = 14 cells).
-
Figure 3—figure supplement 3—source data 1
This spreadsheet contains the position of negative curvature from the k-fiber plus-end, position of non-kinetochore microtubule contact from the k-fiber plus-end, and the distance between them.
- https://cdn.elifesciences.org/articles/53807/elife-53807-fig3-figsupp3-data1-v2.xlsx
Figure 3—video 1
Microneedle manipulation of a kinetochore-fiber reveals pivoting around poles and local reinforcement near chromosomes.
Microneedle manipulation of a metaphase spindle in a PtK2 cell. The microneedle (Alexa-647, white circle) pulls (time 00:00) on the spindle’s outer k-fiber (GFP-tubulin, grey) over 60 s and deforms the spindle. The k-fiber bends around the needle, pivots around the pole but does not pivot around chromosomes, instead remaining straight in the spindle center. This indicates the presence of a region of k-fiber reinforcement in the spindle center. Scale bar = 5 μm. Time in min:sec. Video was collected using a spinning disk confocal microscope, at a rate of 1 frame every 4 s before and during manipulation. Video has been set to play back at constant rate of 5 frames per second. Movie corresponds to still images from Figure 3B.
Figure 3—video 2
Manipulate-and-hold assay reveals that local reinforcement near chromosome has a 20 s lifetime.
Manipulate-and-hold experiment in a metaphase spindle in a PtK2 cell. The microneedle (Alexa-647, white circle) pulls (time 00:00) on the spindle’s outer k-fiber (GFP-tubulin, grey) over 60 s and is then held in place for 30 s. During the course of the microneedle hold, the negative curvature on the deformed k-fiber disappears in 20 s, indicating that this local, specialized reinforcement is short-lived. Scale bar = 5 μm.Time in min:sec. Video was collected using a spinning disk confocal microscope, with a variable frame rate of 1 frame every 10 s before manipulation and 1 frame per every 7 s during manipulation. Video has been set to play back at 7 frames per second despite the variable acquisition rate. Movie corresponds to still images from Figure 3H.
Figure 4 with 3 supplements
The microtubule crosslinker PRC1 mediates the specialized and short-lived kinetochore-fiber reinforcement near chromosomes.
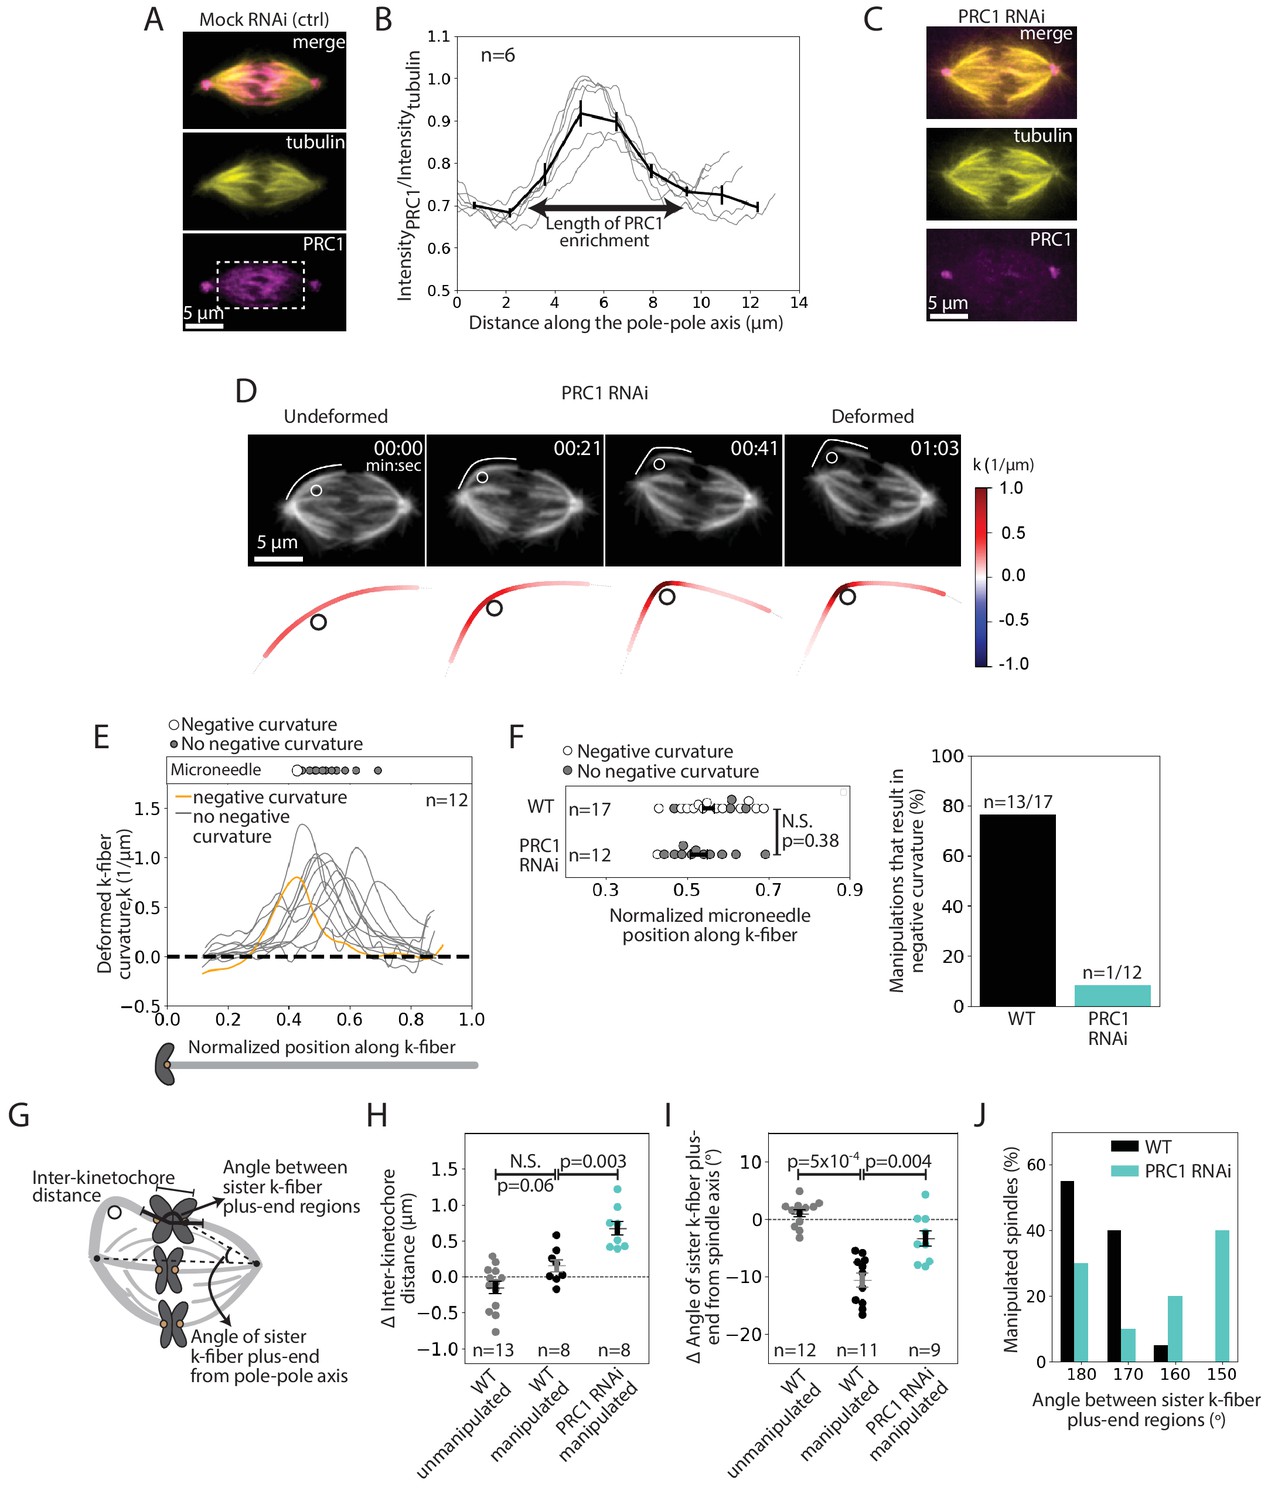
See also Figure 4—figure supplements 1–2 and Figure 4—video 1. (A) Immunofluorescence images of a representative PtK2 mock RNAi (control) metaphase spindle showing where PRC1 is localized in the spindle (tubulin, yellow; PRC1, magenta). White box (bottom panel) shows the region in which intensity (B) was quantified. Scale bar = 5 μm. (B) Fluorescence intensity ratio of PRC1 to tubulin along the pole-pole axis (n = 6 cells), showing PRC1 localization in the spindle center. Plot shows mean ± SEM. (C) Immunofluorescence images of a representative PtK2 PRC1 RNAi metaphase spindle (tubulin, yellow; PRC1, magenta), showing PRC1 depletion. Scale bar = 5 μm. (D) Top: Timelapse images of a representative PtK2 metaphase PRC1 RNAi spindle (GFP-tubulin, grey) during a 60 s manipulation, showing microneedle position (white circle) and traced manipulated k-fiber (white). Scale bar = 5 μm. Time in min:sec. Bottom: Curvature mapped along traced k-fiber for each point in the top panel (blue, negative curvature; red, positive curvature), showing the absence of negative curvature near chromosomes without PRC1. (E) Local curvature of deformed k-fibers for normalized positions along the k-fiber (n = 12 k-fibers in 12 cells). Most k-fibers exhibit no negative curvature (grey) and one shows negative curvature similar to WT k-fibers (orange). Scatter plot of microneedle positions shown above (inset). (F) Left: Distribution of microneedle positions along the k-fiber in WT (n = 17 cells) and PRC1 RNAi (n = 12 cells) spindles, after datasets are minimally down-sampled to maximize microneedle position overlap between them. There is no significant difference in microneedle position in the two conditions (p=0.38, Mann-Whitney U test). Plot shows mean ± SEM. Right: Percentage of deformed k-fiber profiles showing negative curvature near chromosomes in WT and PRC1 RNAi manipulated spindles, showing loss of negative curvature without PRC1. (G) Schematic of the three measurements made in (H,I,J): Inter-kinetochore distance between the manipulated k-fiber and its sister, angle between the sister k-fiber plus-end (opposite the manipulated k-fiber) and the pole-pole axis, and the angle between sister k-fiber plus-end regions. (H) Change in inter-kinetochore distance in WT unmanipulated (control, n = 13 kinetochore pairs from 6 cells), WT manipulated (n = 8 kinetochore pairs from 8 cells) and PRC1 RNAi manipulated (n = 8 kinetochore pairs from 8 cells) spindles, measured over 60 s. Inter-kinetochore distance after manipulation is significantly higher in spindles with PRC1 RNAi than WT (p=0.003, Mann-Whitney U test). Plot shows mean ± SEM. (I) Change in angle of sister k-fiber plus-end with respect to the pole-pole axis in WT unmanipulated (control, n = 12 k-fibers from 6 cells) and WT manipulated (n = 11 k-fibers from 11 cells) and PRC1 RNAi manipulated (n = 9 k-fibers from 9 cells) spindles, measured over 60 s. The sister k-fiber moves less (smaller angle) towards the pole-pole axis after manipulation in PRC1 RNAi spindles compared to WT (p=0.004, Mann-Whitney U test). Plot shows mean ± SEM. (J) Distribution of the angle between sister k-fiber plus-end regions at the end of manipulation in WT (n = 20 cells) and PRC1 RNAi (n = 10 cells) spindles, measured between the chromosome-proximal regions of the k-fibers.
-
Figure 4—source data 1
This spreadsheet contains the fluorescence intensity ratio of PRC1 to tubulin along the pole-pole axis of spindles acquired by immunofluorescence (Figure 4B), the local curvature along k-fibers manipulated over 60 s in PRC1 RNAi spindles (Figure 4E), microneedle positions from 60 s manipulations in WT and PRC1 RNAi such that their positions along the k-fiber maximally overlap (Figure 4F), the change in inter-kinetochore distance (Figure 4H) and angle of sister k-fiber plus-end from the pole-pole axis (Figure 4I) in unmanipulated and manipulated spindles, and PRC1 RNAi manipulated spindles, and the angle between sister k-fiber plus-end regions in WT and PRC1 RNAi PtK2 spindles (Figure 4J).
- https://cdn.elifesciences.org/articles/53807/elife-53807-fig4-data1-v2.xlsx
Figure 4—figure supplement 1
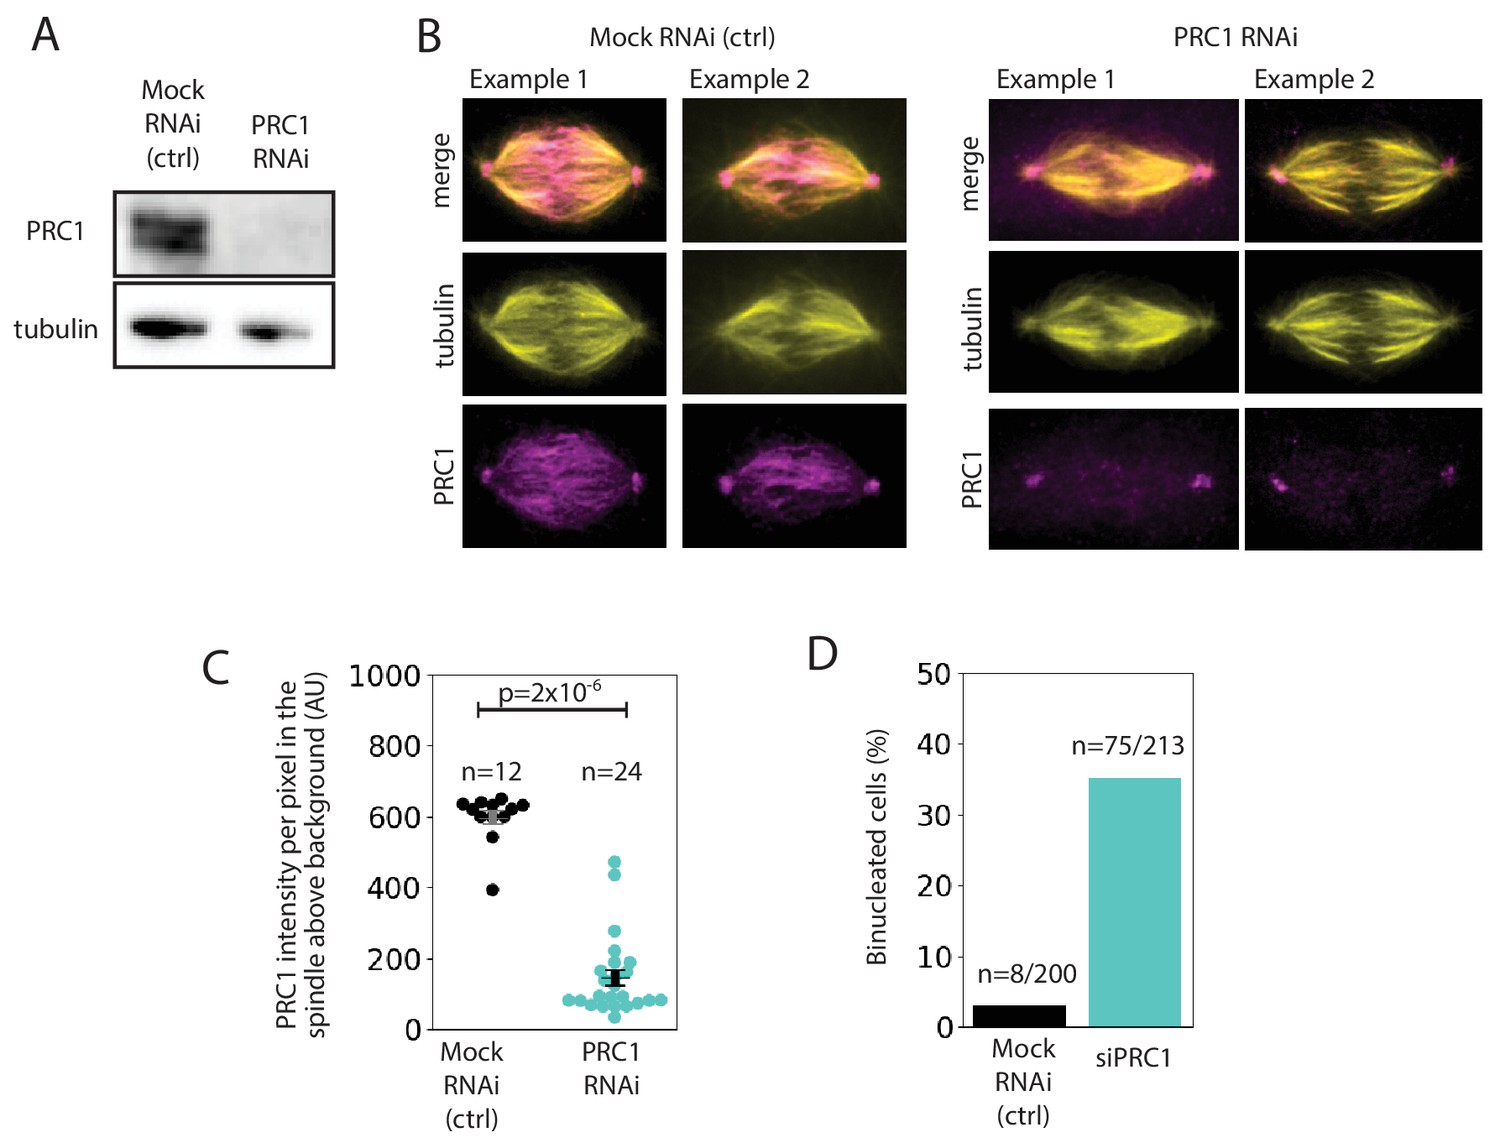
Validation of PRC1 depletion by RNAi.
(A) Western blot depicting of the intensity of PRC1 after mock RNAi and PRC1 RNAi, with tubulin as a loading control, using PtK2 GFP-tubulin cells. There is an 88% decrease in PRC1 levels in the PRC1 RNAi lane compared to the mock RNAi lane (normalized to tubulin intensity levels). (B) Additional examples of immunofluorescence images of PtK2 spindles in mock RNAi (Luciferase) and PRC1 RNAi backgrounds (tubulin, yellow; PRC1, magenta). Scale bar = 5 μm. (C) Average fluorescence intensity of PRC1 above cytoplasmic background levels in PtK2 mock RNAi (n = 12 cells) and PRC1 RNAi (n = 24 cells) spindles. Plot shows mean ± SEM. PRC1 intensity in the spindle decreases upon PRC1 RNAi (p=2×10⁻⁶, Mann-Whitney U test). (D) Percentage of binucleated PtK2 cells in populations of mock RNAi (n = 200 cells) and PRC1 RNAi (n = 213 cells) cells.
-
Figure 4—figure supplement 1—source data 1
This spreadsheet contains the fluorescence intensity of PRC1 (normalized to background levels) in PtK2 mock RNAi and PRC1 RNAi spindles from immunofluorescence images (Figure 4—figure supplement 1C).
- https://cdn.elifesciences.org/articles/53807/elife-53807-fig4-figsupp1-data1-v2.xlsx
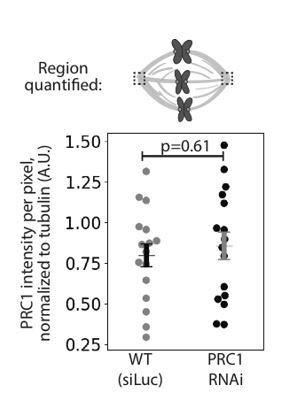
Figure 4—figure supplement 2

Immunofluorescence quantifications of inter-kinetochore distance and tubulin intensity between PRC1 RNAi and mock RNAi spindles.
(A) Inter-kinetochore distance of mock (Luciferase) RNAi (n = 22 kinetochore pairs from 12 cells) and PRC1 RNAi spindles in PtK2 cells (n = 44 kinetochore pairs from 24 cells) measured from immunofluorescence images. Plot shows mean ± SEM. The inter-kinetochore distance in PRC1 RNAi spindles is smaller than that of mock RNAi spindles (p=6×10⁻⁴, Mann-Whitney U test). (B) Average fluorescence intensity of tubulin above cytoplasmic background levels in mock RNAi (n = 12 cells) and PRC1 RNAi (n = 24 cells) spindles in PtK2 cells. Regions of interest (dashed-line box) include the whole spindle excluding poles (similar to Figure 4A) and the equator region near chromosomes. Plot shows mean ± SEM. Tubulin intensity remains unchanged upon PRC1 RNAi in the whole spindle (p=0.43, Mann-Whitney U test), but slightly lower in the equator region though not significant (p=0.08, Mann-Whitney U test).
-
Figure 4—figure supplement 2—source data 1
This spreadsheet contains the inter-kinetochore distance of mock RNAi and PRC1 RNAi spindles (Figure 4—figure supplement 2A), and the fluorescence intensity of tubulin (normalized to background levels) in mock RNAi and PRC1 RNAi spindles (Figure 4—figure supplement 2B) in PtK2 cells.
- https://cdn.elifesciences.org/articles/53807/elife-53807-fig4-figsupp2-data1-v2.xlsx
Figure 4—video 1
The microtubule crosslinker PRC1 mediates the specialized and short-lived kinetochore-fiber reinforcement near chromosomes.
Microneedle manipulation of a metaphase spindle in a PtK2 cell depleted of PRC1 by RNAi. The microneedle (Alexa-647, white circle) pulls (time 00:00) on the spindle’s outer k-fiber (GFP-tubulin, grey) over 60 s and deforms the spindle. The k-fiber bends around the needle, similar to WT, however it shows no negative curvature near chromosomes. This suggests that PRC1 is needed for the specialized, short-lived k-fiber reinforcement near chromosomes. Scale bar = 5 μm. Time in min:sec. Video was collected using a spinning disk confocal microscope, at a rate of 1 frame every 7 s during manipulation. Video has been set to play back at constant rate of 5 frames per second. Movie corresponds to still images from Figure 4D.
Figure 5
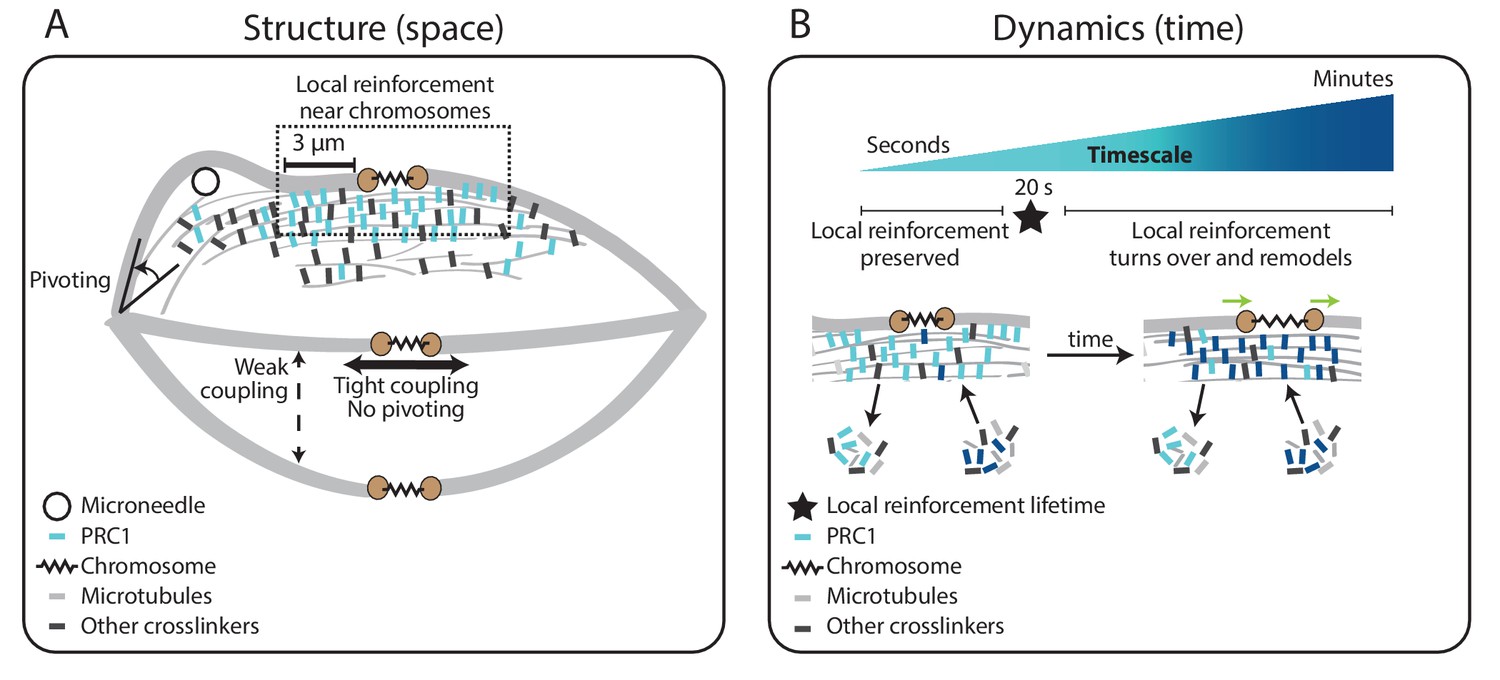
Model for specialized, short-lived reinforcement near chromosomes in the mammalian spindle.
(A) K-fiber reinforcement in space: Microneedle (black circle) manipulation of the mammalian spindle reveals that k-fibers (light grey) are weakly coupled to their neighbors (thin dashed vertical line), strongly coupled to their sisters (thick horizontal line), and pivot around the pole (black arrow) but not around chromosomes. K-fibers are locally reinforced (dashed box, 3 μm) near chromosomes (spring) through specialized, non-uniform mechanisms requiring the microtubule crosslinker PRC1 (light blue squares). Other crosslinkers in the spindle are shown in dark grey. (B) K-fiber reinforcement in time: Local reinforcement near chromosomes is preserved over seconds (with a lifetime of 20 s, black star) yet remodels over minutes as molecules turn over in the spindle center. This allows the local architecture in the spindle center to persist under transient force fluctuations, and yet respond to sustained forces. Such short-lived reinforcement could help protect chromosome-to-spindle connections while allowing them to remodel (green arrow) as mitosis progresses. For simplicity, we only depict PRC1 turning over as time evolves (from light blue to dark blue PRC1 molecules), though microtubules and other crosslinkers also turn over.
Author response image 1
Tables
Key resources table
| Reagent type (species) or resource | Designation | Source or reference | Identifiers | Additional information |
|---|---|---|---|---|
| Cell line (P. tridactylus) (male) | PtK2 GFP-tubulin | A. Khodjakov | PMID:12604591 | kidney epithelial, stably expressing GFP-α-tubulin |
| Antibody | Rabbit anti-PRC1 (H-70) | Santa Cruz Biotechnologies | Cat# sc-8356 | IF (1:100), RRID:AB_2169665 |
| Antibody | Mouse-anti-α-tubulin | Sigma-Aldrich | Cat# T6199 | IF (1:1000), WB(1:5000), RRID:AB_477583 |
| Antibody | Mouse anti-PRC1 | Biolegend | Cat# 629001 | WB (1:300), RRID:AB_2169532 |
| Antibody | Alexa 488 goat anti-mouse IgG | Invitrogen | Cat# A11001 | IF (1:500), RRID:AB_2534069 |
| Antibody | Alexa 647 goat anti-rabbit IgG | Life Technologies | Cat# A21244 | IF (1:500), RRID:AB_141663 |
| Antibody | Goat anti-mouse IgG-HRP | Santa Cruz Biotechnologies | Cat# sc-2055 | WB (1:10000), RRID:AB_631738 |
| Chemical compound, drug | Oligofectamine | Life Technologies, Carlsbad, CA | Cat# 12252011 | |
| Chemical compound, drug | FCPT | T. Mitchison | PMID:18559893 | 200 μM |
| Chemical compound, drug | BSA Alexa Fluor 555 conjugate | Invitrogen | Cat# A34786 | PMID:22653161 |
| Chemical compound, drug | BSA Alexa Fluor 647 conjugate | Invitrogen | Cat# A34785 | PMID:22653161 |
| Chemical compound, drug | Propidium Iodide | Thermo Fisher | Cat# P3566 | 25 μg/mL |
| Chemical compound, drug | CellMask-Orange | Thermo Fisher | Cat# C10045 | 5 μg/mL |
| Sequence-based reagents | siRNA against PtK PRC1: | Sigma | PMID:26252667 | 5'-GGACTGAGGUUGUCAAGAA-3' |
| Software, algorithm | Python | 2.7 and 3.0 | ||
| Software, algorithm | FIJI | PMID:22743772 | ||
| Software, algorithm | Metamorph | MDS Analytical Technologies | 7.10.3 |
Additional files
-
Source code 1
This script generates a sequence of steps in the x and y directions used to program the movement of the micromanipulator.
- https://cdn.elifesciences.org/articles/53807/elife-53807-code1-v2.py
-
Source code 2
This script calculates curvature along a tracked k-fiber, used to generate Figure 3B, Figure 3H, Figure 4D and Figure 3—figure supplement 1A.
- https://cdn.elifesciences.org/articles/53807/elife-53807-code2-v2.py
-
Source code 3
This script builds strain maps, used to generate Figure 2C and Figure 2—figure supplement 2B.
- https://cdn.elifesciences.org/articles/53807/elife-53807-code3-v2.py
-
Transparent reporting form
- https://cdn.elifesciences.org/articles/53807/elife-53807-transrepform-v2.docx
Download links
A two-part list of links to download the article, or parts of the article, in various formats.
Downloads (link to download the article as PDF)
Open citations (links to open the citations from this article in various online reference manager services)
Cite this article (links to download the citations from this article in formats compatible with various reference manager tools)
Microneedle manipulation of the mammalian spindle reveals specialized, short-lived reinforcement near chromosomes
eLife 9:e53807.
https://doi.org/10.7554/eLife.53807


