Structure and physiological function of the human KCNQ1 channel voltage sensor intermediate state
- Department of Biochemistry, Vanderbilt University, United States
- Center for Structural Biology, Vanderbilt University, United States
- Department of Biomedical Engineering, Center for the Investigation of Membrane Excitability Disorders, and Cardiac Bioelectricity, and Arrhythmia Center, Washington University in St. Louis, United States
- Departments of Chemistry and Pharmacology, Vanderbilt University, United States
- Department of Medicine, Division of Clinical Pharmacology, Vanderbilt University Medical Center, United States
- Department of Pharmacology, Northwestern University Feinberg School of Medicine, United States
- Department of Bioinformatics, Vanderbilt University Medical Center, United States
- Department of Chemistry, University of Alabama in Huntsville, United States
- Department of Medicine, Vanderbilt University Medical Center, United States
Figures
Figure 1 with 3 supplements
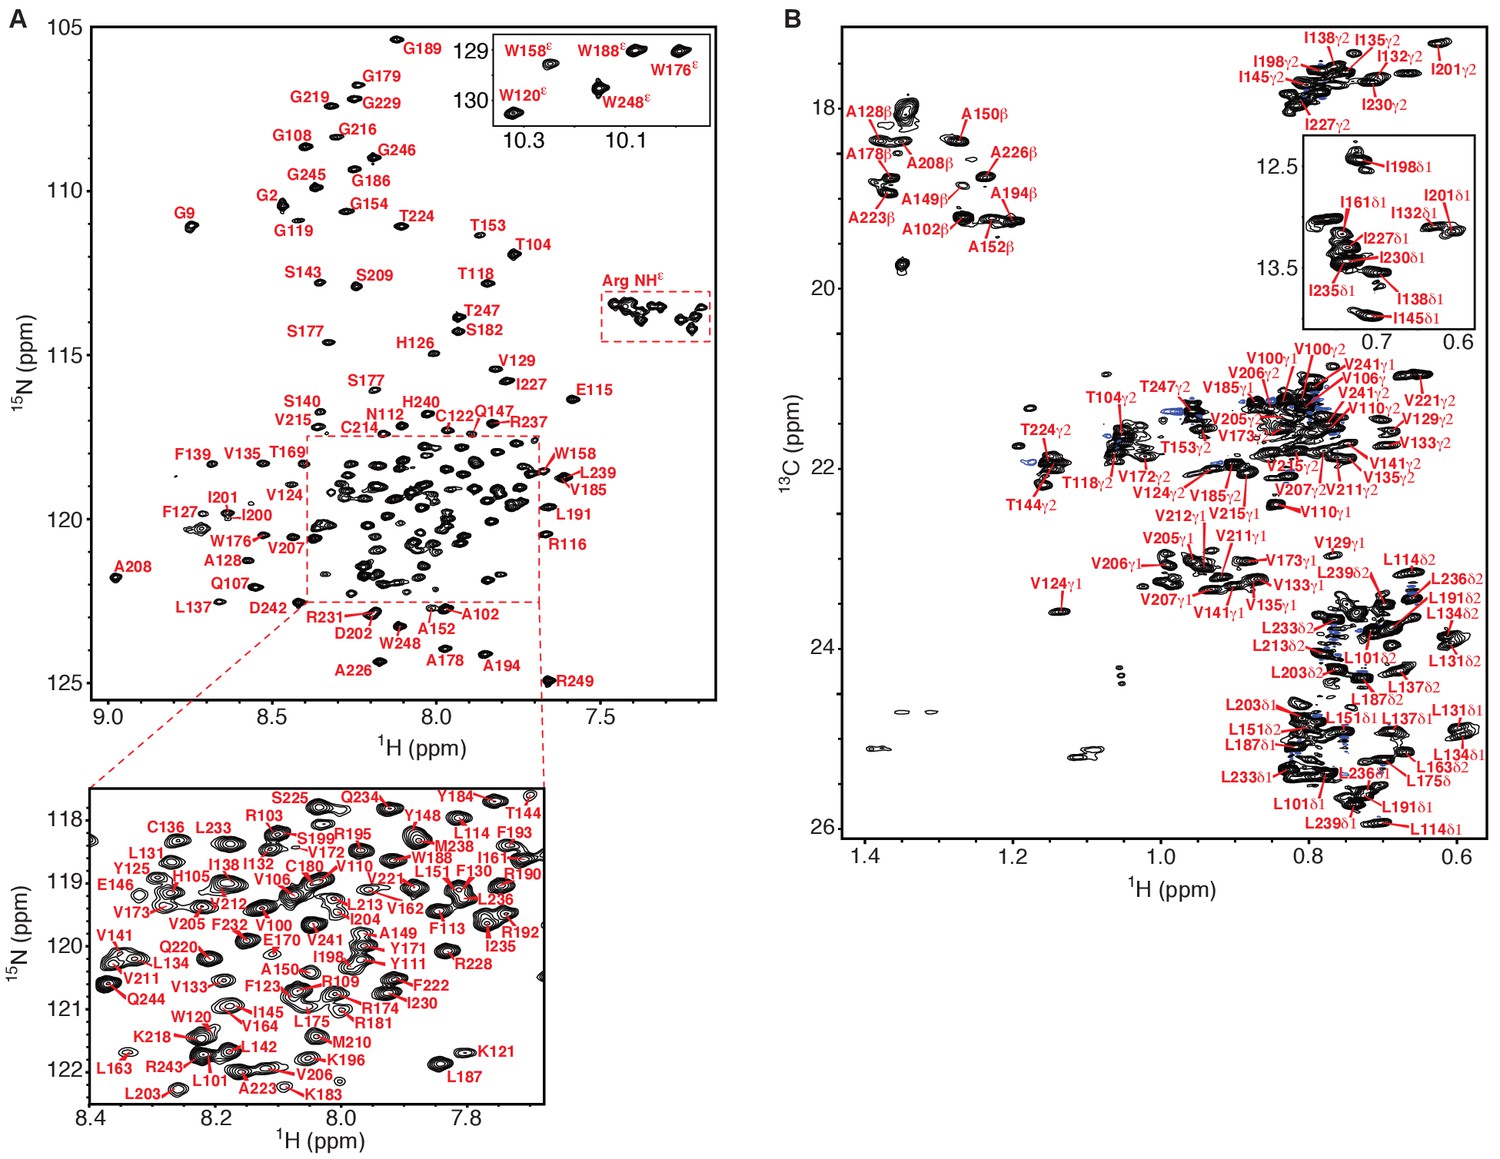
NMR spectra of the human KCNQ1 voltage-sensor domain.
(A) 1H-15N TROSY-HSQC spectrum recorded at 900 MHz of 2H,13C,15N-Q1-VSD in LMPG micelles. Backbone amide peaks for 140 out of 147 non-proline residues (95%) have been assigned. Only a single set of peaks is observed. (B) 1H-13C HSQC methyl optimized spectrum recorded at 900 MHz of 13C,15N-Q1-VSD in perdeuterated LMPG micelles. Methyl groups for 58 out of 68 (85%) residues were assigned (Ala 10 of10, Thr 6 of 8, Ile 9 of 11, Val 18 of 22, Leu 15 of 17). In addition to the presence of a very limited number of unassigned peaks from the VSD in this spectrum other unassigned peaks likely derive from natural abundance 13C in residually protonated LMPG and also from the fully protonated buffer components TCEP and MES. The chemical shift assignments illustrated for panels A and B shift have been deposited in BioMagResBank (BMRB ID 30517).
Figure 1—figure supplement 1
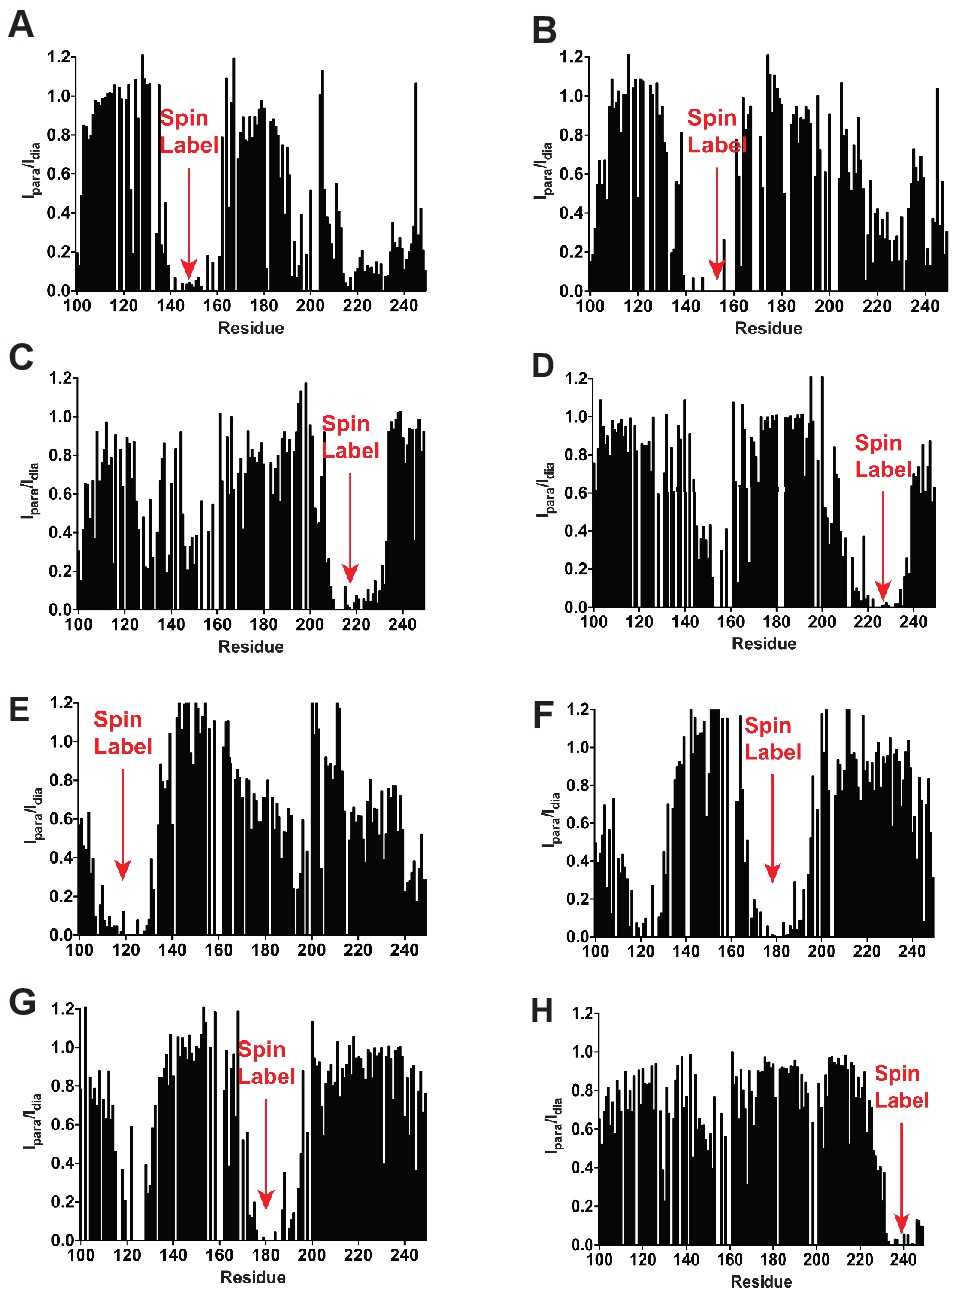
Long range PREs are consistent with the expected KCNQ1 VSD topology in LMPG micelles.
The residue positions of the spin-labeled cysteines for each sample are : (A) 144-SL (B) 155-SL (C) 214-SL (D) 224-Sl (E) 121-SL (F) 177-Sl (G) 180-SL (H) 238-SL.
-
Figure 1—figure supplement 1—source data 1
Excel file with numerical data used for Figure 1—figure supplement 1.
- https://cdn.elifesciences.org/articles/53901/elife-53901-fig1-figsupp1-data1-v2.xlsx
Figure 1—figure supplement 2

TALOS-N secondary structure analysis of backbone chemical shifts (top panel) and (bottom panels) deviations of the (Osteen et al., 2012) Cα and carbonyl 13C’ chemical shifts from random coil values.
The chemical shift data for the KCNQ1 VSD been deposited in BioMagResBank (BMRB ID 30517).
-
Figure 1—figure supplement 2—source data 1
Excel file with numerical data used for Figure 1—figure supplement 2.
- https://cdn.elifesciences.org/articles/53901/elife-53901-fig1-figsupp2-data1-v2.xlsx
Figure 1—figure supplement 3
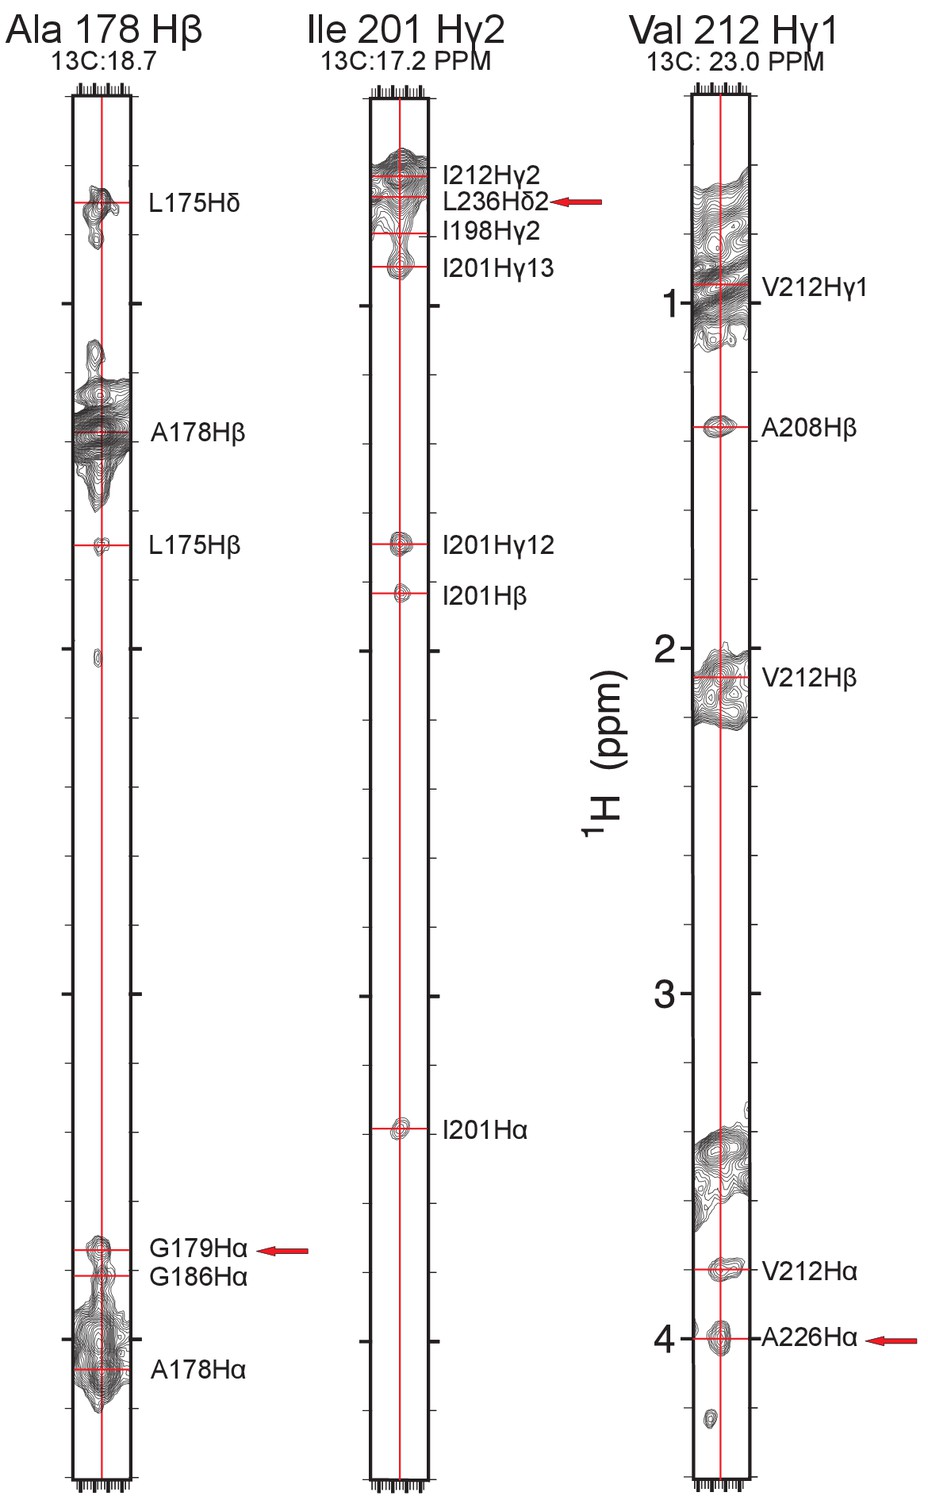
Examples of NOE measurements.
Example strip plots showing long-range methyl-methyl and methyl-backbone Hα proton NOEs (red arrows) taken from the methyl-optimized 3D 13C-edited NOESY recorded on a 13C,15N-labeled sample in deuterated LMPG. The chemical shift assignments illustrated in this figure have been deposited in BioMagResBank (BMRB ID 30517).
Figure 2 with 1 supplement

Structure of the KCNQ1 VSD.
(A) The human KCNQ1 VSD NMR-determined ensemble after molecular dynamics refinement in a hydrated DMPC bilayer (PDB ID 6MIE, see statistics in Table 1 and also Figure 2—figure supplement 1) (B) Cryo-EM structure of the Xenopus KCNQ1 VSD (PDB ID 5VMS) (Sun and MacKinnon, 2017). (C) Representative low energy NMR structure from PDB 6MIE in a hydrated DMPC bilayer. In panels A-C, the transmembrane helices S1, S2, S3, and S4, are colored bluish green, yellow, vermillion, and sky blue respectively. The S2-S3 linker and S0 helices are colored reddish purple and orange. The approximate position of the membrane-water interfaces is indicated by a pair of black lines in panels A and B.
Figure 2—figure supplement 1
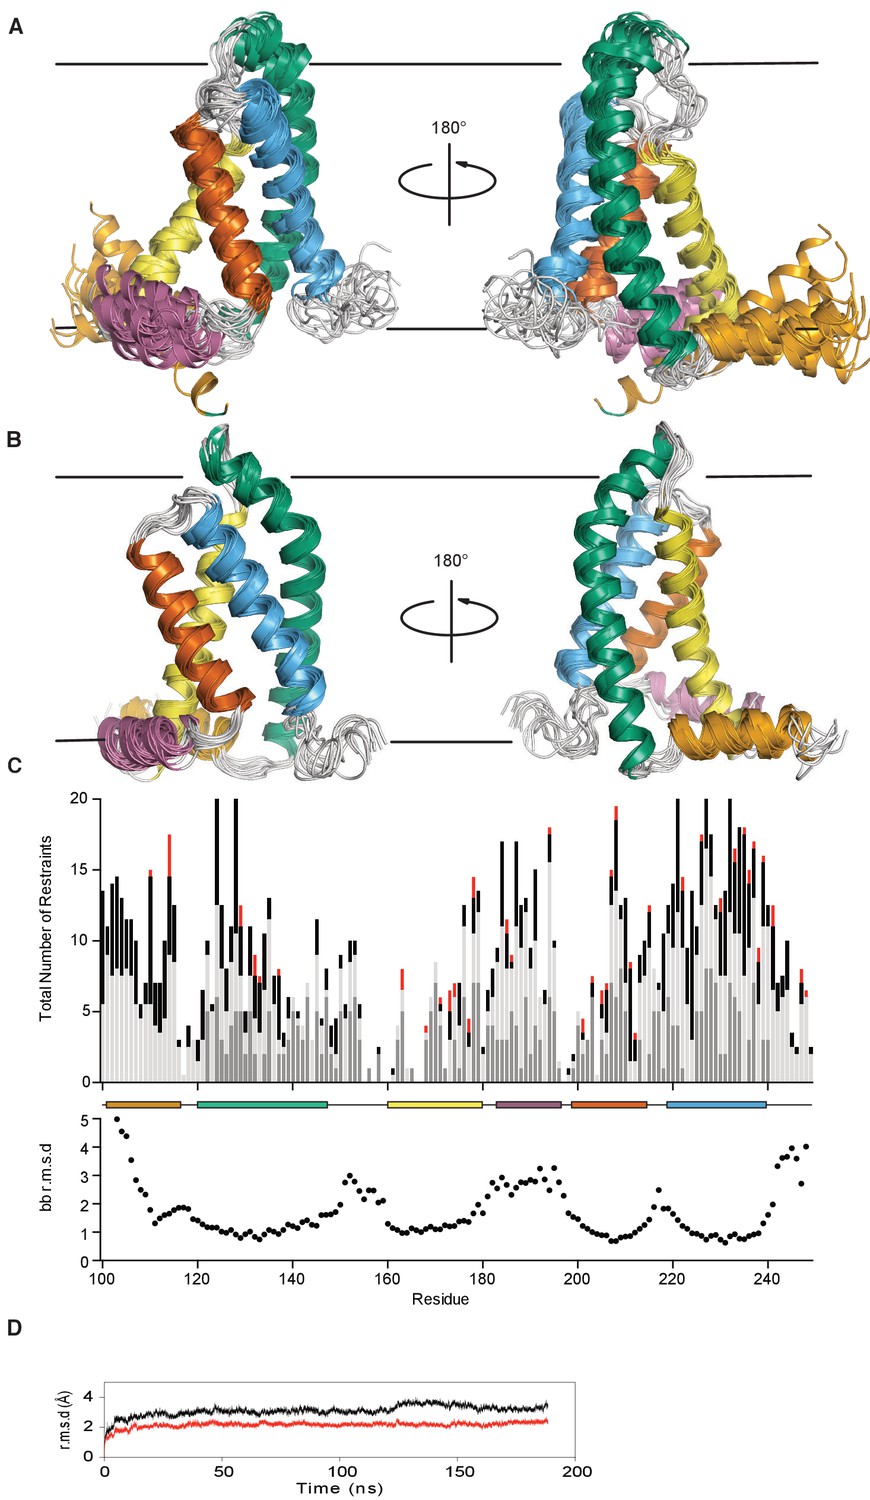
KCNQ1-VSD XplorNIH-determined structural ensemble, before and after molecular dynamics refinement.
(A) The ensemble is comprised of the top 15 lowest energy structures out of 150 conformations generated by NMR data-restrained XPLOR-NIH calculations (no bilayer). The transmembrane helices S1, S2, S3, and S4, are colored bluish green, yellow, vermillion, and sky blue respectively. The S2-S3 linker and S0 helices are colored orange and reddish purple. The loop between S1 (bluish green) and S2 (yellow) appears disordered due to lack of NMR-derived restraints. This does not necessarily mean this region does not adopt stable secondary structure. The approximate position of the membrane is indicated by a pair of gray lines. (B) The unrestrained molecular dynamics refined ensemble (MD carried out in an explicit hydrated DMPC bilayer) colored as in panel A (corresponding to PDB ID 6MIE containing 10 conformers). (C) The upper panel shows the total number of distance restraints per residue. For NOE-derived restraints that define a distance between two atoms in different residues, each residue receives a count of 0.5 per restraint. Long range, medium, and sequence distance restraints are colored red, black, and light gray, respectively. For PRE-derived restraints, which define the distance between a given backbone amide and the MTSL free radical of the spin labeled residue, a count of 1.0 is added to the non-labeled residue. PRE-derived restraints are colored dark gray. The lower panel plots the backbone r.m.s.d. vs. residue number for the XPLOR-NIH ensemble. The helical sections of secondary structure are indicated with colored boxes corresponding to the cartoon representation. (D) The backbone r.m.s.d. to seed starting coordinates of the transmembrane helices (red) and all residues (black) over the course of the unrestrained trajectory is shown.
-
Figure 2—figure supplement 1—source data 1
Text file with coordinates (PDB format) of the XPLOR-NIH structure ensemble for the KCNQ1-VSD prior to molecular dynamics.
- https://cdn.elifesciences.org/articles/53901/elife-53901-fig2-figsupp1-data1-v2.txt
-
Figure 2—figure supplement 1—source data 2
Excel file with numerical data used for Figure 2—figure supplement 1C, top panel.
- https://cdn.elifesciences.org/articles/53901/elife-53901-fig2-figsupp1-data2-v2.xlsx
-
Figure 2—figure supplement 1—source data 3
Excel file with numerical data used for Figure 2—figure supplement 1C, bottom panel.
- https://cdn.elifesciences.org/articles/53901/elife-53901-fig2-figsupp1-data3-v2.xlsx
-
Figure 2—figure supplement 1—source data 4
Excel file with numerical data used for Figure 2—figure supplement 1D, top panel.
- https://cdn.elifesciences.org/articles/53901/elife-53901-fig2-figsupp1-data4-v2.xlsx
Figure 3
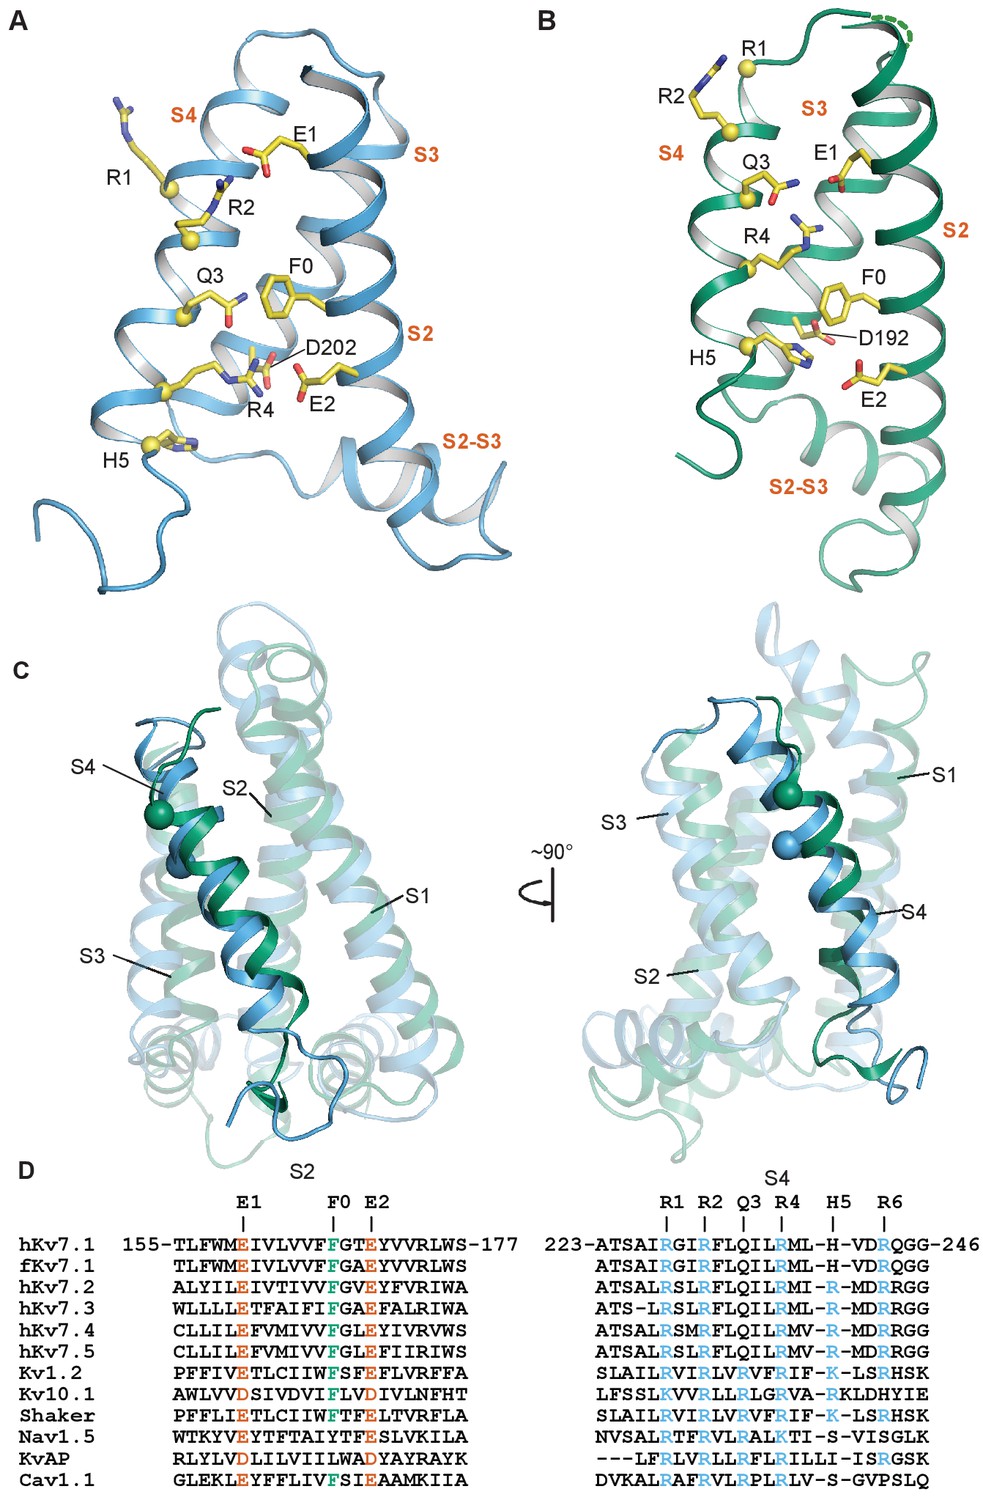
Comparison of intermediate and activated KCNQ1 VSD conformations.
(A) Intermediate conformation of human KCNQ1 VSD (1st structure in the PDB 6MIE ensemble). (B) Activated conformation of the Xenopus KCNQ1 VSD (PDB 5VMS) (Sun and MacKinnon, 2017). In both panels, the Cα atoms of the S4 polar residues are shown as yellow spheres and the transmembrane helices are labeled in vermillion text. S0 and S1 are not shown to improve clarity of side chain interactions. (C) Overlay of the NMR (sky blue) and cryo-EM (bluish green) structures of the KCNQ1 VSD. All structural elements other than the S4 helix are semi-transparent. The Cα of the human residue G229 and the corresponding Xenopus residue G219 are shown as spheres. (D) Sequence alignments for S2 and S4 in the KCNQ/Kv7 family and select other voltage-gated ion channels.
Figure 4
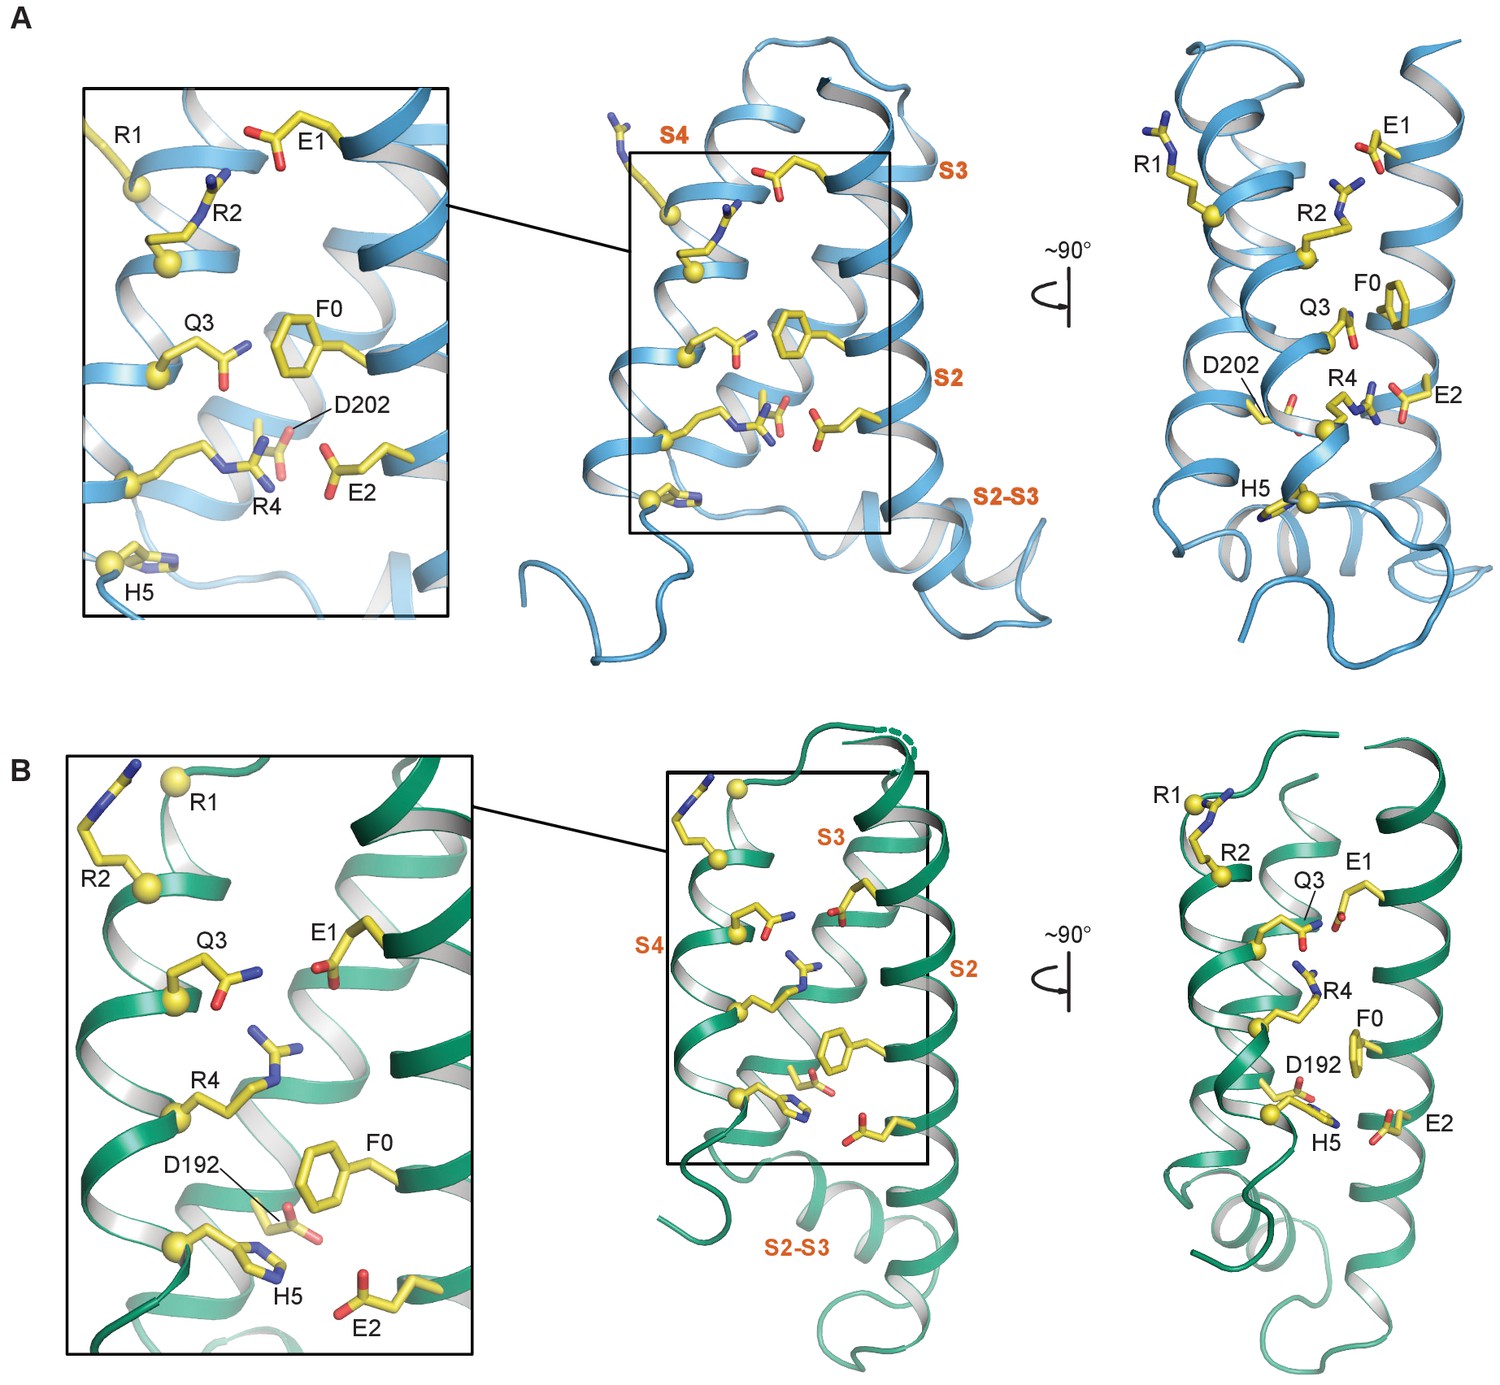
S2—S4 salt bridges/hydrogen bonds in the NMR and cryo-EM structures of the KCNQ1 VSD.
(A) Intermediate state conformation of human KCNQ1 VSD (1st structure in the PDB 6MIE ensemble). Of particular note are the ionic interactions of E1-R2 and E2-R4, as well as, the close packing of Q3 and F0. (B) Activated state conformation of the Xenopus KCNQ1 VSD (PDB 5VMS). Note the gating charge residue pairings of E1-R4 and H5-E2. In all panels, the Cα atoms of the S4 polar residues are shown as yellow spheres and the transmembrane helices are labeled in vermillion text. S0 and S1 are not shown to improve clarity of side chain interactions.
Figure 5 with 1 supplement
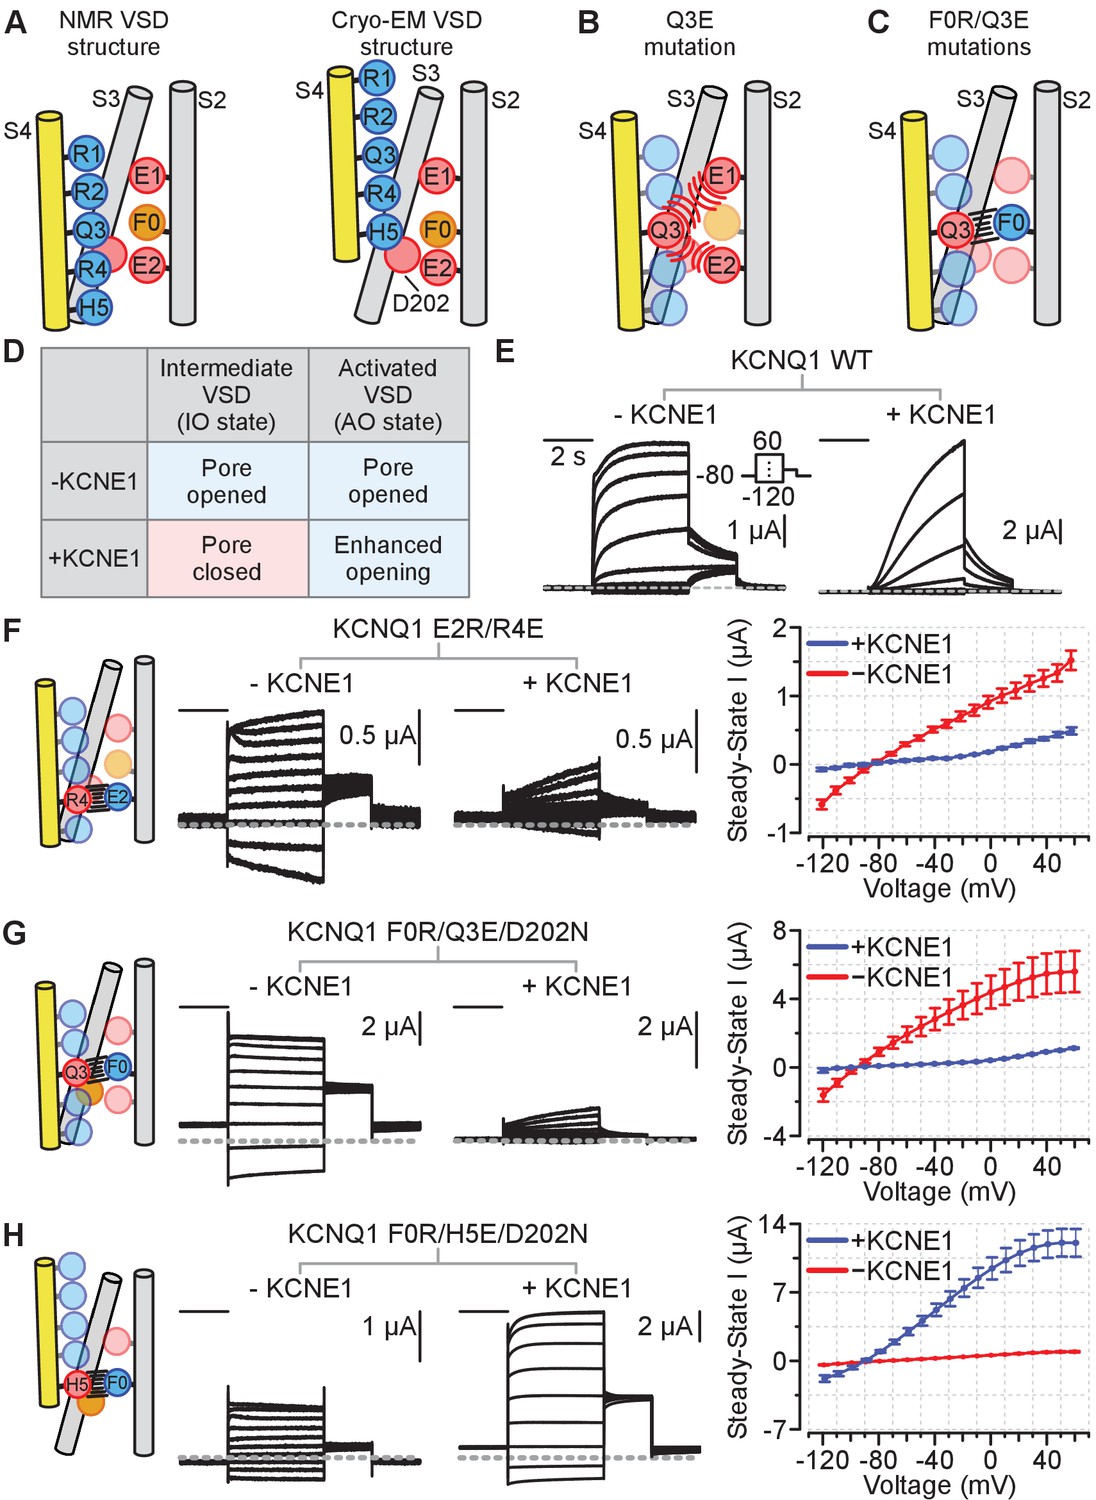
Schematics and electrophysiology data validating the intermediate and activated KCNQ1 VSD functional states utilizing auxiliary subunit KCNE1 regulation as a probe.
Amino acid residue nomenclature: E2 = E170, R4 = R237, F0 = F167, Q3 = Q234, and H5 = H240. Numbering corresponds to the human KCNQ1 sequence. All error bars are ± SEM. All horizontal scale bars correspond to 2 s. (A) A cartoon schematic illustrating key S2, S3, and S4 residues interactions found in the NMR and cryo-EM VSD structures. Positive and polar gating residues on S4 (R1–H5) are colored blue, negative counter charges on S2 (E1, E2) and S3 (D202) are colored red, and the hydrophobic plug on S2 (F0) is colored orange. (B) A cartoon schematic displaying how the S4 charge-reversal mutation (Q3E) disrupts VSD function. The Q3E mutation creates electrostatic repulsion with the negative counter charges (E1, E2) and leads to VSD loss of function. (C) A cartoon schematic showing how the double charge-reversal mutations Q3E/F0R bias the VSD conformation. The double mutations ensure that electrostatic interactions between S2 and S4 are only favorable when the two mutation sites are in alignment (Q3E-F0R). (D) Table detailing KCNE1 effect on the KCNQ1 pore domain associated with the intermediate or activated VSD states based on prior studies. KCNE1 suppresses the IO state current by decreasing open probability, while enhancing the AO state current, in part by increasing unitary conductance (Zaydman et al., 2014; Hou et al., 2017; Hou et al., 2019; Hou et al., 2020). (E) Representative current recordings from the KCNQ1 channel without (left) and with (right) KCNE1 co-expression. The voltage protocol is shown in the inset and applies to all exemplars in this figure. (F–H) Left: Cartoon schematic of the double-charge reversal mutation and the predicted S2-S4 registry for the mutant tested. Middle: Exemplar currents for the mutant recorded with and without KCNE1 co-expression. Right: Average steady-state current vs. voltage (IV) curves for the respective mutants in the absence or presence of KCNE1 co-expression. The inset in panel E shows the voltage protocol. n = 5 (F), 5 (G), 6 (H). Currents were collected with 10 mV interval, but examples are shown with 20 mV interval for clarity.
-
Figure 5—source data 1
Excel file with numerical data used for Figure 5.
- https://cdn.elifesciences.org/articles/53901/elife-53901-fig5-data1-v2.xlsx
Figure 5—figure supplement 1
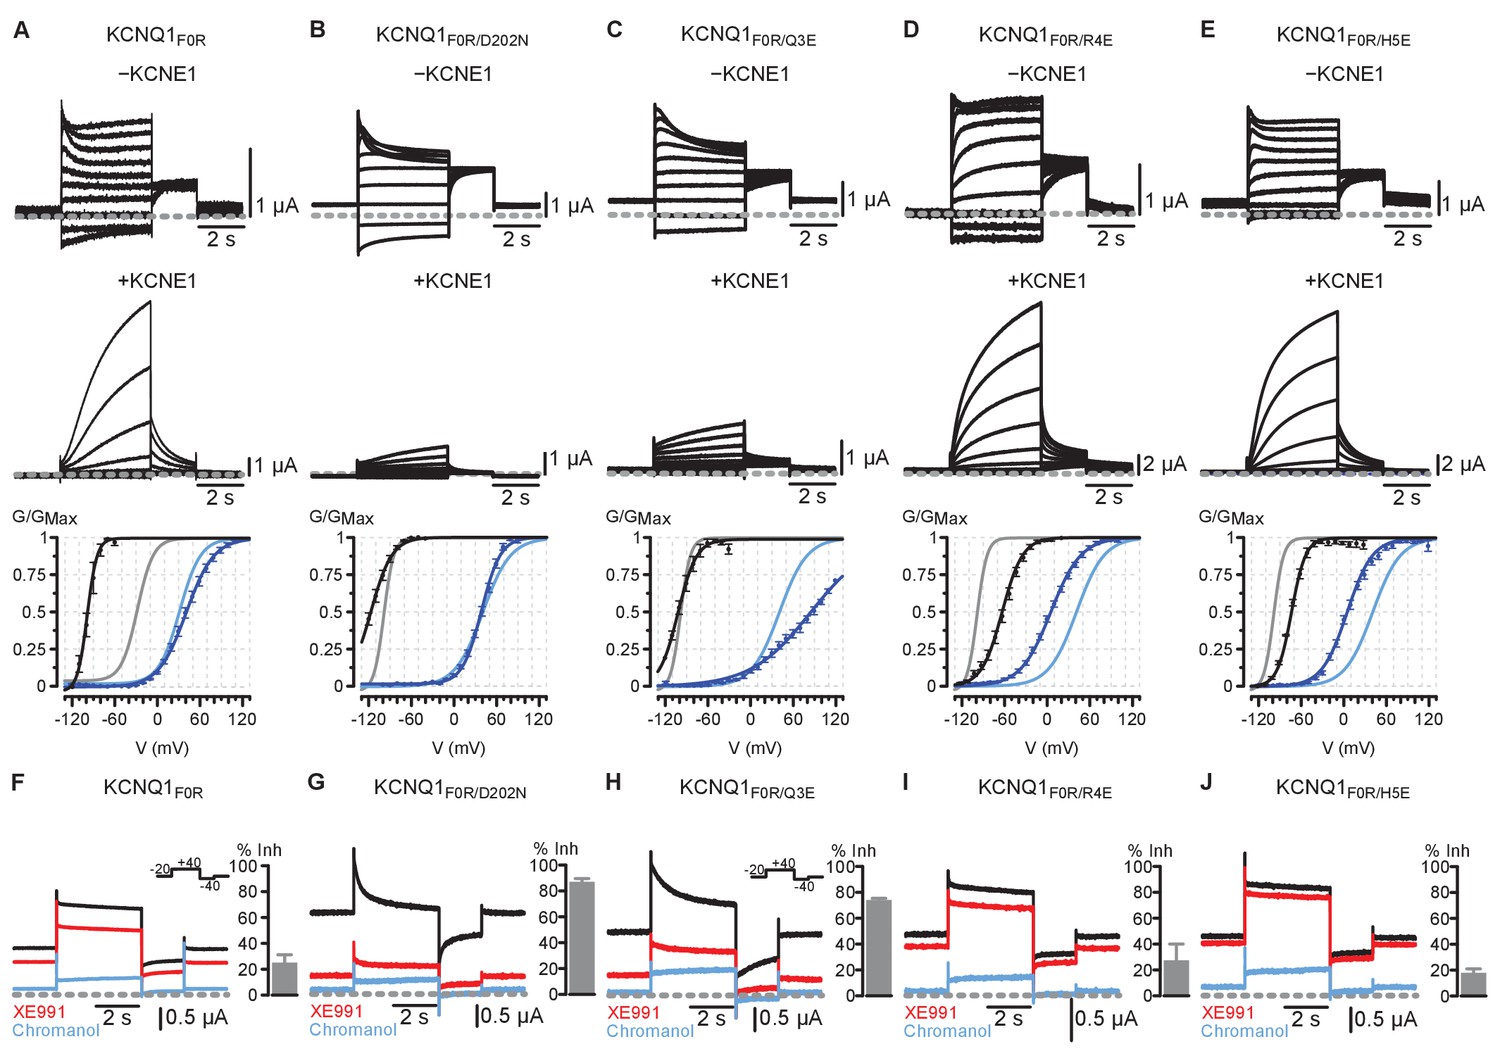
Electrophysiology results for KCNQ1 F0R single and double mutants with and without KCNE1 co-expression, and with XE991 exposure.
F0 = F167; Q3 = Q234; R4 = R237; H5 = H240. Residue numbers correspond to human KCNQ1. All error bars are ± SEM. (A) Top: Current recordings of KCNQ1 F0R single mutant with and without KCNE1 co-expression. Bottom: Average GV relationships for KCNQ1 F0R (black, n = 3), KCNQ1 F0R + KCNE1 (dark blue, n = 5), KCNQ1 WT (gray), and KCNQ1 WT + KCNE1 (light blue). The single mutant KCNQ1 F0R exhibited dramatic left-shifted voltage-dependent activation compared to KCNQ1 WT, suggesting that the mutation destabilizes the resting state VSD. KCNE1 co-expression restored voltage-dependent activation to near WT levels and potentiated ionic current compared to the α-subunit alone, suggesting that KCNE1 partly rescues the ability of the single mutant F0R to gate normally. (B–E) Top: Current recordings of KCNQ1 F0R double mutants with and without KCNE1 co-expression. Bottom: Average GV relationships for the KCNQ1 double mutant α-subunit only (black), KCNQ1 double mutant + KCNE1 (dark blue), KCNQ1 F0R (gray), and KCNQ1 F0R + KCNE1 (light blue). All n > 3. (B) F0R/D202N featured a further left-shifted voltage-dependent activation compared to the F0R single mutant. KCNE1 co-expression greatly suppressed F0R/D202N current, suggesting that F0R/D202N favored the intermediate VSD state and IO channel state. (C) F0R/Q3E demonstrated current suppression upon KCNE1 co-expression when compared to α-subunit alone, suggesting that F0R/Q3E favored the intermediate VSD state and the IO channel state. Furthermore, the conductance-voltage (G–V) curve for the mutant KCNQ1 co-expressed with KCNE1 tracks the development of the AO state because KCNE1 suppresses IO-state current. F0R/Q3E+KCNE1 featured a right-shifted voltage-dependent activation compared to F0R single mutant, consistent with the mutant favoring the intermediate VSD state and resisting transition into the AO state. (D–E) F0R/R4E and F0R/H5E double mutants exhibited an opposite phenotype compared to F0R/Q3E. Upon KCNE1 co-expression, ionic currents for F0R/R4E and F0R/H5E were potentiated, and voltage-dependent activation was left-shifted compared to the F0R single mutant. Together, these results suggest F0R/R4E and F0R/H5E favored the activated VSD state and the AO state. Overall, the F0R/Q3E and F0R/D202N double mutants demonstrated phenotypes consistent with the mutants favoring the IO channel state; while F0R/R4E and F0R/H5E exhibited distinct and opposite phenotypes, suggesting that the latter mutants promote the AO channel state. However, the presence of voltage-dependence in these mutants represents a confounding factor, as the VSD retain voltage sensitivity. By adding the S3 D202N mutation into the F0R/Q3E and F0R/H5E mutants, this voltage-dependence was abolished (Main Figure 5), suggesting that the triple mutants highly stabilize the VSD states and that the charge transfer residue S3 D202 plays a role in maintaining the voltage-dependence of the mutants F0R/Q3E and F0R/H5E. Importantly, F0R/Q3E/D202N and F0R/H5E/D202N demonstrated qualitatively identical phenotypes compared to F0R/Q3E and F0R/H5E (Main Figure 5), but without the confounding factor of voltage-dependence. (F–J) Steady-state current recordings of KCNQ1 mutants in control ND96 solution (black), 5 μM XE991 solution (red), and 150 μM chromanol 293B solution (blue). Note that the holding potential was −20 mV as shown by the inset voltage protocols. The −20 mV holding potential yielded non-zero currents before the test pulse because the mutants were constitutively opened. Bar plots show average chromanol-sensitive current inhibition (see Materials and methods). All n > 3. Mutants F0R/D202N and F0R/Q3E demonstrated robust and characteristic IO-current inhibition by 5 μM XE991, consistent with the idea that F0R/D202N and F0R/Q3E favor the IO state. In contrast, mutants F0R, F0R/R4E, and F0R/H5E featured the characteristic AO-current insensitivity to 5 μM XE991, consistent with the hypothesis that these mutations promote the AO state. Critically, XE991 data provided consistent categorization of the F0R single and double mutants when compared to KCNE1 co-expression data (panels A-E), lending further support to the conclusion that these mutants can be classified as promoting the IO state (F0R/D202N, F0R/Q3E) or the AO state (F0R/R4E, F0R/H5E).
-
Figure 5—figure supplement 1—source code 1
MATLAB script that takes in tail current data obtained from PatchMaster program (see Key Resources Table), fits the data with a Boltzmann equation, and outputs the best fit parameters.
- https://cdn.elifesciences.org/articles/53901/elife-53901-fig5-figsupp1-code1-v2.m
-
Figure 5—figure supplement 1—source data 1
Excel file with numerical data used for Figure 5—figure supplement 1.
- https://cdn.elifesciences.org/articles/53901/elife-53901-fig5-figsupp1-data1-v2.xlsx
Figure 6
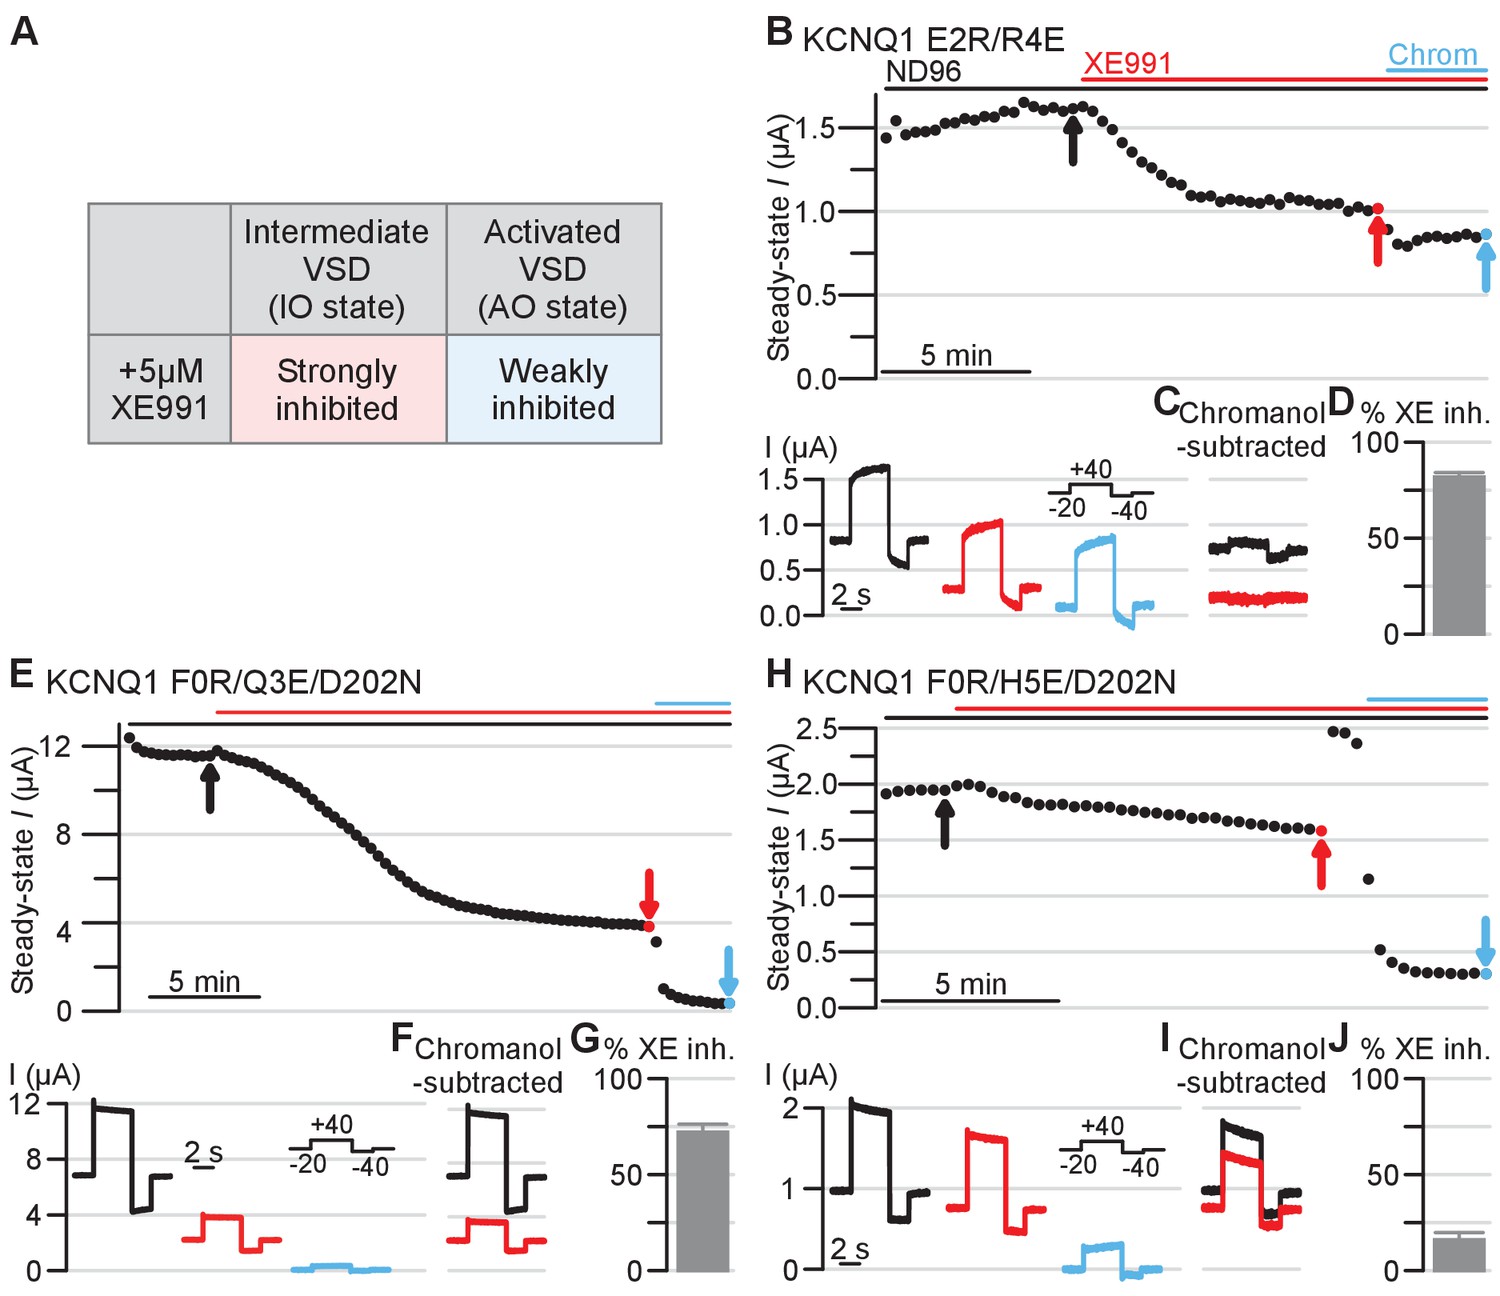
Electrophysiology validating the intermediate and activated KCNQ1 VSD functional states utilizing XE991 pharmacology as a probe.
Amino acid residue nomenclature and numbering and error bars are similar as in Figure 5. (A) Table outlining 5 µM XE991 effect on KCNQ1 IO and AO state currents based on prior studies (Zaydman et al., 2014). (B) Top: Exemplar diary plots of E2R/R4E drug studies demonstrating current amplitude over time. Cells were held at −20 mV and pulsed to +40 mV for 4 s and −40 mV for 2 s every 20 s. Each point shows the steady-state current amplitude at the end of the 4 s +40 mV test pulse. Cells were recorded in ND96 solution and the top bars indicate application of 5 μM XE991 (red) and 150 μM chromanol 293B (blue). Scale bar indicates 5 min. Bottom: Current traces for the E2R/R4E mutant in control ND96 solution (black), in solution containing 5 μM XE991 (red), and in solution containing 150 μM chromanol 293B (blue). The arrows in the diary plot indicate respective traces shown. Note that because the holding potential was −20 mV and the mutant channels are constitutively open, non-zero currents were observed before the test pulse. (C) Chromanol-subtracted E2R/R4E currents under control (black) and 5 μM XE991 (red) conditions for the traces shown in panel B. The chromanol-subtracted currents were calculated by subtracting current after chromanol application (blue, panel B) from the control current (black, panel B) and the current after XE991 application (red, panel B). Percent E2R/R4E current inhibition by XE991 was calculated from the chromanol-subtracted currents using the ratio between the steady-state current amplitude under XE991 and control conditions (see Materials and methods). (D) Average percent inhibition of the E2R/R4E currents by 5 μM XE991, as quantified by the chromanol-subtracted currents (n = 6). Error bar indicates SEM and applies to all error bars in this figure. (E–J) Same as panels B-D, but showing results for KCNQ1 F0R/Q3E/D202N and F0R/H5E/D202N mutants (n = 6 for both mutants).
-
Figure 6—source data 1
Excel file with numerical data used for Figure 6.
- https://cdn.elifesciences.org/articles/53901/elife-53901-fig6-data1-v2.xlsx
Figure 7
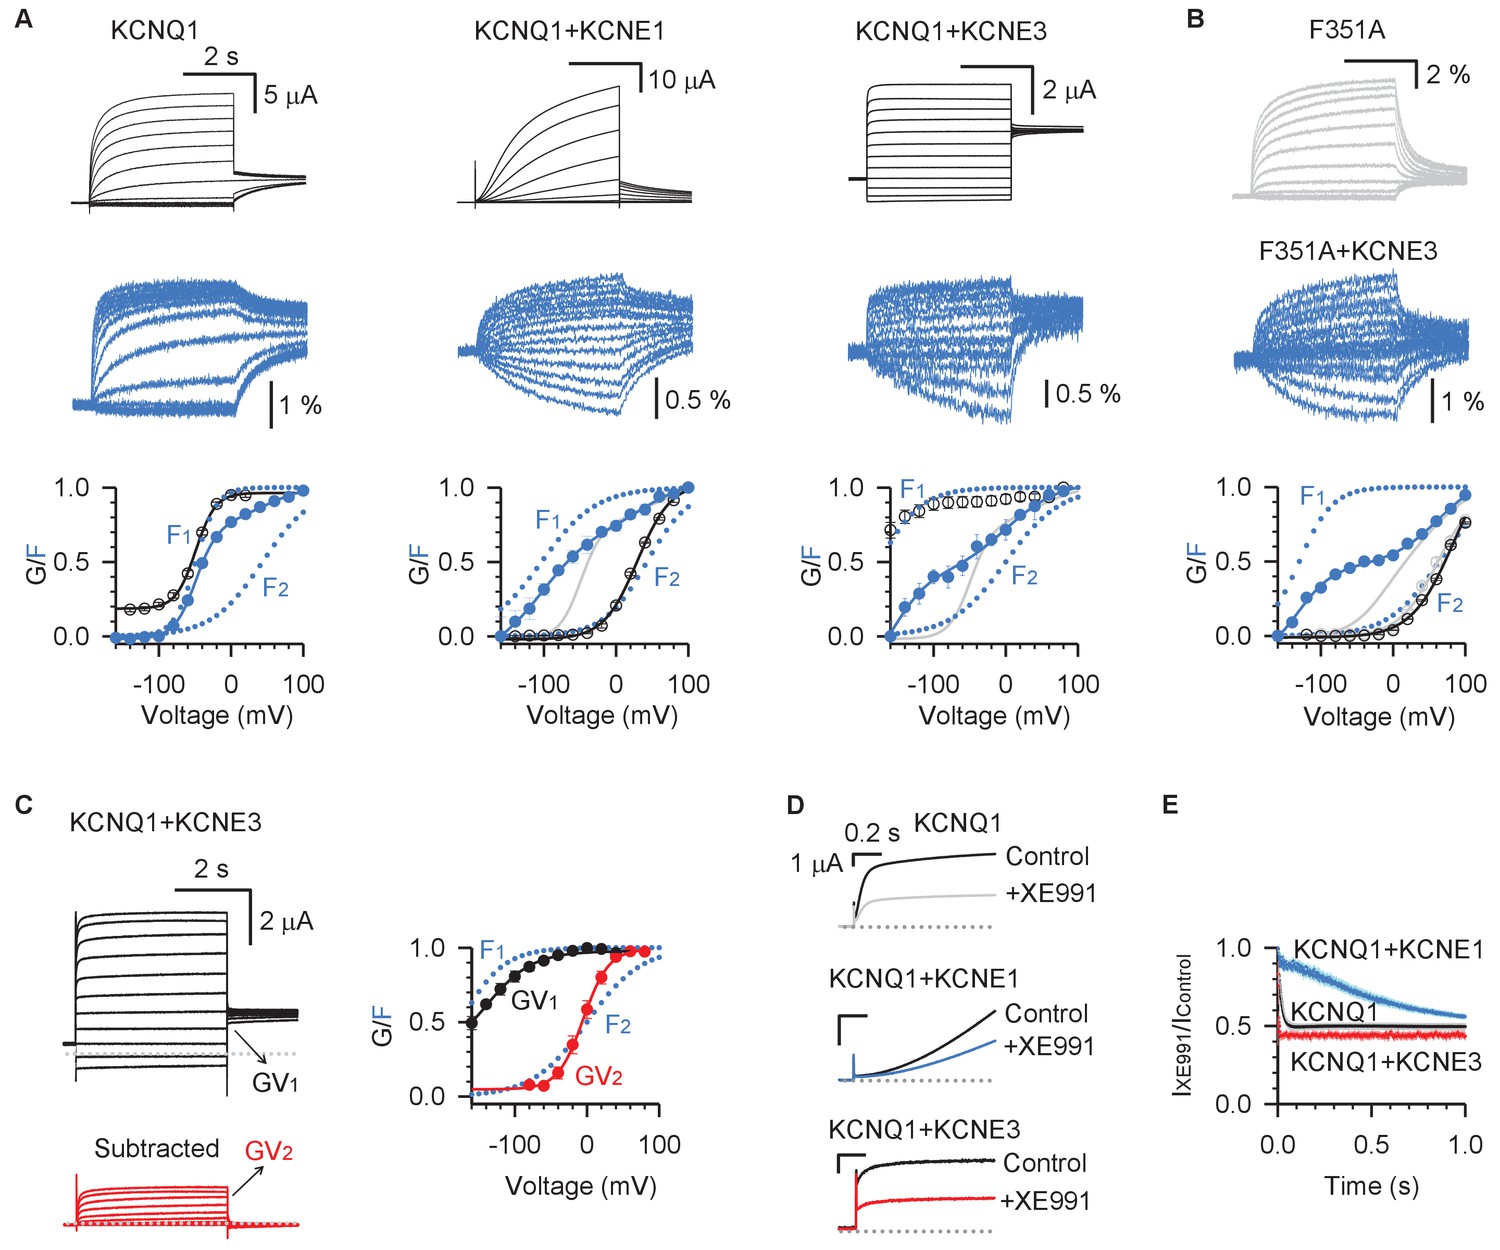
KCNE3 shifts the voltage dependence of the intermediate-open state to render its conductance relevant under physiological conditions.
(A) Voltage-clamp fluorometry recordings for pseudo-WT (C214A/G219C/C331A) KCNQ1 (left), KCNQ1+KCNE1 (middle), and KCNQ1+KCNE3 (right). Current (black) and fluorescence (blue) were recorded with voltages from −160 mV to +100 mV in 20 mV increments and then back to −40 mV. The bottom panels are the G–V (black) and F–V (blue) relationships with F1 and F2 components (dotted lines). The F–V relationship for KCNQ1 (gray) is also shown with KCNQ1+KCNE1 and KCNQ1+KCNE3 for comparison. (B) VCF recordings for KCNQ1-F351A in the presence (blue) and absence (gray) of KCNE3. The bottom of this panel shows the G–V and F–V relationships for KCNQ1-F351A (gray) and KCNQ1-F351A+KCNE3 (blue). (C) Left: WT KCNQ1+KCNE3 currents (black) with voltages from −120 mV to +80 mV in 20 mV increments and back to −40 mV to test the tail current. The red traces are total KCNQ1+KCNE3 currents with the instantaneous current subtracted, which show typical time- and voltage-dependent activation. Right: The two steps of KCNQ1+KCNE3 voltage sensor activation, F1 and F2, are shown in blue, while transitions of the two conductive states are shown in black (GV1) and red (GV2). (D) Overlays of stabilized currents in control solutions (black traces for all channels) and after applying 5 µM XE991 for KCNQ1 (gray), KCNQ1+KCNE1 (blue), and KCNQ1+KCNE3 (red). (E) Time-dependent inhibition of 5 µM XE991 of KCNQ1 (black), KCNQ1+KCNE1 (blue), and KCNQ1+KCNE3 (red). Time-dependent inhibition was calculated by dividing the stabilized currents in solutions containing 5 µM XE991 by that of control at the same time point. X-axis is the time after the start of the +40 mV test pulse. In all cases, n ≥ 3.
-
Figure 7—source data 1
Excel file with numerical data used for Figure 7.
- https://cdn.elifesciences.org/articles/53901/elife-53901-fig7-data1-v2.xlsx
Author response image 1

XplorNIH NMR ensemble prior to MD refinement displaying the orientation of the key sidechain residues.
The S0 and S1 helices are not shown to improve clarity.
Author response image 2
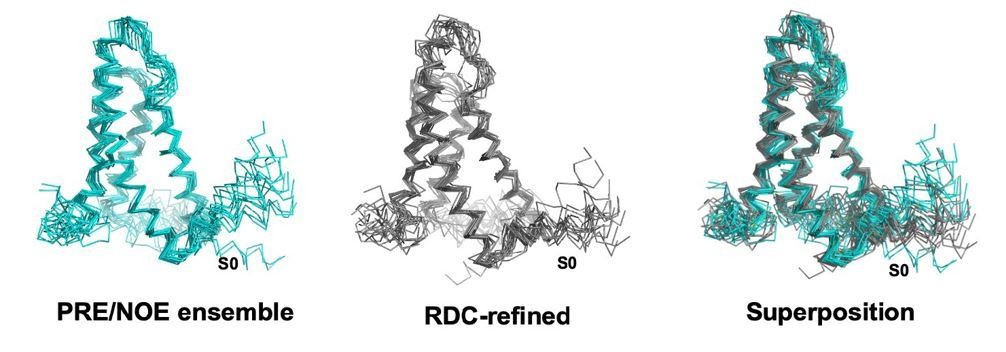
XplorNIH ensemble before (left) and after (middle) RDC refinement.
The RDC refined ensemble is colored gray and the NOE/PRE derived ensemble is colored teal.
Author response image 3
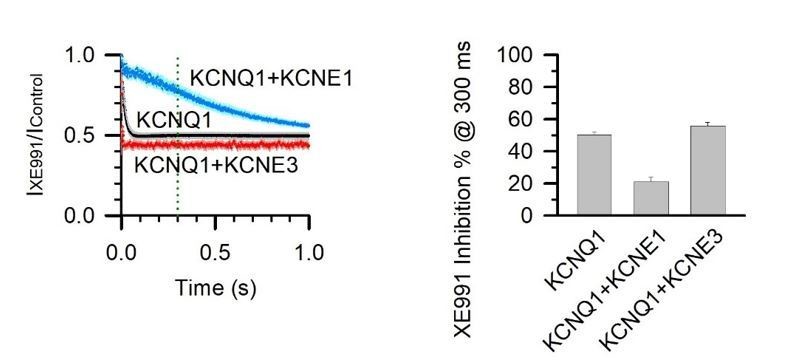
5 µM XE991 inhibition of KCNQ1, KCNQ1+KCNE1, and KCNQ1+KCNE3 channels at 300 ms activation duration.
% inhibition was calculated with 1 – (IXE991 / IControl) at 300 ms after the test pulse started.
Author response image 4
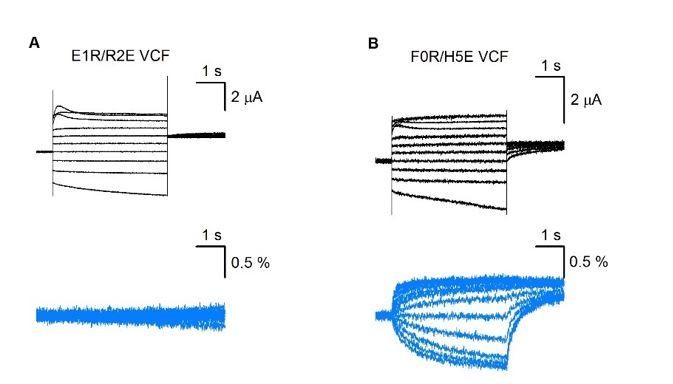
VCF results of E1R/R2E (A) and R0R/H5E (B).
Tables
Table 1
KCNQ1 VSD NMR structure statistics.
| Structure restraints | XPLOR-NIH* | PDB 6MIE† |
|---|---|---|
| Total NOE | 958 | 958 |
| Inter-residue: | ||
| Sequential ( | i - j | = 1 ) | 559 | 559 |
| Medium-range ( 1 < | i - j | < 5 ) | 366 | 366 |
| Long-range ( | i - j | ≥ 5 ) | 33 | 33 |
| Hydrogen bonds | 55 | 55 |
| Paramagnetic relaxation enhancement | 403 | 403 |
| Dihedral angle | ||
| ϕ | 97 | 97 |
| φ | 97 | 97 |
| Residual dipolar couplings (DHN) | 54 | 54 |
| Structure statistics | ||
| Ensemble r.m.s.d. (residues 120–152, 160–239) | ||
| Backbone heavy atoms (Å) | 1.41 | 0.96 |
| All heavy atoms (Å) | 2.33 | 1.72 |
| Transmembrane r.m.s.d. (residues 120–142, 160–179, 198–215, 219–239) | ||
| Backbone heavy atoms (Å) | 0.87 | 0.97 |
| r.m.s.d. from experimental restraints | ||
| Distances (Å) | 0.068 ± 0.005 | 0.150 ± 0.019 |
| Dihedral angles (°) | 1.0 ± 0.2 | 10.3 ± 4.2 |
| Residual dipolar coupling (Hz) | 0.92 ± 0.21 | 3.1 ± 0.6 |
| r.m.s.d. from idealized geometry | ||
| Bond lengths (Å) | 0.003 ± 0.001 | 0.005 ± 0.001 |
| Bond angles (°) | 0.44 ± 0.01 | 1.71 ± 0.01 |
| Ramachandran plot (residues 101–152, 160-239)‡ | ||
| Most favorable (%) | 89.3 ± 2.0 | 89.8 ± 2.8 |
| Additionally allowed (%) | 10.0 ± 2.2 | 8.8 ± 2.3 |
| Generously allowed (%) | 0.4 ± 0.8 | 0.7 ± 0.6 |
| Disallowed (%) | 0.3 ± 0.8 | 0.6 ± 0.7 |
-
*'XPLOR-NIH’ describes the statistics for the XPLOR-NIH structure ensemble generated using experimental restraints, prior to the rMD phase of the calculations.
†'MD’ describes the statistics for the structure ensemble (PDB ID: 6MIE) (see Materials and methods).
-
‡Procheck NMR.
Key resources table
| Reagent type (species) or resource | Designation | Source or reference | Identifiers | Additional information |
|---|---|---|---|---|
| Gene (human) | KCNQ1 | HUGO Gene Nomenclature Committee (HGNC) | Gene ID: 3784; HGNC:6294 | |
| Gene (human) | KCNE1 | HUGO Gene Nomenclature Committee (HGNC) | Gene ID: 3753; HGNC:6240 | |
| Gene (human) | KCNE3 | HUGO Gene Nomenclature Committee (HGNC) | Gene ID: 10008; HGNC:6243 | |
| Strain, strain background (Escherichia coli) | CT19 transaminase deficient strain | Dr. David Waugh, US National Cancer Institute PMID: 8914274 | Used for special isotopic labeling of the KCNQ1 VSD for use in NMR studies. | |
| Strain, strain background (Escherichia coli) | Rosetta/ C43(DE3) | Sigma-Aldrich | Catalog number 70954 | Used for uniform isotopic labeling of KCNQ1 and amino acid-specific labeling for NMR. |
| Recombinant DNA reagent | pET16b expression plasmid encoding tagged human KCNQ1- (100-249) | PMID: 24606221 | Used to express the human KCNQ1 VSD for NMR structural studies | |
| Biological sample (include species here) | Xenopus oocytes (Xenopus laevis, female) | This paper | RRID:XEP_Xla | Xenopus laevis purchased from Nasco, Fort Atkinson, WI |
| Recombinant DNA reagent | pcDNA3.1 encoding human KCNQ1 or KCNE1 | This paper | RRID:Addgene_111452 | For site-directed mutagenesis |
| Commercial assay or kit | mMessage T7 polymerase kit | Applied Biosystems-Thermo Fisher Scientific | AM1344 | |
| Chemical compound, drug | XE991 | Millipore Sigma | CAS #: 122955-42-4 | |
| Chemical compound, drug | Chromanol 293B | Millipore Sigma | CAS #: 163163-23-3 | |
| Chemical compound, drug | Alexa Fluor488 C5 maleimide | Molecular Probes, Eugene, OR | Catalog #: A10254 | |
| Software | Topspin 3.2 | Bruker (Scientific Instruments Company) | RRID:SCR_014227 | NMR data collection and processing. |
| Software | MDD and qMDD interface | URL: mddnmr.spektrino.com/ PMID: 21161328 | NMR data processing | |
| Software | NMRFAM-SPARKY | PMID: 25505092 URL: https://nmrfam.wisc.edu/nmrfam-sparky-distribution/ | NMR data analysis and resonance assignments. | |
| Software | TALOS-N | PMID:25502373 URL: spin.niddk.nih.gov/bax/software/TALOS-N/ | Determination of secondary structure from NMR chemical shift data. | |
| Software | CHARMM-GUI | PMID: 25130509 URL: www.charmm-gui.org/ | Preparation of starting structures of the KCNQ1 VSD in lipid bilayers for MD restrained MD simulations. | |
| Software | XPLOR-NIH | PMID: 28766807 URL: https://nmr.cit.nih.gov/xplor-nih/ | Structure calculations using NMR data restraints | |
| Software | GPU-accelerated AMBER 16 | URL: https://ambermd.org/ PMID: 16200636 | Program for execution of MD simulations. | |
| Software | Lipid 17 AMBER | PMID: 24803855 URL: https://ambermd.org/AmberModels.php | Force field used for MD simulations. | |
| Software | CPPTRAJ | PMID: 26583988 URL:https://amber-md.github.io/ | Analysis of MD trajectoriesfollowing simulations. | |
| Software | PatchMaster | HEKA | RRID:SCR_000034 | Electrophysiology data collection |
| Software | IGOR | Wavemetrics, Lake Oswego, OR | RRID:SCR_000325 | Electrophysiology data analysis |
| Software | Clampfit | Axon Instruments, Sunnyvale, CA | RRID:SCR_011323 | Electrophysiology data analysis |
| Software | Sigmaplot | SPSS, San Jose, CA | RRID:SCR_003210 | Electrophysiology data analysis and visualization |
| Software | MATLAB | MathWorks, MA | RRID:SCR_001622 | Electrophysiology data analysis |
| Sequence-based reagent | For site-directed mutagenesis | This paper | PCR primers | PCR primers seq for mutations made in this study (each mutation utilizedtwo primers: b and c). E170R-b:cacgtacCTGgtcccgaagaacaccac; E170R-c: cgggacCAGgtacgtggtccgcctc; R237E-b: gcatcTCcaggatctgcaggaag; R237E-c:cagatcctgGAgatgctacacgtcgac F167R-b: ccgtcccgCGgaacaccaccagcac; F167R-c: gtgttcCGcgggacggagtacg Q234E-b:ggatctCcaggaagcggatgccc; Q234E-c: catccgcttcctgGagatcctgaggatgcta H240E-b: cggtcgacCTCtagcatcctcaggatc H240E-c: gctaGAGgtcgaccgccaggg D202N-b: cgatgaggtTAatgatggaaatgggcttc D202N-c: ccatcatTAacctcatcgtggtcgtg F351A-b: ggcaGCGcccgagccaagaatcc F351A-c: gctcgggCGCtgccctgaaggtgcag C214A-b: cttggaTcccacCGCgaggaccacca C214A-c: cGCGgtgggAtccaaggggcaggtg G219C-b: cctgaCacttggaTcccacCGC G219C-c: ggAtccaagtGtcaggtgtttgccacg C331A-b: gacagagaaTGCggaggcgatggtcttc C331A-c: ctccGCAttctctgtctttgccatc |
Additional files
Download links
A two-part list of links to download the article, or parts of the article, in various formats.
Downloads (link to download the article as PDF)
Open citations (links to open the citations from this article in various online reference manager services)
Cite this article (links to download the citations from this article in formats compatible with various reference manager tools)
Structure and physiological function of the human KCNQ1 channel voltage sensor intermediate state
eLife 9:e53901.
https://doi.org/10.7554/eLife.53901


