Zygotic pioneer factor activity of Odd-paired/Zic is necessary for late function of the Drosophila segmentation network
- Department of Molecular Biosciences, Northwestern University, United States
- Program in Interdisciplinary Biological Sciences, Northwestern University, United States
- Department of Neurobiology, Northwestern University, United States
Figures
Figure 1 with 1 supplement
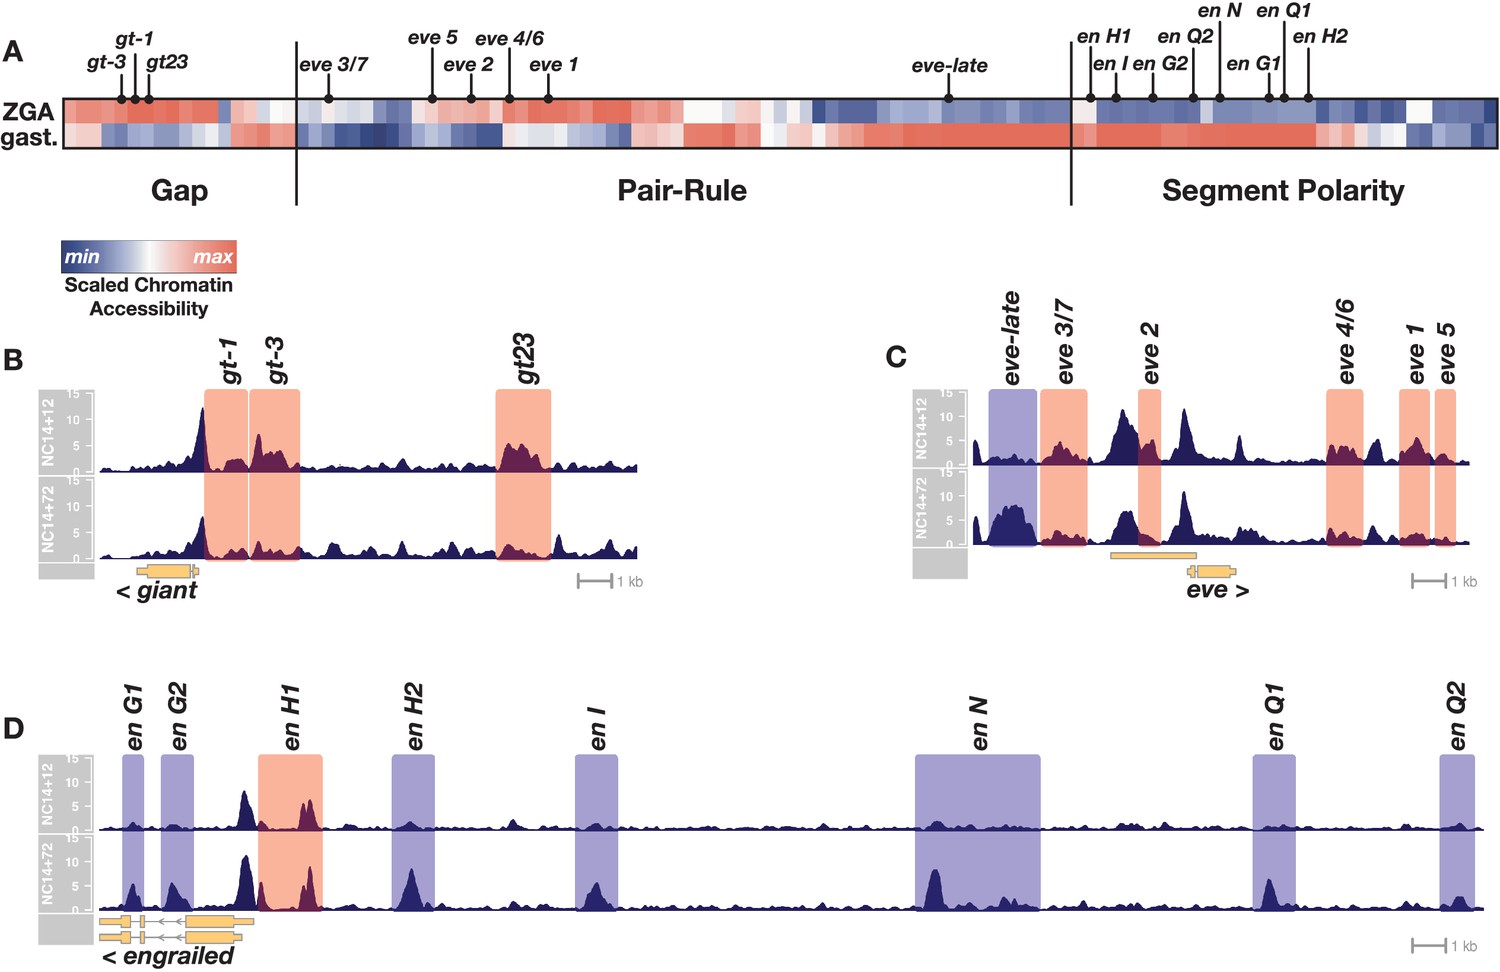
Chromatin accessibility at segmentation network enhancers is dynamic over the 1-hr period between ZGA and gastrulation.
(A) Heatmap showing the scaled chromatin accessibility between ZGA (top row, NC14 + 12’) and gastrulation (bottom row, NC14 + 72’) over the complete set of known enhancers within the gap, pair-rule, and segment polarity gene regulatory networks. Tiers of the segmentation network are indicated as well as selected enhancers from the specific examples depicted in panels B-D. (B–D) chromatin accessibility at a representative gap (giant), pair-rule (eve), and segment polarity (engrailed) locus between ZGA (NC14+12, top) and gastrulation (NC14+72, bottom). Enhancers that are significantly more open by ZGA are highlighted in red, those that open late, by the onset of gastrulation are highlighted in blue. Loci are drawn to the same genomic (x-axis) scale, and ATAC accessibility is shown at the same y-axis scale (0–15 CPM) across all plots. See also Figure 1—figure supplement 1.
Figure 1—figure supplement 1
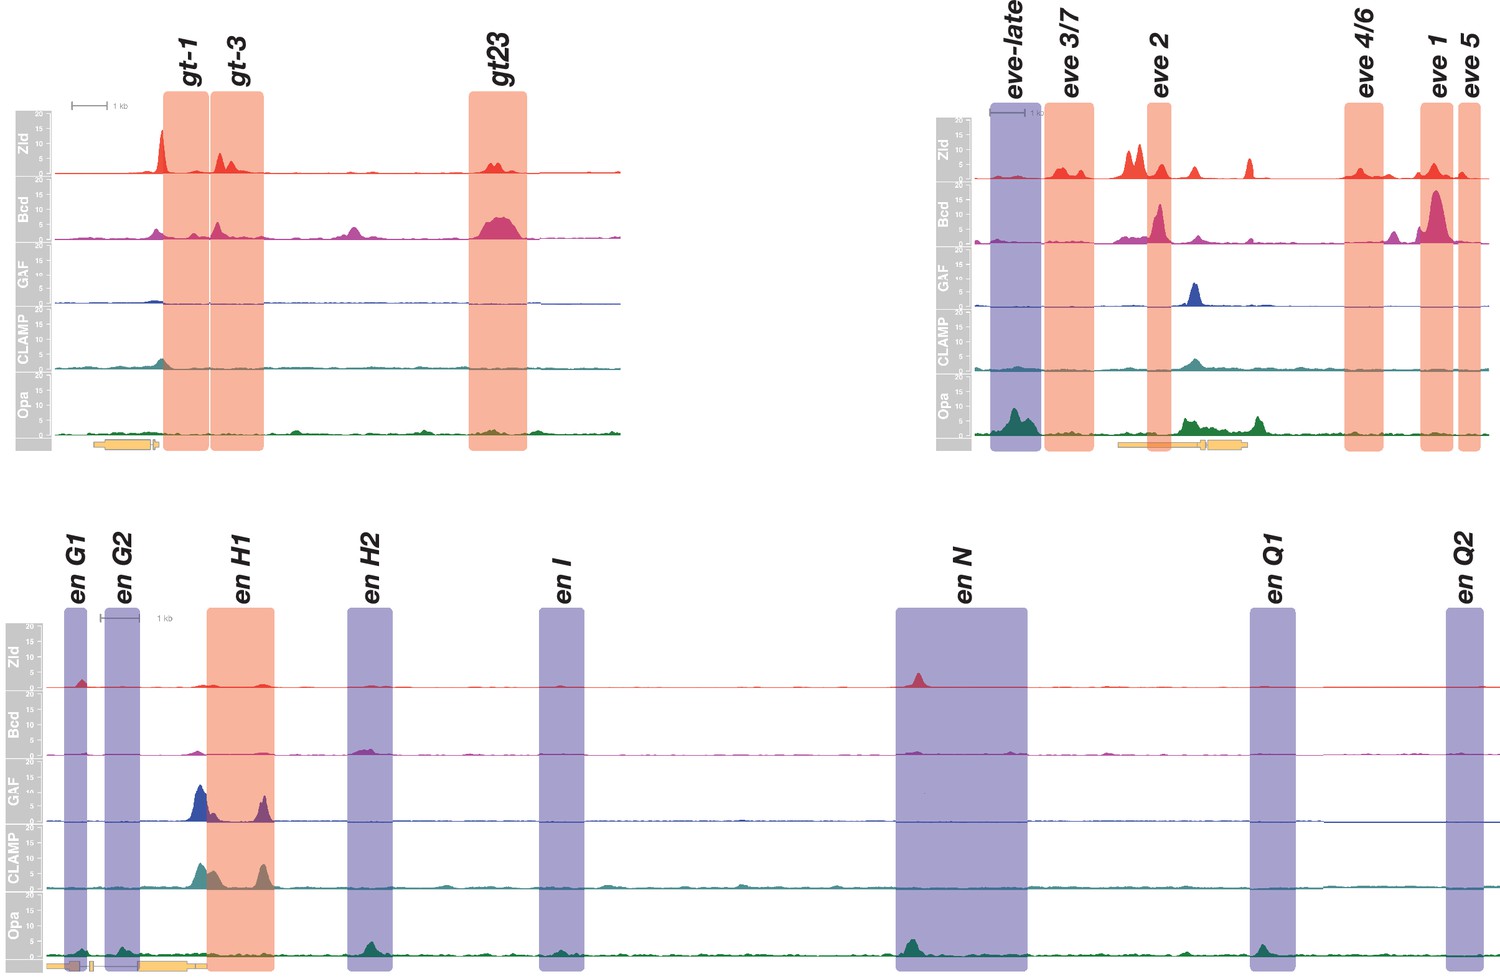
Binding of known early pioneers and Opa to genomic regions of three representative segmentation network factors.
Shown for giant, eve, and engrailed are normalized ChIP-seq coverage plots for Zelda (red, Harrison et al., 2011), 3 hr timepoint), Bicoid (magenta, Hannon et al., 2017), GAGA-Factor (blue, Blythe, unpublished), CLAMP (slate blue, Rieder et al., 2017), and Opa (green, this work). Maternally supplied pioneers interact with early-accessible cis-regulatory modules (red bars). Less frequent interaction is seen between maternal pioneers and late-accessible cis-regulatory modules (blue bars). Opa, as described later in the text, binds to a distinct subset of late-active cis-regulatory modules including the eve-late element, as well as en G1, G2, H2, N, and Q1. Genomic ranges (x-axes) are drawn to scale. ChIP coverage of CPM-normalized counts were scaled to the maximum genome-wide value and multiplied by 20 for generating this plot.
Figure 2
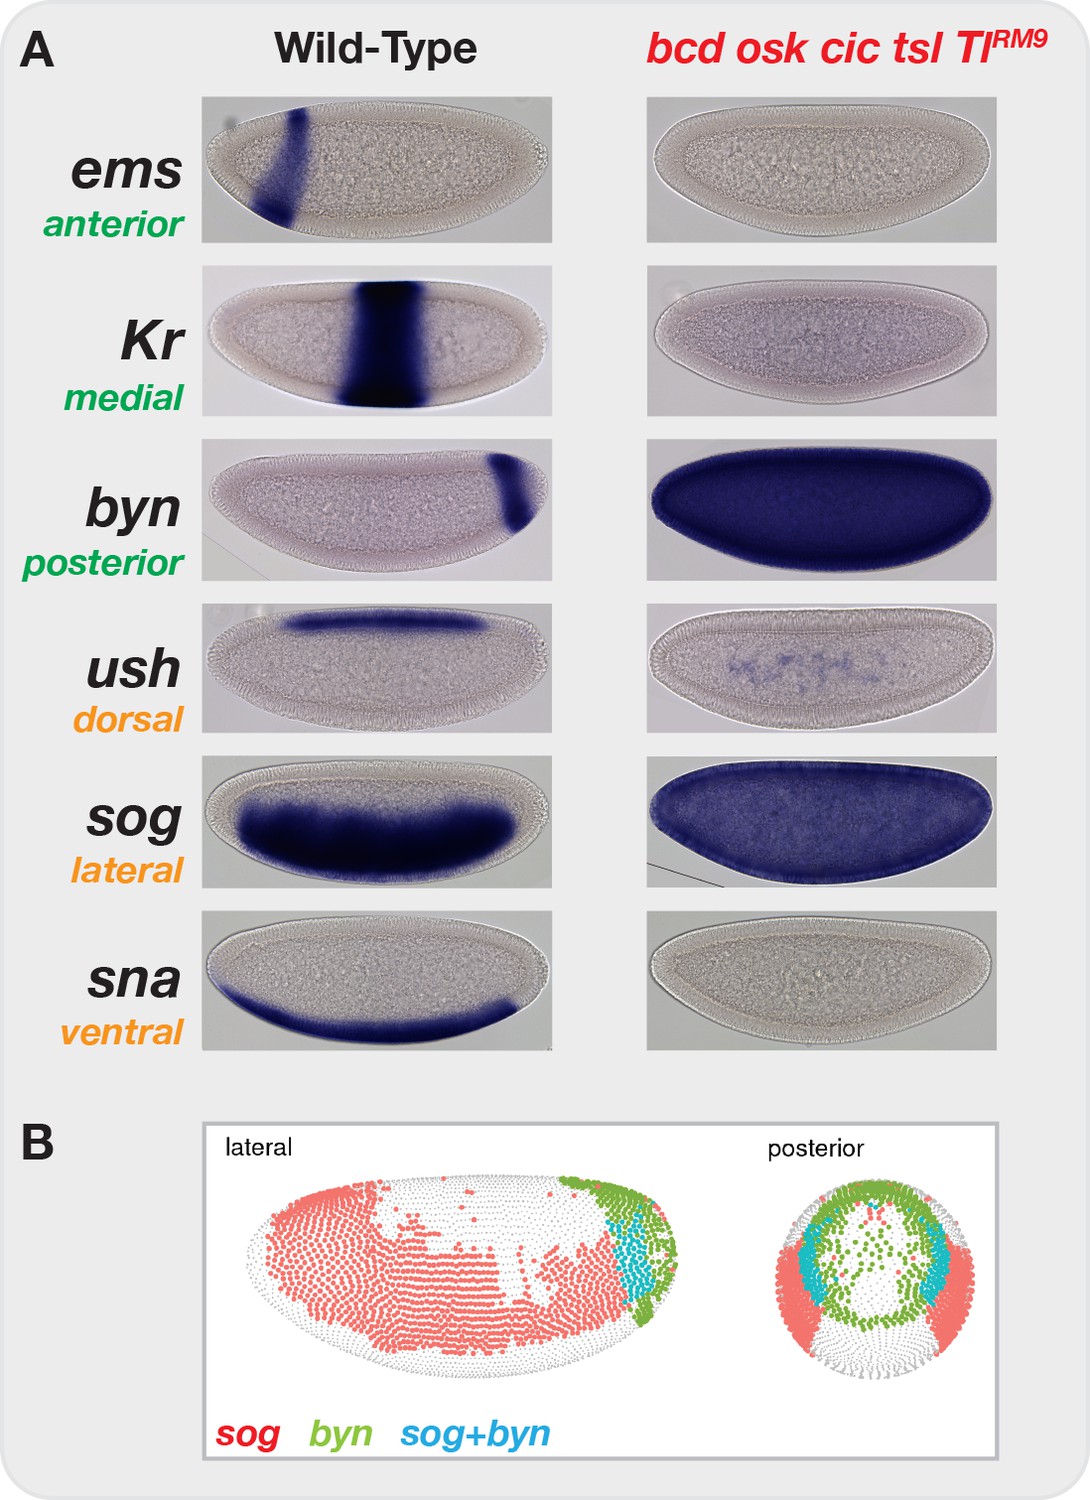
Elimination of graded maternal cues drives development along single uniform lineages.
(A) In situ hybridization for markers of anterior-posterior (ems, Kr, byn) and dorsal-ventral (ush, sog, sna) marker genes in both wild-type and bcd osk cic tsl TlRM9 mutant embryos. Elimination of graded positional information converts all cells in the blastoderm embryo to posterior-lateral cell types (sog+ byn+). (B) Image from the DVEX virtual expression explorer shows the subset of cells co-expressing both sog and byn. Note, for presentation, certain images were rotated from their original positions and missing background pixels were filled in. No pixels corresponding to the embryo were altered.
Figure 3 with 4 supplements
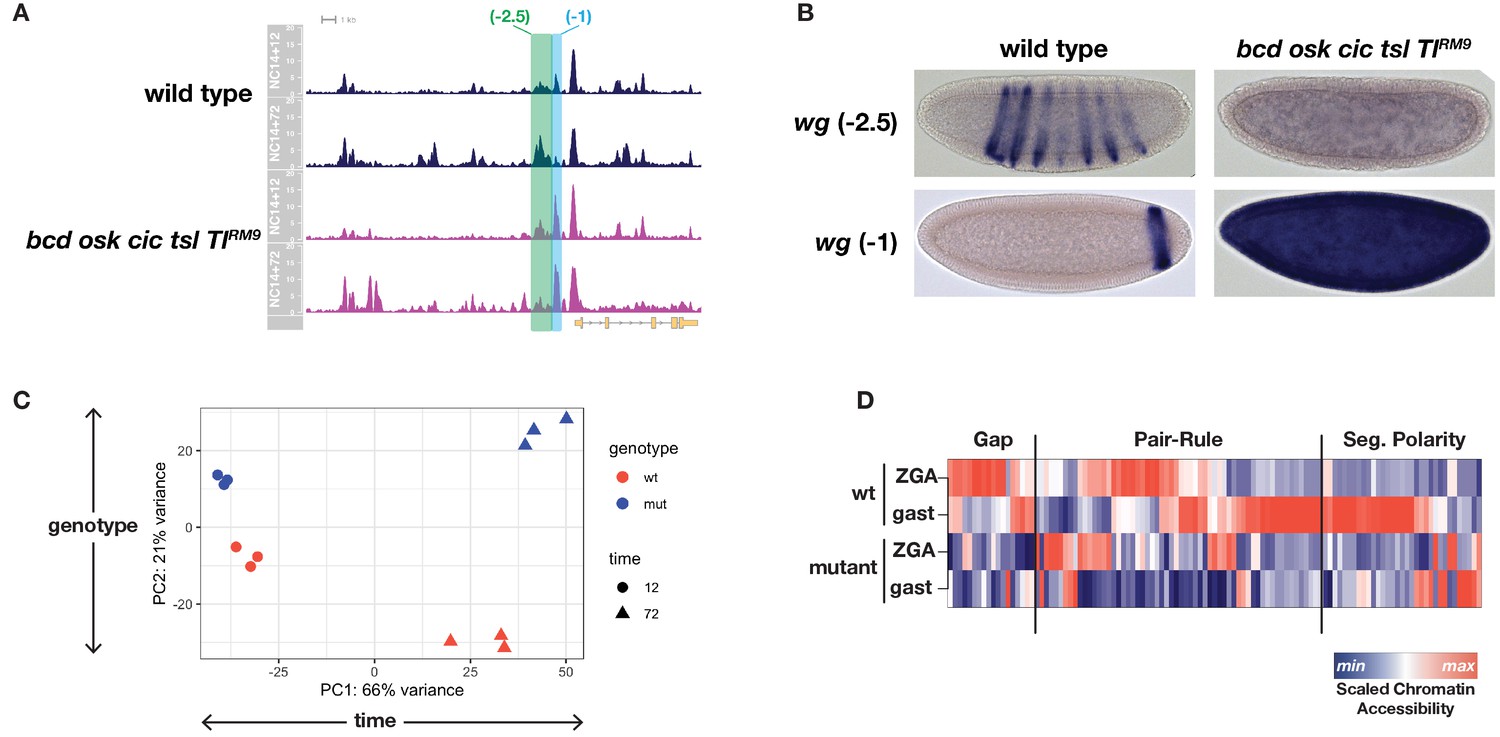
ATAC-seq on wild-type and uniform-lineage embryos resolves time and patterning-dependent changes in chromatin accessibility.
(A) ATAC-seq coverage over the extended wingless locus. Highlighted regions show closely apposed CRMs with differential responses to patterning inputs. The scale for the y-axis is 0–20 CPM for all plots. (B) Reporters for the CRMs highlighted in panel A demonstrate separable regulatory inputs into the wg locus, and differential regulation in uniform-lineage embryos. (C) Principal component analysis of dynamically accessible regions demonstrates the relative contribution of uniform (time) and patterning (genotype) drivers of chromatin accessibility. (D) Heatmap showing the scaled chromatin accessibility between ZGA and gastrulation for wild-type and mutant embryos over the complete set of known enhancers within the gap, pair-rule, and segment polarity gene regulatory networks. Colorbar indicates the scaled degree of chromatin accessibility plotted in each column. See also Figure 3—figure supplements 1–4.
Figure 3—figure supplement 1
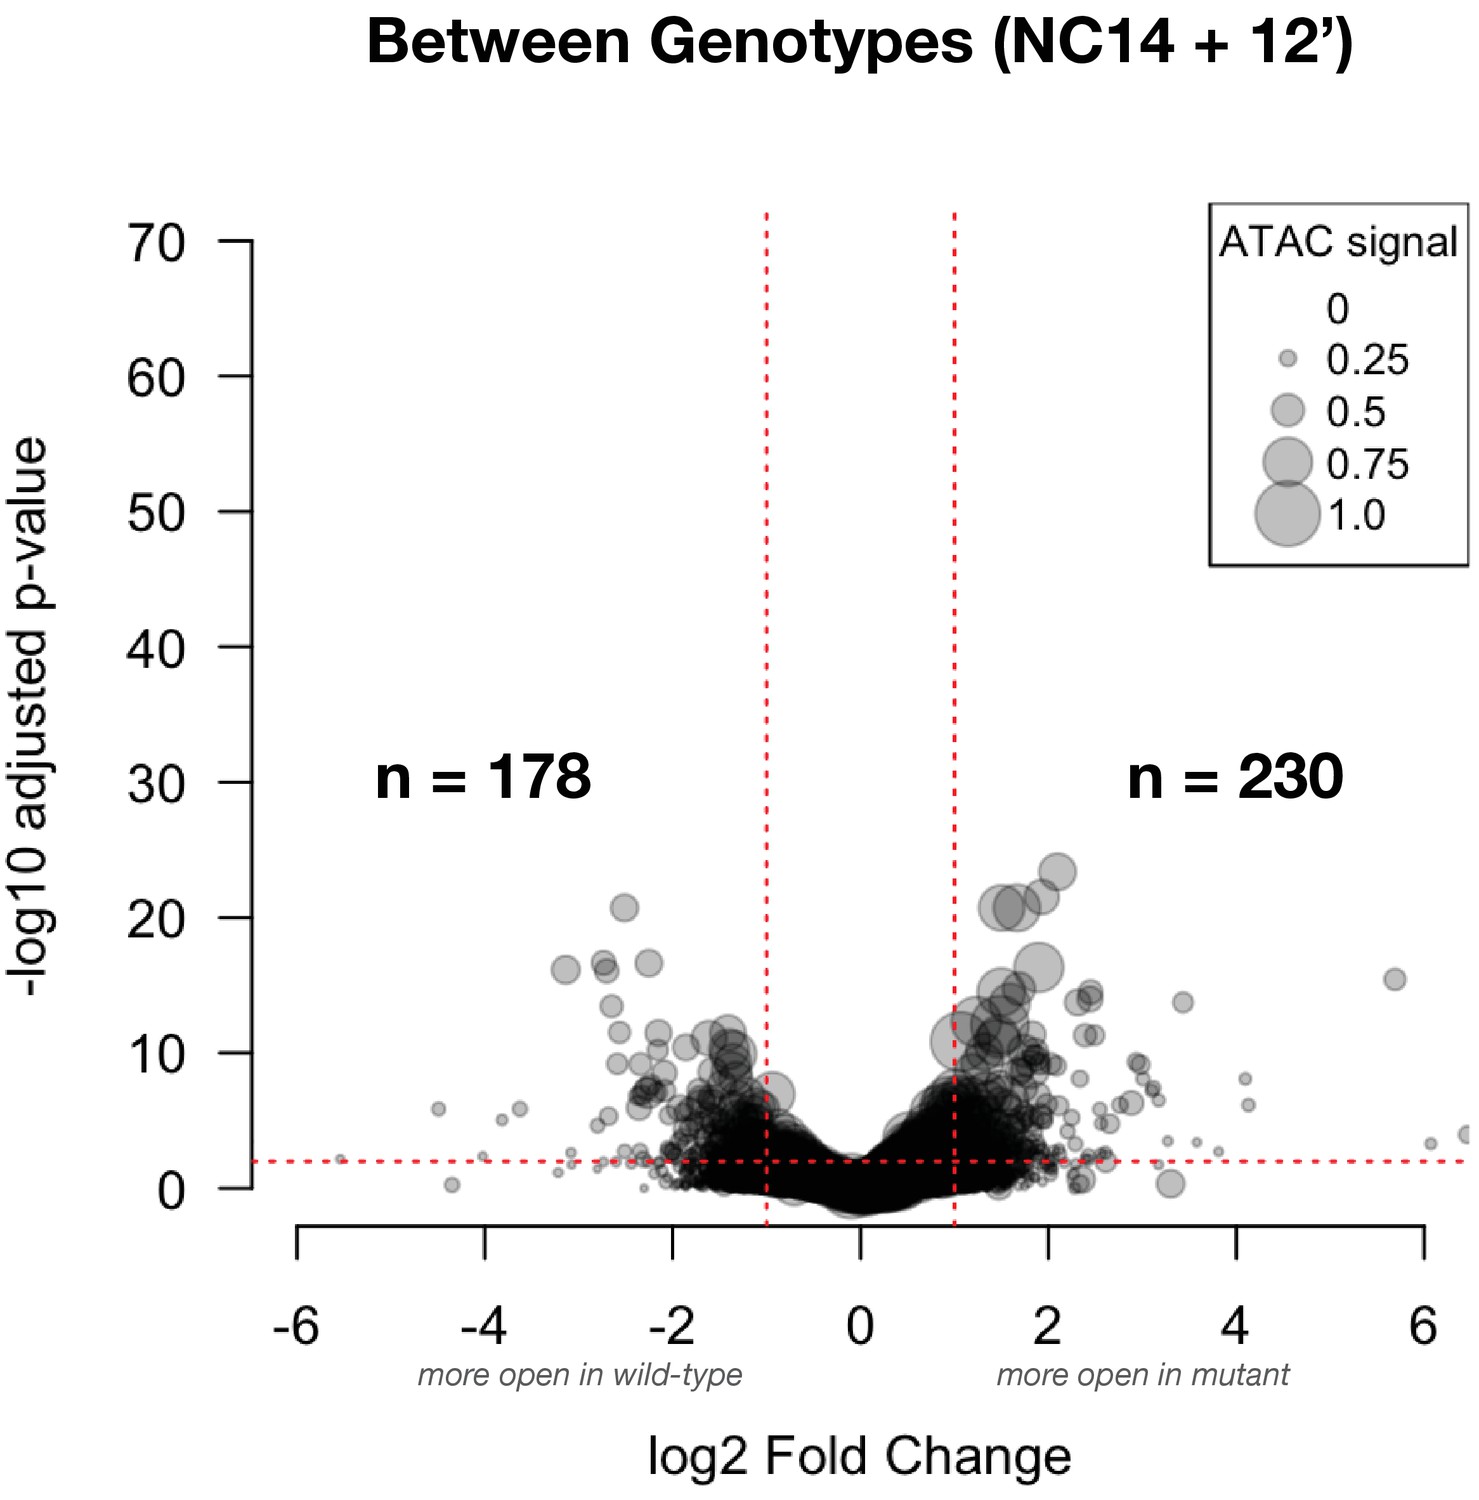
Differential accessibility between wild-type and mutant samples at NC14+12’: This volcano plot shows the effect size for comparisons between genotypes at ZGA (NC14+12’).
The number of peak regions above significance (0.01) and log2 fold-enrichment (1) thresholds is indicated in bold. Point sizes are scaled to the distribution of mean ATAC signal for the represented peak (large dots = larger ATAC signal).
Figure 3—figure supplement 2
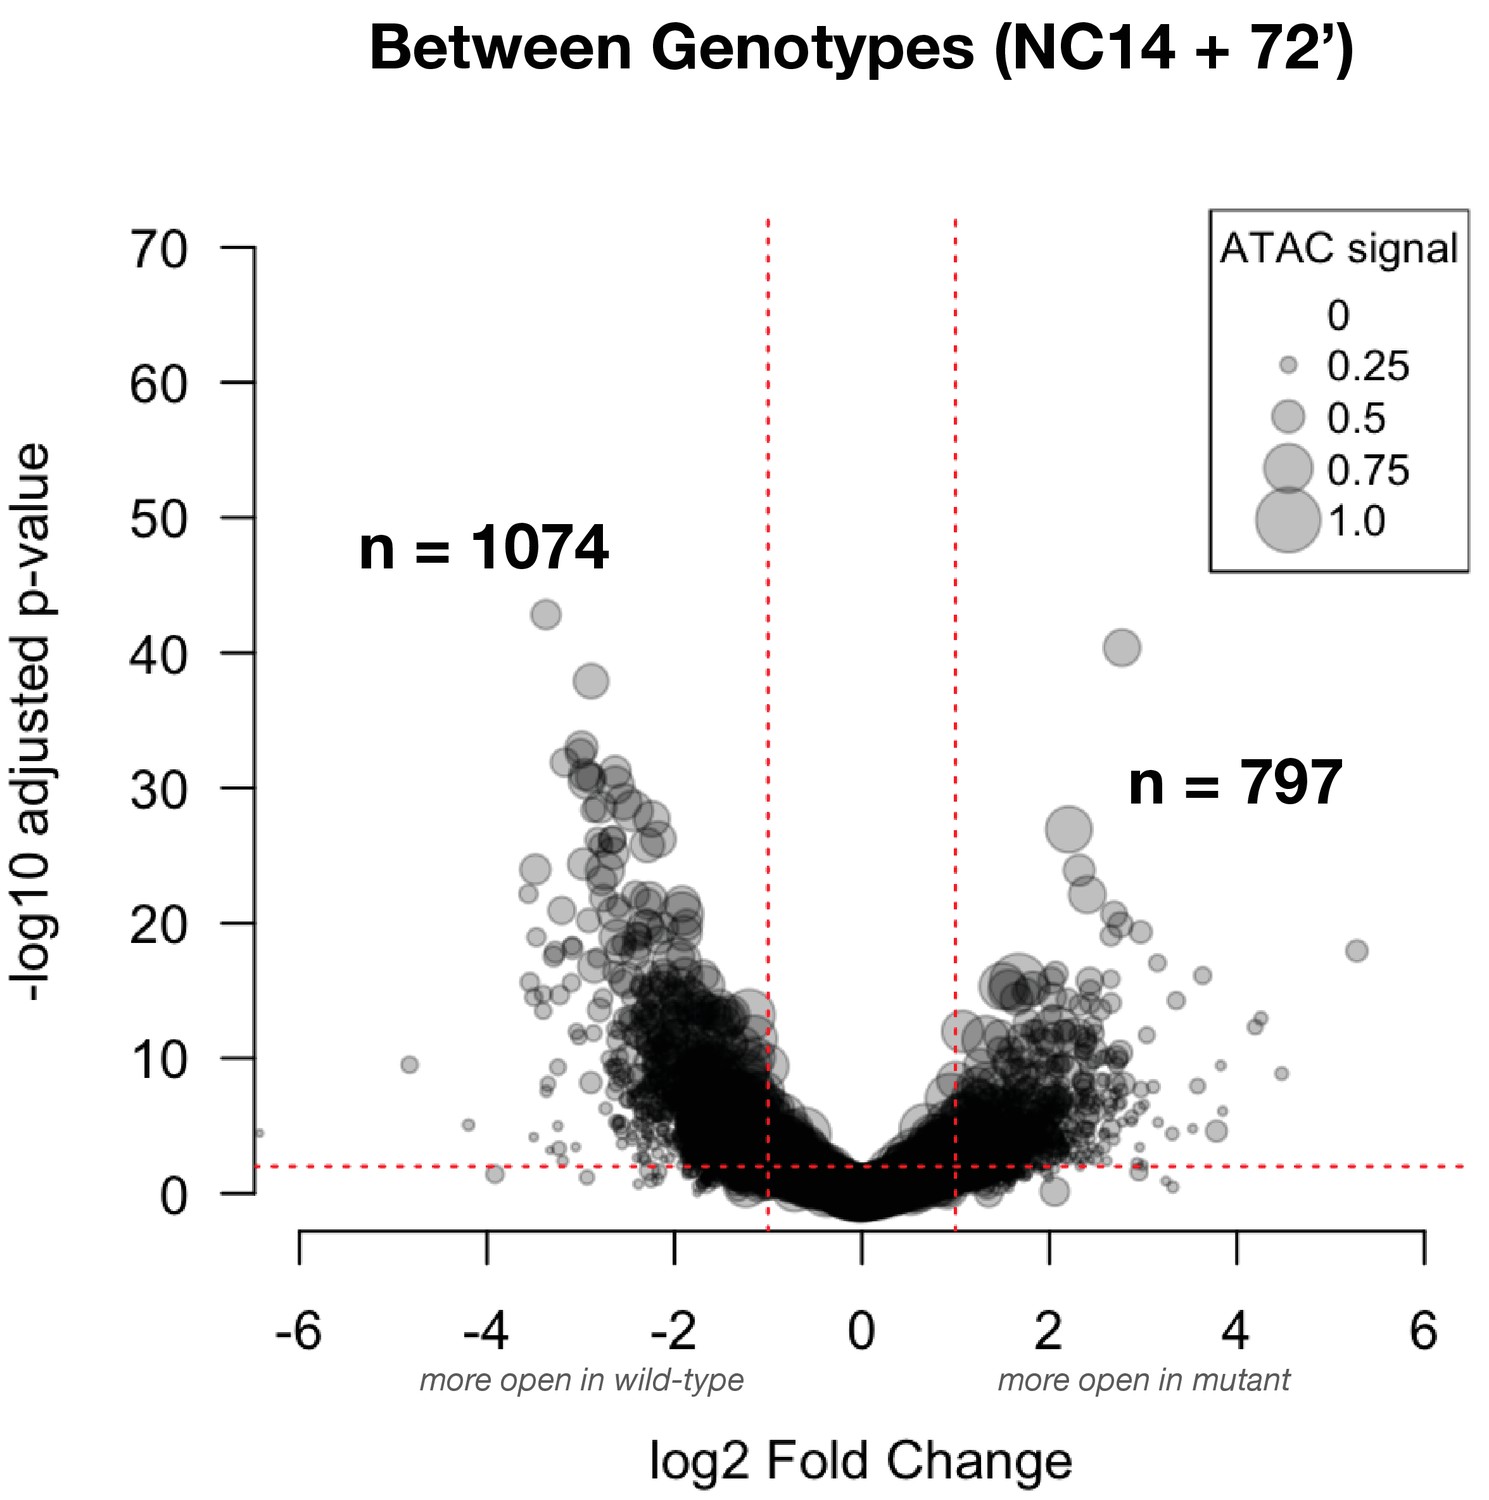
Differential accessibility between wild-type and mutant samples at NC14+72’: This volcano plot shows the effect size for comparisons between genotypes at gastrulation (NC14+72’).
The number of peak regions above significance (0.01) and log2 fold-enrichment (1) thresholds is indicated in bold. Point sizes are scaled to the distribution of mean ATAC signal for the represented peak (large dots = larger ATAC signal).
Figure 3—figure supplement 3
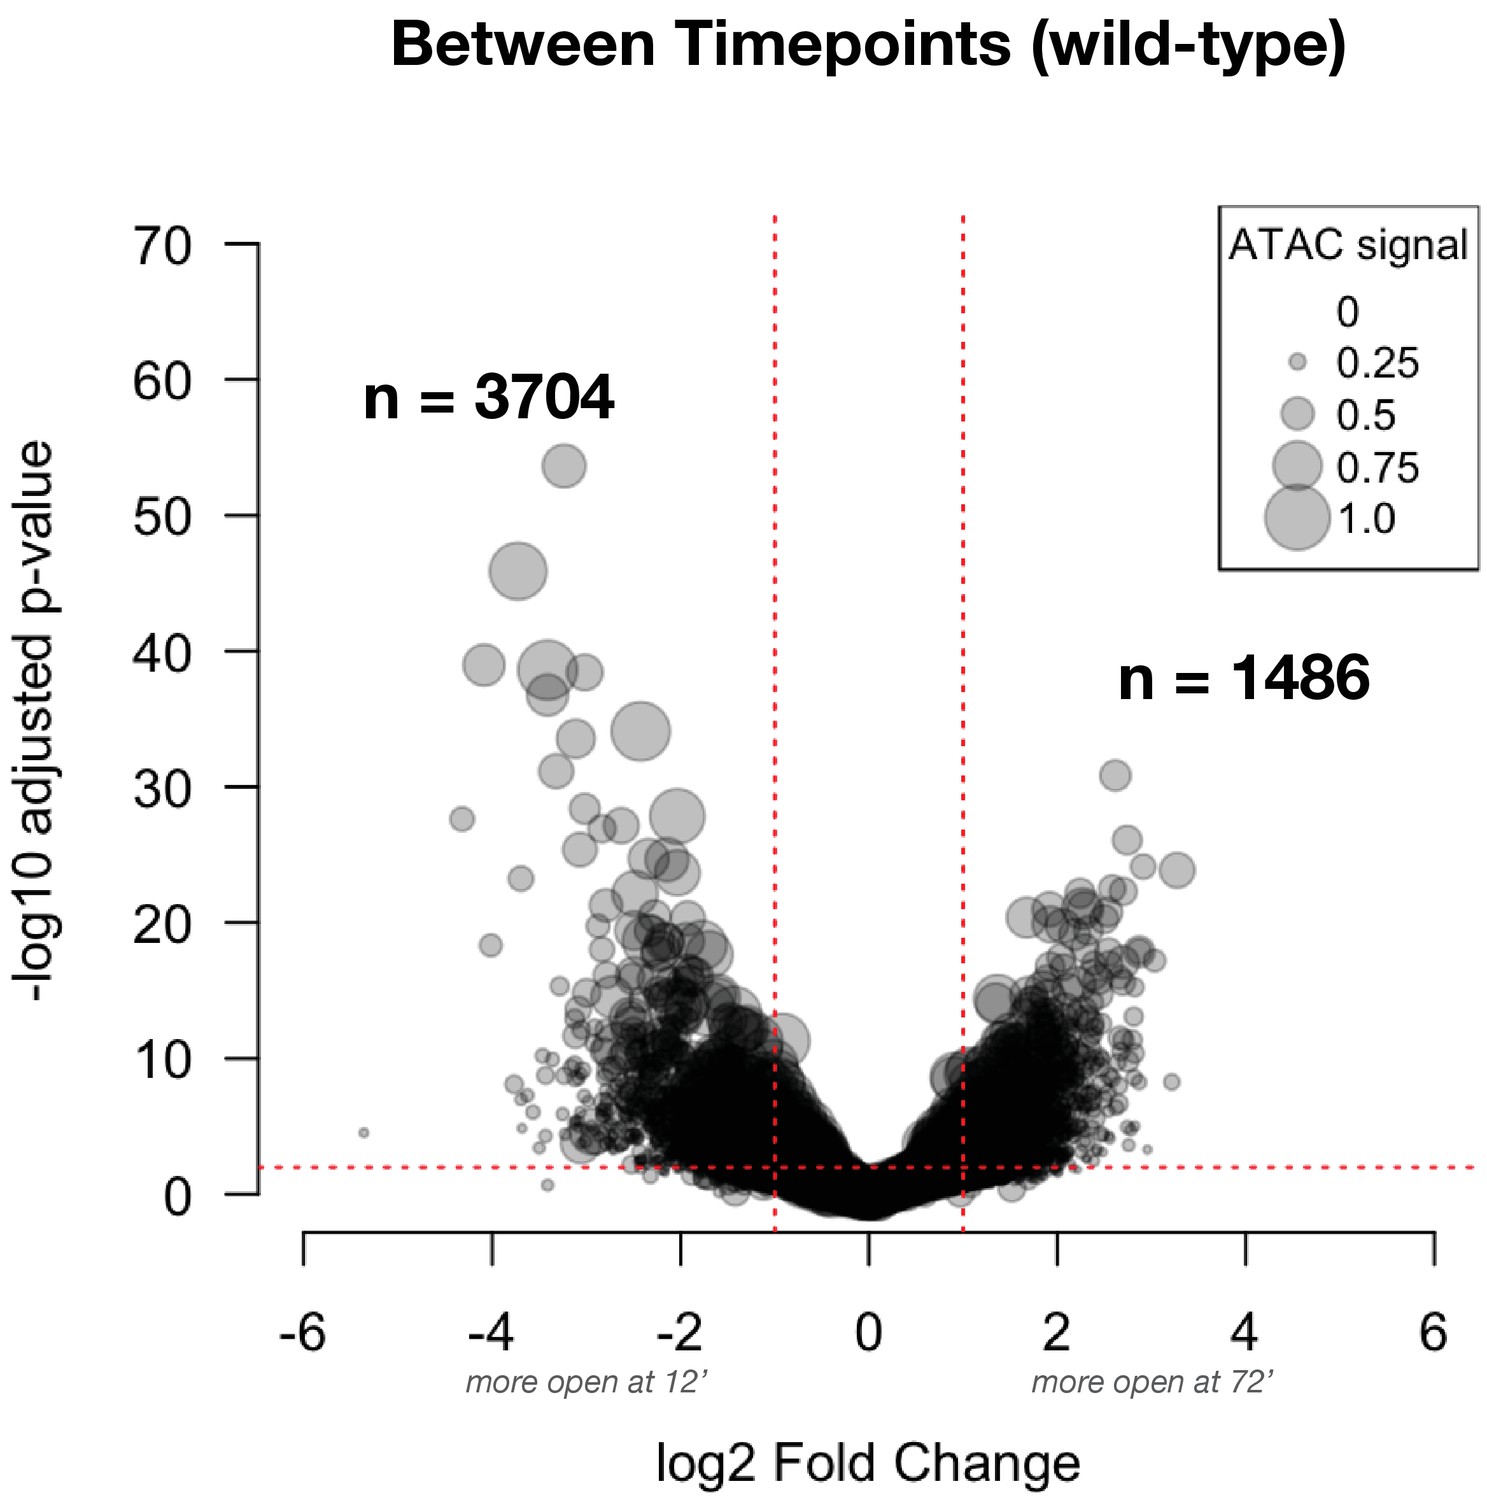
Differential accessibility between ZGA and gastrulation in wild-type embryos: This volcano plot shows the effect size for comparisons between timepoints (NC14 + 12’ and + 72’) in wild-type embryos.
The number of peak regions above significance (0.01) and log2 fold-enrichment (1) thresholds is indicated in bold. Point sizes are scaled to the distribution of mean ATAC signal for the represented peak (large dots = larger ATAC signal).
Figure 3—figure supplement 4
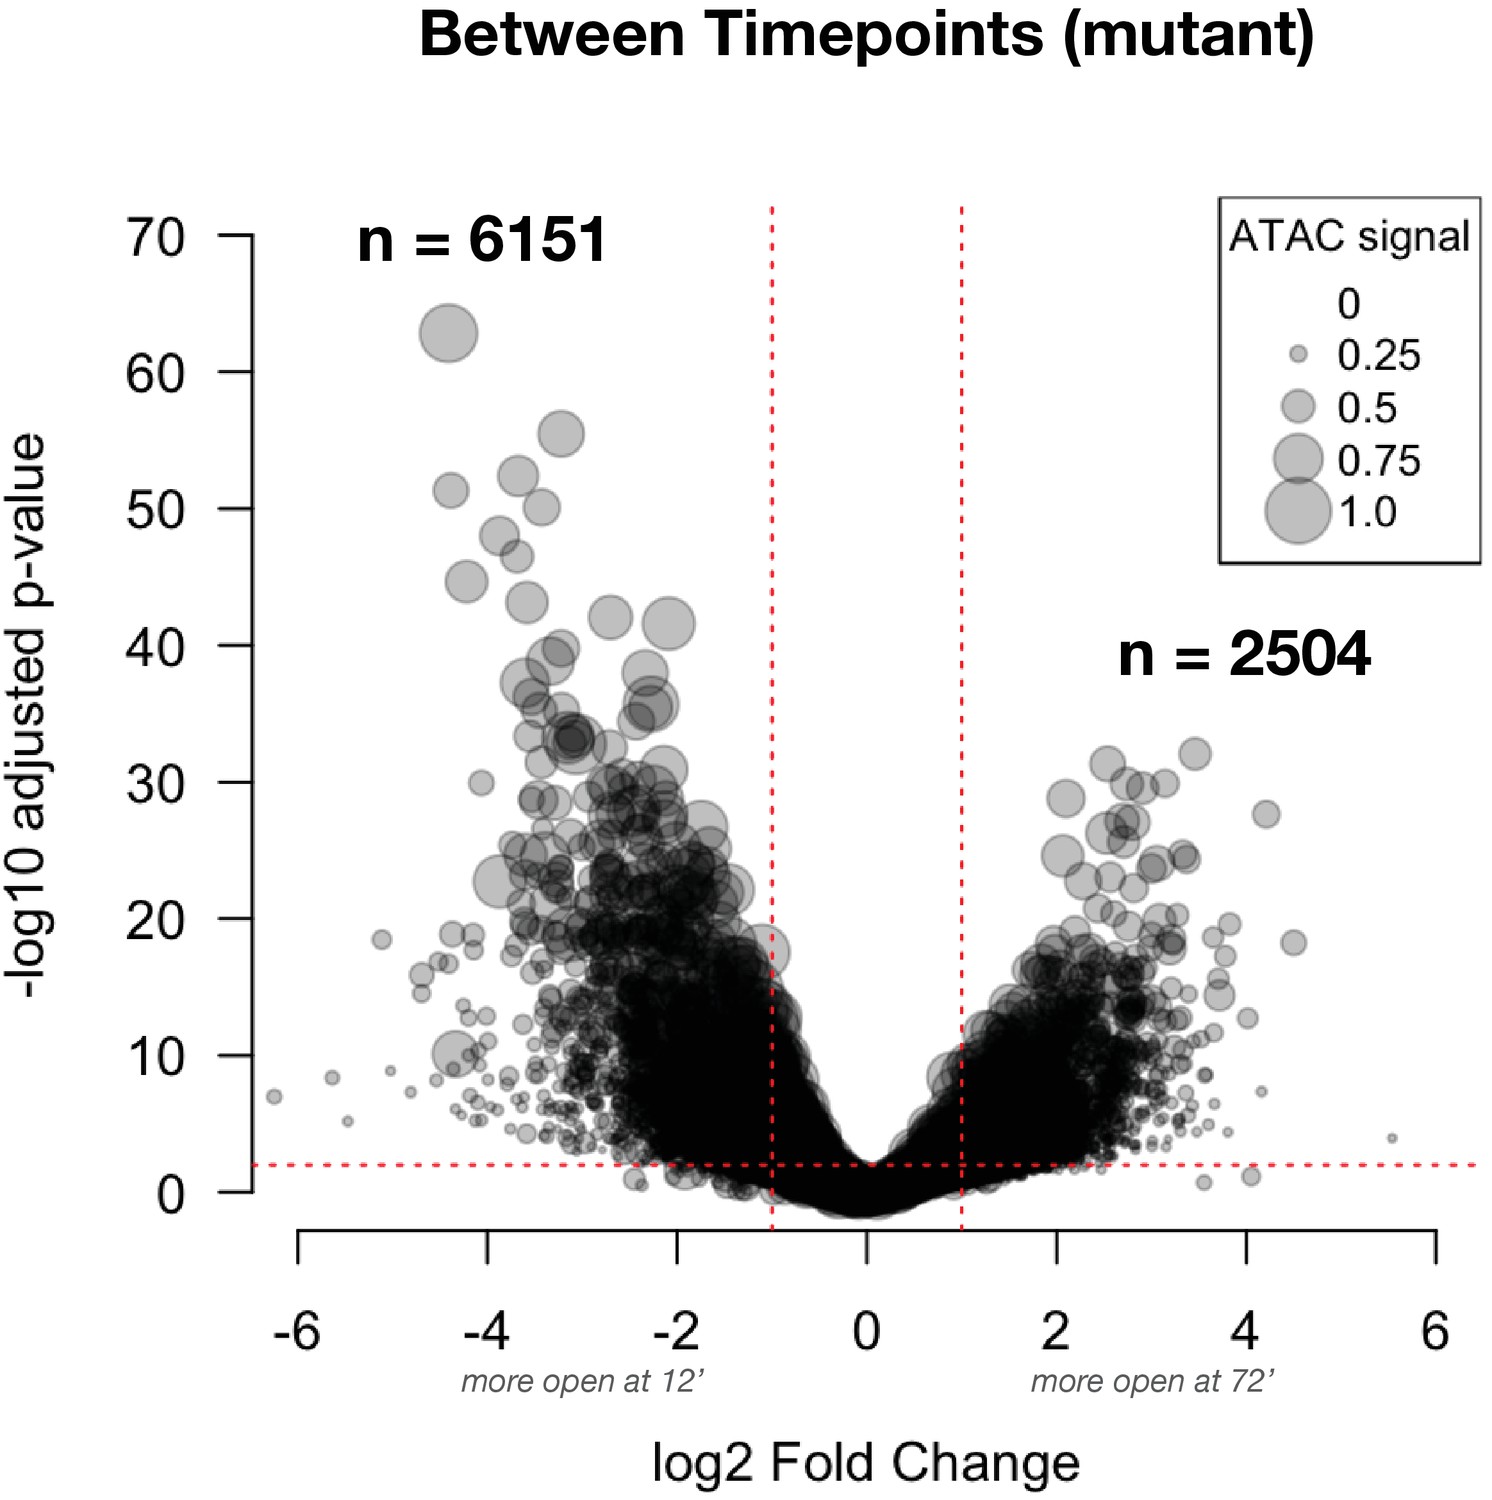
Differential accessibility between ZGA and gastrulation in mutant embryos: This volcano plot shows the effect size for comparisons between timepoints (NC14 + 12’ and + 72’) in mutant embryos.
The number of peak regions above significance (0.01) and log2 fold-enrichment (1) thresholds is indicated in bold. Point sizes are scaled to the distribution of mean ATAC signal for the represented peak (large dots = larger ATAC signal).
Figure 4 with 11 supplements
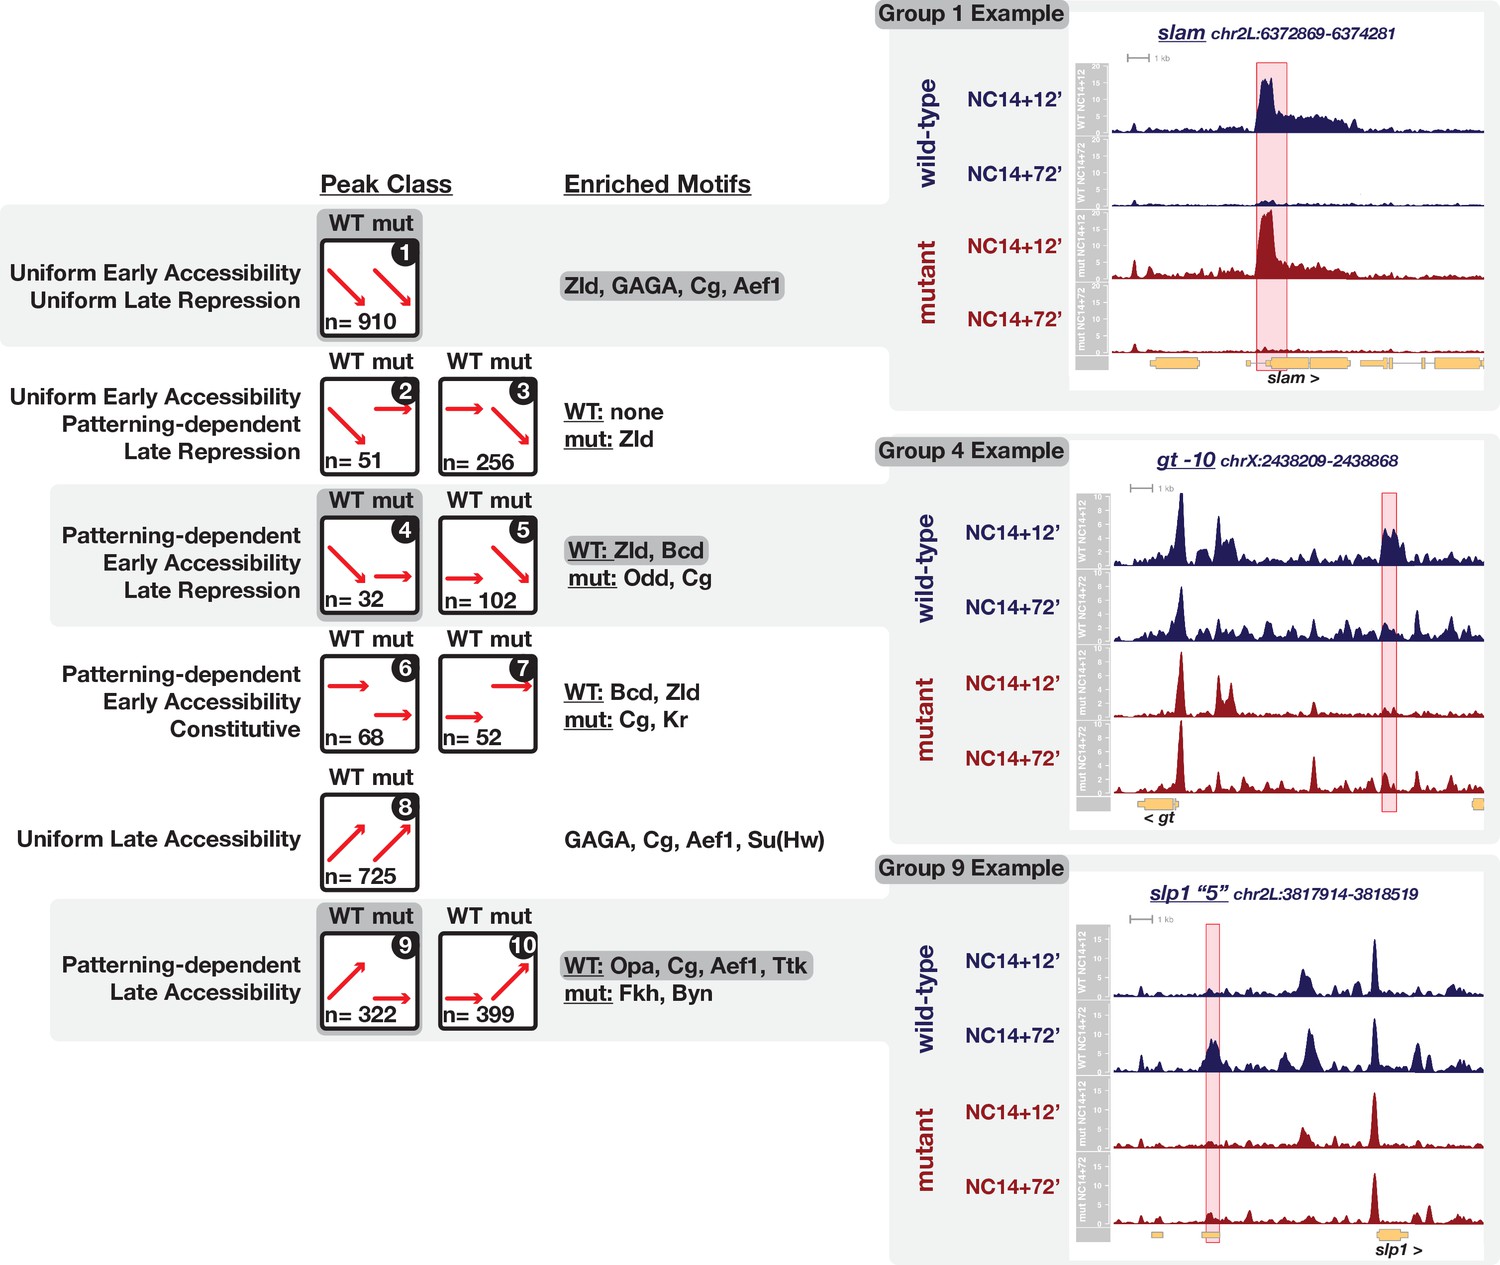
Ten classes of peaks with dynamic chromatin accessibility between ZGA and gastrulation.
Ten peak classes are symbolized by cartoons in the left column. Each grouping of peaks has been numbered for reference in the text. Supplements to this figure (Figure 4—figure supplements 1–10) detail the features of each grouping. In the cartoons, red arrows signify the general behavior of peaks within a class between ZGA and gastrulation for wild-type and uniform-lineage mutant embryos. The number of regions per class is indicated in each cartoon. The center column lists enriched motifs as determined by MEME analysis against a set of 1 × 10⁴ non-dynamic control regions. Examples of three highlighted groups are shown on right. The cartoon and enriched motifs associated with the example groups are additionally highlighted with dark grey boxes. The right column shows example ATAC-seq coverage plots for the three highlighted groups (1, 4 and 9, see Figure Supplements for examples of all groups). The specific peak region within the class is highlighted in red, and we note that additional non-highlighted dynamic regions may be present. See also Figure 4—figure supplements 1–11.
Figure 4—figure supplement 1

Uniform early accessibility with uniform late repression.
(A) Scaled ATAC-seq signal within this class is plotted for each classified region. Average signal between genotypes is shown in red. (B) Example of accessible ATAC coverage from a region within this class. Shown here is the slam promoter region. The scale for the y-axis is 0–20 CPM for all plots. (C) Motifs enriched within this class as reported by MEME. (D) Enrichment of controlled vocabulary terms from the Vienna Tiles collection of functionally validated enhancers. Terms enriched within this class of ATAC peak (p≤0.01, Fisher’s Exact Test) are listed at left, and an example expression pattern for a Vienna Tile reporter present in the ATAC class and associated with the enriched term is shown at right. Images are from https://enhancers.starklab.org (Kvon et al., 2014).
Figure 4—figure supplement 2
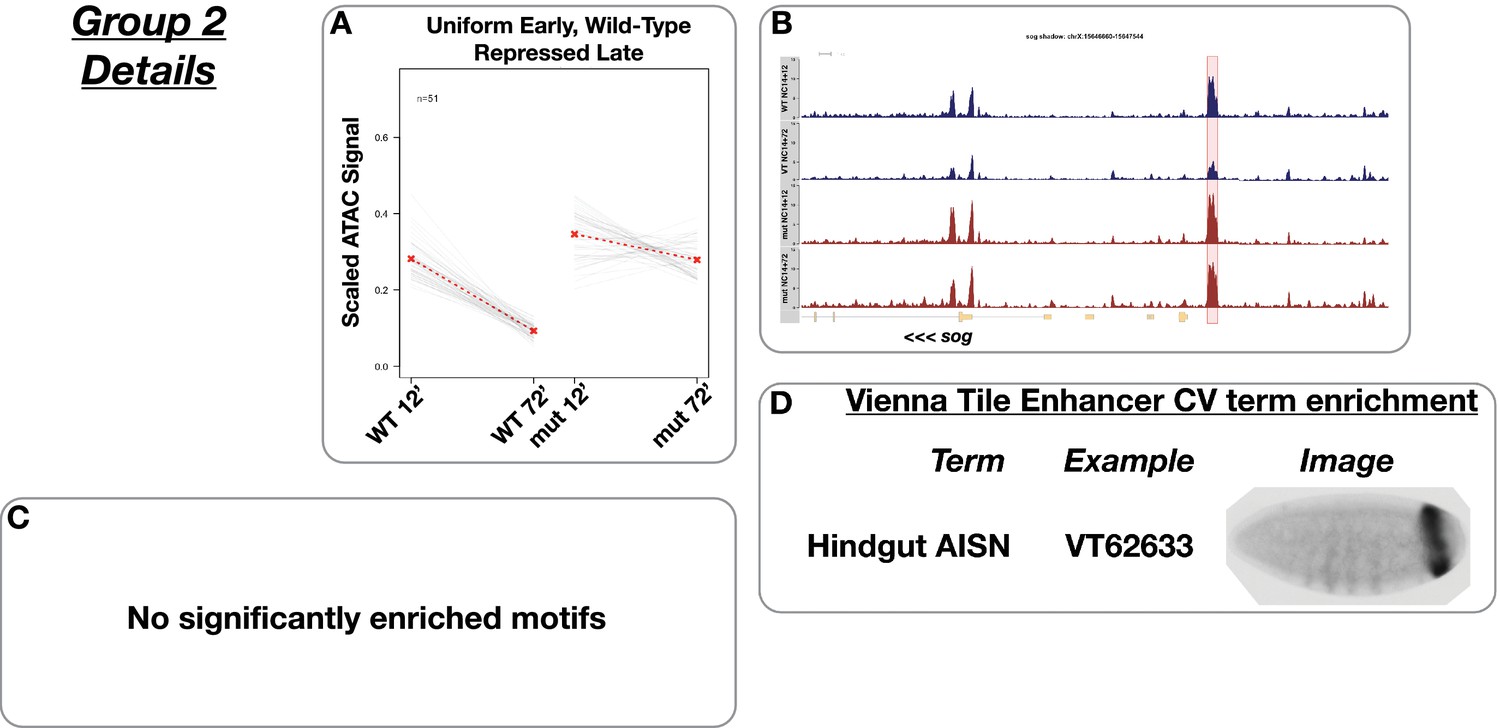
Uniform early accessibility with late wild-type repression.
(A) Scaled ATAC-seq signal within this class is plotted for each classified region. Average signal between genotypes is shown in red. (B) Example of a region within this class. Shown here is the short gastrulation shadow enhancer region. The scale for the y-axis is 0–15 CPM for all plots. (C) Motifs enriched within this class as reported by MEME. There are no reported enriched motifs within this class. (D) Enrichment of controlled vocabulary terms from the Vienna Tiles collection of functionally validated enhancers. Terms enriched within this class of ATAC peak (p≤0.01, Fisher’s Exact Test) are listed at left, and an example expression pattern for a Vienna Tile reporter present in the ATAC class and associated with the enriched term is shown at right. Images are from https://enhancers.starklab.org (Kvon et al., 2014).
Figure 4—figure supplement 3
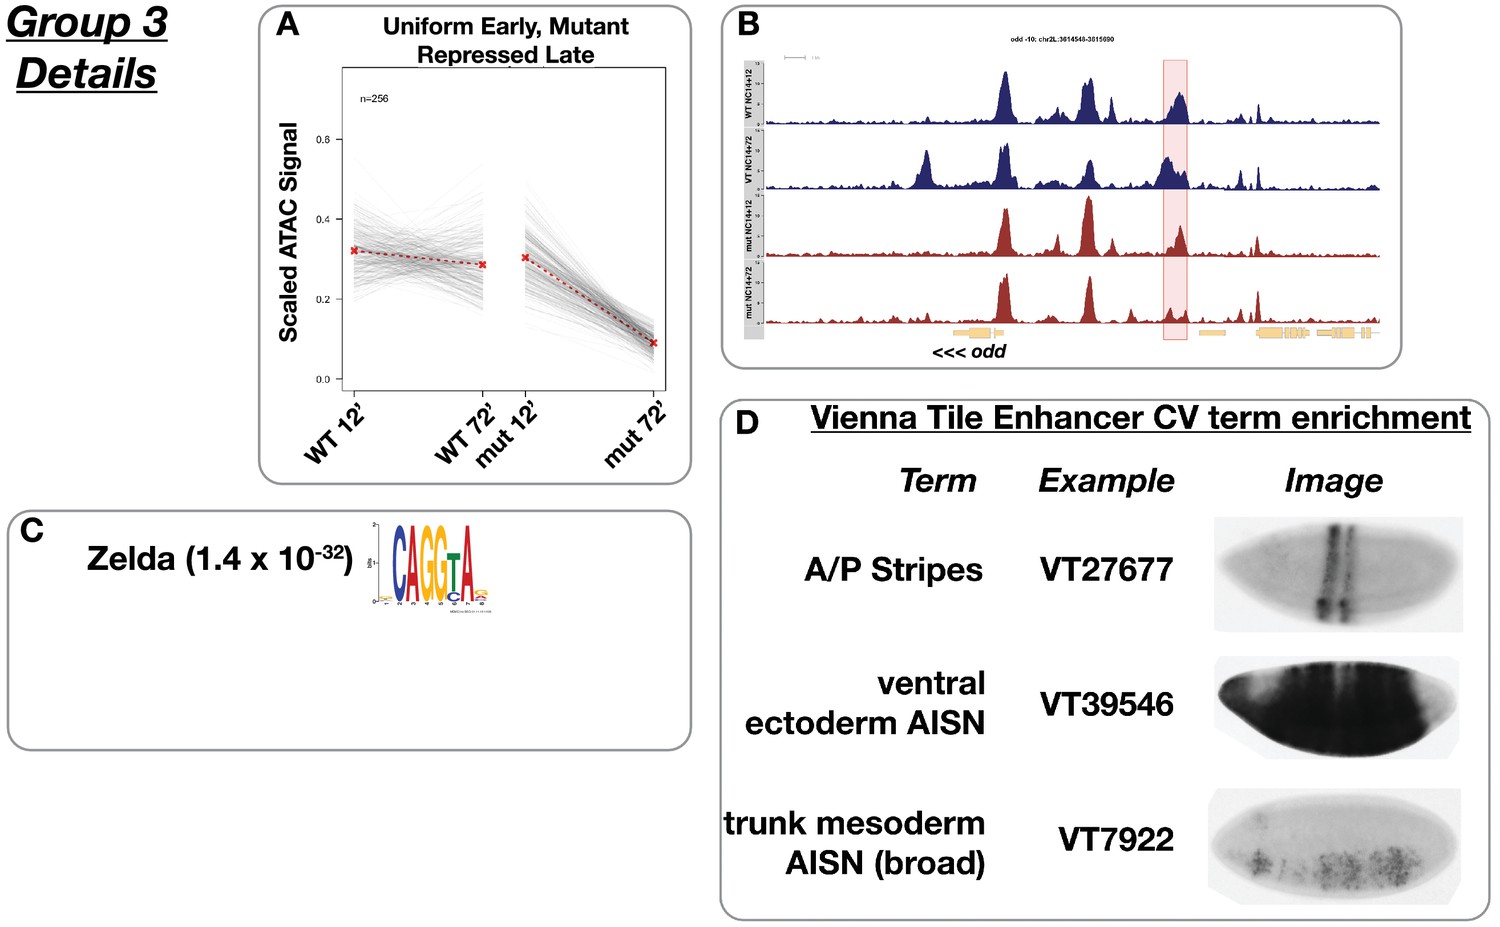
Uniform early accessibility with late mutant repression.
(A) Scaled ATAC-seq signal within this class is plotted for each classified region. Average signal between genotypes is shown in red. (B) Example of a region within this class. Shown here is the odd-skipped −10 enhancer region. The scale for the y-axis is 0–15 CPM for all plots. (C) Motifs enriched within this class as reported by MEME. (D) Enrichment of controlled vocabulary terms from the Vienna Tiles collection of functionally validated enhancers. Terms enriched within this class of ATAC peak (p≤0.01, Fisher’s Exact Test) are listed at left, and an example expression pattern for a Vienna Tile reporter present in the ATAC class and associated with the enriched term is shown at right. Images are from https://enhancers.starklab.org (Kvon et al., 2014).
Figure 4—figure supplement 4
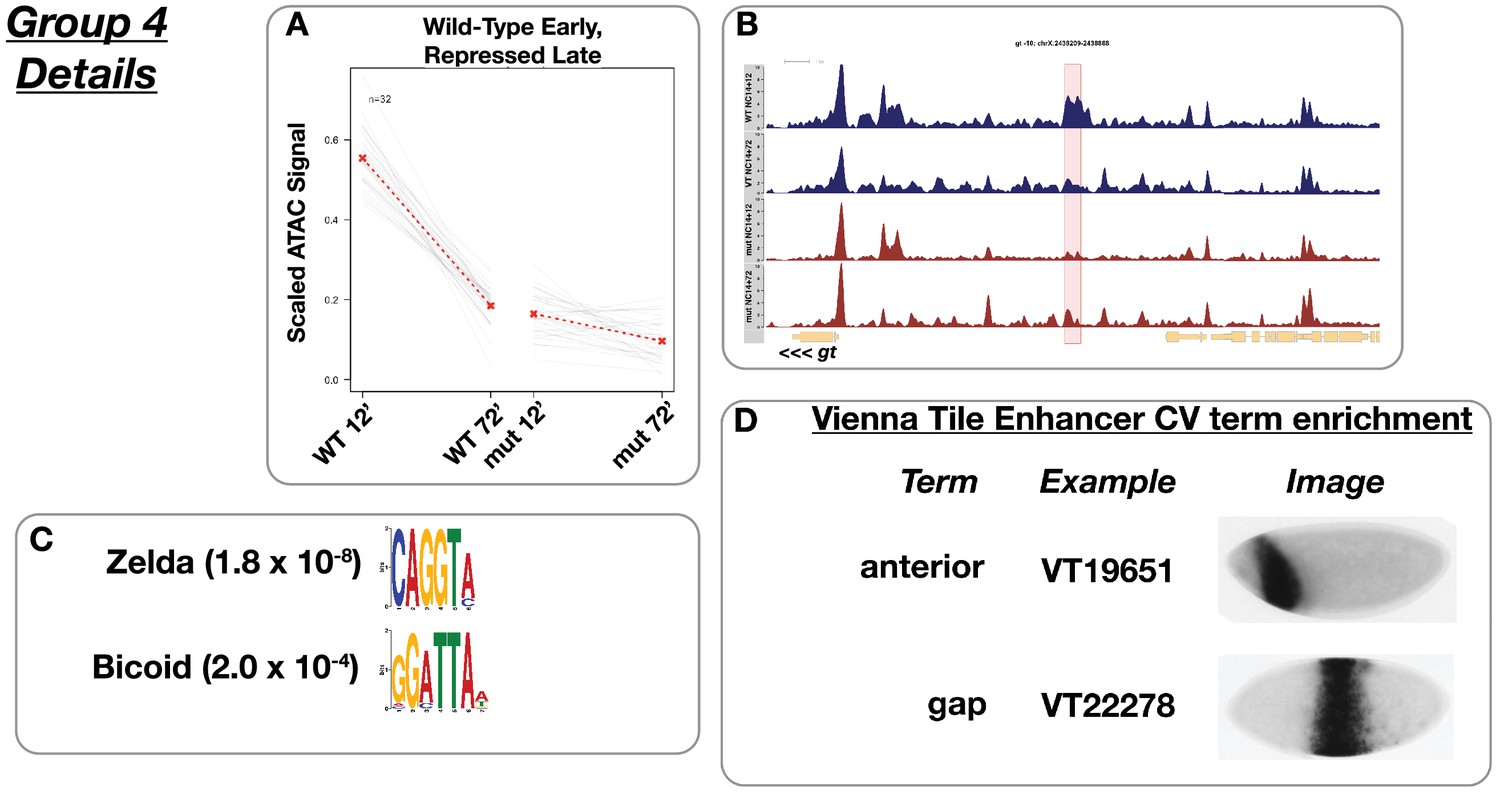
Wild-type early accessibility with late repression.
(A) Scaled ATAC-seq signal within this class is plotted for each classified region. Average signal between genotypes is shown in red. (B) Example of a region within this class. Shown here is the giant −10 enhancer region. The scale for the y-axis is 0–10 CPM for all plots. (C) Motifs enriched within this class as reported by MEME. (D) Enrichment of controlled vocabulary terms from the Vienna Tiles collection of functionally validated enhancers. Terms enriched within this class of ATAC peak (p≤0.01, Fisher’s Exact Test) are listed at left, and an example expression pattern for a Vienna Tile reporter present in the ATAC class and associated with the enriched term is shown at right. Images are from https://enhancers.starklab.org (Kvon et al., 2014).
Figure 4—figure supplement 5
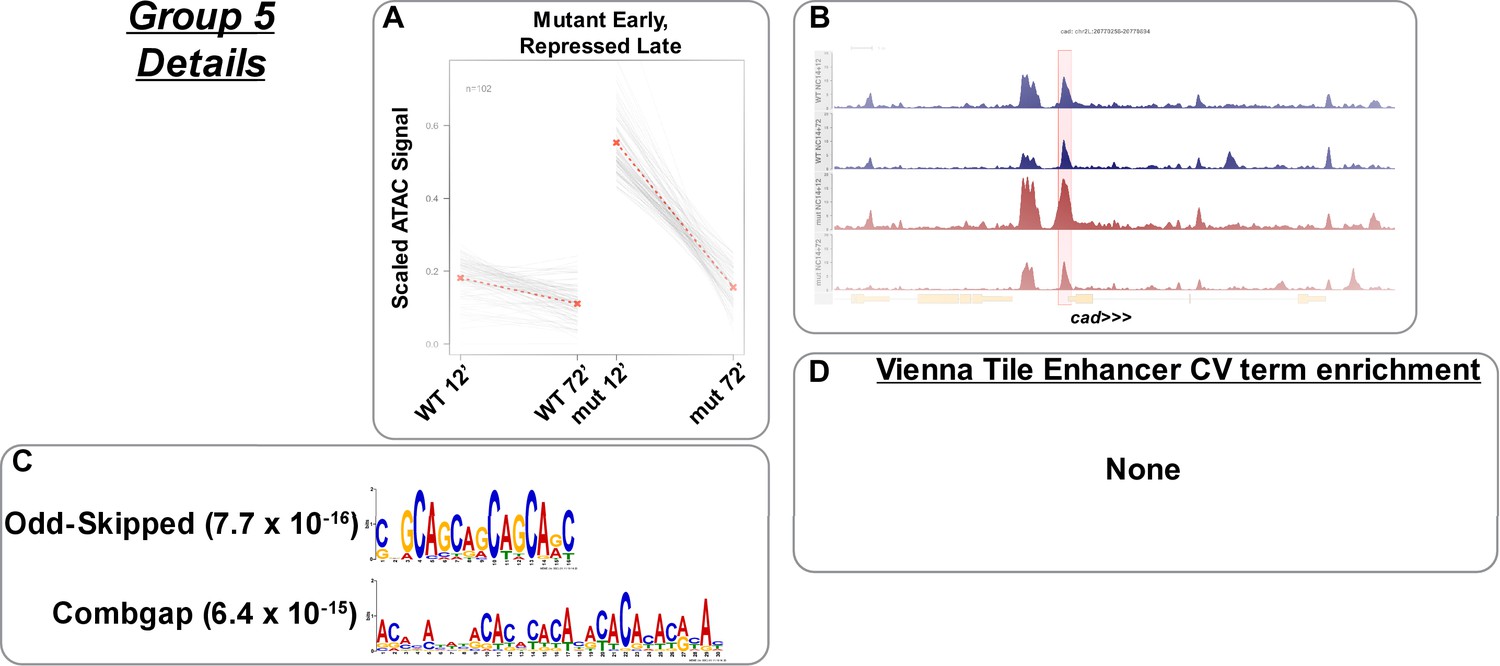
Mutant early accessibility with late repression.
(A) Scaled ATAC-seq signal within this class is plotted for each classified region. Average signal between genotypes is shown in red. (B) Example of a region within this class. Shown here is the caudal promoter region. The scale for the y-axis is 0–20 CPM for all plots. (C) Motifs enriched within this class as reported by MEME. (D) Enrichment of controlled vocabulary terms from the Vienna Tiles collection of functionally validated enhancers. There are no enriched controlled vocabulary terms in this group.
Figure 4—figure supplement 6
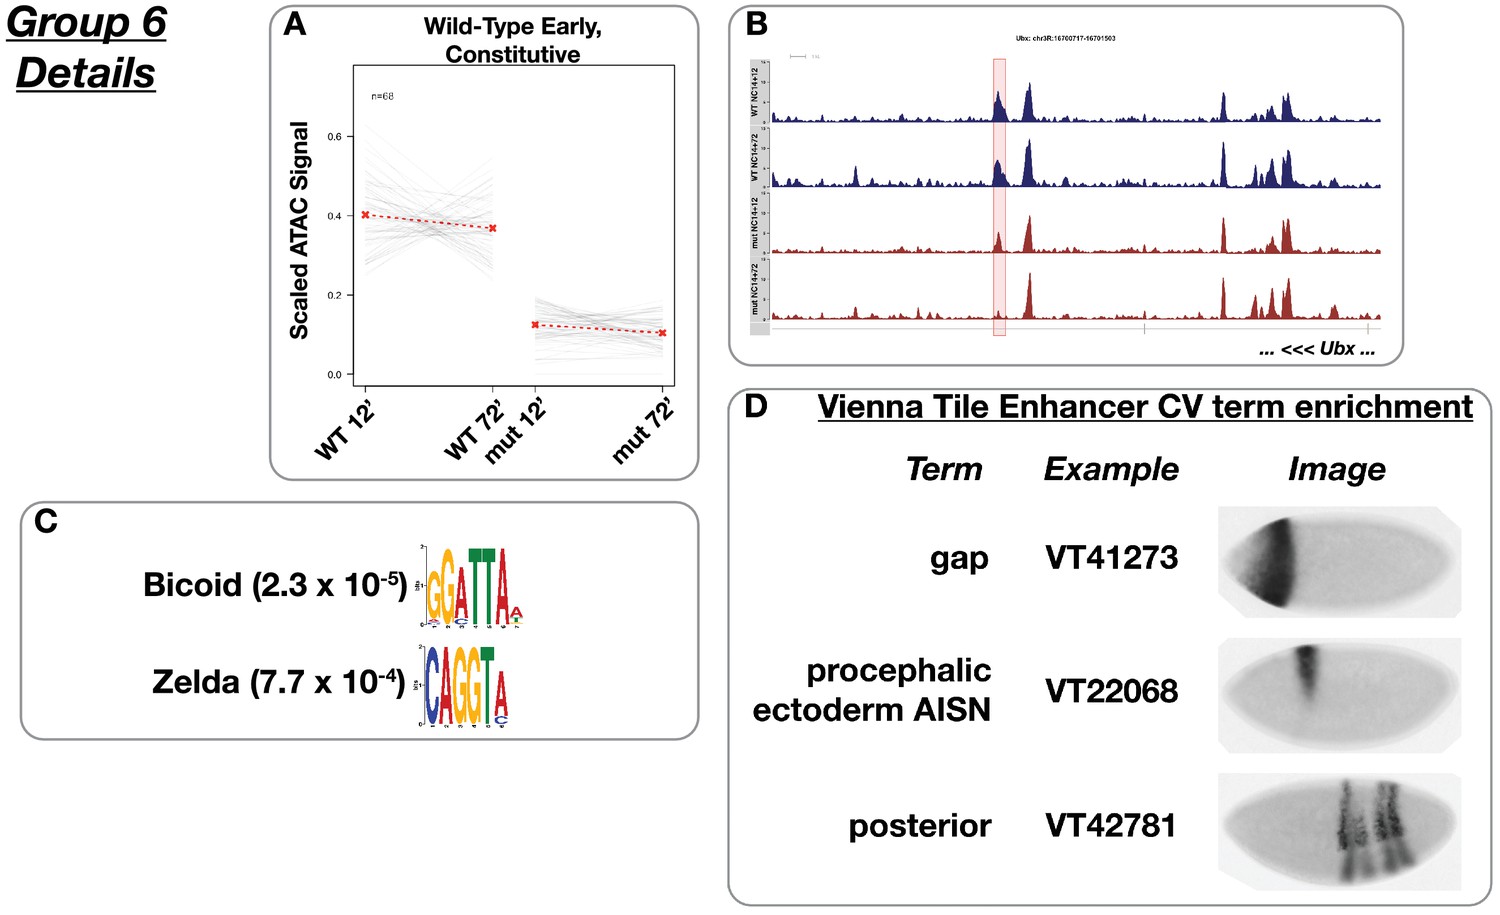
Wild-type early accessibility ‘constitutive’.
(A) Scaled ATAC-seq signal within this class is plotted for each classified region. Average signal between genotypes is shown in red. (B) Example of a region within this class. Shown here is a region within an intron of Ultrabithorax. The scale for the y-axis is 0–15 CPM for all plots. (C) Motifs enriched within this class as reported by MEME. (D) Enrichment of controlled vocabulary terms from the Vienna Tiles collection of functionally validated enhancers. Terms enriched within this class of ATAC peak (p≤0.01, Fisher’s Exact Test) are listed at left, and an example expression pattern for a Vienna Tile reporter present in the ATAC class and associated with the enriched term is shown at right. Images are from https://enhancers.starklab.org (Kvon et al., 2014).
Figure 4—figure supplement 7
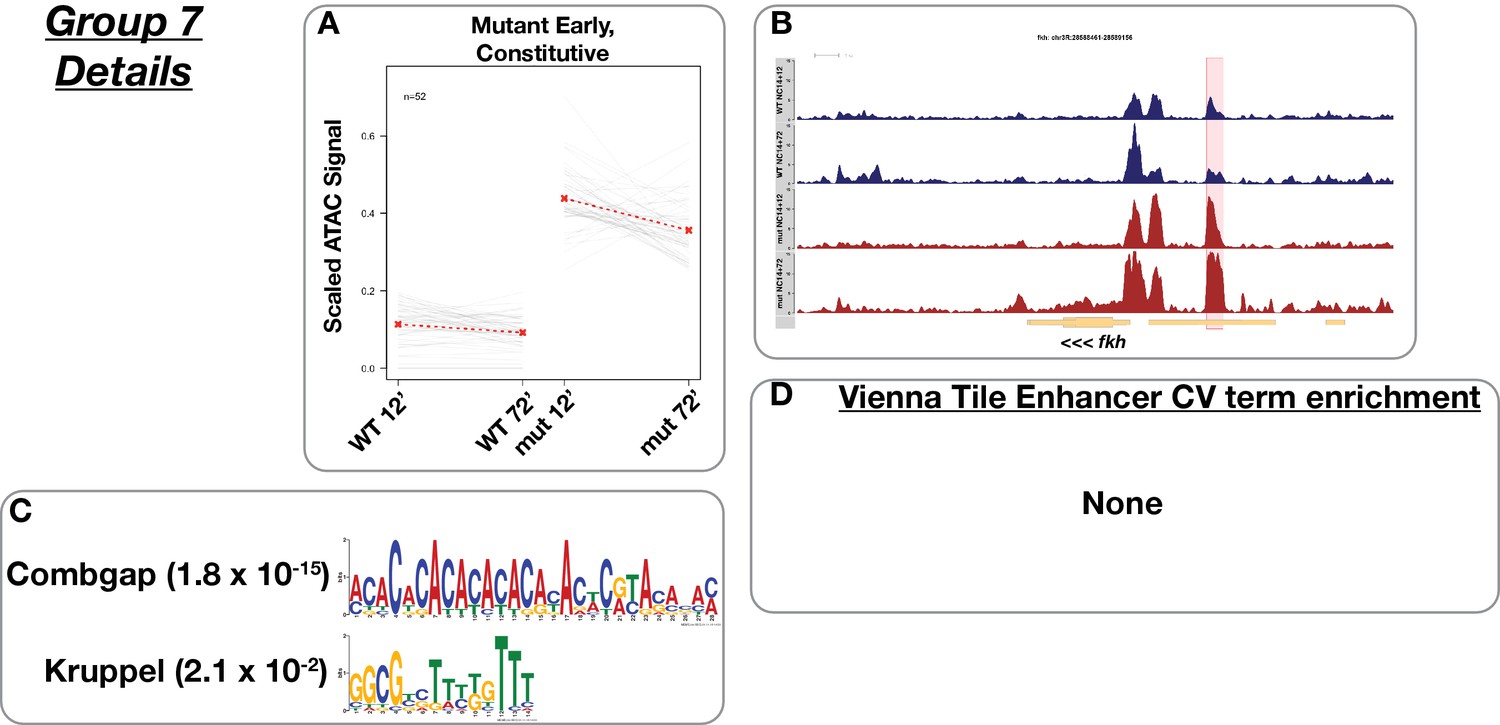
Mutant early accessibility, ‘constitutive’.
(A) Scaled ATAC-seq signal within this class is plotted for each classified region. Average signal between genotypes is shown in red. (B) Example of a region within this class. Shown here is an intergenic region upstream of forkhead. The scale for the y-axis is 0–15 CPM for all plots. (C) Motifs enriched within this class as reported by MEME. (D) Enrichment of controlled vocabulary terms from the Vienna Tiles collection of functionally validated enhancers. There are no enriched controlled vocabulary terms in this group.
Figure 4—figure supplement 8
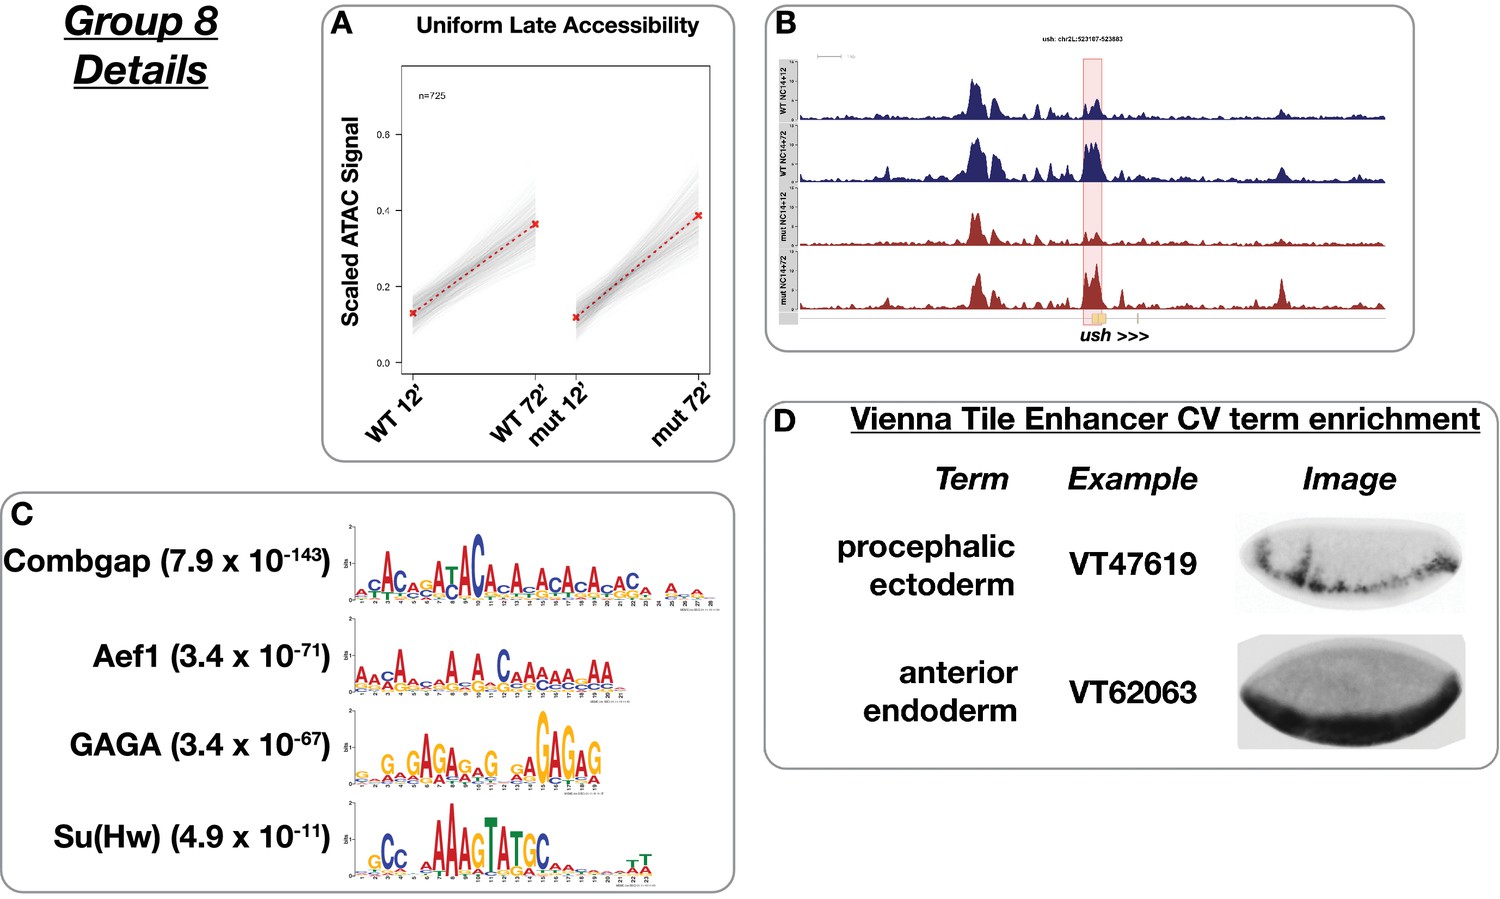
Uniform late accessibility.
(A) Scaled ATAC-seq signal within this class is plotted for each classified region. Average signal between genotypes is shown in red. (B) Example of a region within this class. Shown here is a u-shaped promoter region. (C) Motifs enriched within this class as reported by MEME. The scale for the y-axis is 0–15 CPM for all plots. (D) Enrichment of controlled vocabulary terms from the Vienna Tiles collection of functionally validated enhancers. Terms enriched within this class of ATAC peak (p≤0.01, Fisher’s Exact Test) are listed at left, and an example expression pattern for a Vienna Tile reporter present in the ATAC class and associated with the enriched term is shown at right. Images are from https://enhancers.starklab.org (Kvon et al., 2014).
Figure 4—figure supplement 9
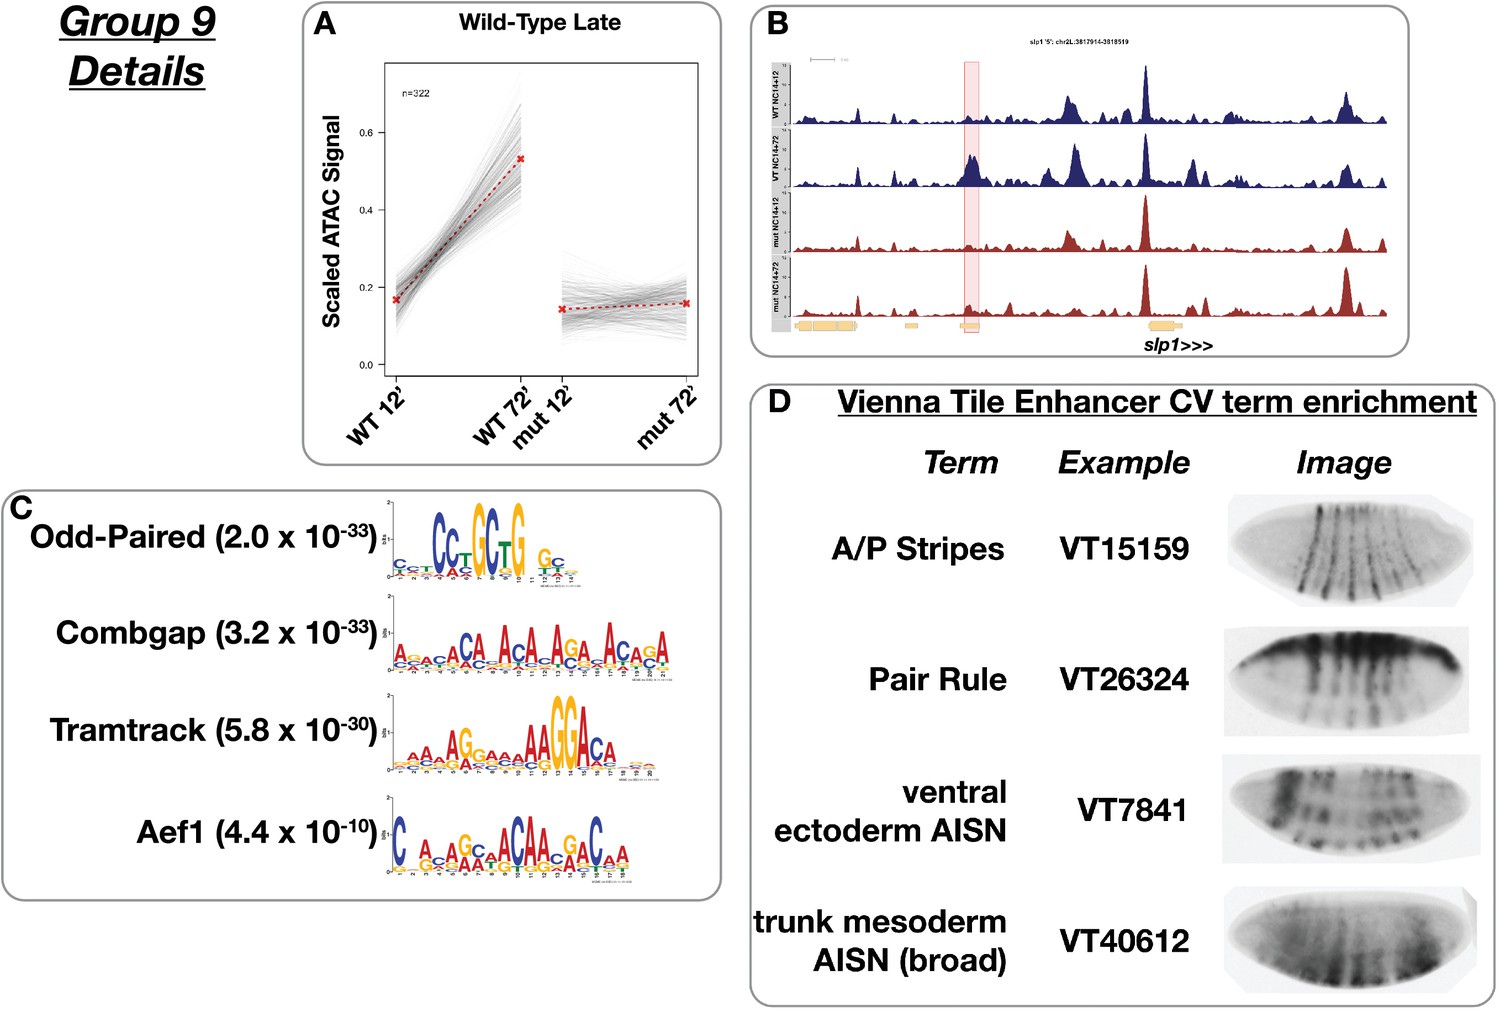
Wild-type late accessibility.
(A) Scaled ATAC-seq signal within this class is plotted for each classified region. Average signal between genotypes is shown in red. (B) Example of a region within this class. Shown here is the slp1 ‘5’ enhancer region. The scale for the y-axis is 0–15 CPM for all plots. (C) Motifs enriched within this class as reported by MEME. (D) Enrichment of controlled vocabulary terms from the Vienna Tiles collection of functionally validated enhancers. Terms enriched within this class of ATAC peak (p≤0.01, Fisher’s Exact Test) are listed at left, and an example expression pattern for a Vienna Tile reporter present in the ATAC class and associated with the enriched term is shown at right. Images are from https://enhancers.starklab.org (Kvon et al., 2014).
Figure 4—figure supplement 10
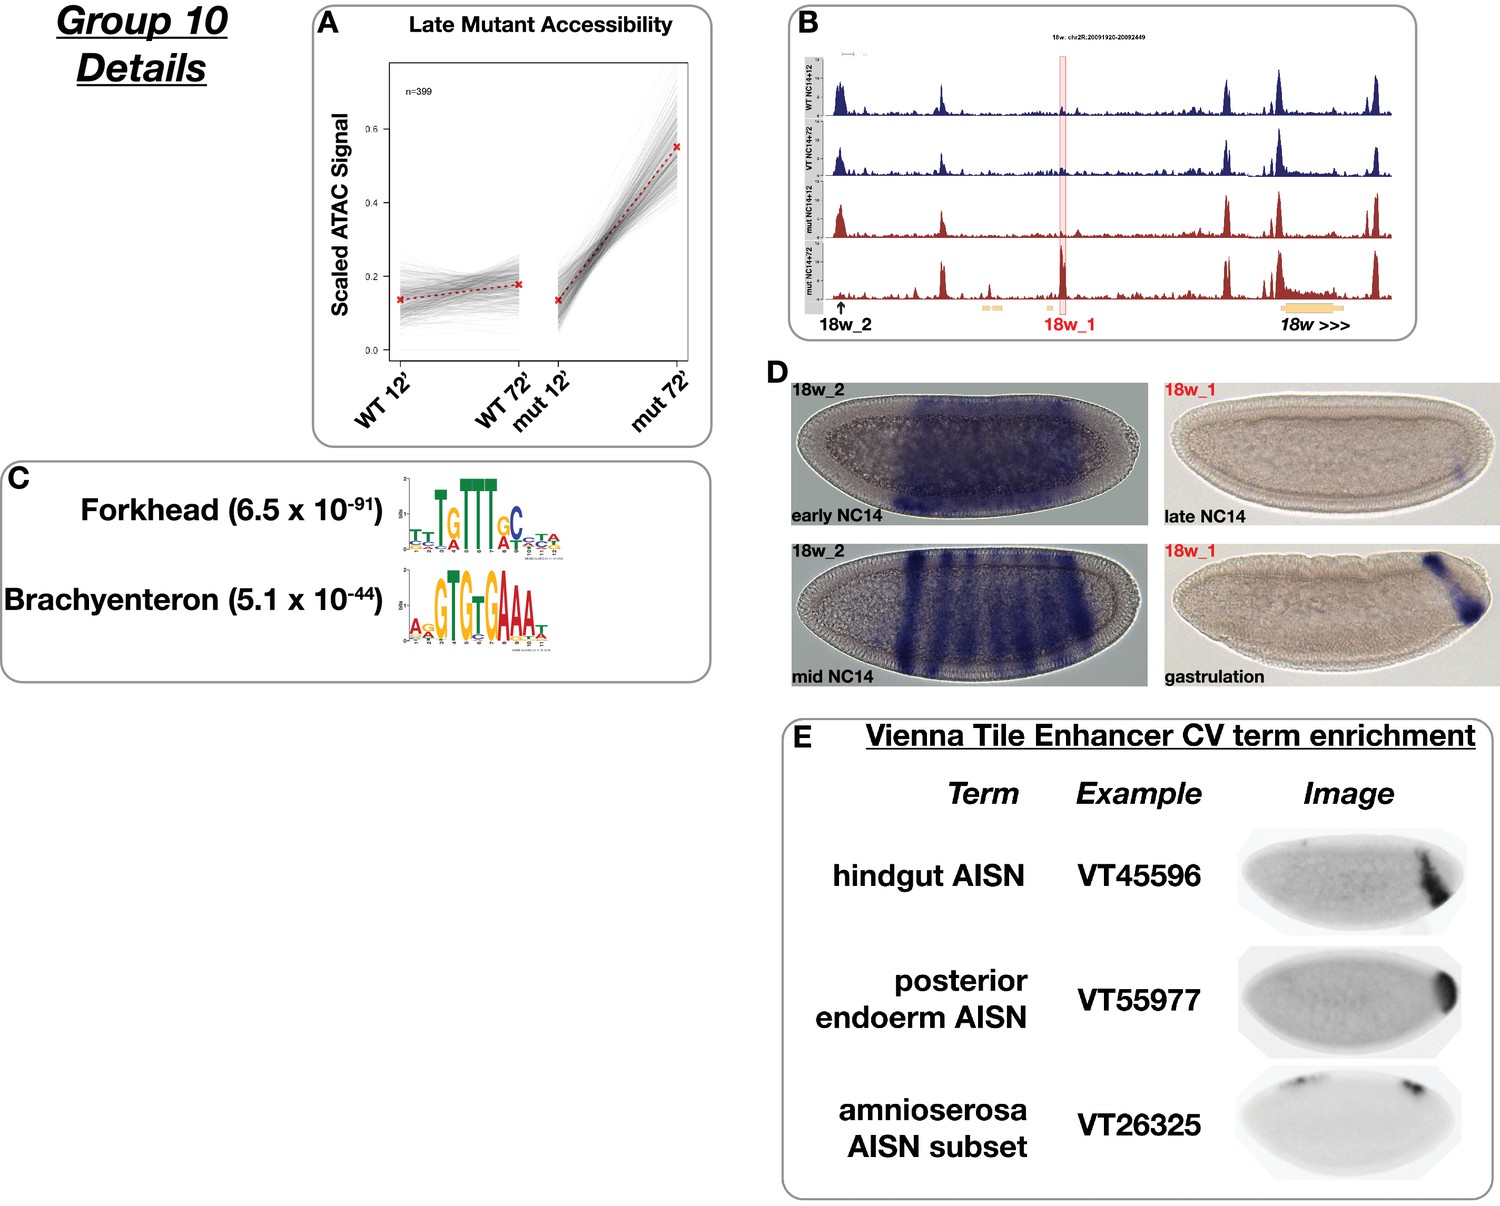
Mutant late accessibility.
(A) Scaled ATAC-seq signal within this class is plotted for each classified region. Average signal between genotypes is shown in red. (B) Example of a region within this class. Shown here is an intergenic region upstream of 18w, which we named ‘18w 1’ (red highlighted box). The scale for the y-axis is 0–15 CPM for all plots. Also indicated (arrow) is a second region ‘18w 2’ that showed converse behavior and is categorized as ‘uniform early, mutant late repression’ (group 3) in this scheme. We cloned each of these into a gal4 reporter construct and measured expression. See below. (C) Motifs enriched within this class as reported by MEME. (D) gal4 in situ hybridization for the indicated reporters derived from the 18w locus. 18w 1 expression is restricted to late, gastrula stage embryos and is only active in posterior endodermal precursors. In contrast, 18w 2 is expressed very early in a uniform sheath within the segmental primordium, which eventually resolves into seven distinct stripes. (E) Enrichment of controlled vocabulary terms from the Vienna Tiles collection of functionally validated enhancers. Terms enriched within this class of ATAC peak (p≤0.01, Fisher’s Exact Test) are listed at left, and an example expression pattern for a Vienna Tile reporter present in the ATAC class and associated with the enriched term is shown at right. Images are from https://enhancers.starklab.org (Kvon et al., 2014).
Figure 4—figure supplement 11

Enrichment of generic genomic features within differentially accessible groups.
The Drosophila genome was subdivided into genic and intergenic regions, and genic regions were further subdivided into promoter (=1 kb upstream of the transcription start site), exonic, and intronic regions. Overlaps were assigned to a single region by prioritizing promoters over introns, and introns over exons (e.g. a promoter within another gene’s intron was assigned to the promoter class). Enrichment of these classes within differentially accessible groups 1 through 10 was measured by performing Fisher’s exact test. Plotted here are the log2(odds ratios) for enrichment of a genomic feature within a particular group. Any region with a Fisher’s exact p-value<0.05 is indicated with an asterisk (NS = not significantly enriched). For the exonic regions, the number of zygotically expressed exons is indicated next to the total number of exons within the group.
Figure 5 with 4 supplements
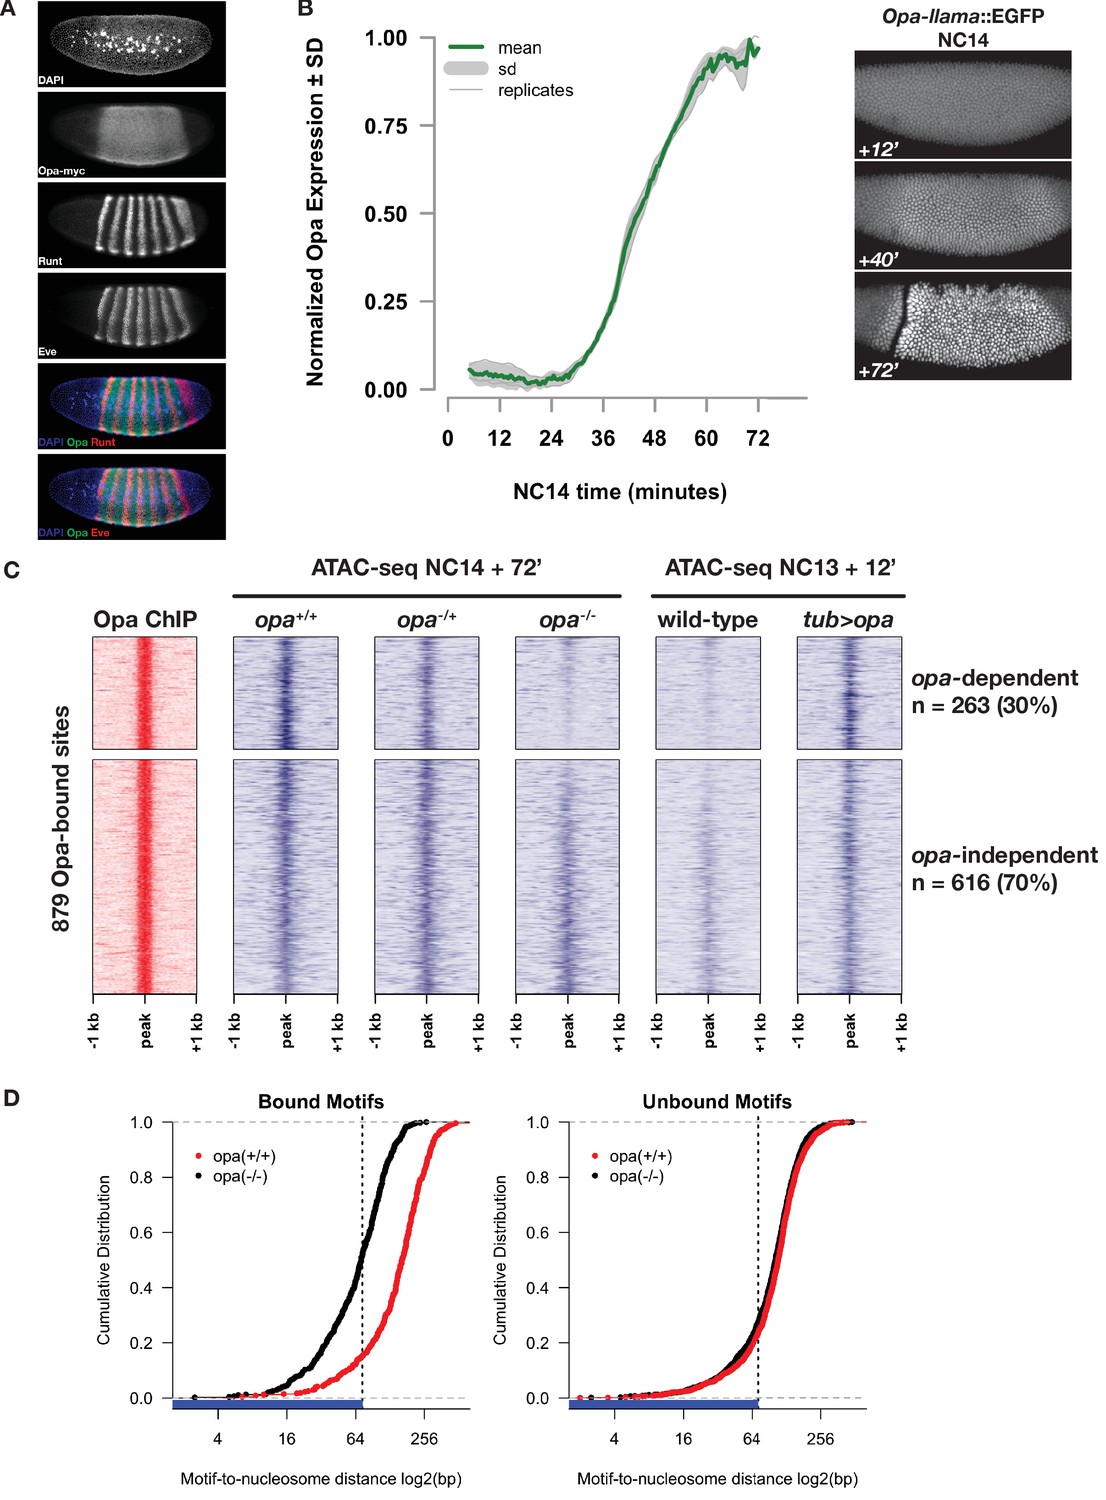
Opa is necessary and sufficient to pioneer accessible chromatin.
(A) Immunostaining for myc-tagged Opa expression relative to expression of pair-rule genes Runt and Eve in a late NC14 embryo. (B) Opa expression dynamics were measured using a llama-tagged opa allele. Opa expression initiates midway through NC14 and reaches steady levels by entry into gastrulation at 65 min. Images show representative expression of opa-llama::EGFP at the indicated timepoints. (C) Heatmaps showing scaled ATAC-seq accessibility measurements (blue) over a set of high-confidence Opa binding sites, as determined by ChIP-seq for Opa-myc (red). Two experiments are shown, for loss of function at NC14 + 72’, and gain of function at NC13 +12. Loss of blue signal indicates a reduction in accessibility. (D) Cumulative distribution of measured of distances between bound (left) or unbound (right) Opa motifs and modeled nucleosome dyad positions, in the absence (black) or presence (red) of Opa. X-axis is log2 scaled, and the expected coverage of a nucleosome is depicted by the blue rug and vertical dotted line. See also Figure 5—figure supplements 1–4.
Figure 5—figure supplement 1

Comparison of RNA Pol two distribution over the opa and ftz loci.
RNA Pol2 ChIP-seq coverage measurements over the opa (left) and ftz (right) loci are shown from NC12 through NC14 Late (E = early, M = mid, L = Late). x-axes (genomic ranges) for both plots are identical, and highlight the difference in gene size between opa and ftz. y-axes are scaled identically across both loci and timepoints and can be compared directly. RNA Pol 2 ChIP-seq data is from Blythe and Wieschaus (2015).
Figure 5—figure supplement 2
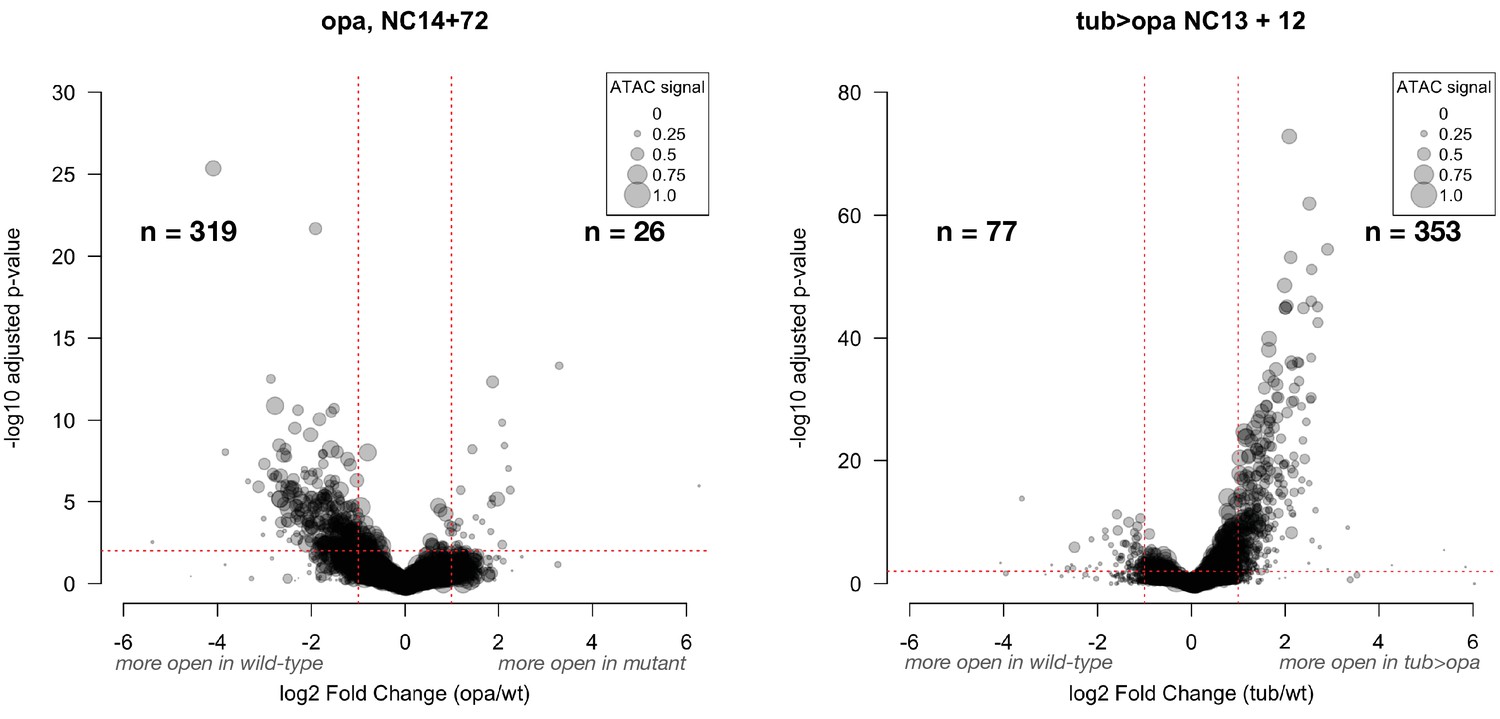
Effect of opa loss- and gain-of-function across all ATAC peaks.
These volcano plots show the effect size for opa loss- and gain-of function experiments over the entire set of ATAC peaks (n = 26328 peaks). The plot on the left shows the effect of opa loss of function on chromatin accessibility. The number of peak regions above significance (0.01) and log2 fold-enrichment (1) thresholds is indicated in bold for each condition. Point sizes are scaled to the distribution of mean ATAC signal for the represented peak (large dots = larger ATAC signal).
Figure 5—figure supplement 3
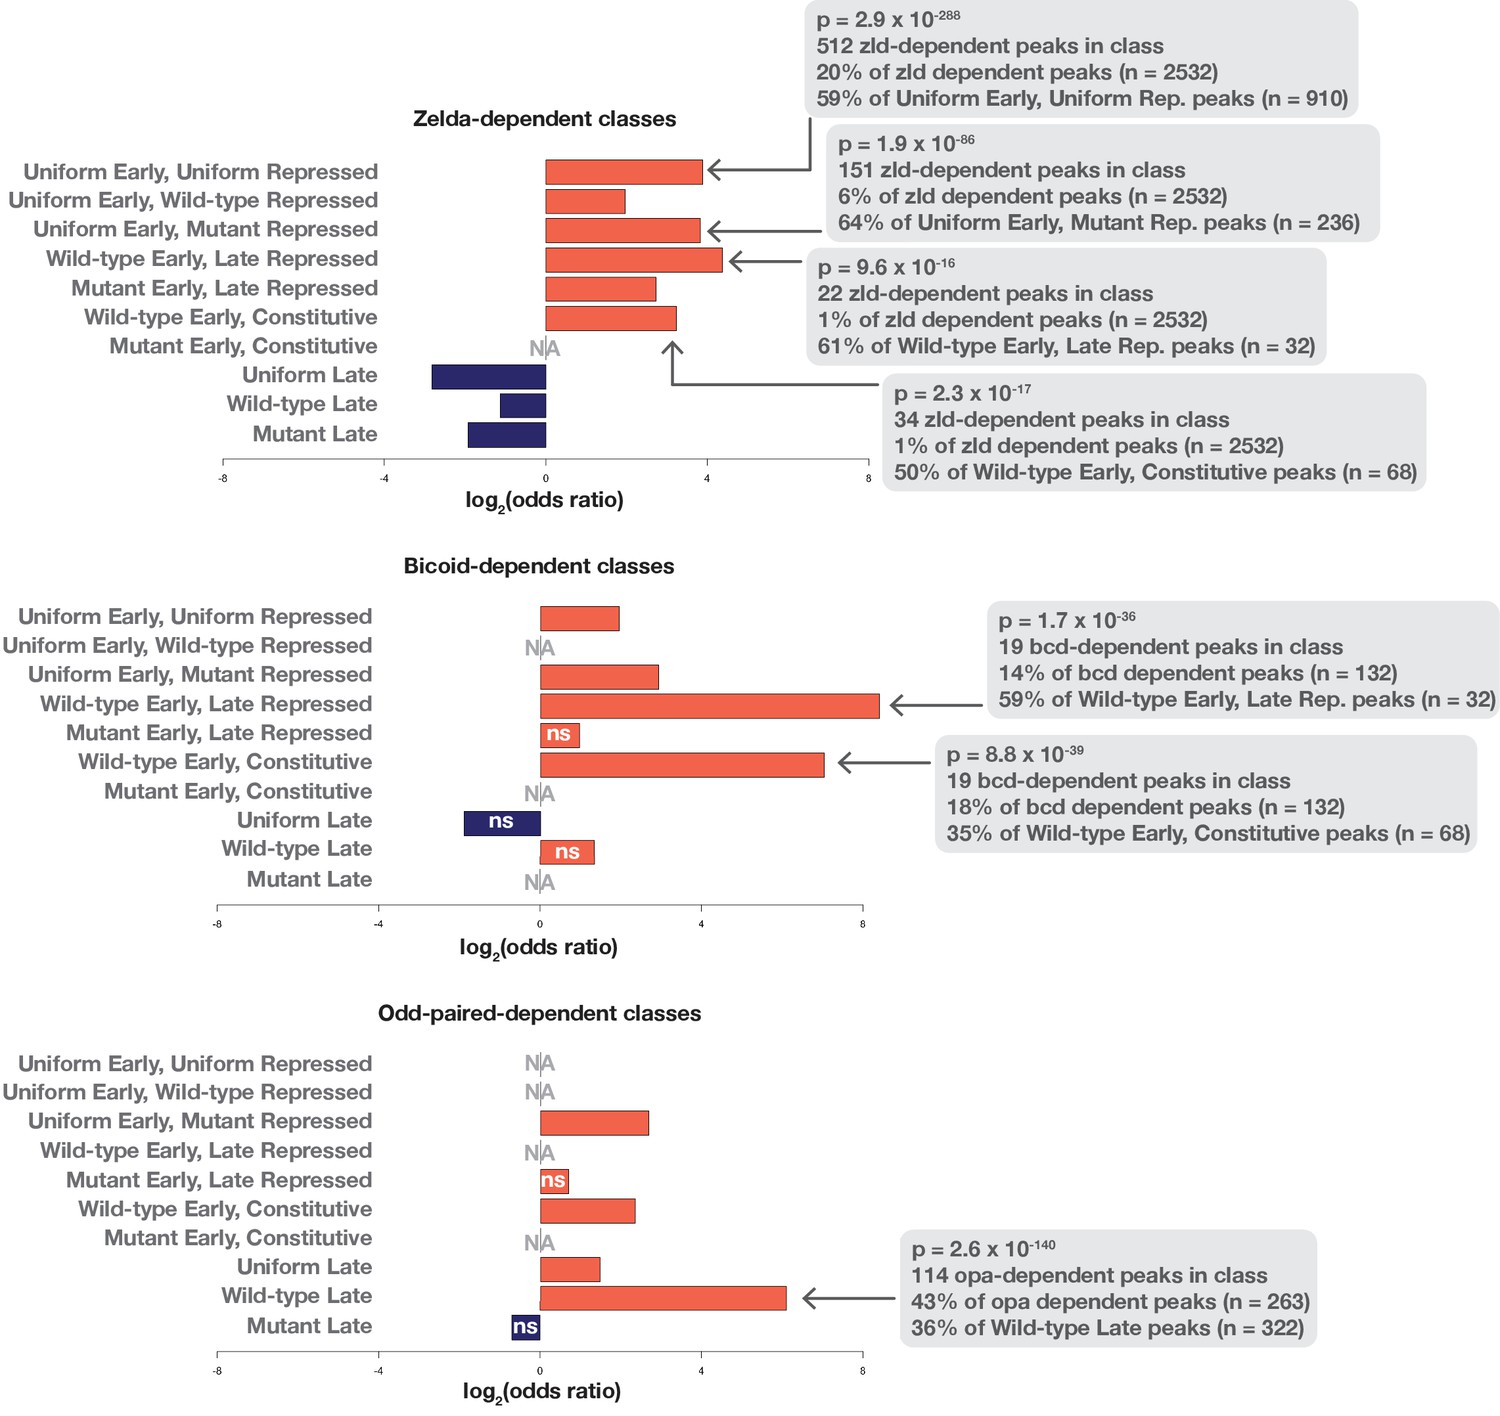
Enrichment of Zld, Bcd, and Opa dependence in accessibility classes.
The set of ATAC-peaks showing dependence on either Zld, Bcd, or Opa were calculated by DESeq2. ATAC seq data for bcd and zld mutant embryos was from Hannon et al. (2017). ‘NA’ indicates that none of the tested pioneer dependent peaks were found to overlap the associated peak class. Bcd and Zld-dependent regions are enriched for classes with early accessibility. Opa is enriched in the wild-type late class. Two-tailed fisher’s exact p-values and numbers are provided for select classes where motif enrichment was observed. ‘ns’ indicates that the Fisher’s exact p-value for the associated comparison was greater than 0.05.
Figure 5—figure supplement 4
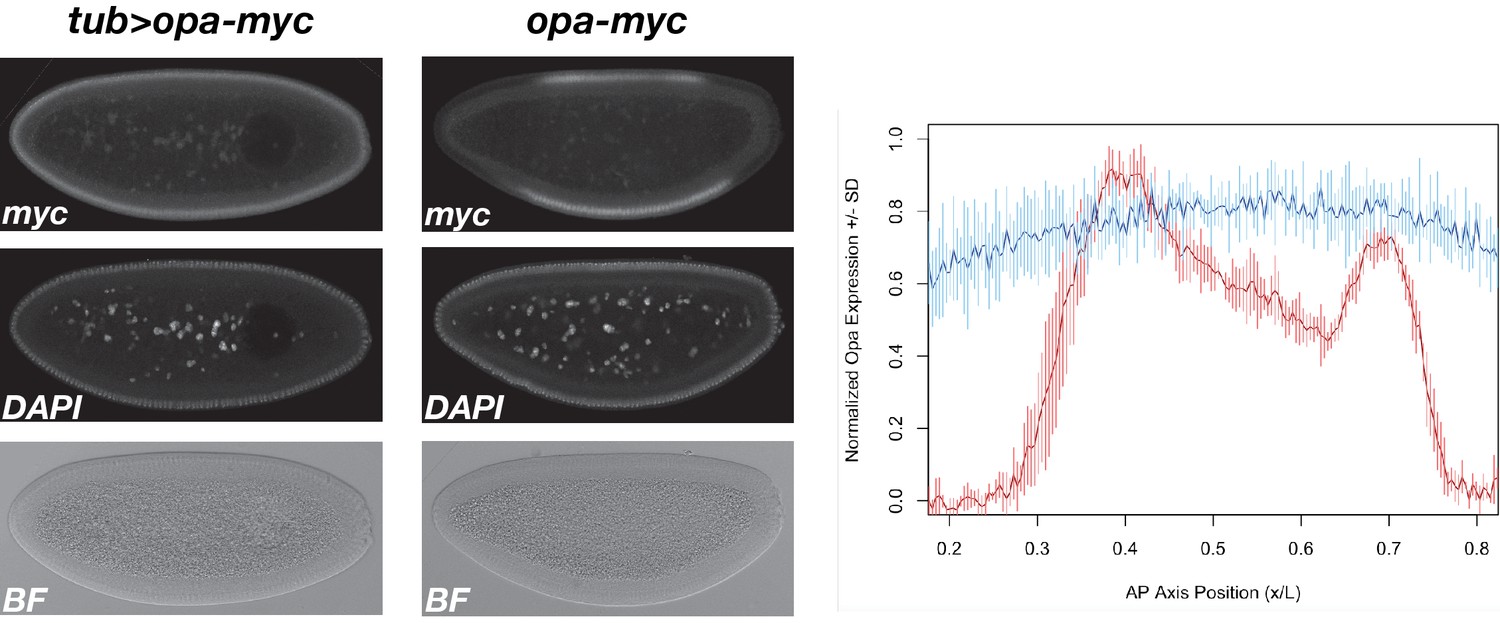
Expression of tub >opa compared with wild-type opa.
Embryos expressing either tub >opa-3xMyc or wild-type opa-3xMyc were mixed prior to fixation and immunostained together for myc and counterstained for DNA (DAPI). Stained embryos were mounted and imaged in a single confocal session. Representative tub >opa-3xMyc and opa-3xMyc embryos are shown (left and center, respectively). Staining intensity from three stage-matched embryos from each genotype was quantified and plotted as a function of AP axis position. Average wild-type expression ±st. dev. (n = 3 embryos) is plotted in red. Tub >opa expression±st. dev. (n = 3 embryos) is plotted in blue. Note, for presentation, certain images were rotated from their original positions and missing background pixels were filled in. No pixels corresponding to the embryo were altered.
Figure 6 with 1 supplement
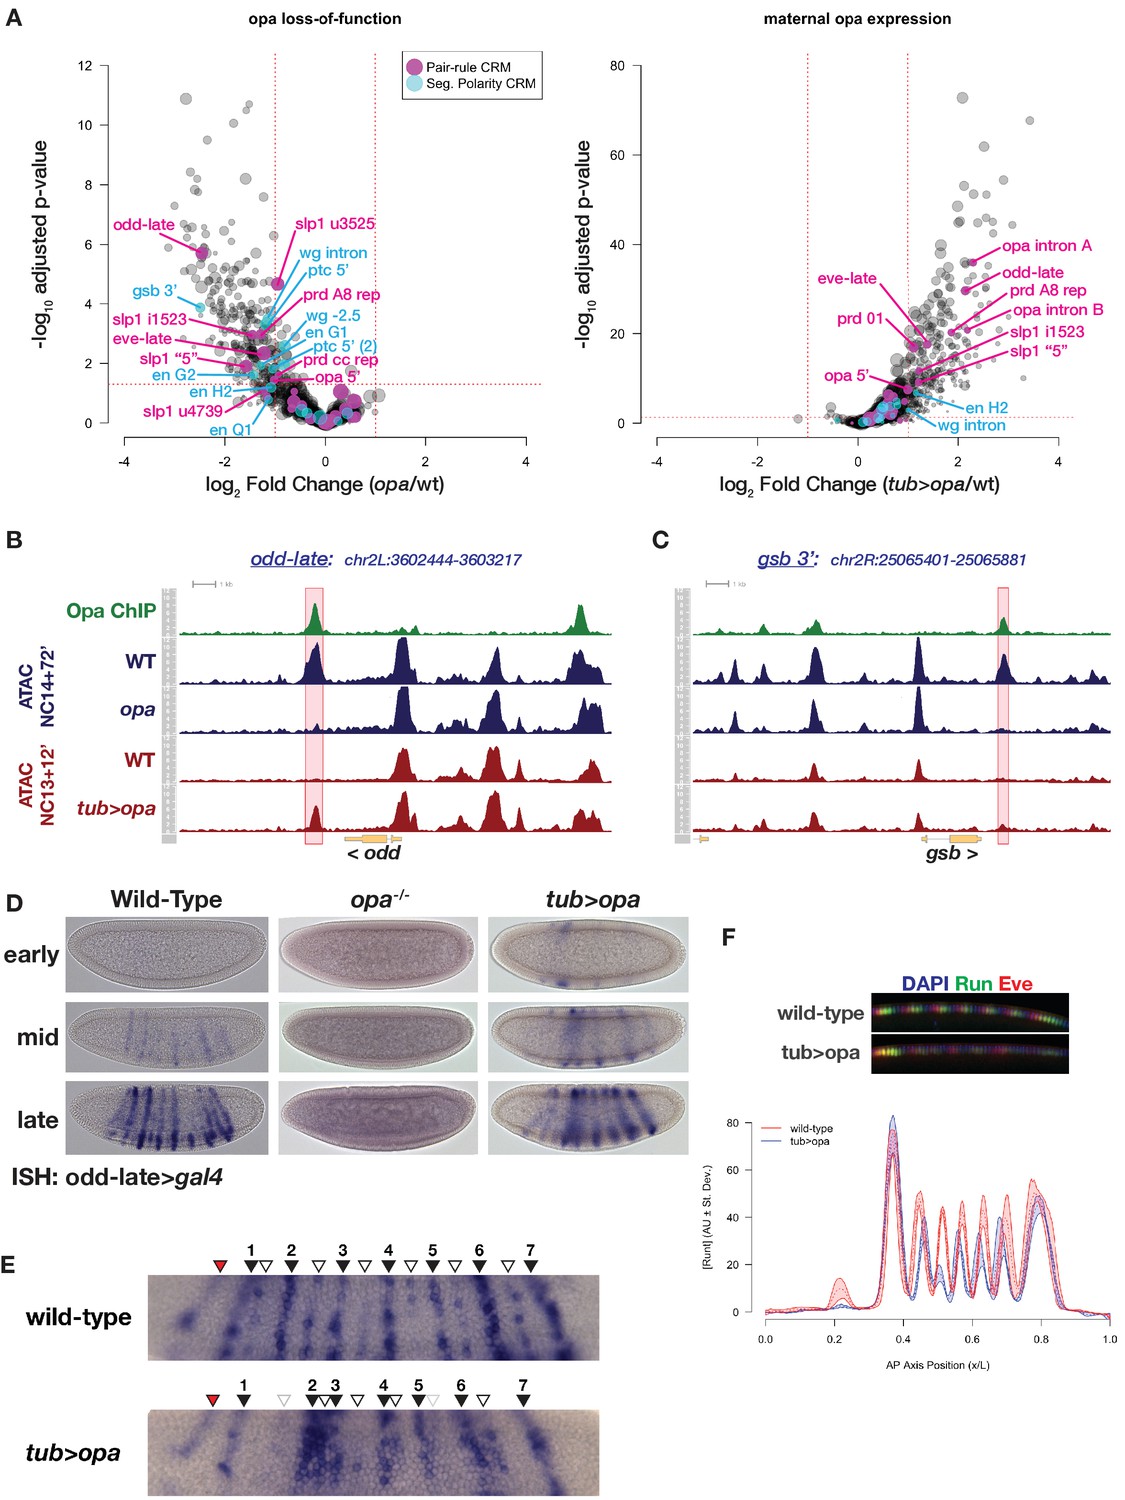
Premature expression of Opa disrupts pair-rule patterning.
(A) Volcano plots for loss of function (left) and maternal misexpression (right) of Opa with pair-rule and segment polarity CRMs highlighted (magenta and cyan, respectively). (B) Example of ATAC seq coverage over an opa-dependent pair-rule locus, odd. The odd-late CRM is highlighted showing the effect of opa at this element. The scale for the y-axis is 0–12 CPM for all plots. (C) For comparison, ATAC-seq coverage over a segment polarity locus, gsb, is shown. The gsb 3’ CRM is highlighted. The scale for the y-axis is 0–15 CPM for all plots. (D) In situ hybridization for an odd-late gal4 reporter is shown for wild-type, opa mutant and tub >opa. Embryo stages are indicated at left. Note the lack of activity in opa mutants and the premature activation in the presence of tub >opa. (E) Detail view of odd-late expression in wild-type and tub >opa gastrula stage embryos. Odd parasegmental stripes are indicated with numbered black arrowheads, even stripes with open arrowheads, and the anterior head stripe is indicated with a red arrowhead. Weak even parasegmental stripes in tub >opa that eventually appear are indicated with grey open arrowheads. The stripe at numbered position 1 is coincident with the cephalic furrow, which is beginning to form in both pictured embryos. (F) Maternal opa interferes with stripe positioning and intensity for pair-rule genes eve and runt. Plot shows the average effect of maternal opa on runt expression in mid NC14 embryos. Average quantified Runt expression ±std. dev. is plotted for wild type (red) and tub >opa (blue, n = three embryos per genotype). Inset shows dorsal mid-saggital view of a representative embryo of the indicated genotypes stained for Runt (green) and Eve (red). See also Figure 6—figure supplement 1.
Figure 6—figure supplement 1
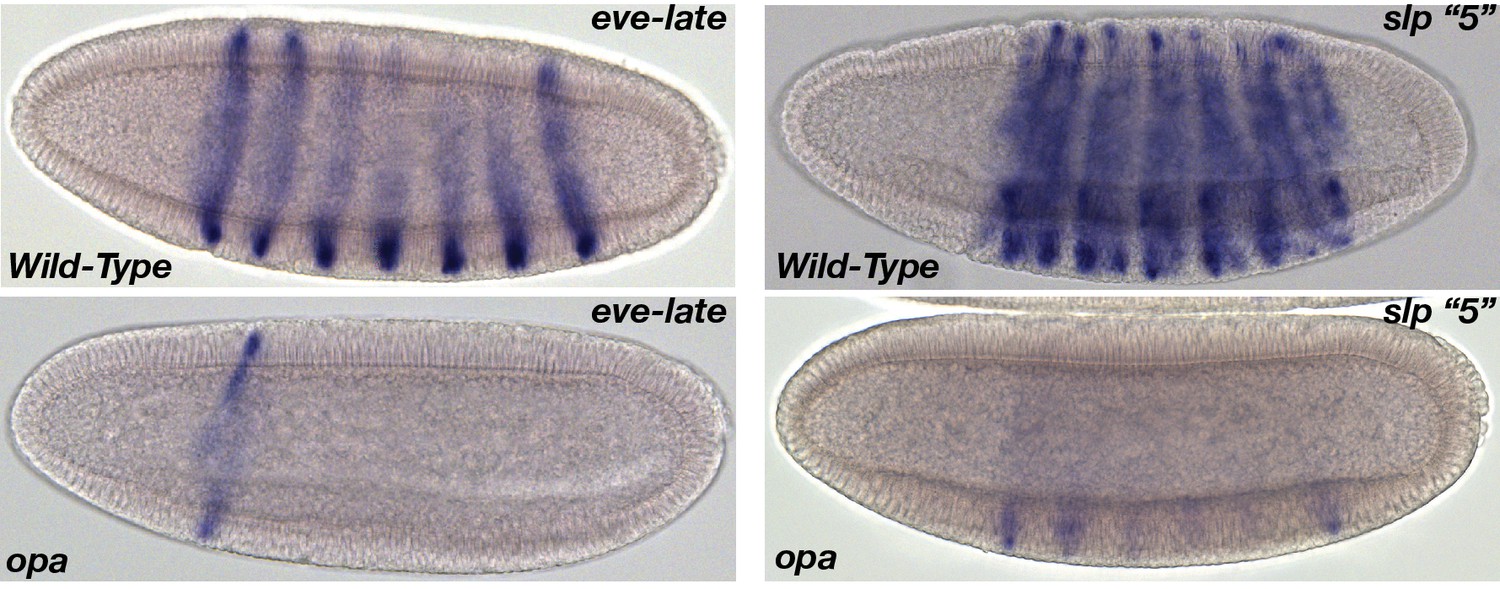
Examples of expression of opa-dependent CRMs in wild-type and opa mutant embryos.
(Left Panels) Wild-type expression of the eve-late element initiates late in NC14 in a seven-stripe pattern. In opa mutants, stripes 2–6 are completely eliminated, and expression of stripe one is slightly reduced. (Right Panels) Expression of the slp1 ‘5’ CRM is initially observed in a 13-stripe pattern in wild-type gastrula stage embryos. The first stripe is coincident with the cephalic furrow and is transiently downregulated during gastrulation resulting in 12 remaining stripes of activity. In opa mutants expression within the odd parasegmental stripes is completely eliminated, and even parasegmental expression is strongly reduced.
Videos
Video 1
Representative Movie of Opa-llama expression.
An embryo expressing maternal free EGFP, maternal Histone H2Av-RFP, and zygotic llama-tagged opa is shown here in a time-lapse image that initiates at mitosis 12 and continues through early germband extension. The counter in the upper left corner indicates time (hh:mm) relative to the start of NC14. Top panel shows the opa-llama (EGFP) channel. Middle panel shows His2Av-RFP, which marks nuclei at all times. Bottom panel shows the merge of these two channels. In addition to features of the movie described in the Results section, note the persistence of Opa on mitotic chromatin during zygotic mitoses within the segmental primordium (>1 hr:15 m) compared with EGFP background in head region mitotic domains.
Tables
Key resources table
| Reagent type (species) or resource | Designation | Source or reference | Identifiers | Additional information |
|---|---|---|---|---|
| Genetic reagent (D. melanogaster) | bcdE2 osk166 cic1 tsl1 TlRM9 | This paper | Flybase allele IDs: FBal0001081 FBal0013308 FBal0103875 FBal0017195 FBal0016839 | Quintuple mutant generated by multiple rounds of meiotic recombination as described. |
| Genetic reagent (D. melanogaster) | opaIIP32 | Jürgens et al., 1984 | Flybase allele ID: FBal0013272 | |
| Genetic reagent (D. melanogaster) | P(His2Av-EGFP) | BloomingtonDrosophilaStock Center | Flybase allele ID: FBal0183310 | |
| Genetic reagent (D. melanogaster) | opa-3xMyc | This paper | CRISPR/Cas9 allele | |
| Genetic reagent (D. melanogaster) | opa-EGFP llama | This paper | CRISPR/Cas9 allele | |
| Genetic reagent (D. melanogaster) | Bcd promoter > EGFP | This paper | Transgenic insertion into P(CaryP)attP40 (Flybase transposable element insertion site ID: FBti0114379) | |
| Genetic reagent (D. melanogaster) | alpha Tubulin67c > opa-3xMyc | This paper | Transgenic insertion into P(CaryP)attP40 (Flybase transposable element insertion site ID: FBti0114379) | |
| Antibody | Anti-myc polyclonal antibody (rabbit) | Sigma-Aldrich | Cat #: C3956 | ChIP: 1 ug IF: 1:200 |
| Antibody | Anti-eve monoclonal antibody (mouse) | Developmental Studies Hybridoma Bank | Clone number 2B8 | IF: 1:20 |
| Antibody | Anti-runt polyclonal antibody (guinea pig) | Wieschaus Lab, Princeton University | IF: 1:1000 | |
| Software, algorithm | TrimGalore! | https://github.com/FelixKrueger/TrimGalore | ||
| Software, algorithm | Bowtie2 | Langmead and Salzberg, 2012 | ||
| Software, algorithm | Picard MarkDuplicates | http://broadinstitute.github.io/picard/ | ||
| Software, algorithm | MACS2 | Zhang et al., 2008 | ||
| Software, algorithm | IDR | https://www.encodeproject.org/software/idr/ | ||
| Software, algorithm | Bedtools | https://bedtools.readthedocs.io/en/latest/ | ||
| Software, algorithm | Samtools | http://www.htslib.org/ | ||
| Software, algorithm | GenomicAlignments 1.18.1 | Lawrence et al., 2013 | ||
| Software, algorithm | GenomicRanges 1.34.0 | Lawrence et al., 2013 | ||
| Software, algorithm | DESeq2 1.22.2 | Love et al., 2014 | ||
| Software, algorithm | Gviz 1.26.5 | Hahne and Ivanek, 2016 | ||
| Software, algorithm | Biostrings 2.50.2 | Pagès et al., 2019 |
Additional files
-
Source code 1
DESeq analysis markdown.
This file is a markdown document that shows how critical aspects of the analysis described in this paper was performed. It is intended to provide transparency on how this was done from both a scientific and a methodological standpoint. We note that both this document, as well as all input data files necessary for reproducing this analysis are provided on the lab’s github page https://github.com/sblythe/Patternless_ATAC.
- https://cdn.elifesciences.org/articles/53916/elife-53916-code1-v1.zip
-
Supplementary file 1
Curated segmentation network CRMs.
CRMs with activity up to early germband extension stage and associated with segmentation network genes were obtained from the Redfly database. Some manual curation of this list was performed: large engrailed CRMs corresponding to two spatially separate ATAC regions (Supplementary file 2) were split and named accordingly (e.g. en_H was split into en_H1 and en_H2). In addition, a new CRM corresponding to the odd late interstripe enhancer (see Figure 6) was added to this listing.
- https://cdn.elifesciences.org/articles/53916/elife-53916-supp1-v1.txt
-
Supplementary file 2
Annotated ATAC-seq peaks list.
This file contains a tab-delimited table with 26328 rows (peaks) and 48 columns, plus one header row and one column of row numbers. In addition, descriptions of each column or set of columns are provided at the head of the document and are demarcated by the comment character [#]. In summary, the table contains the genomic locations of all identified ATAC peaks, plus outputs from the DESeq2 analysis for differential enrichment for all the comparisons described in the text. Groupings of differentially accessible sites (as described in Figure 4 and supplements) are represented in this table as logical vectors indicating membership in a group. Logical vectors are also provided to allow for cross-referencing with overlapping regions in the Opa ChIP-seq peaks list, as well as generic genomic features (intron, exon, et c.). Finally, a column with the number of Opa motifs per peak is provided.
- https://cdn.elifesciences.org/articles/53916/elife-53916-supp2-v1.txt
-
Supplementary file 3
Annotated Opa ChIP-seq peaks list.
This file contains a tab-delimited table with 879 rows (peaks) and 19 columns, plus one header row and one column of row numbers. In addition, descriptions of each column or set of columns are provided at the head of the document and are demarcated by the comment character [#]. In summary, the table contains the genomic locations of all IDR filtered Opa ChIP-seq peaks, plus outputs from DESeq2 analysis for differential accessibility as measured by ATAC-seq under conditions of loss- and gain- of function of Opa. The final column indicates the number of Opa motifs within each ChIP peak region.
- https://cdn.elifesciences.org/articles/53916/elife-53916-supp3-v1.txt
-
Transparent reporting form
- https://cdn.elifesciences.org/articles/53916/elife-53916-transrepform-v1.docx
Download links
A two-part list of links to download the article, or parts of the article, in various formats.
Downloads (link to download the article as PDF)
Open citations (links to open the citations from this article in various online reference manager services)
Cite this article (links to download the citations from this article in formats compatible with various reference manager tools)
Zygotic pioneer factor activity of Odd-paired/Zic is necessary for late function of the Drosophila segmentation network
eLife 9:e53916.
https://doi.org/10.7554/eLife.53916


