Single-molecule functional anatomy of endogenous HER2-HER3 heterodimers
- School of Biological Sciences and Institute for Molecular Biology and Genetics, Seoul National University, Republic of Korea
- Department of Physics, Korea Advanced Institute of Science and Technology (KAIST), Republic of Korea
- Proteina Co. Ltd., Republic of Korea
- Department of Bionanotechnology, Hanyang University, Republic of Korea
- Department of Biological Sciences, KAIST, Republic of Korea
Figures
Figure 1 with 1 supplement
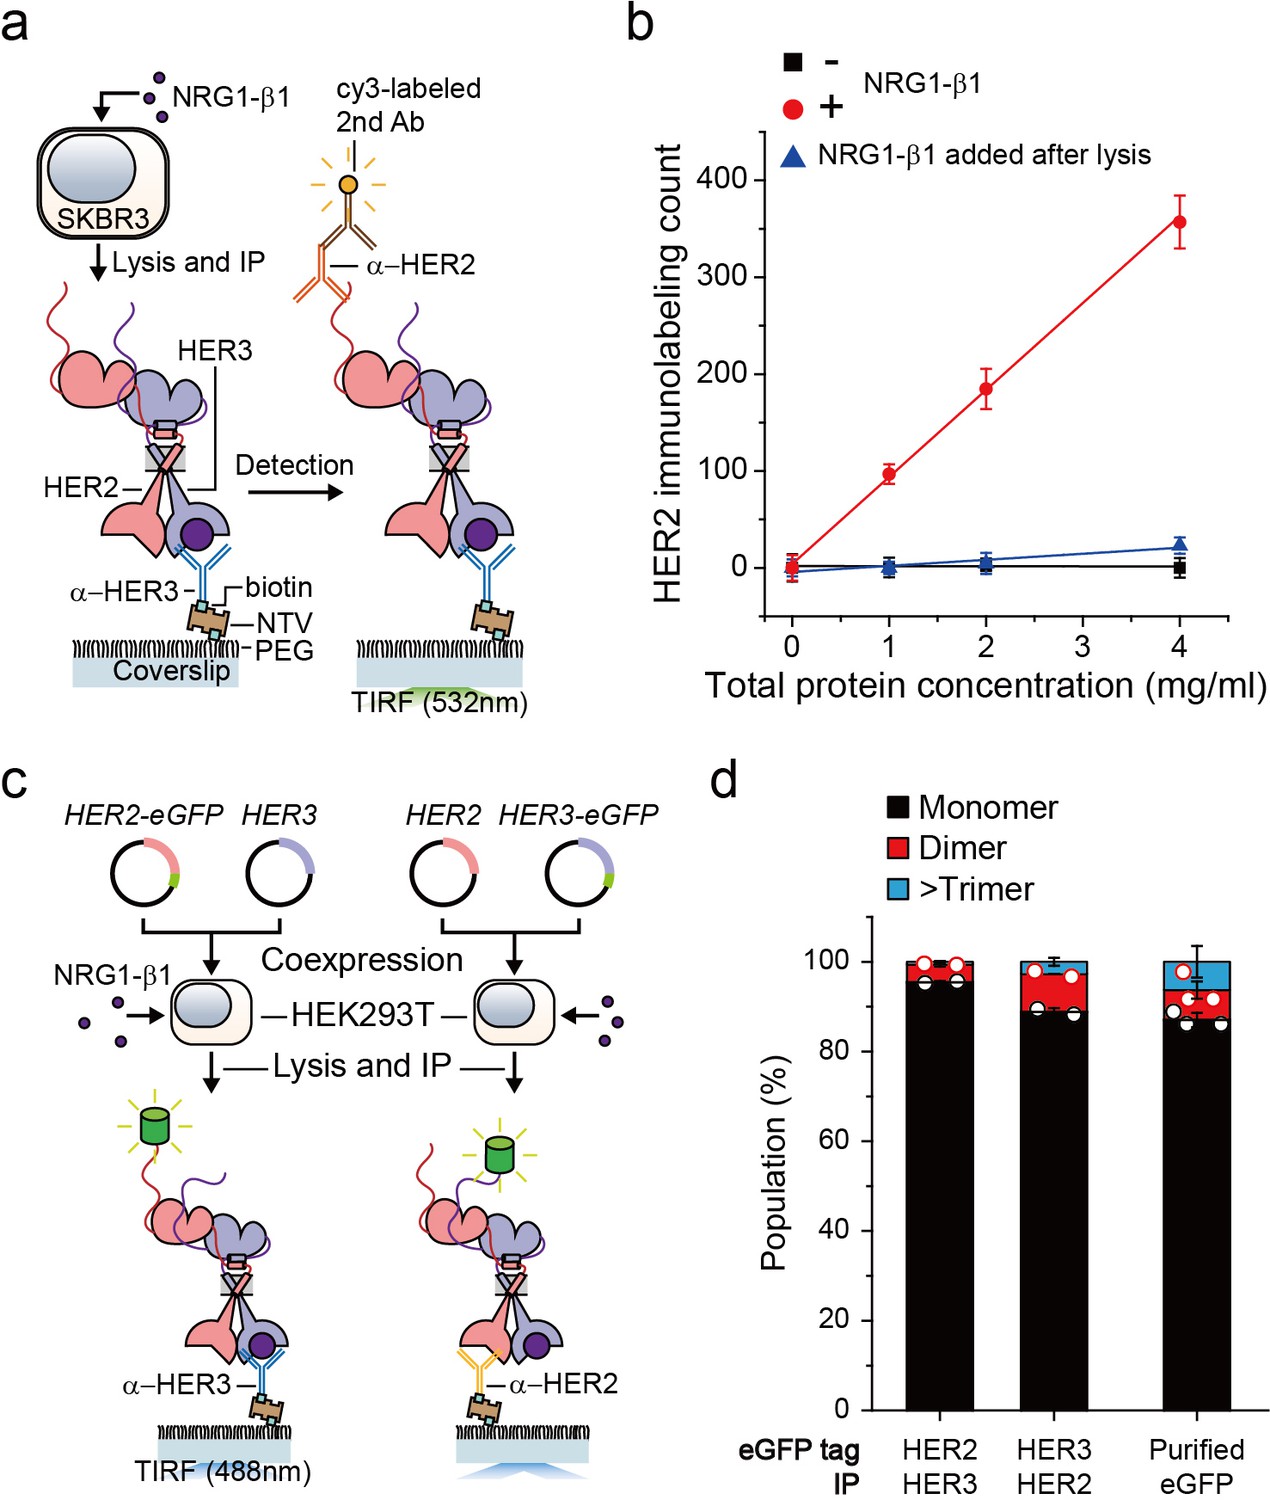
Single-molecule IP for HER2-HER3 heterodimers.
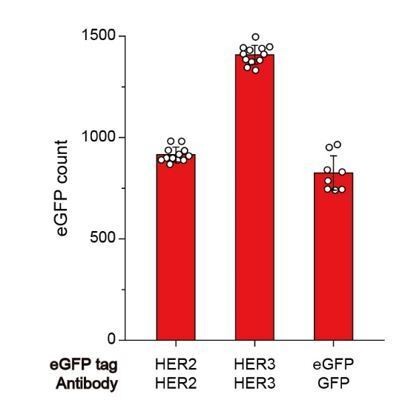
(a) Schematic of single-molecule IP for endogenous HER2-HER3 heterodimers. (b) Single-molecule immunolabeling counts of HER2 after HER3 IP from lysates of SKBR3 cells, untreated (square), NRG1-β1 treated during cell culture (circle) or NRG1-β1 treated after lysis (triangle). Data points were obtained from 10 different images (technical replicates; mean, SD) (c) Schematic for co-expression and IP of eGFP labeled HER2-HER3 heterodimers within HEK293T. (d) Determined the stoichiometry of HER2-HER3 heterocomplexes from HEK293T for indicated eGFP-tagging and IP conditions. HER3-HER2-eGFP heterodimer immunoprecipitated using an α-HER3 antibody (n = 275, 210), HER2-HER3-eGFP heterodimer immunoprecipitated using an α-HER2 antibody (n = 569, 578), eGFP immunoprecipitated using an α-GFP antibody (n = 45, 36, 36; same data were used in Figure 1—figure supplement 1c and Figure 3—figure supplement 1c).
-
Figure 1—source data 1
Source data for Figure 1d.
- https://cdn.elifesciences.org/articles/53934/elife-53934-fig1-data1-v3.xlsx
Figure 1—figure supplement 1
Stoichiometry and the number of immunoprecipitated HER2-HER3 heterodimer.
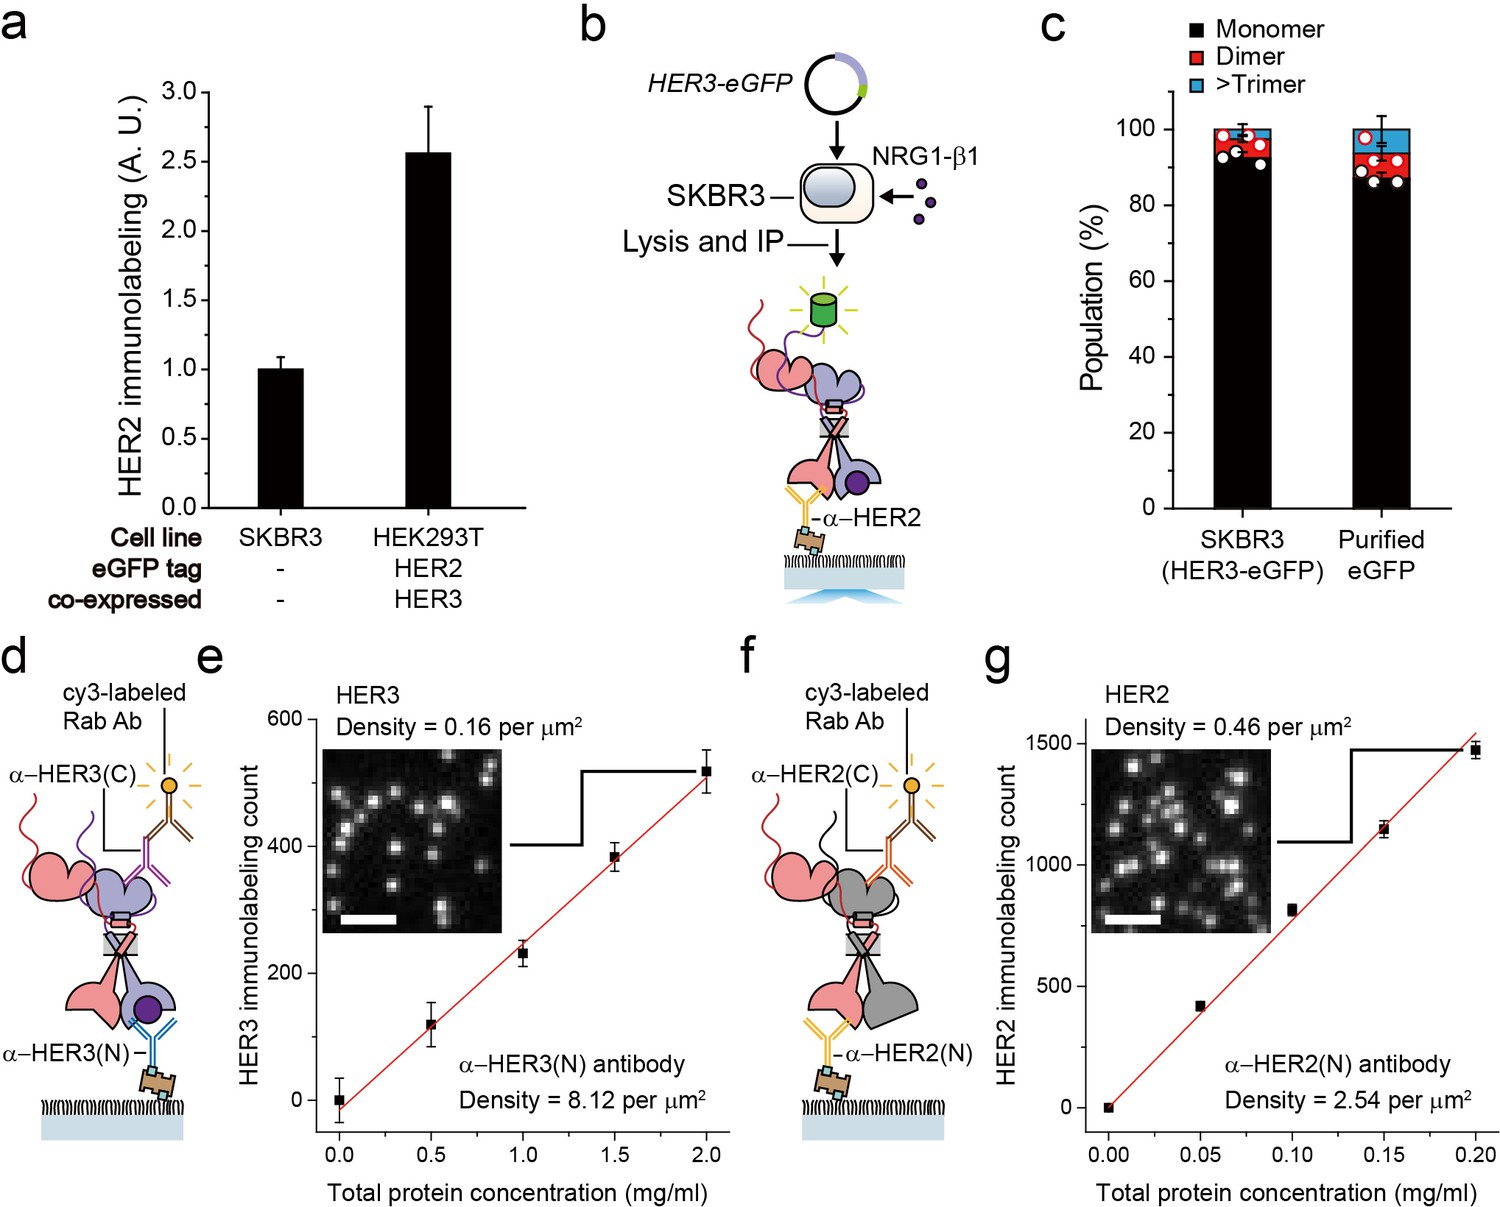
(a) HER2 expression level of SKBR3, and HER2-eGFP/HER3 (or HER2/HER3-eGFP) co-expressed HEK293T cell. HER2 is detected using HER2 antibody with cy3 labeled α-rabbit antibody, then fluorescence intensity was measured. Data points were obtained from 10 different images (technical replicates; mean, SD) (b) Schematic for expression and IP of HER2-HER3-eGFP heterocomplexes within SKBR3. (c) Monomer (black), dimer (red), and trimer (blue) populations from single-molecule fluorescence traces of eGFP. Fluorescence traces were obtained from recombinant eGFP immunoprecipitated using an α-GFP antibody (n = 45, 36, 36; same data were used in Figure 1d) or from HER3-eGFP immunoprecipitated using an α-HER2 antibody (n = 388, 400, 413). (d) Schematic for measurement of HER3 level after pull-down of HER2-HER3 heterodimer on PEG-coated surface. (e) Single-molecule immunolabeling counts of HER3 after HER3 IP from lysates of SKBR3 cells NRG1-β1 treated during cell culture. Data points were obtained from 10 different images (technical replicates; mean, SD). Sample image of single-molecule immunolabeling (inset; scale bar = 2 μm). (f) Schematic for measurement of HER2 level after pull-down of ligand-free HER2 complex on PEG-coated surface. (g) Single-molecule immunolabeling counts of HER2 after HER2 IP from lysates of SKBR3 cells serum-starved during cell culture. Data points were obtained from 10 different images (technical replicates; mean, SD). Sample image of single-molecule immunolabeling (inset; scale bar = 2 μm).
Figure 2 with 1 supplement
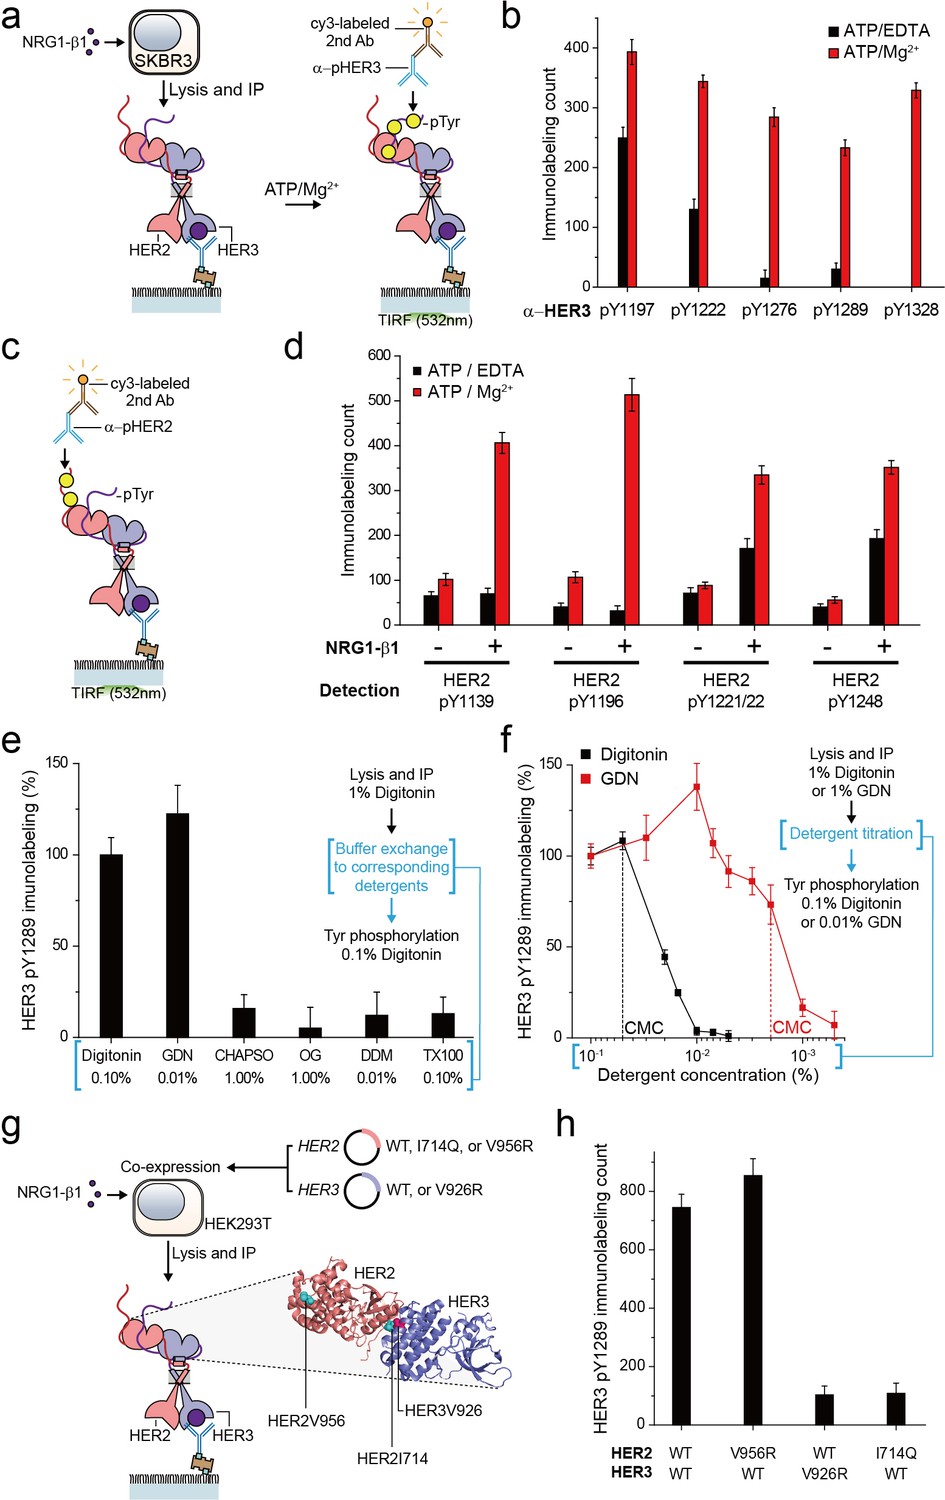
Immunoprecipitated single HER2-HER3 heterodimers preserve the tyrosine kinase activity.
(a) Schematic for the Tyr phosphorylation of immunoprecipitated HER2-HER3 heterodimers. (b) Single-molecule immunolabeling counts for specific pTyr residues of the immunoprecipitated HER2-HER3 heterodimers. Prior to surface IP of the heterodimers, the heterodimers were dephosphorylated with endogenous tyrosine phosphatases by not including phosphatase inhibitors in the lysis buffer. (c) Schematic for the HER2 pTyr immunolabeling after Tyr phosphorylation of HER2-HER3 heterodimers. (d) Phosphorylation of HER2 Tyr sites on HER2-HER3 heterodimer. Prior to surface IP of the heterodimers, the heterodimers were dephosphorylated with endogenous tyrosine phosphatases by not including phosphatase inhibitors in the lysis buffer. HER3 was immunoprecipitated from the lysates of SKBR3 cells treated (+) or untreated (-) with NRG1-β1. The number of phosphor-Tyr was measured using indicated pTyr-specific antibodies after phosphorylation. (e) Dependence of the Tyr phosphorylation activity of the HER2-HER3 heterodimer on the types of detergents used for functional reconstitution. The phosphorylation level with digitonin is considered as 100% activity (mean, SD). (f) Detailed titration of the digitonin and GDN concentrations and its effect on the HER2-HER3 heterodimer Tyr kinase activity. Phosphorylation level at 0.1% for each detergent is considered as 100% activity (mean, SD). (g) Schematic for the immunoprecipitation of key point mutation-bearing HER2-HER3 heterodimers. (h) Increase of HER3 pTyr1289 level after adding ATP and Mg2 + to HER2-HER3 heterodimers which bear key point mutations. All data points and bar graphs were obtained from 10 different images (technical replicates; mean, SD).
-
Figure 2—source data 1
Source data for Figure 2b, d, e and h.
- https://cdn.elifesciences.org/articles/53934/elife-53934-fig2-data1-v3.xlsx
Figure 2—figure supplement 1
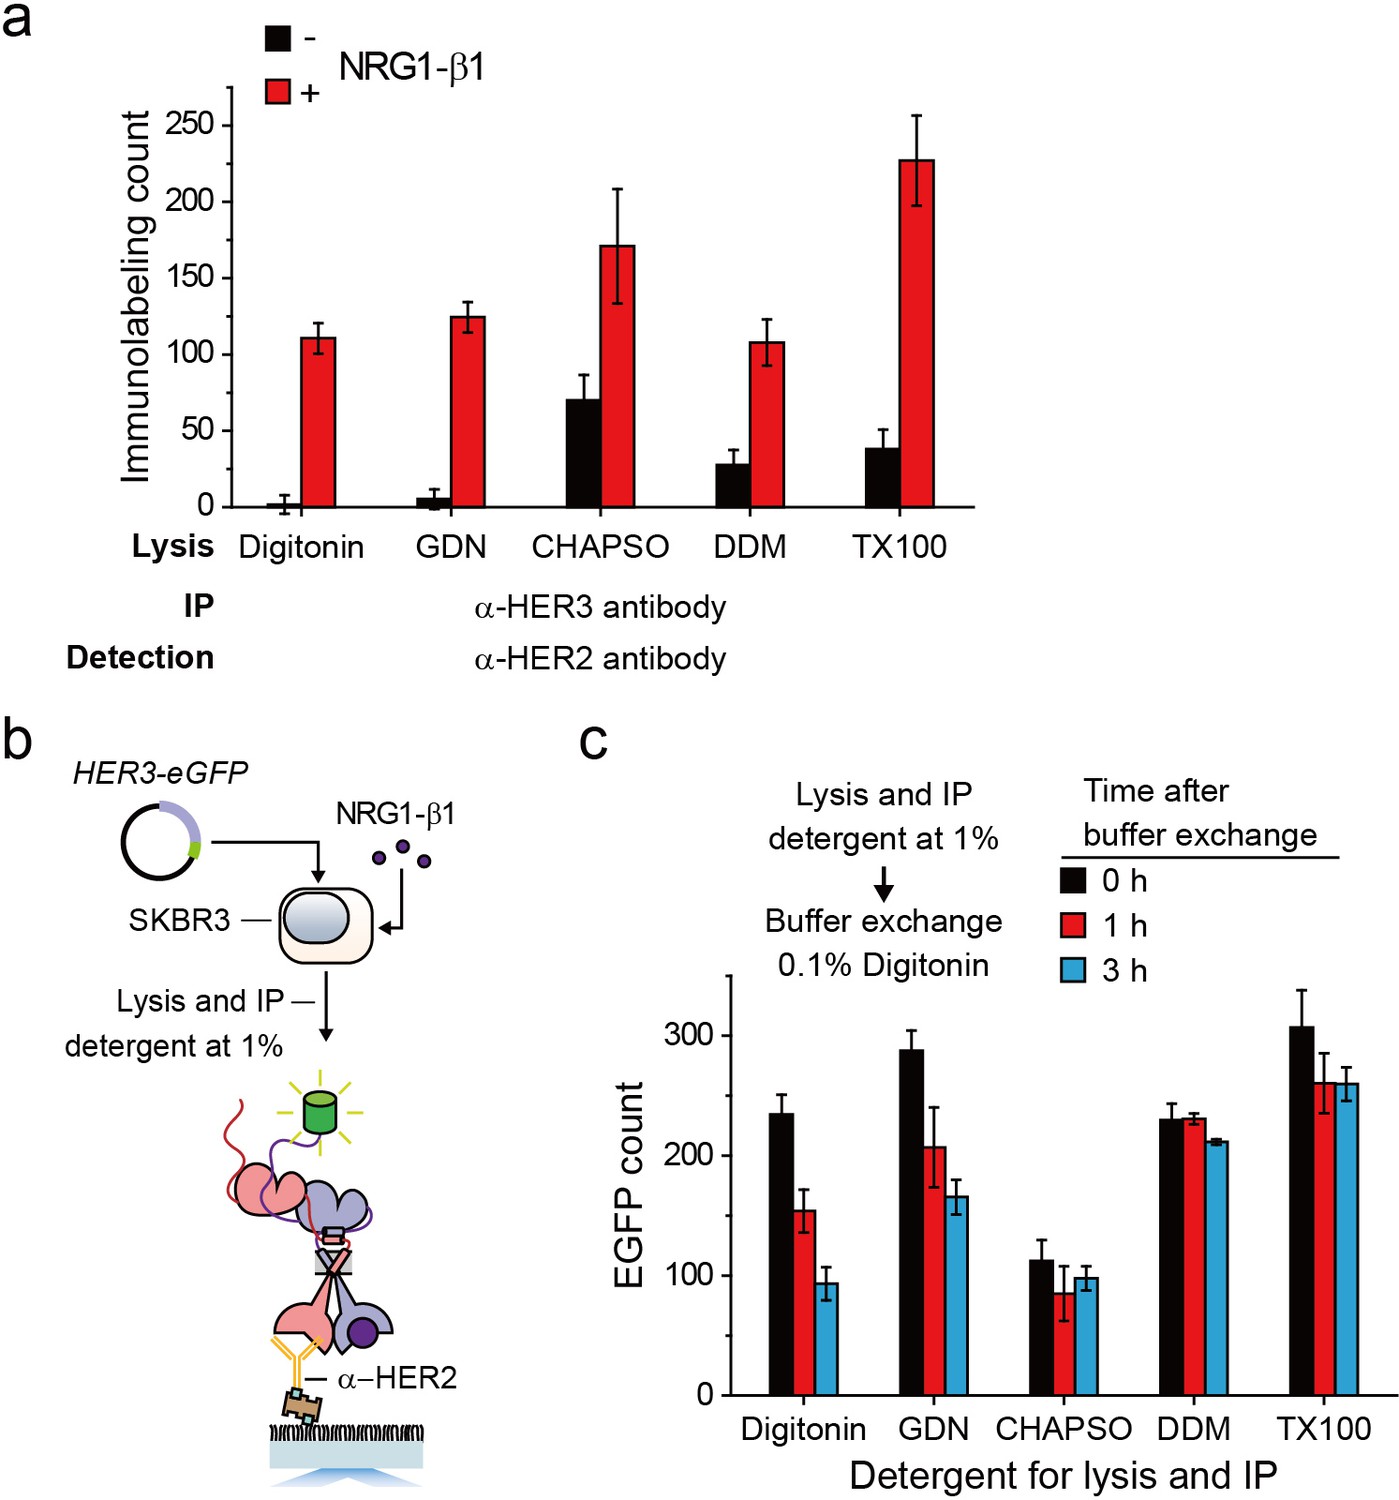
Immunoprecipitation of HER2-HER3 heterodimer within various detergent species.
(a) Single-molecule immunolabeling counts of HER2 after HER3 IP from lysates of SKBR3 cells, untreated (-), NRG1-β1 treated during cell culture (+). The SKBR3 cells were lysed in stated detergents. (b) Schematic for extraction and IP of HER2-HER3-eGFP heterodimer expressed within SKBR3. (c) The amount of HER2-HER3-eGFP heterodimers was measured as increasing the time after immunoprecipitation at various detergent condition. All data points were obtained from 10 different images (technical replicates; mean, SD).
Figure 3 with 1 supplement
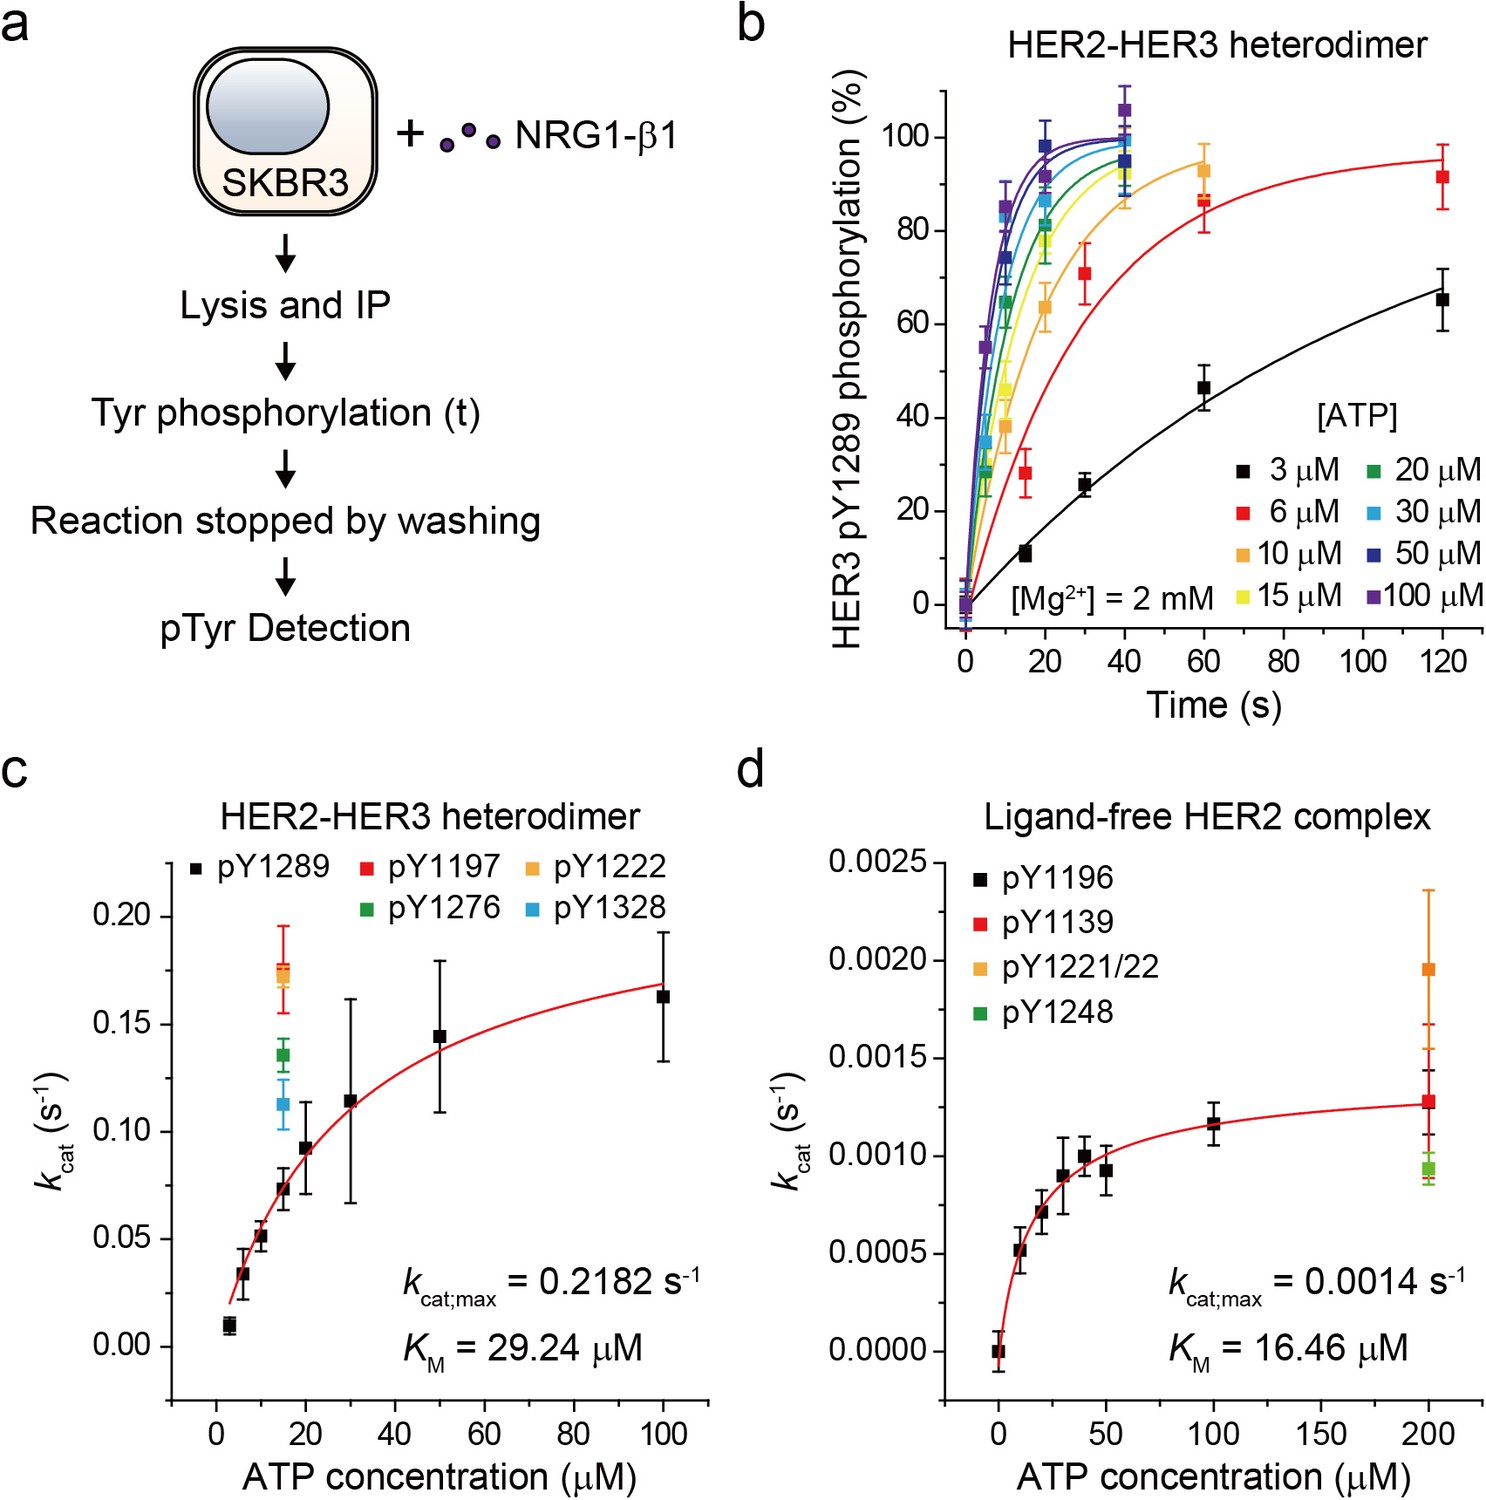
Single-molecule kinetic and conformational analysis of the immunoprecipitated HER2-HER3 heterodimer.
(a) Schematic for catalytic rate measurements of HER2-HER3 heterodimer (b) The amount of HER3 pTyr1289 measured as an increasing reaction time for phosphorylation with indicated concentration of ATP and Mg2+. Each curve was normalized by the expected maximum number of pTyr1289 calculated by extrapolating an exponential fit. (c) Michaelis-Menten curve for HER2-HER3 heterodimers. Each catalytic rate was obtained from the measurements in (b). At 15 μM ATP, the catalytic rates for HER3 pTyr1197 (red), 1222 (orange), 1276 (green), and 1328 (blue) were independently measured. (d) Michaelis-Menten curve for ligand-free HER2 complexes. All data points were obtained from 10 different images (technical replicates; mean, SD).
-
Figure 3—source data 1
Source data for Figure 3c and d.
- https://cdn.elifesciences.org/articles/53934/elife-53934-fig3-data1-v3.xlsx
Figure 3—figure supplement 1
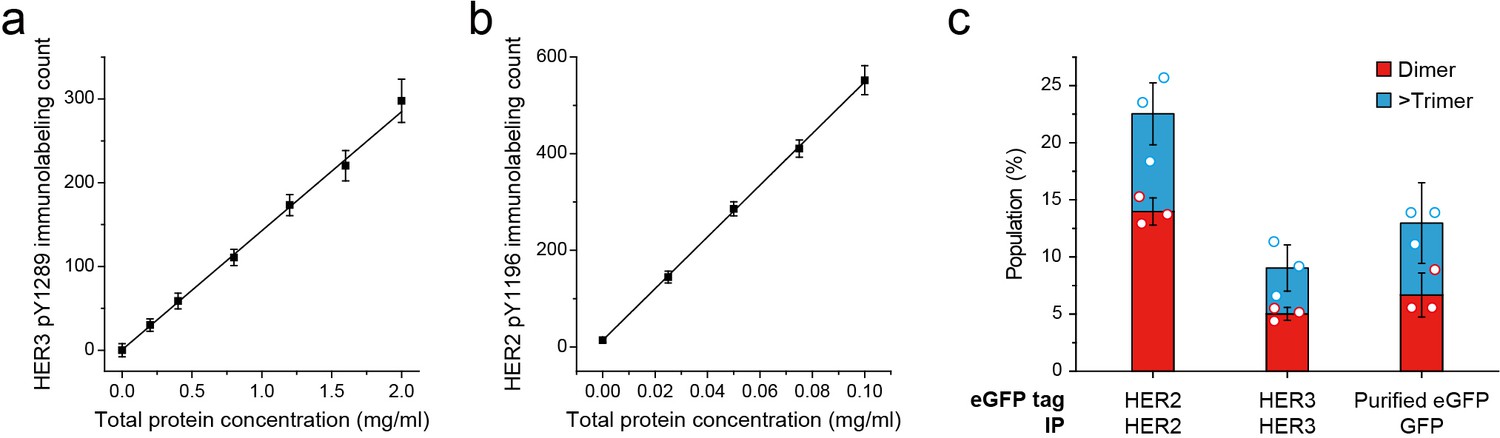
Linearity of pTyr immunolabeling and stoichiometry of HER2-eGFP ligand free complex.
(a) Single-molecule immunolabeling of HER3 pTyr1289 after IP of HER3 from SKBR3 (NRG1-β1 treated during cell culture). Data points were obtained from 10 different images (technical replicates; mean, SD). (b) After IP of HER2 from SKBR3 (starved), in vitro phosphorylation was proceeded for 10 min (200 μM ATP, 10 mM Mg2+). Then single-molecule immunolabeling of HER2 pTyr1196 was measured. Data points were obtained from 10 different images (technical replicates; mean, SD). (c) Stoichiometry of overexpressed HER2-eGFP. Dimer (red), and trimer (blue) populations were obtained from eGFP single-molecule fluorescence traces. Fluorescence traces were obtained from HER2-eGFP-expressing HEK293T lysate (n = 147, 153, 144), HER3-eGFP-expressing HEK293T lysate (n = 91, 97, 109), and recombinant eGFP (n = 45, 36, 36; same data were used in Figure 1d).
Figure 4 with 1 supplement
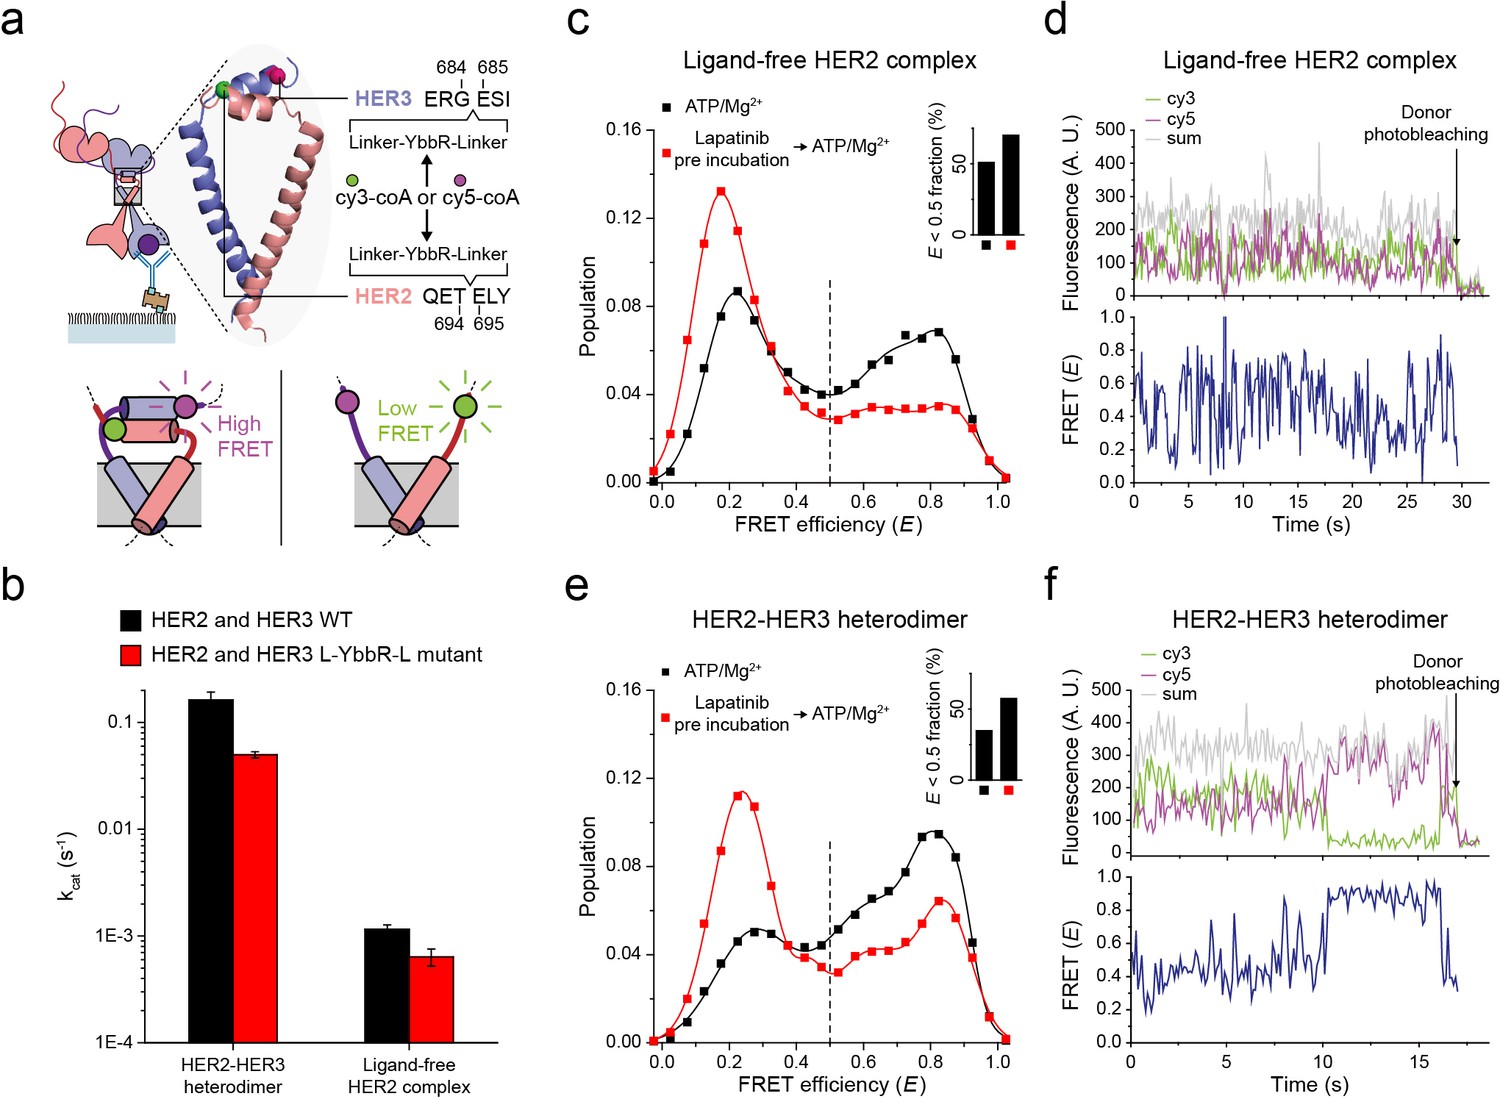
Structural investigation of HER2 complexes using single-molecule FRET.
(a) Schematic for labeling HER2-HER3 heterodimers with fluorescent dyes. For specific labeling, a YbbR sequence was inserted between juxta-membrane-A and juxta-membrane B with an appropriate linker. Cy3 or Cy5 was randomly attached to the YbbR sequence afterward. (b) The catalytic rates of the WT and YbbR-inserted HER2-HER3 heterodimer and ligand-free HER2 complex) (fitting result, SE). (c) Distribution of FRET efficiency from fluorescence-labeled ligand-free HER2 complex. The ligand-free complexes were either untreated (black, n = 208) or pre-treated with lapatinib (red, n = 231) before being imaged after adding ATP and Mg2+. (d) Fluorescence trace from ligand-free HER2 complex labeled with both Cy3 and Cy5. (e) Distribution of FRET efficiency from fluorescence-labeled HER2-HER3 heterodimer. The heterodimers were either untreated (black, n = 281) or pre-treated with lapatinib (red, n = 218) before being imaged after adding ATP and Mg2+. (f) Fluorescence trace from HER2-HER3 heterodimers labeled with both Cy3 and Cy5. See Materials and methods.
Figure 4—figure supplement 1
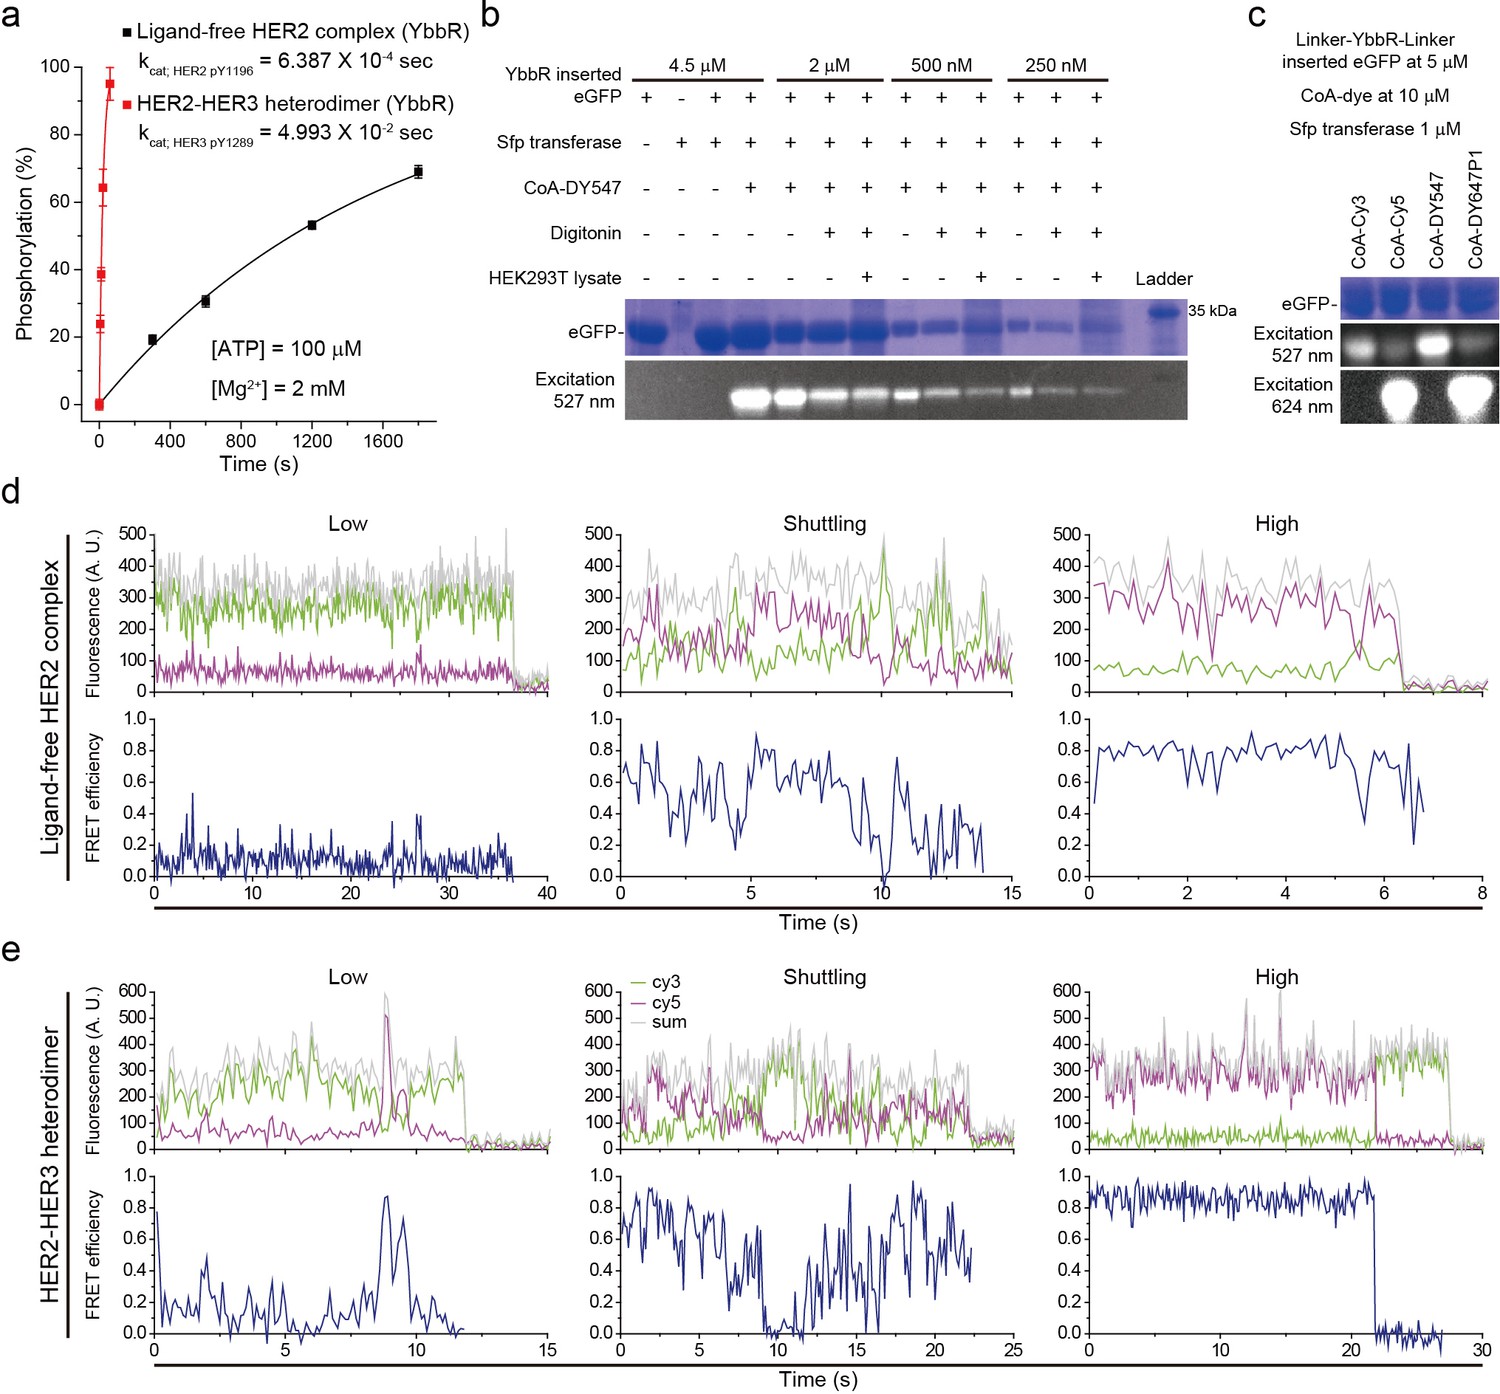
Catalytic rate of YbbR tagged HER2 complexes and their representative fluorescence traces.
Figure 5 with 1 supplement
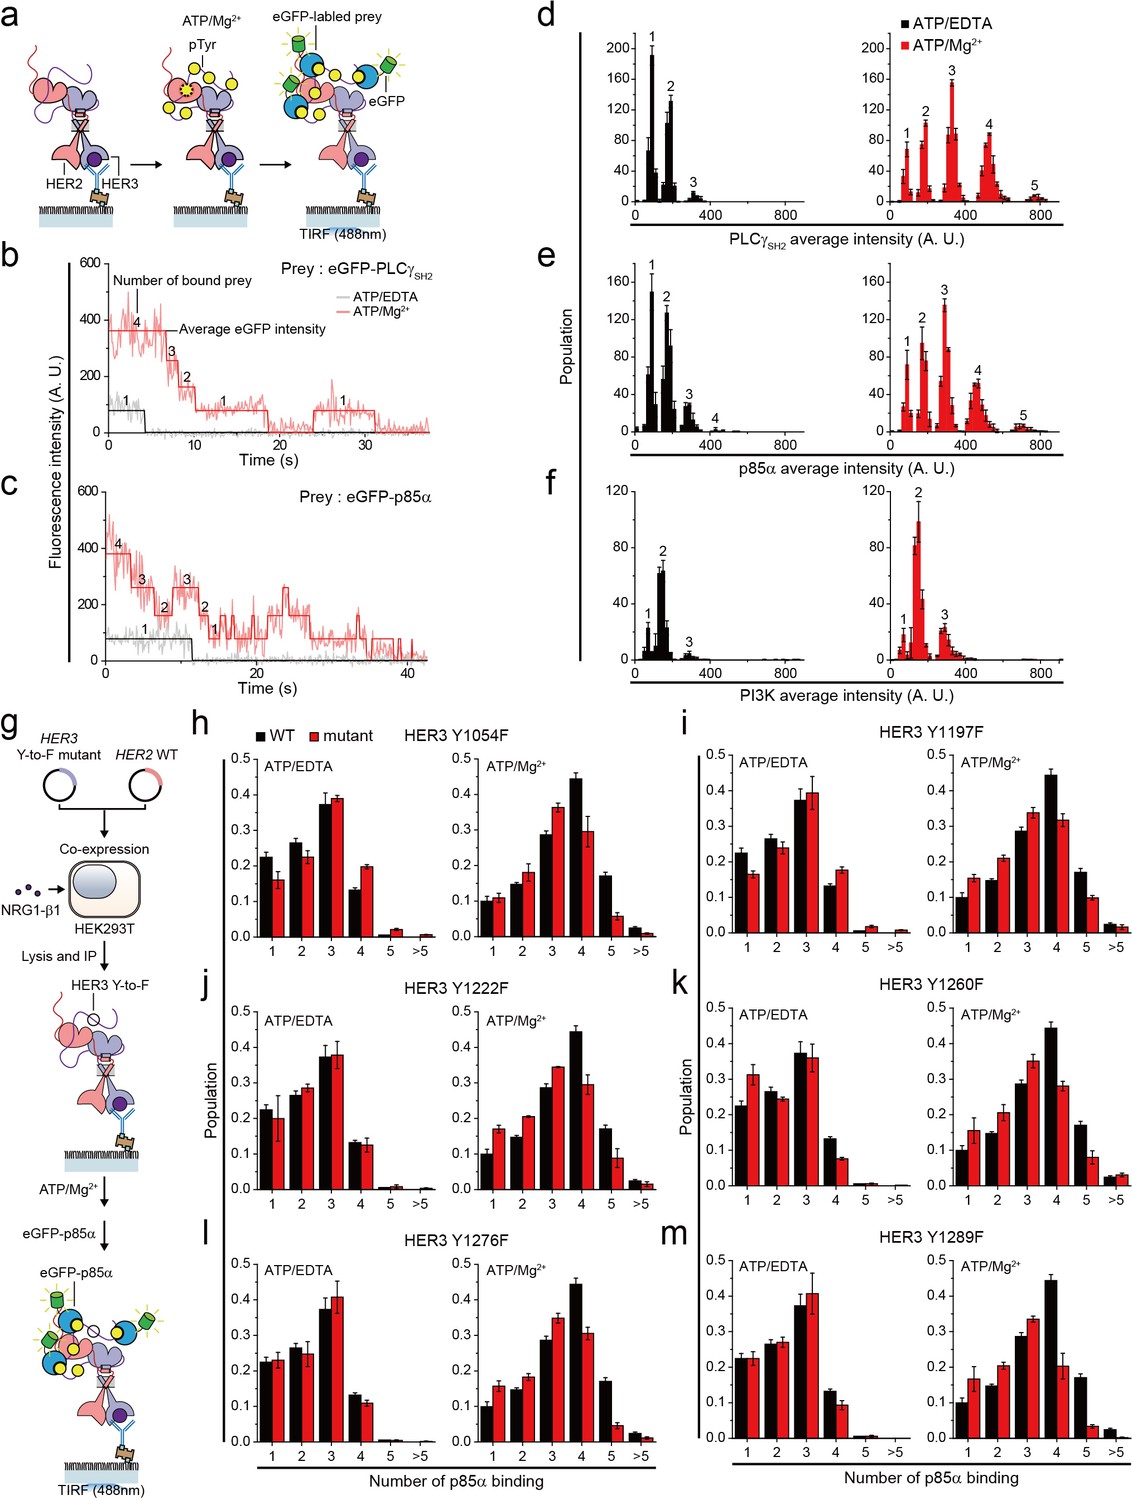
Single HER2-HER3 heterodimers interact with multiple copies of downstream interactors.
(a) Schematic for single-molecule co-IP imaging after reconstituted HER2-HER3 heterodimer phosphorylation. (b, c) Fluorescence traces of single PPI complexes between eGFP-labeled preys (PLCγSH2 or p85α) and phosphorylated (red) or unphosphorylated (black) HER2-HER3 heterodimers. Number of eGFPs within each PPI complex is indicated. (d–f) Distribution of average intensity from the maximum step (see b) from PPI complexes consisting of eGFP-labeled preys (PLCγSH2, p85a, or PI3K) and HER2-HER3 heterodimers. Counted number of eGFP-preys bound to HER2-HER3 heterodimers is indicated at the top of peak. The result is average of 3 distribution group and each group consists of hundreds traces (PLCγSH2, ATP+EDTA; n = 612, 651, 616, ATD+Mg2+; n = 1087, 1085, 1046/p85α, ATP+EDTA; n = 649, 592, 695, ATD+Mg2+; n = 899, 910, 871/PI3K, ATP+EDTA; n = 481, 476, 529, ATD+Mg2+; n = 726, 782, 863). Population was calibrated by used concentration of SKBR3 lysate (technical replicates; mean, SD). (g) Schematics for HER2-HER3 heterodimers which bear indicated Tyr to Phe point mutations. (h–m) Population of the maximum step from PPI complexes consisting of eGFP-labeled p85α and HER2-HER3 heterodimers which bear indicated point mutations. The result is average of 3 distribution group and each group consists of hundreds traces (Y1054F, ATP+EDTA; n = 649, 592, 695, ATP+Mg2+; n = 899, 910, 871/Y1197F, ATP+EDTA; n = 649, 592, 695, ATP+Mg2+; n = 899, 910, 871/Y1222F, ATP+EDTA; n = 649, 592, 695, ATP+Mg2+; n = 899, 910, 871/Y1260F, ATP+EDTA; n = 649, 592, 695, ATP+Mg2+; n = 899, 910, 871/Y1276F, ATP+EDTA; n = 649, 592, 695, ATP+Mg2+; n = 899, 910, 871/Y1289F, ATP+EDTA; n = 649, 592, 695, ATP+Mg2+; n = 899, 910, 871). Population was calibrated by average number of traces for each ATP+EDTA condition (technical replicates; mean, SD).
Figure 5—figure supplement 1
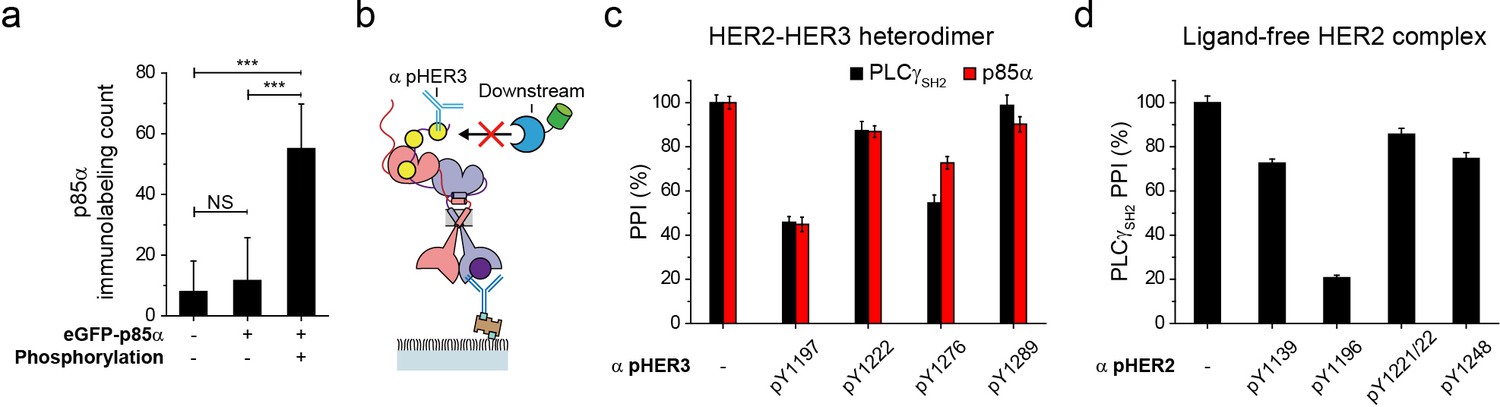
p85α immunolabeling and PPI inhibition by pTyr antibody binding.
(a) The number of co-precipitated p85α after HER3 immunoprecipitation from lysates of SKBR3 was measured using p85α antibody. The number of p85α after adding eGFP labeled p85α were measured in the same way before and after phosphorylation. (b) Schematic for PPI blocking after adding pTyr-specific antibodies. (c, d) Blocking of PPI between p85α (or PLCγSH2) and immunoprecipitated and phosphorylated HER2-HER3 heterodimers and ligand-free HER2 complexes after adding indicated antibodies. Fluorescence intensity was measured to reflect multiple binding on a single complex instead of counting. PPI without antibody is considered as 100%. All data points were obtained from 10 different images (technical replicates; mean, SD).
Figure 6 with 1 supplement
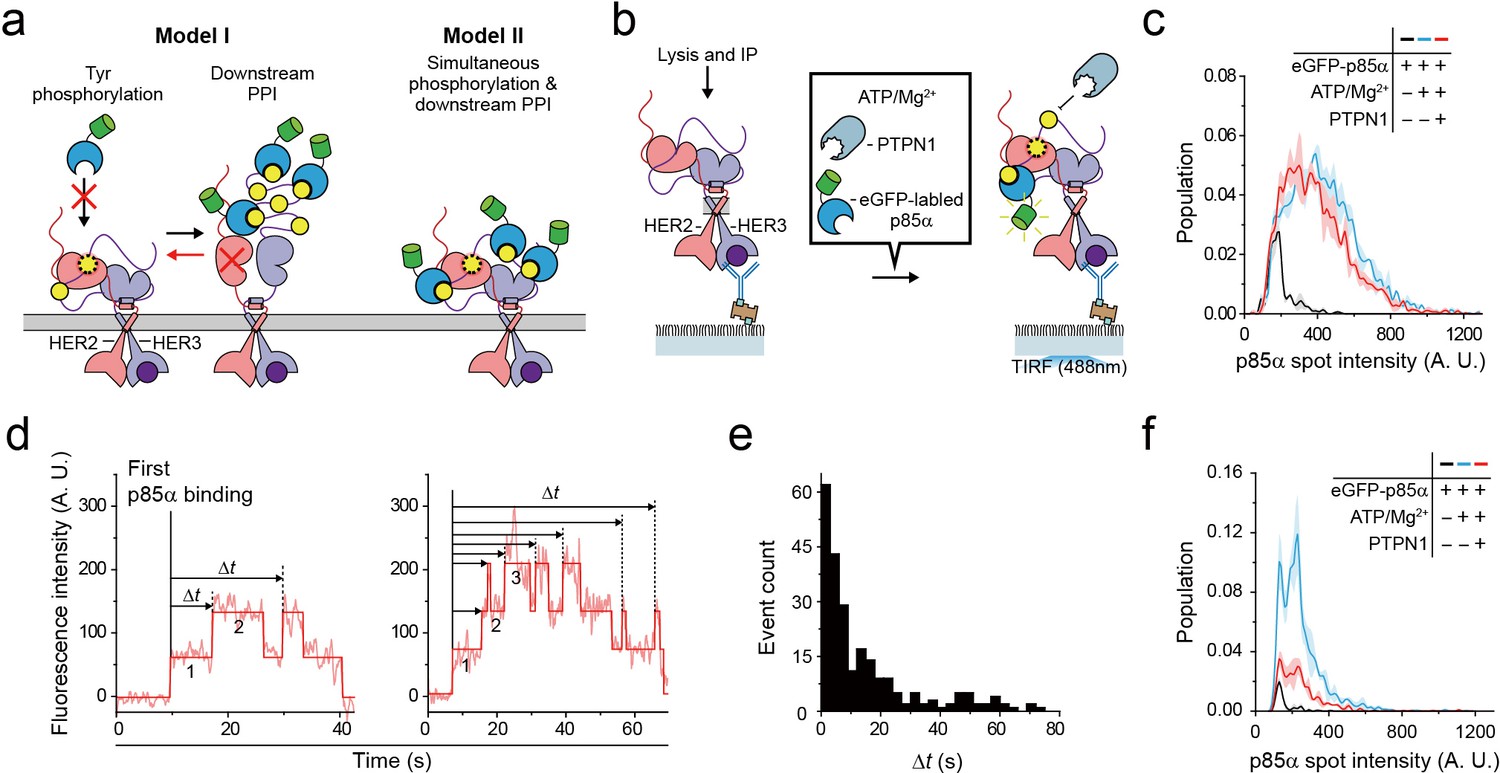
Single HER2-HER3 heterodimers simultaneously carry out Tyr phosphorylation and downstream PPIs.
(a) Two models. Model I: PPIs permitted after tyrosine phosphorylation. Model II: both processes occur simultaneously. (b) Schematic for the all-in-one reaction. PTPN1, eGFP-p85α, and ATP / Mg2+ were added to immunoprecipitated HER2-HER3 heterodimers. (c) Distribution of fluorescence intensity from single PPI complexes with eGFP-p85α under the indicated conditions (HER2-HER3 heterodimers). Images were recorded from the injection of reactants (i.e., eGFP-p85α, ATP, Mg2+, and PTPN1). Maximum intensities were collected from individual fluorescence traces (black; n = 156, 155, 199/blue; n = 1139, 1187, 1169/red; n = 991, 1029, 1064). (d) Fluorescence traces from the all-in-one reaction. The number of bound eGFP-p85α are indicated. Dwell times from the first binding of eGFP-p85α (indicated vertical line) to additional binding events (dotted vertical lines) were collected until there were no remaining eGFP-p85α bound to HER2-HER3 heterodimers (until photobleaching). (e) Population of collected dwell time at (d). n = 34 individual single-molecule traces were used. (f) Distribution of fluorescence intensity from PPI complexes with eGFP-p85α under the indicated conditions (ligand-free HER2 complexes). Images were recorded from the injection of reactants (black; n = 41, 36, 39/blue; n = 648, 753, 788/red; n = 233, 205, 227).
Figure 6—figure supplement 1
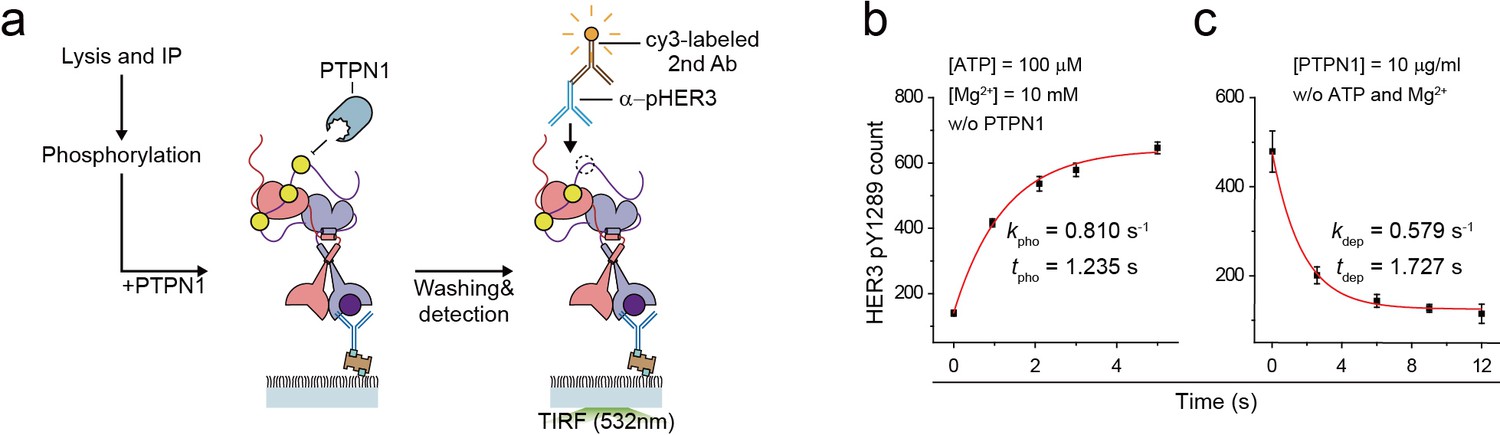
Catalytic rate of HER2-HER3 heterodimer and PTPN1.
(a) Schematics for PTPN1 dephosphorylation of HER2-HER3 heterodimer after phosphorylation. (b) HER3 pTyr1289 phosphorylation induced by HER2-HER3 heterodimers was measured with increasing reaction time. (c) HER3 pTyr1289 dephosphorylation by PTPN1 was measured with increasing reaction time. PTPN1 was added to immunoprecipitated HER2-HER3 heterodimers after the heterodimers were fully phosphorylated. All data points were obtained from 10 different images (technical replicates; mean, SD).
Figure 7

The high catalytic rate of the HER2-HER3 heterodimer is pivotal to its lapatinib resistance.
(a) Schematics for inhibition of HER2-HER3 heterodimer with lapatinib under increasing concentration of PTPN1. (b, c) Lapatinib inhibition curves for HER2-HER3 heterodimers (b) and ligand-free HER2 complexes (c) obtained with increasing concentrations of PTPN1. Lapatinib, PTPN1, ATP and Mg2+ were applied simultaneously. All data points and bar graphs were obtained from 10 different images (technical replicates; mean, SD).
Author response image 1
Immunoprecipitation of HER2 (at 1 nM), HER3 (at 1 nM), and eGFP (at 10 pM) using each HER2, HER3, and GFP antibodies.
Additional files
-
Supplementary file 1
Key Resources Table.
- https://cdn.elifesciences.org/articles/53934/elife-53934-supp1-v3.docx
-
Transparent reporting form
- https://cdn.elifesciences.org/articles/53934/elife-53934-transrepform-v3.docx
Download links
A two-part list of links to download the article, or parts of the article, in various formats.
Downloads (link to download the article as PDF)
Open citations (links to open the citations from this article in various online reference manager services)
Cite this article (links to download the citations from this article in formats compatible with various reference manager tools)
Single-molecule functional anatomy of endogenous HER2-HER3 heterodimers
eLife 9:e53934.
https://doi.org/10.7554/eLife.53934


