AMPAR/TARP stoichiometry differentially modulates channel properties
- Laboratori de Neurofisiologia, Departament de Biomedicina, Facultat de Medicina i Ciències de la Salut, Institut de Neurociències, Universitat de Barcelona, Spain
- Institut d'Investigacions Biomèdiques August Pi i Sunyer (IDIBAPS), Spain
Figures
Figure 1

CP-AMPAR kinetics are differentially affected by AMPAR-TARP stoichiometry.
(A) Traces evoked at −60 mV by rapid application of 10 mM glutamate to outside-out patches from cells expressing GluA1 alone (black; average of 39 responses) or together with 2 (blue; average of 37 responses) or 4 (red; average of 67 responses) γ2 subunits. (B) Pooled data of the weighted time constant of desensitization (τw, des). Box-and-whisker plots indicate the median value (gray line), the 25–75th percentiles (box), and the 10–90th percentiles (whiskers); crosses and open circles represent mean and the individual experimental values respectively. (C) Pooled data showing the increase in the steady state current only in 4 TARPed CP-AMPARs. (D) Rise time of glutamate-activated currents is not affected by TARPs. The data from this figure containing statistical tests applied, exact sample number, p values and details of replicates are available in ‘Figure 1—source data 1'.
-
Figure 1—source data 1
Kinetic properties of CP-AMPARs.
- https://cdn.elifesciences.org/articles/53946/elife-53946-fig1-data1-v4.xlsx
Figure 2
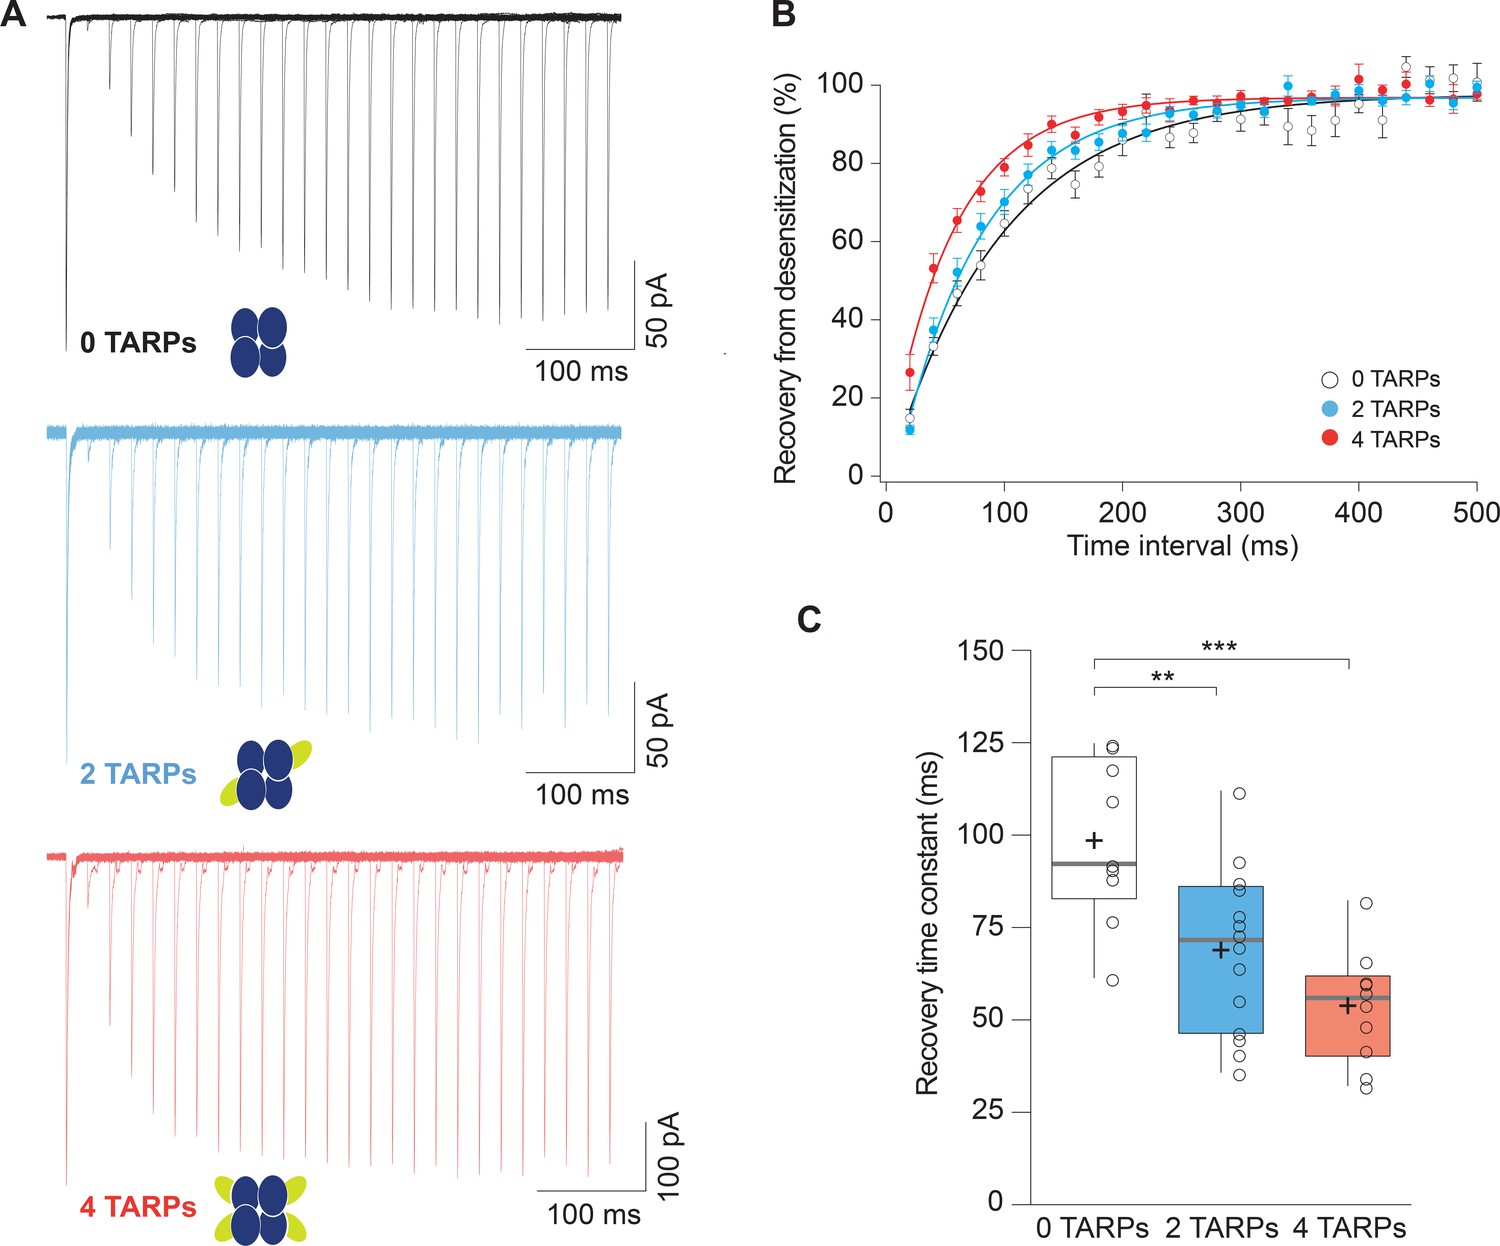
Recovery from desensitization of CP-AMPARs is enhanced in a graded manner with increased γ2.
(A) Representative traces of a two-pulse protocol with increasing time interval between pulses for CP-AMPAR without γ2 TARP (GluA1 homomers; black), with 2 γ2 TARPs (blue) and with 4 γ2 TARPs (red). (B) Recovery from desensitization dynamics where it can be observed a gradual diminishment in the time needed to recover as the number of γ2 increases. (C) Recovery time constant values for the experiments showed in A and B. The data from this figure containing statistical tests applied, exact sample number, p values and details of replicates are available in ‘Figure 2—source data 1'.
-
Figure 2—source data 1
Recovery from desensitization of CP-AMPARs.
- https://cdn.elifesciences.org/articles/53946/elife-53946-fig2-data1-v4.xlsx
Figure 3

CP-AMPAR polyamine block attenuation is dependent on TARP dosage.
(A) Representative glutamate-evoked currents from outside-out patches at different membrane potentials from −80 to +80 in 20 mV increments from cells expressing CP-AMPARs, GluA1 (black), GluA1+GluA1: γ2 (blue) and GluA1: γ2 (red). Bottom: Traces at +60 mV and −60 mV membrane potentials are marked. (B) I-V relationships constructed from glutamate-evoked peak currents of patches held at different membrane potentials in different AMPAR-TARP stoichiometries. (C) Pooled data showing an increase in the RI as the number of TARPs per CP-AMPAR increases. The RI in 2 (blue) and 4 (red, 4 TARPed) TARPs per CP-AMPAR complex is higher compared with 0 TARPs (white, TARPless). Box-and-whiskers plots meaning as in Figure 1. The data from this figure containing statistical tests applied, exact sample number, p values and details of replicates are available in ‘Figure 3—source data 1'.
-
Figure 3—source data 1
Polyamine block attenuation of CP-AMPARs.
- https://cdn.elifesciences.org/articles/53946/elife-53946-fig3-data1-v4.xlsx
Figure 4 with 1 supplement
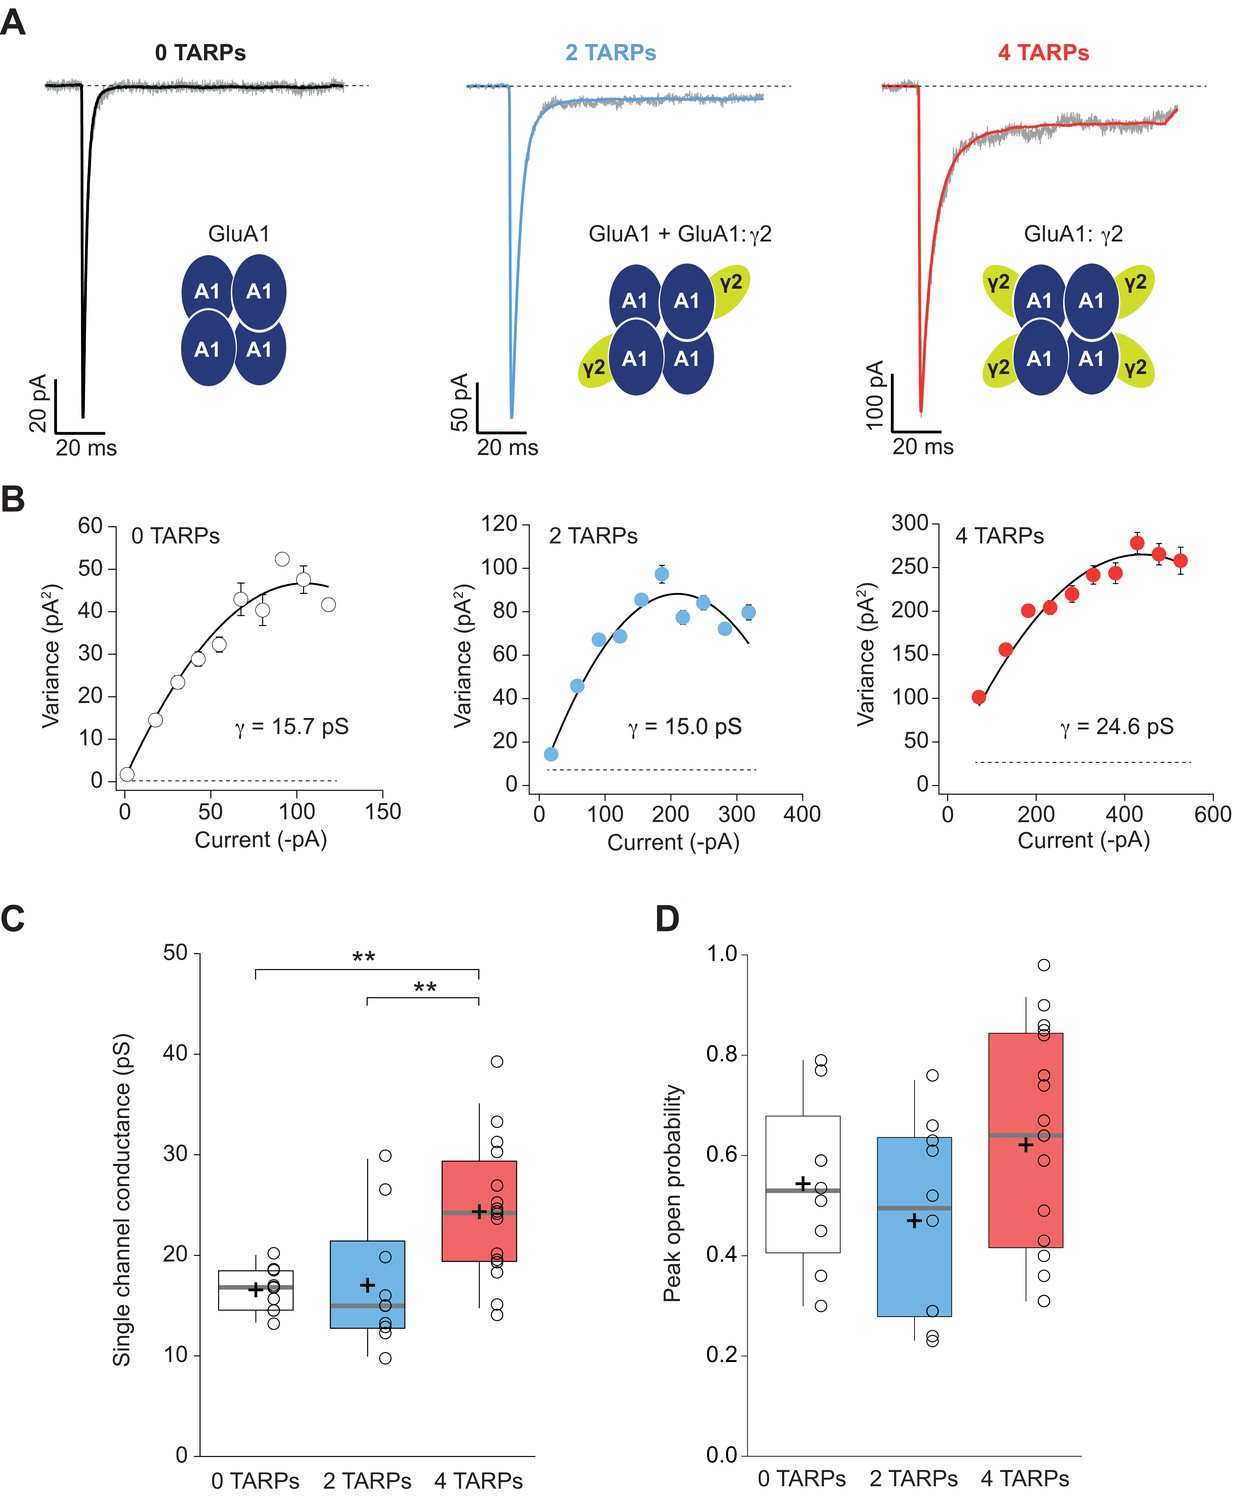
Four TARPs are required to increase CP-AMPAR channel conductance.
(A) Typical responses at a holding potential of −60 mV to rapid application of 10 mM glutamate to excised patches from cells expressing homomeric GluA1 alone (black; average of 84 responses) or together with 2 (blue; average of 91 responses) or 4 (red; average of 223 responses) γ2 subunits. A single trace is shown in gray overlaid with the mean response. (B) Current-variance plots for the traces shown in A, the slope of which gave the weighted single-channel conductance. Broken lines show the baseline variance and error bars denote SEM. Single channel conductance values for these recordings are presented. (C) Pooled data showing an increase of the single channel conductance only in a full-TARPed CP-AMPAR. (D) Pooled data for peak open probability of CP-AMPARs. The data from this figure containing statistical tests applied, exact sample number, p values and details of replicates are available in ‘Figure 4—source data 1'.
-
Figure 4—source data 1
Channel conductance of CP-AMPARs.
- https://cdn.elifesciences.org/articles/53946/elife-53946-fig4-data1-v4.xlsx.xlsx
Figure 4—figure supplement 1
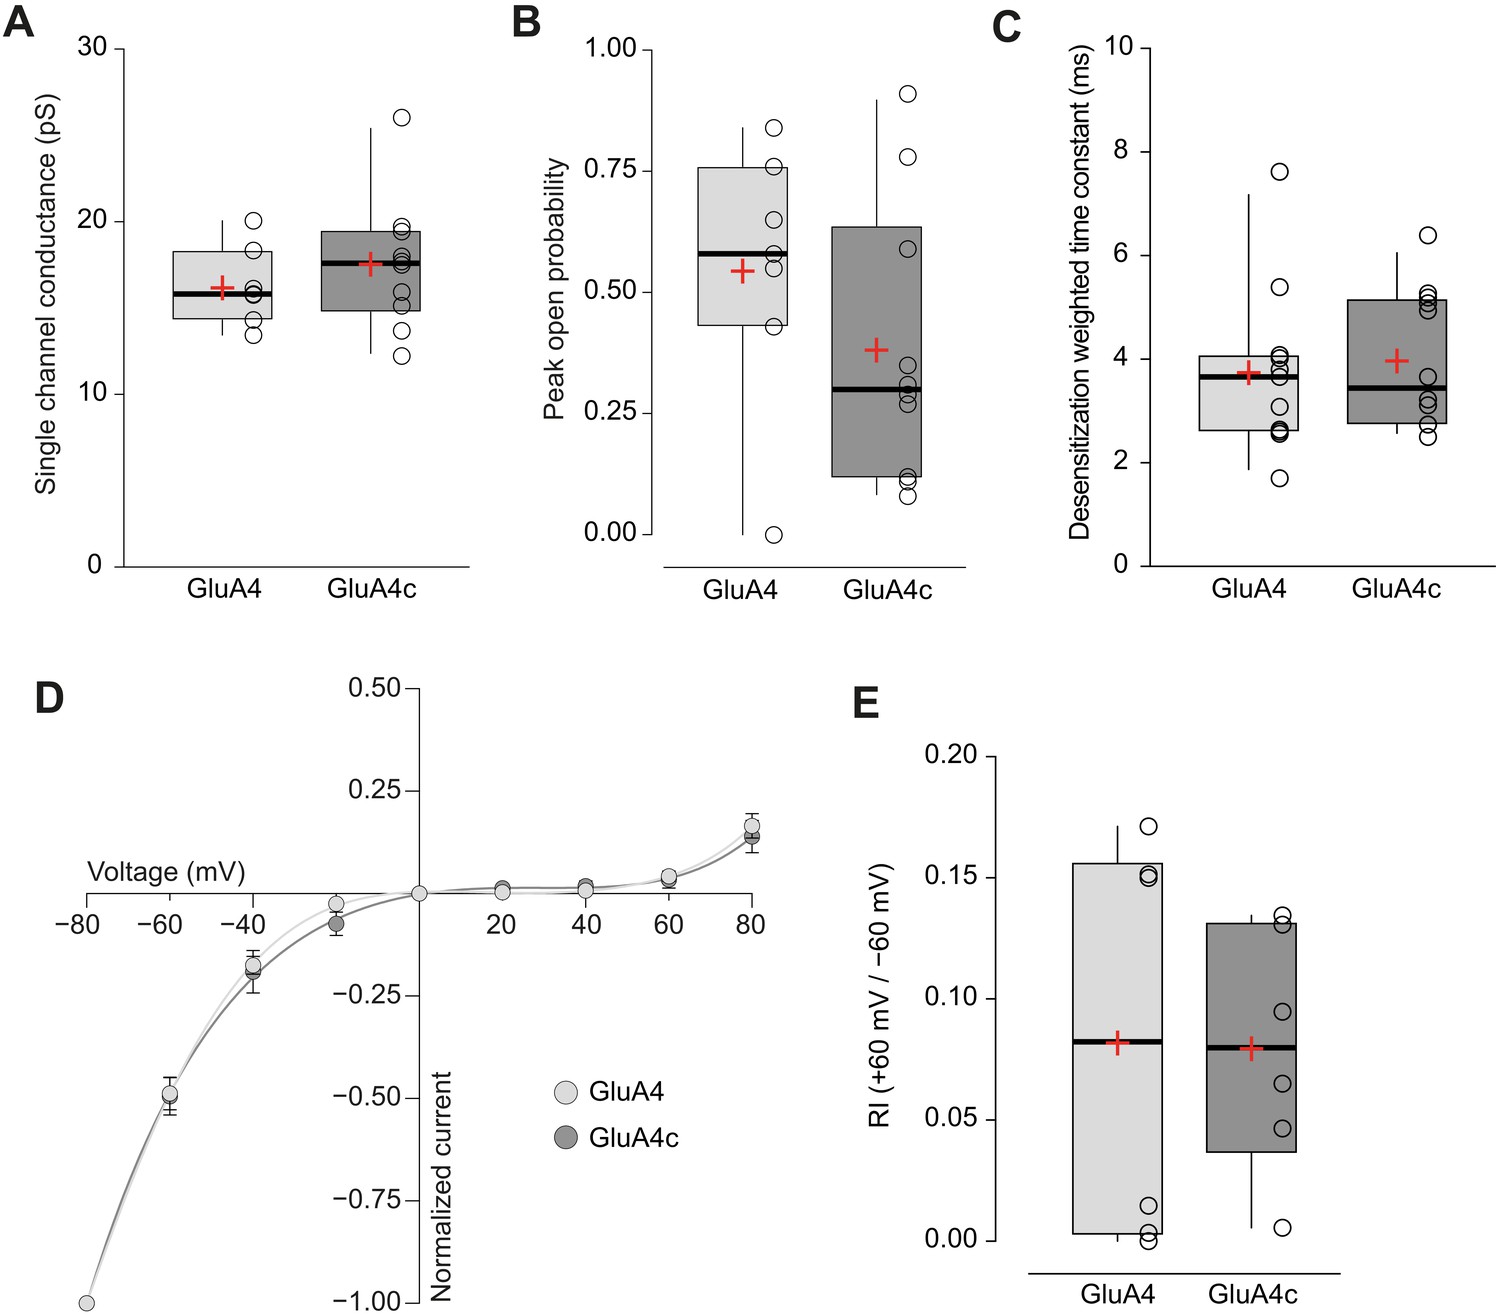
Short and long isoforms of GluA4 show the same electrophysiological behaviour.
(A) Pooled data showing single channel conductance from GluA4 (light grey) and GluA4c (dark grey) homotetramers. Box-and-whiskers plots represent percentiles, median and average as stated in Figure 1c. (B) Data showing peak open probability from GluA4 and GluA4c tetramers. (C) Weighted time constant of desensitization (τw, des) from GluA4 and GluA4c tetramers. (D) Inwardly rectifying I-V relationships constructed from peak currents evoked by glutamate (100 ms, 10 mM) applied to outside-out patches from tsA201 cells containing GluA4 (light circle) or GluA4c (dark circle). Fittings are adjusted to a 6th order polynomial function. (E) RI (+60 mV /-60 mV) values from GluA4 and GluA4c tetramers. Data from this figure containing statistical tests applied, exact sample number, p values and details of replicates is available in ‘Figure 4—figure supplement 1—source data 1’.
-
Figure 4—figure supplement 1—source data 1
Source data.
- https://cdn.elifesciences.org/articles/53946/elife-53946-fig4-figsupp1-data1-v4.xlsx
Figure 5
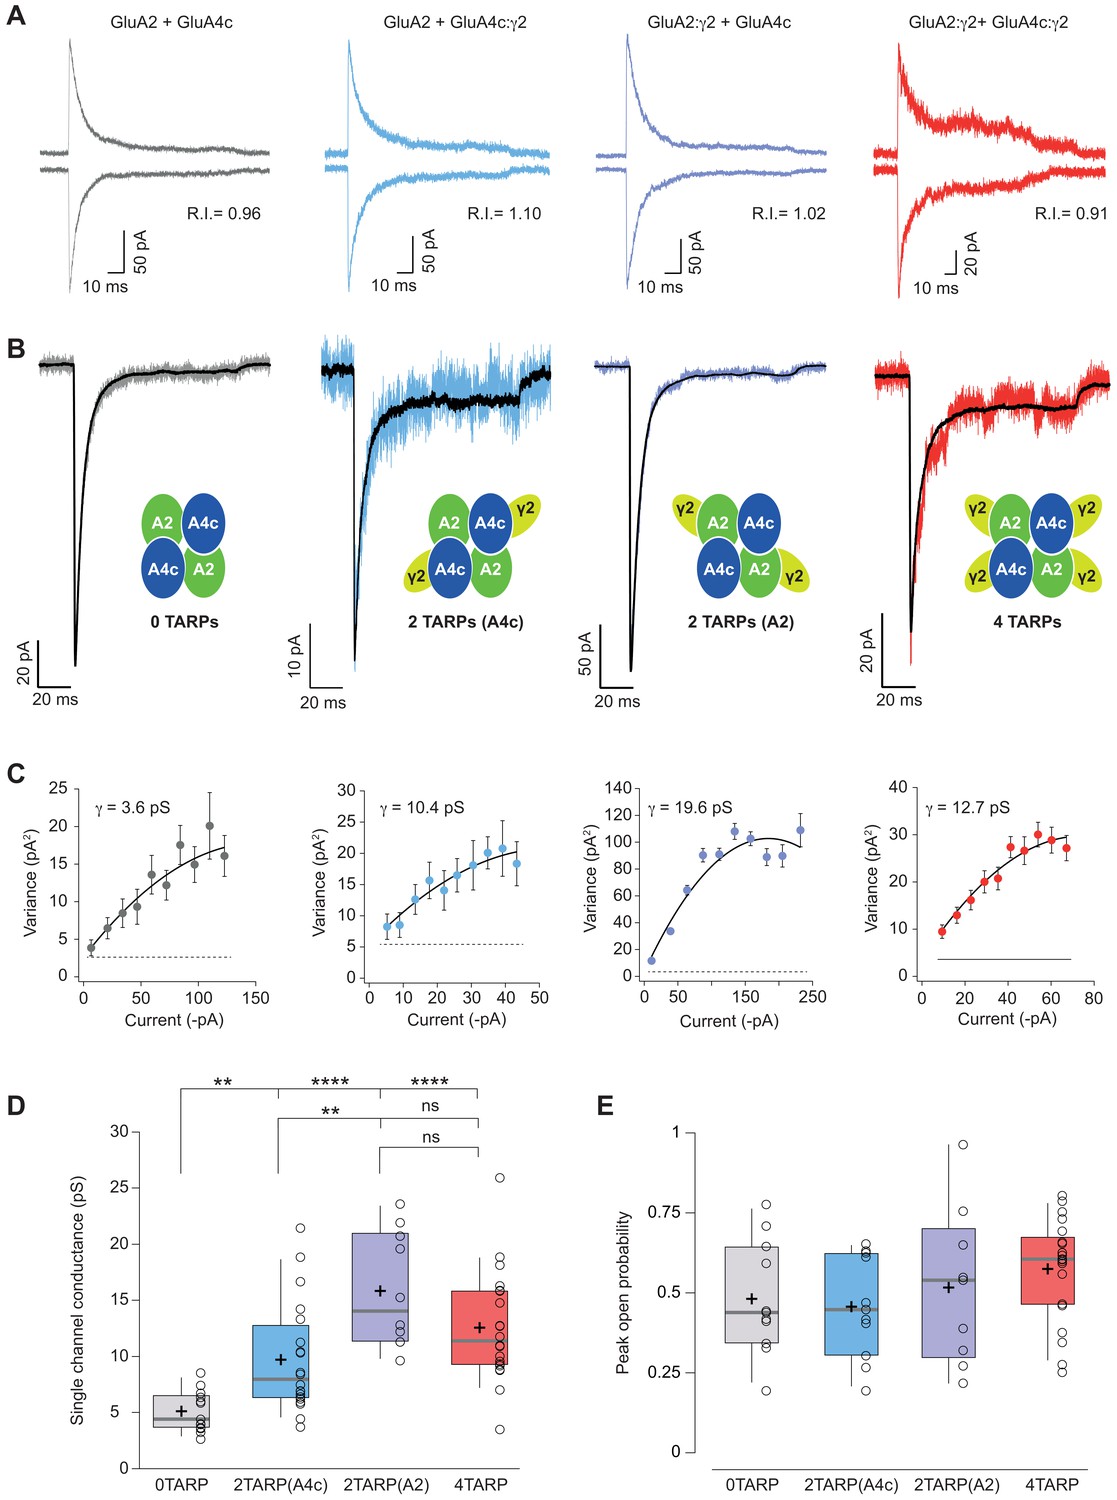
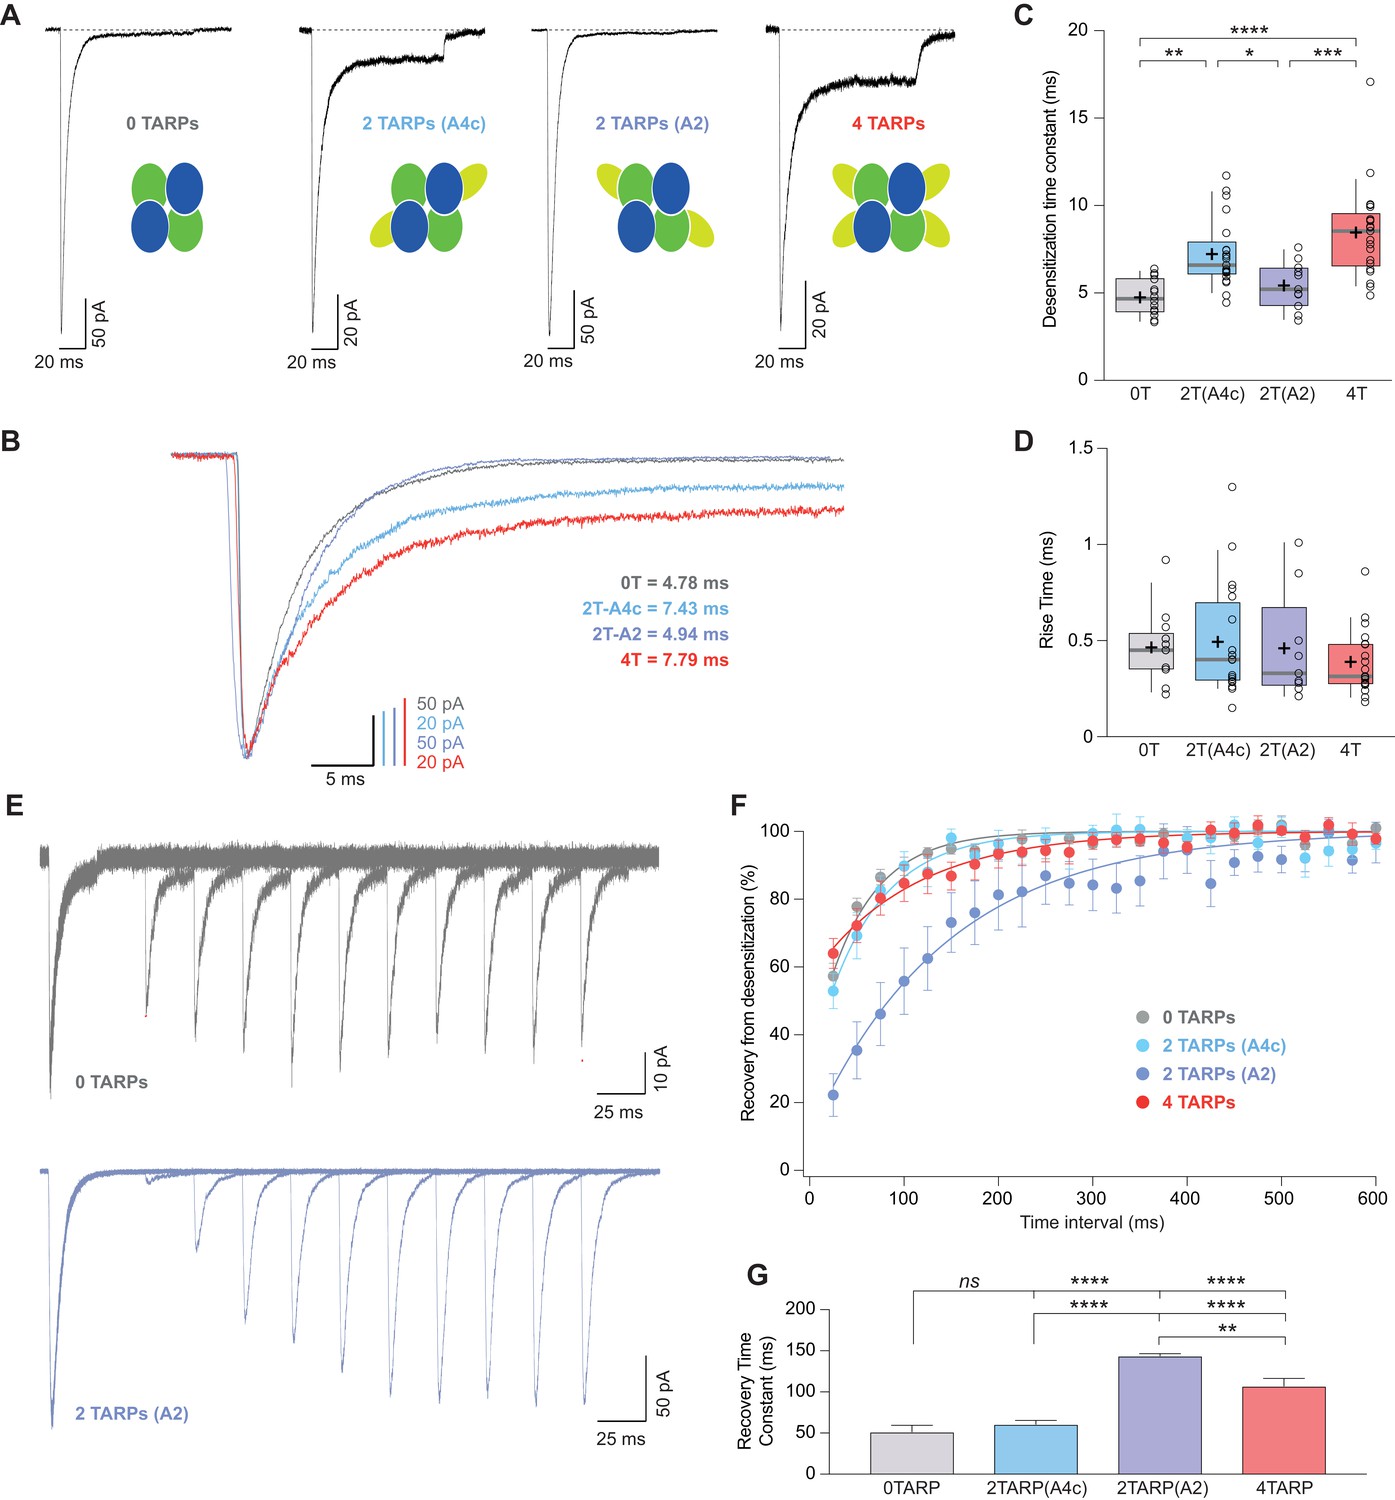
Single channel conductance of CI-AMPARs is modulated differently by TARPs depending on their location within the complex.
(A) Evoked currents by rapid application of 10 mM glutamate from membrane patches at +60 mV (upward traces) and −60 mV (downward traces) with their corresponding RI. The experimental conditions are designated as grey for 0 TARPs per AMPAR, blue for 2 TARPs per AMPAR with γ2 linked to GluA4c, purple for 2 TARPs per AMPAR with γ2 linked to GluA2 and red for 4 TARPs per AMPAR. (B) Average traces of current responses evoked at −60 mV used for NSNA shown in black overlaid with a representative single response. Insets show the studied combination. (C) Current-variance plots for the recordings shown in B, with the weighted single-channel conductance for the single recordings. (D) Pooled data showing a distinct degree in single channel conductance increase when γ2 is present into the AMPAR complex. (E) Pooled data for peak open probability of CI-AMPARs, where no effect of TARP stoichiometry was evident. The data from this figure containing statistical tests applied, exact sample number, p values and details of replicates are available in ‘Figure 5—source data 1'.
-
Figure 5—source data 1
KInetic properties of CI-AMPARs.
- https://cdn.elifesciences.org/articles/53946/elife-53946-fig5-data1-v4.xlsx
Figure 6 with 2 supplements
CI-AMPAR kinetics differ upon γ2 attachment to GluA4c or GluA2 subunit.
(A) Representative traces of currents at −60 mV from cells expressing CI-AMPARs without or with TARP γ2 linked to GluA subunits. Under the traces a scheme of the subunits forming the receptors with γ2 associated to different AMPAR subunits is shown. (B) Peak-scaled normalization from traces shown in A for a better comparison of desensitization kinetics. (C) Weighted time constant of desensitization (τw,des) where is clear that desensitization is slowed only when γ2 is linked to GluA4c subunit. (D) Rise time of the current activation is not changed by the AMPAR-TARP stoichiometry. (E) Representative traces monitoring recovery from desensitization for CI-AMPAR in cells expressing 0 TARPs or 2 TARPs linked to GluA2 subunit where it is manifest the difference between the two conditions. (F) Recovery of desensitization kinetics showing a relatively slow recovery only in 2-TARPed (located in GluA2) CI-AMPARs. (G) Recovery time constant values for the experiments showed in E and F. The data from this figure containing statistical tests applied, exact sample number, p values and details of replicates are available in ‘Figure 6—source data 1'.
-
Figure 6—source data 1
Channel conductance of CI-AMPARs.
- https://cdn.elifesciences.org/articles/53946/elife-53946-fig6-data1-v4.xlsx
Figure 6—figure supplement 1
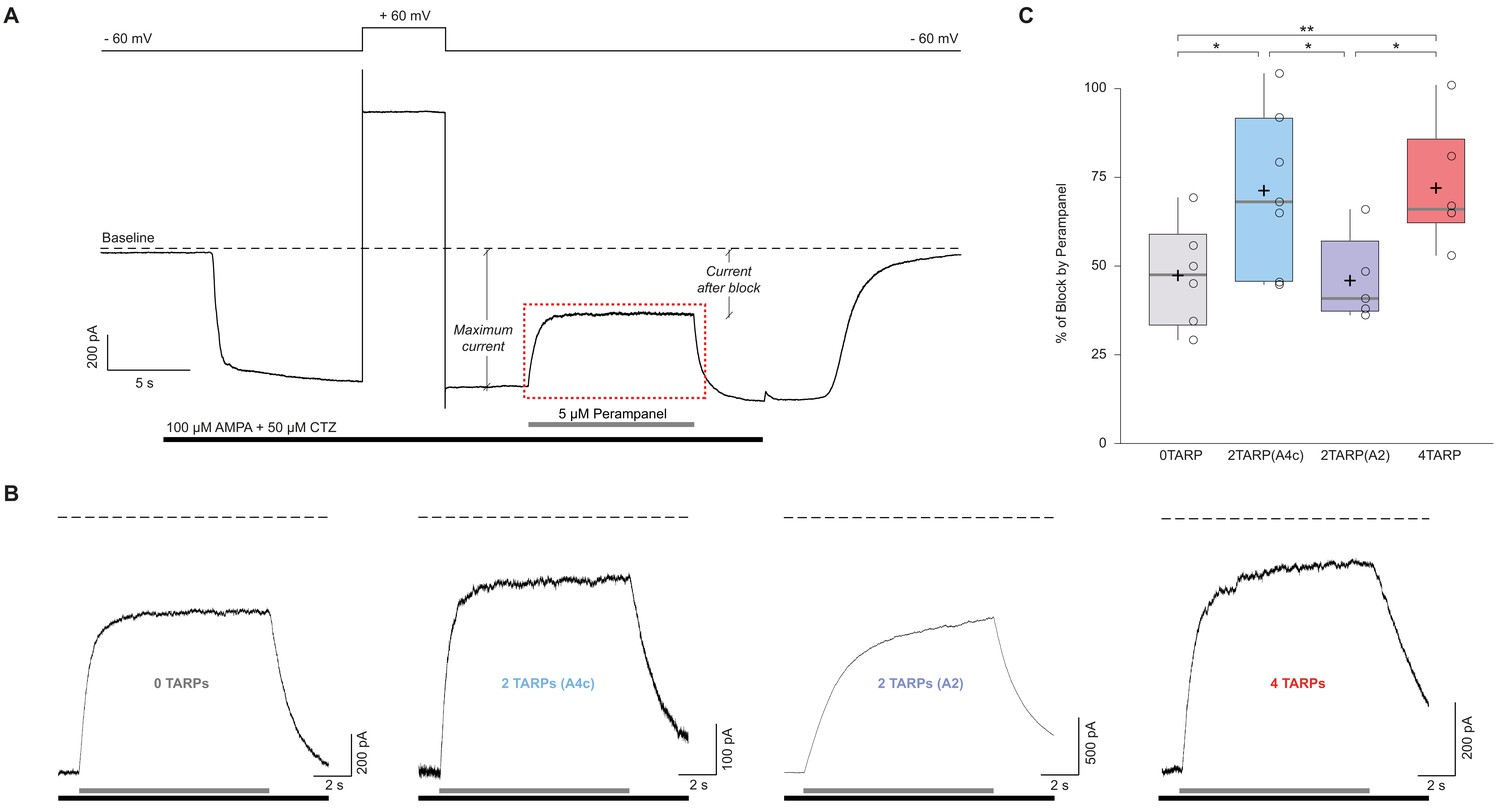
The block of the non-competitive antagonist perampanel varies with AMPAR-TARP stoichiometry.
(A). Representative whole-cell recording showing the protocol used to determine the percentage of perampanel block. This trace corresponds to a cell expressing GluA2 and GluA4c. Cells were clamped at −60 mV during the recording with a 5 s pulse duration at +60 mV to asses for GluA2 presence. Black bar shows application time of AMPA 100 μM + Cyclothiazide 50 μM to tsA201 cells expressing different AMPAR-TARP combinations. Grey bar shows rapid application (<1 ms) of Perampanel at 5 μM. Baseline is pointed with dashed line. Maximum current and current after block are displayed. The dashed red frame represents the magnification part shown in panel B. (B) Representatives traces of Perampanel blocking from each condition following the same colour pattern as in Figure 5. Under each trace the black bar shows AMPA + CTZ and grey bar shows application of Perampanel. (C) Pooled data for the percentage of blocking by Perampanel. Box-and-whiskers plots as in Figure 1c. Data from this figure containing statistical tests applied, exact sample number, p values and details of replicates is available in ‘Figure 6—figure supplement 1—source data 1’.
-
Figure 6—figure supplement 1—source data 1
Source data.
- https://cdn.elifesciences.org/articles/53946/elife-53946-fig6-figsupp1-data1-v4.xlsx
Figure 6—figure supplement 2
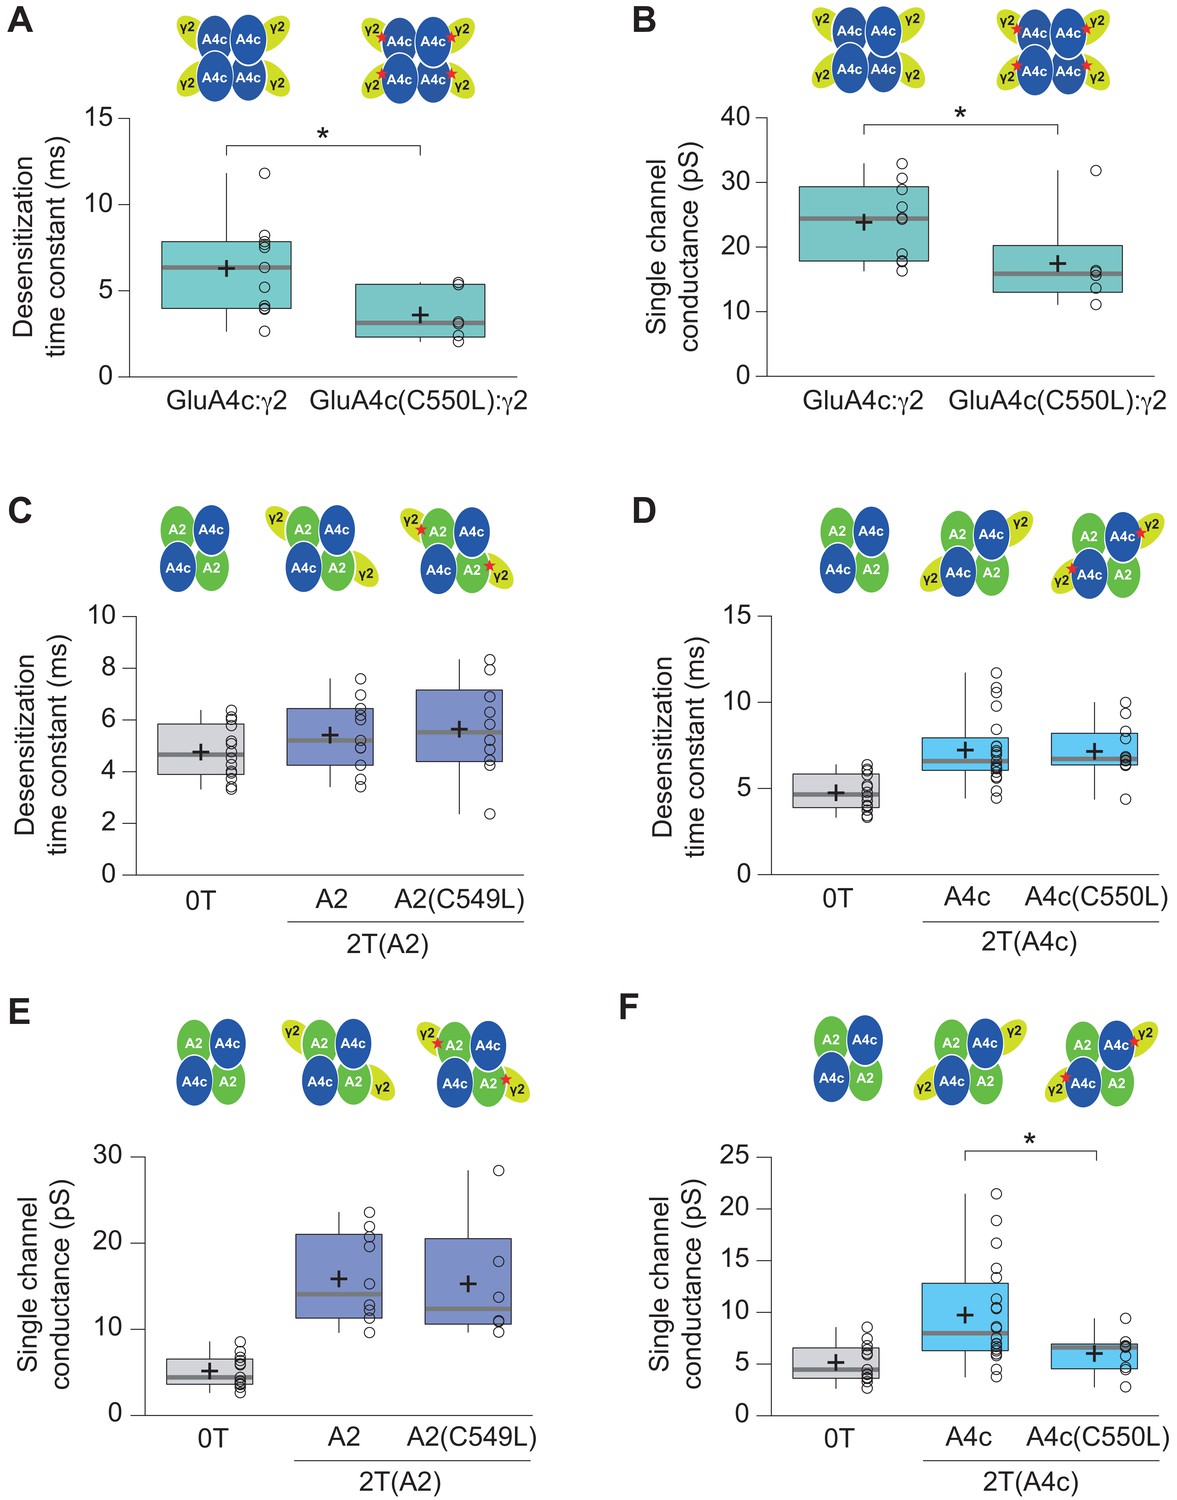
Effect of C549L and C550L AMPAR mutations in AMPAR-TARP modulation.
(A–B) Pooled data showing C550L mutation effect in GluA4c homotetramers in decreasing the weighted time constant of desensitization (τw, des) and single channel conductance. (C–D) C549L and C550L mutations in GluA2 and GluA4c respectively subunits have no effect in time constant of desensitization (τw, des) in 2 TARPed CI-AMPARs. (E) C549L mutation in GluA2 subunit in CI-AMPARs shows no differences in single-channel conductance compared with wt 2T(A2) CI-AMPARs. (F) CI-AMPARs with GluA4c mutation C550L show a decrease in single-channel conductance compared with wt 2T(A4c) CI-AMPARs. Data from this figure containing statistical tests applied, exact sample number, p values and details of replicates is available in ‘Figure 6—figure supplement 2—source data 1’.
-
Figure 6—figure supplement 2—source data 1
Source data.
- https://cdn.elifesciences.org/articles/53946/elife-53946-fig6-figsupp2-data1-v4.xlsx
Figure 7 with 1 supplement
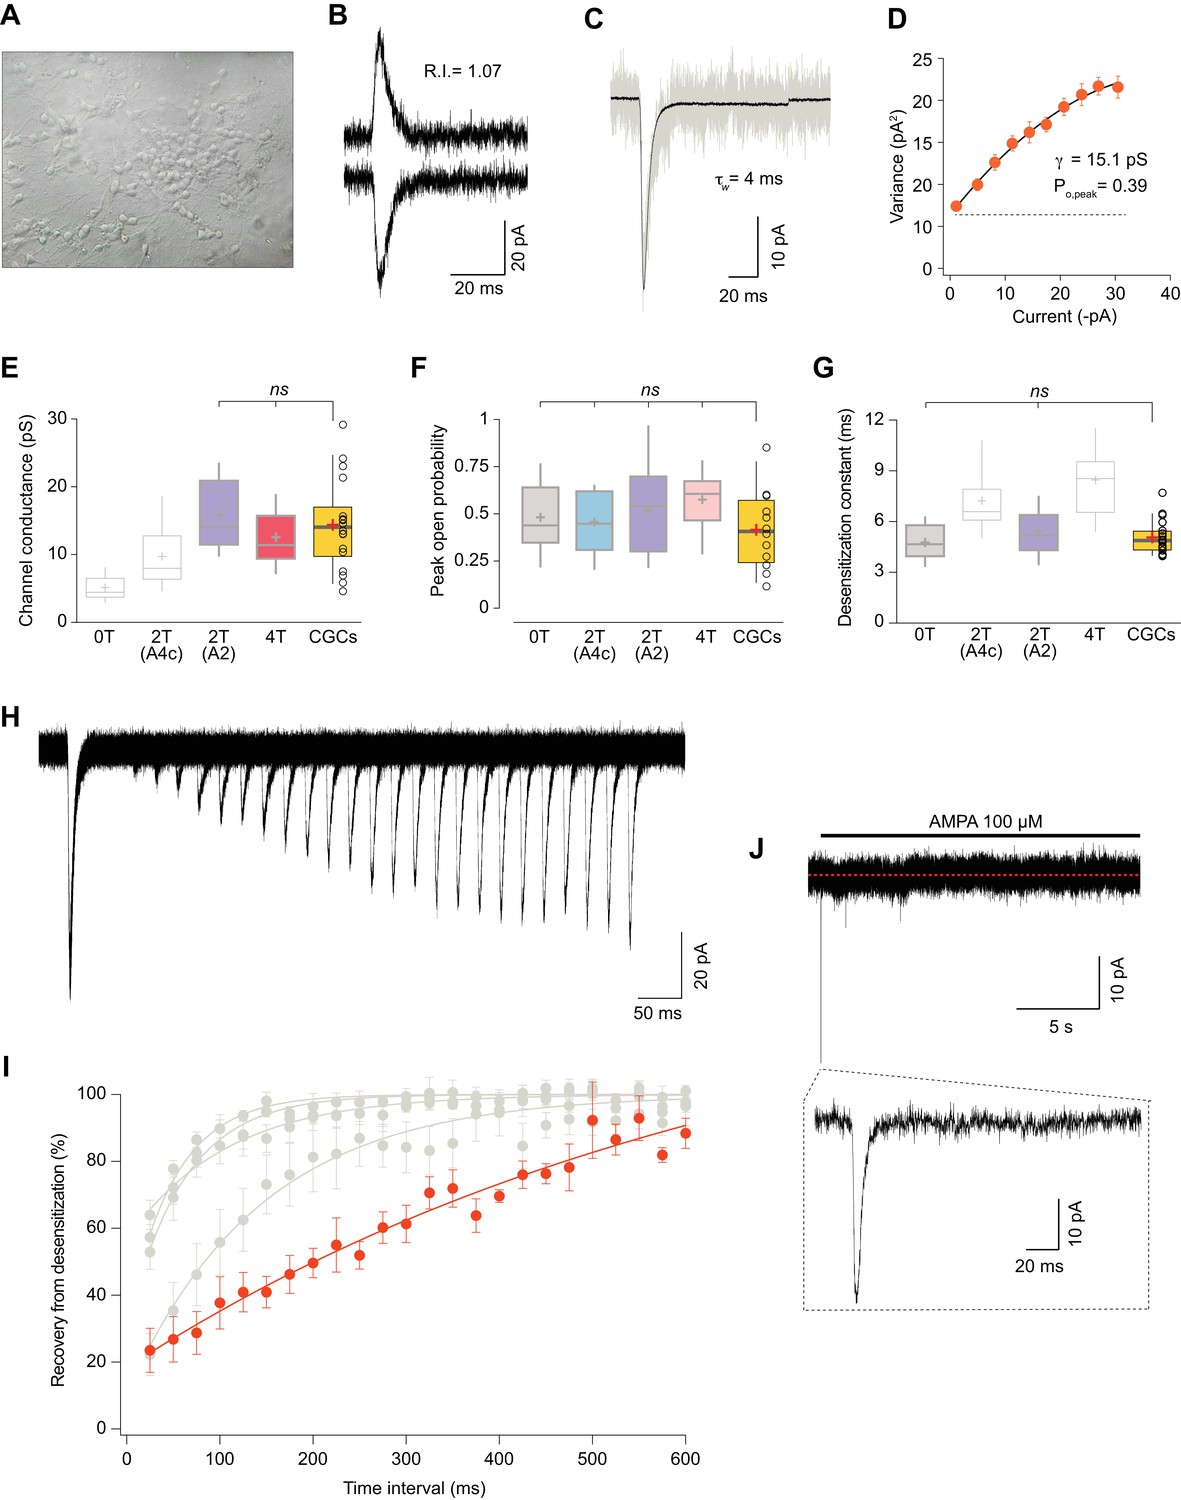
Somatic currents from CGCs exhibit properties of GluA2:γ2 + GluA4c CI-AMPARs.
(A) CGCs in culture after 7 days in vitro. (B) Traces at +60 mV and −60 mV evoked with 100 μM AMPA from a CGC somatic patch showing the typical lineal response of a CI-AMPAR. (C) Representative response of current evoked at −60 mV by rapid application of 100 μM AMPA to somatic patches from CGCs. Grey: representative single response; black: average of 275 stable responses. (D) NSFA from the recording in C. (E) Data showing comparison of single channel conductance values obtained in CGCs (orange box) with recordings from transfected cell lines. The conductance values obtained resembled (without significant difference) to the ones seen with 2T(A2) or 4T conditions (marked in bold grey). (F) Comparison of peak open probability values from CGCs were no significant differences from recordings in cell lines was observed. (G) Compared data of desensitization time constant (ms) from CGCs with recordings in tsA201 cells. The results are no significantly different from conditions with 0T or 2T(A2). (H) Representative trace from two-pulse protocol monitoring recovery from desensitization for CGCs somatic patches to 100 μM AMPA application. (I) Recovery from desensitization kinetics of CGS somatic AMPARs compared with recoveries of GluA2:GluA4c combinations shown in Figure 6F (in grey). (J) Representative response to a 100 μM AMPA application for 20 s in a somatic patch from CGCs to test for the presence of γ7. No re-sensitization of the receptors is observed in the trace. Inset: magnification of 200 ms showing the initial fast desensitizing response. The data from this figure containing statistical tests applied, exact sample number, p values and details of replicates are available in ‘Figure 7—source data 1'.
-
Figure 7—source data 1
Cerebellar granule cells properties.
- https://cdn.elifesciences.org/articles/53946/elife-53946-fig7-data1-v4.xlsx
Figure 7—figure supplement 1
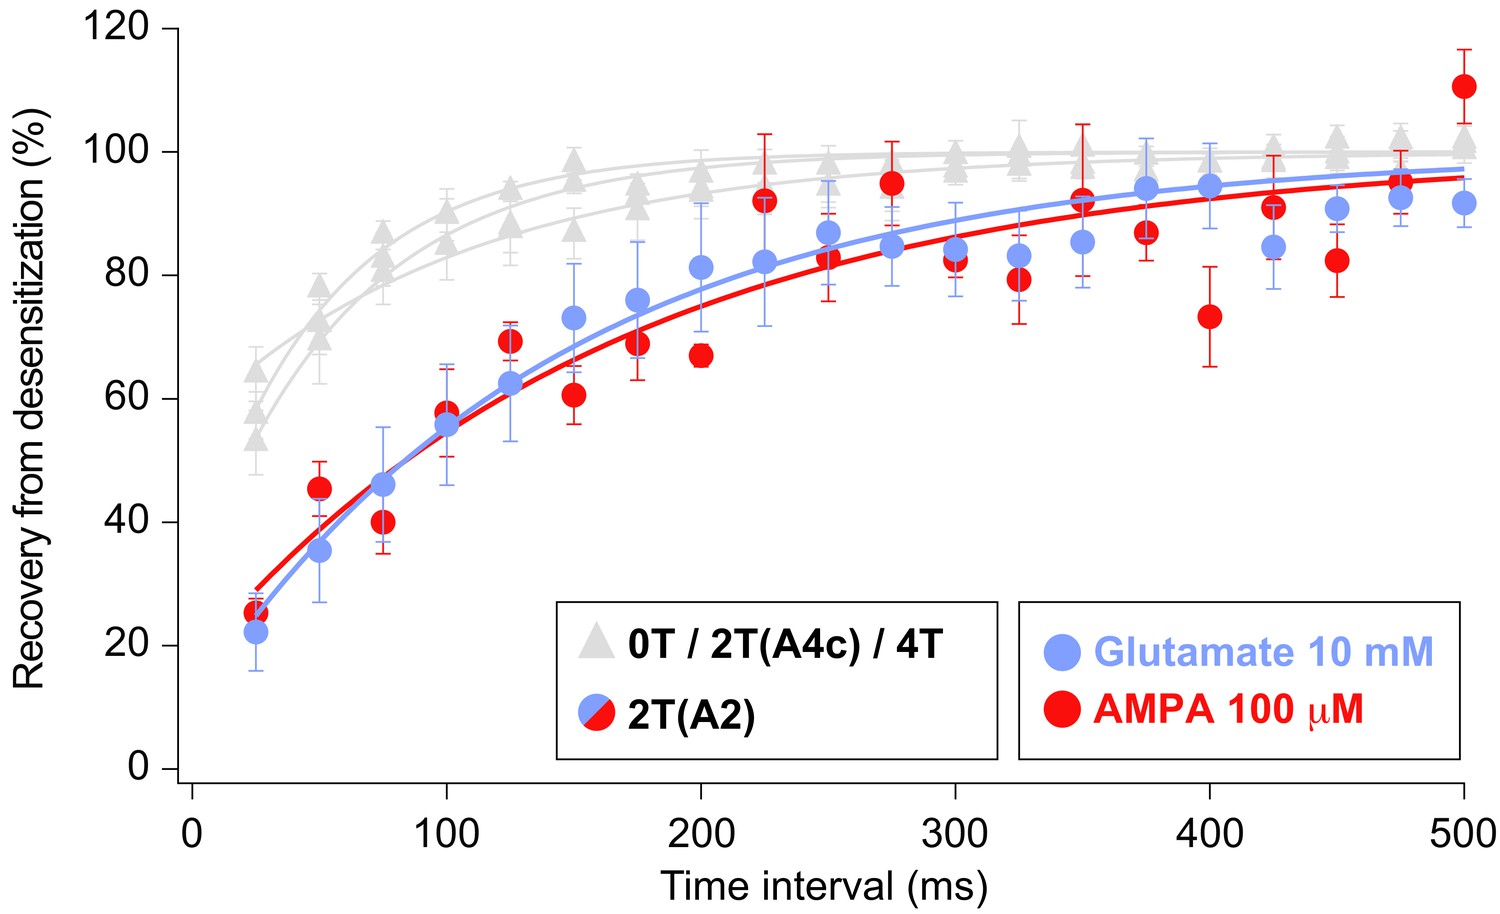
Recovery of desensitization kinetics showing no differences between agonists used to evoke currents in 2T(A2) condition.
Data from this figure containing statistical tests applied, exact sample number, p values and details of replicates is available in ‘Figure 7—figure supplement 1—source data 1’.
-
Figure 7—figure supplement 1—source data 1
Source data.
- https://cdn.elifesciences.org/articles/53946/elife-53946-fig7-figsupp1-data1-v4.xlsx
Author response image 1
Additional files
Download links
A two-part list of links to download the article, or parts of the article, in various formats.
Downloads (link to download the article as PDF)
Open citations (links to open the citations from this article in various online reference manager services)
Cite this article (links to download the citations from this article in formats compatible with various reference manager tools)
AMPAR/TARP stoichiometry differentially modulates channel properties
eLife 9:e53946.
https://doi.org/10.7554/eLife.53946


