Attention-related modulation of caudate neurons depends on superior colliculus activity
- Laboratory of Sensorimotor Research, National Eye Institute, United States
- INSERM, CNRS Institut de la Vision, France
Figures
Figure 1 with 3 supplements
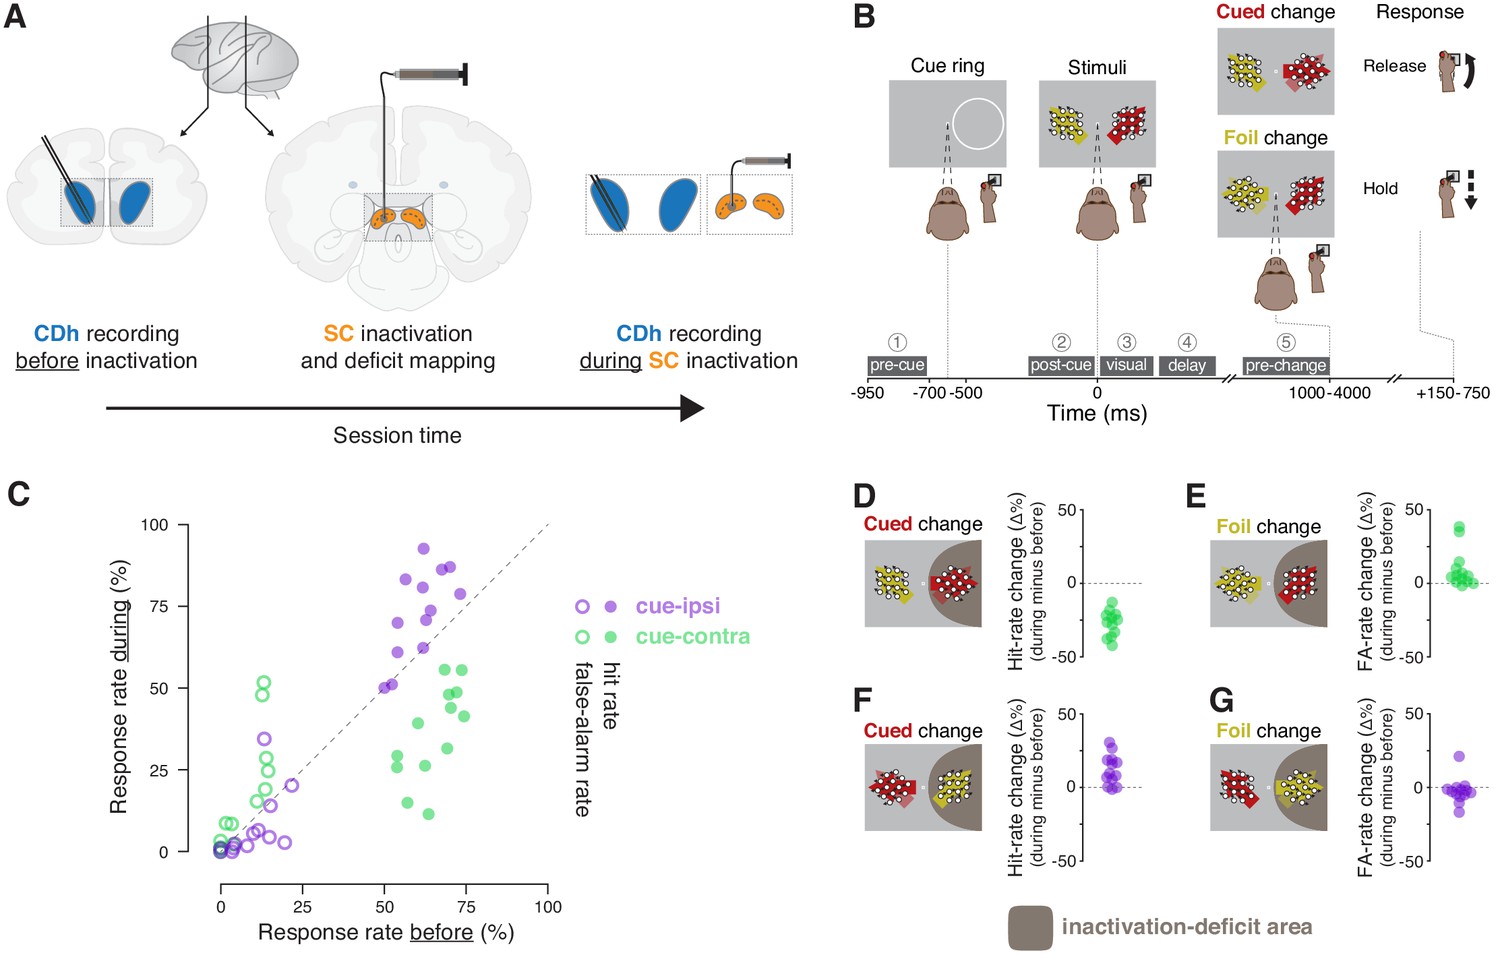
Experimental approach and behavioral effects of inactivation.
(A) In each session, the activity of neurons in the head of the caudate nucleus (CDh; blue shaded regions) was recorded with a pair of linear 32-channel probes before inactivation. An injection cannula was advanced into SC, 0.5 μL of muscimol was injected, and the presence of a contralateral saccade deficit was confirmed (the images depict an inactivation of SC on the same side of the brain as recorded CDh neurons; not depicted are opposite-side SC inactivations). A diagram of a lateral view of a macaque brain shows the antero-posterior positions (vertical black lines with adjoining arrows) corresponding to the diagrams of coronal slices displaying CDh and SC. During the effects of SC inactivation (referred to throughout as ‘during inactivation’ or simply ‘during’), recordings of the activity of CDh neurons continued. (B) Monkeys performed a cued motion-direction change detection task while CDh neuron activity was recorded before and during SC inactivation. Liquid reward was obtained either by responding to a cued motion change with a joystick release (a hit), or by withholding response to a foil change (a correct reject); no reward was given if the monkey failed to respond to a cued change (a miss) or responded for a foil change (a false alarm). Dark-gray boxes with white text with circled numerals above show the timing, names, and numerical indexes of ‘task-epochs’ used for data analysis. (C) Performance summary comparing before and during SC inactivation. Hit (filled symbols) and false-alarm rates (empty symbols) during SC inactivation are plotted against rates before SC inactivation from the same sessions (n = 13). Rates for cue-ipsilateral to SC inactivation site are plotted in purple and those for cue-contralateral are plotted in green. (D–G) Differences in hit and false-alarm rates (during minus before SC inactivation) are plotted for each session, horizontal symbol spacing is artificially jittered to increase visibility. Brown shaded region depicts the area of visual space affected by muscimol inactivation of SC.
Figure 1—figure supplement 1
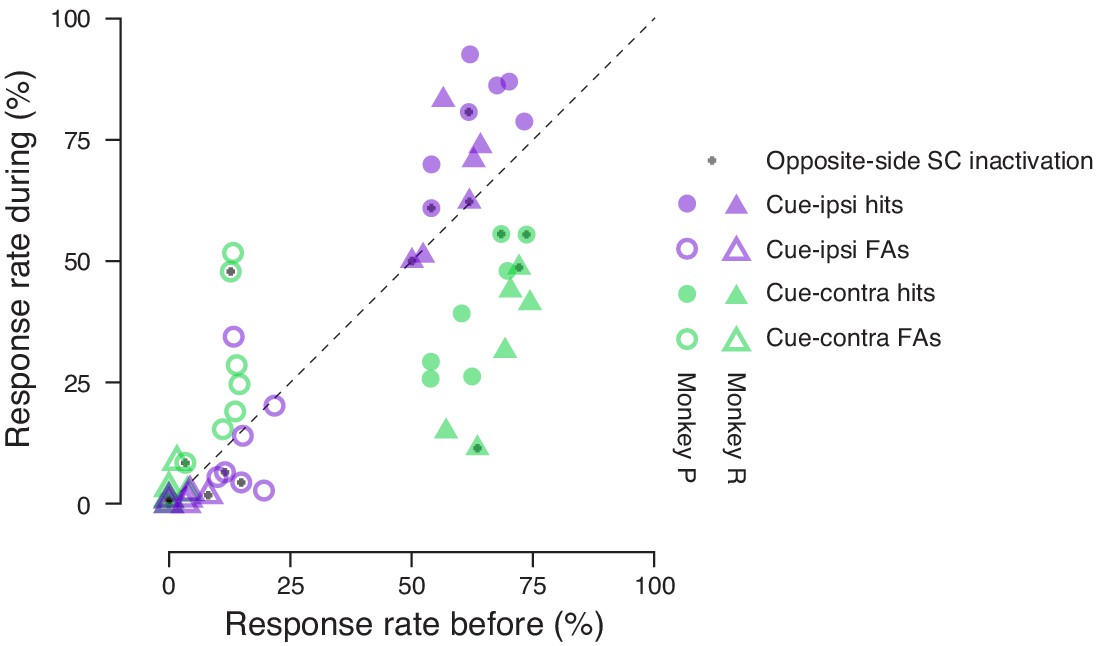
Performance summary comparing before and during SC inactivation broken down by SC inactivation side and subject.
Hit (filled symbols) and false-alarm rates (empty symbols) before SC inactivation are plotted against rates from the same sessions during SC inactivation. Rates for cue-ipsilateral to SC inactivation site are plotted in purple and those for cue-contralateral are plotted in green. Triangles indicate rates for monkey R and circles indicate rates for monkey P. An added gray symbol plotted in the same location as a hit or false-alarm symbol indicates data from opposite-side SC inactivation.
Figure 1—figure supplement 2
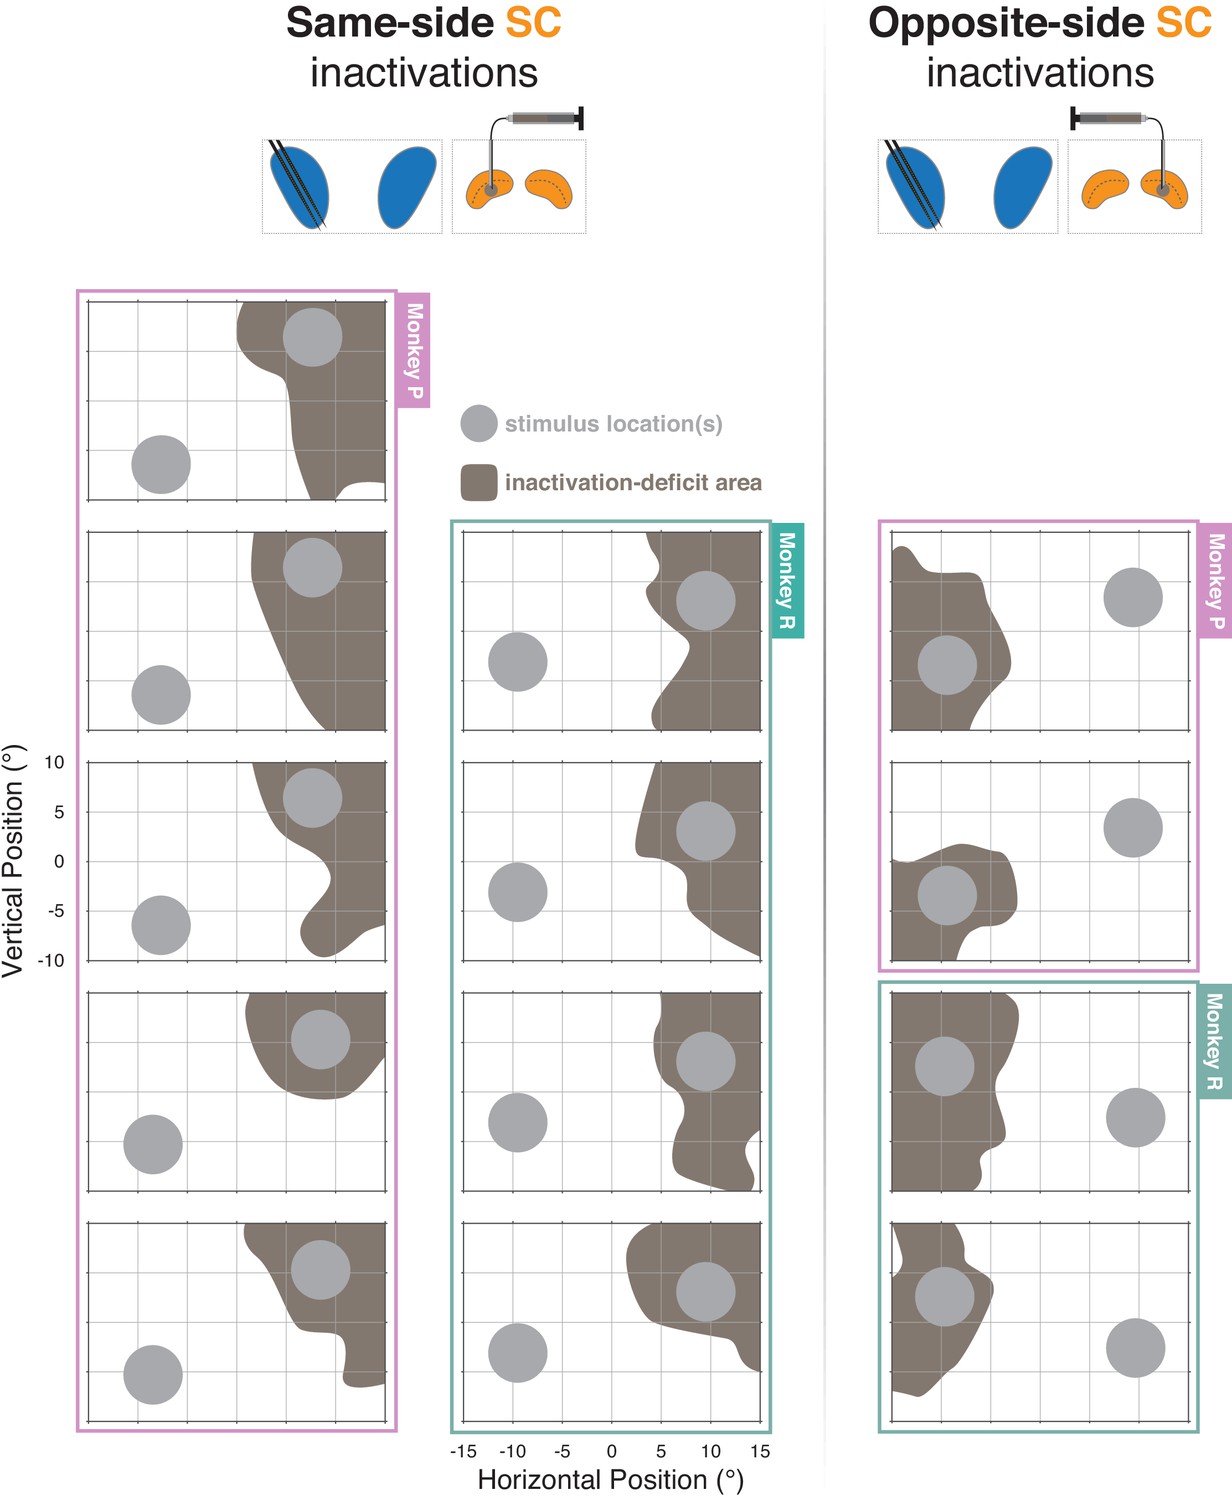
Inactivation-deficit area maps for all recording plus inactivation sessions (n = 13).
Each panel shows area occupied by motion-patch stimuli (gray-filled circles) and the estimated area of visual space affected by unilateral muscimol injection into the superior colliculus (SC). Panels surrounded by desaturated pink border are from monkey P and those surrounded by desaturated green border are from Monkey R.
Figure 1—figure supplement 3
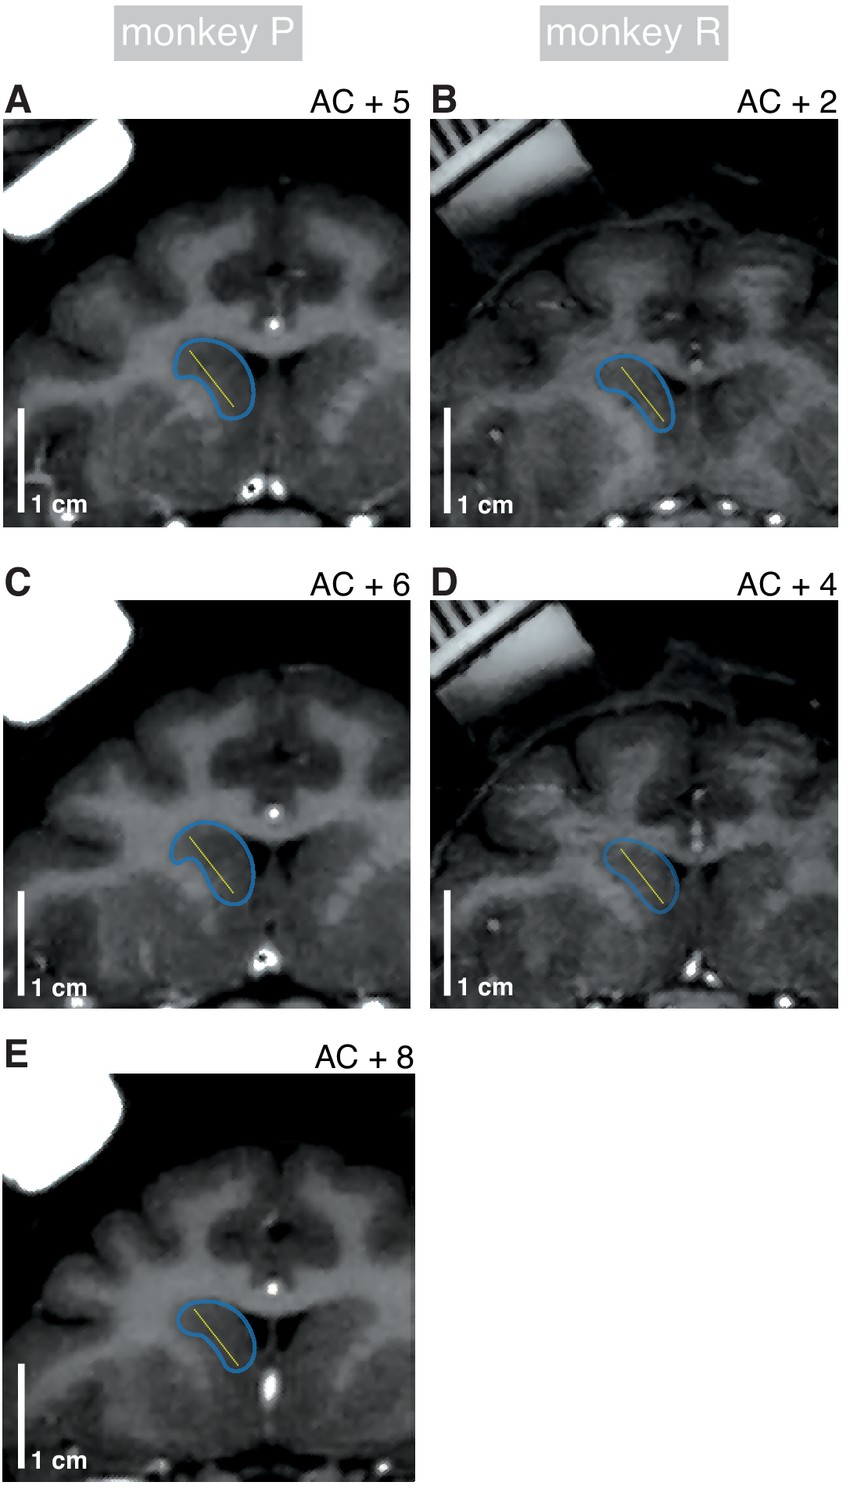
Electrode contact locations.
(A) Coronal MRI sections depicting recording target locations in monkey P at ‘AC +5’ (5 mm anterior to the anterior commissure). Yellow dots indicate approximate recording contact locations estimated from recording-probe depth and geometry during recording; target locations varied by ±500 µm depending on session. Blue curves define approximate border of caudate head (CDh). (B) Presentation as in (A) for monkey R at AC +2. (C) Presentation as in (A) for AC +6. (D) Presentation as in (A) for monkey R at AC +4. (E) Presentation as in (A) at AC +8.
Figure 2
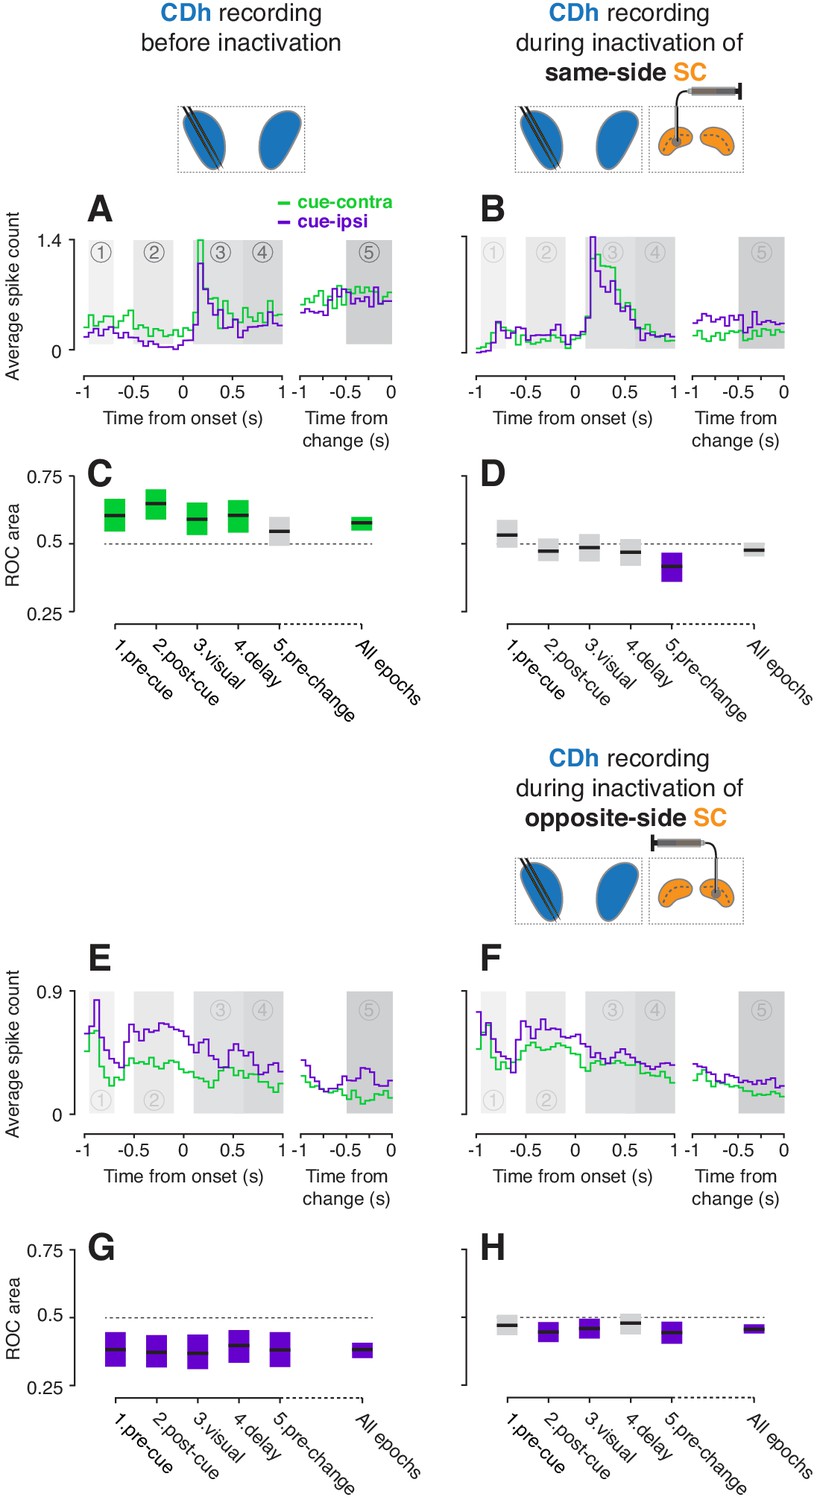
Example CDh neurons before and during SC inactivation.
(A) Activity of an example 'continuously isolated' CDh neuron recorded before same-side SC inactivation. Traces representing average spike counts in non-overlapping 50 ms bins are plotted separately for cue-contralateral (to CDh recordings) and cue-ipsilateral conditions. A portion of data aligned on stimulus onset is presented in the left panel, and a portion aligned on stimulus change in the right panel. Shaded areas mark five task-epochs: 1: pre-cue, 2: post-cue, 3: visual, 4: delay, 5: pre-change. (B) Presentation as in panel (A) but for activity recorded during same-side SC inactivation. (C) The area under a receiver operating characteristic curve (ROC area) was used to quantify the cue-side preference of the example unit in (A) within each task-epoch and across all task-epochs (‘all epochs’ tic label). Horizontal black line segments are ROC areas and surrounding shaded regions indicate bootstrapped 95% confidence intervals (CIs). Individual ROC areas are considered significant when their 95% CIs ⊄ 0.5 (do not contain 0.5; dotted line); significant cue-contra ROC CIs are colored green and significant cue-ipsi CIs are colored purple, gray ROC CIs indicate non-significant cue-side preferences. (D) ROC areas and 95% CIs comparing cue-contra to cue-ipsi for the example neuron in panel (B). (E) Presentation as in panel (A) but for an example 'continuously isolated' unit recorded before opposite-side SC inactivation. (F) Presentation as in panel (E) but for activity recorded during opposite-side SC inactivation. (G) ROC areas and 95% CIs comparing cue-contra to cue-ipsi for the example neuron in panel (E). (H) ROC areas and 95% CIs comparing cue-contra to cue-ipsi for the example neuron in panel (F).
Figure 3 with 4 supplements
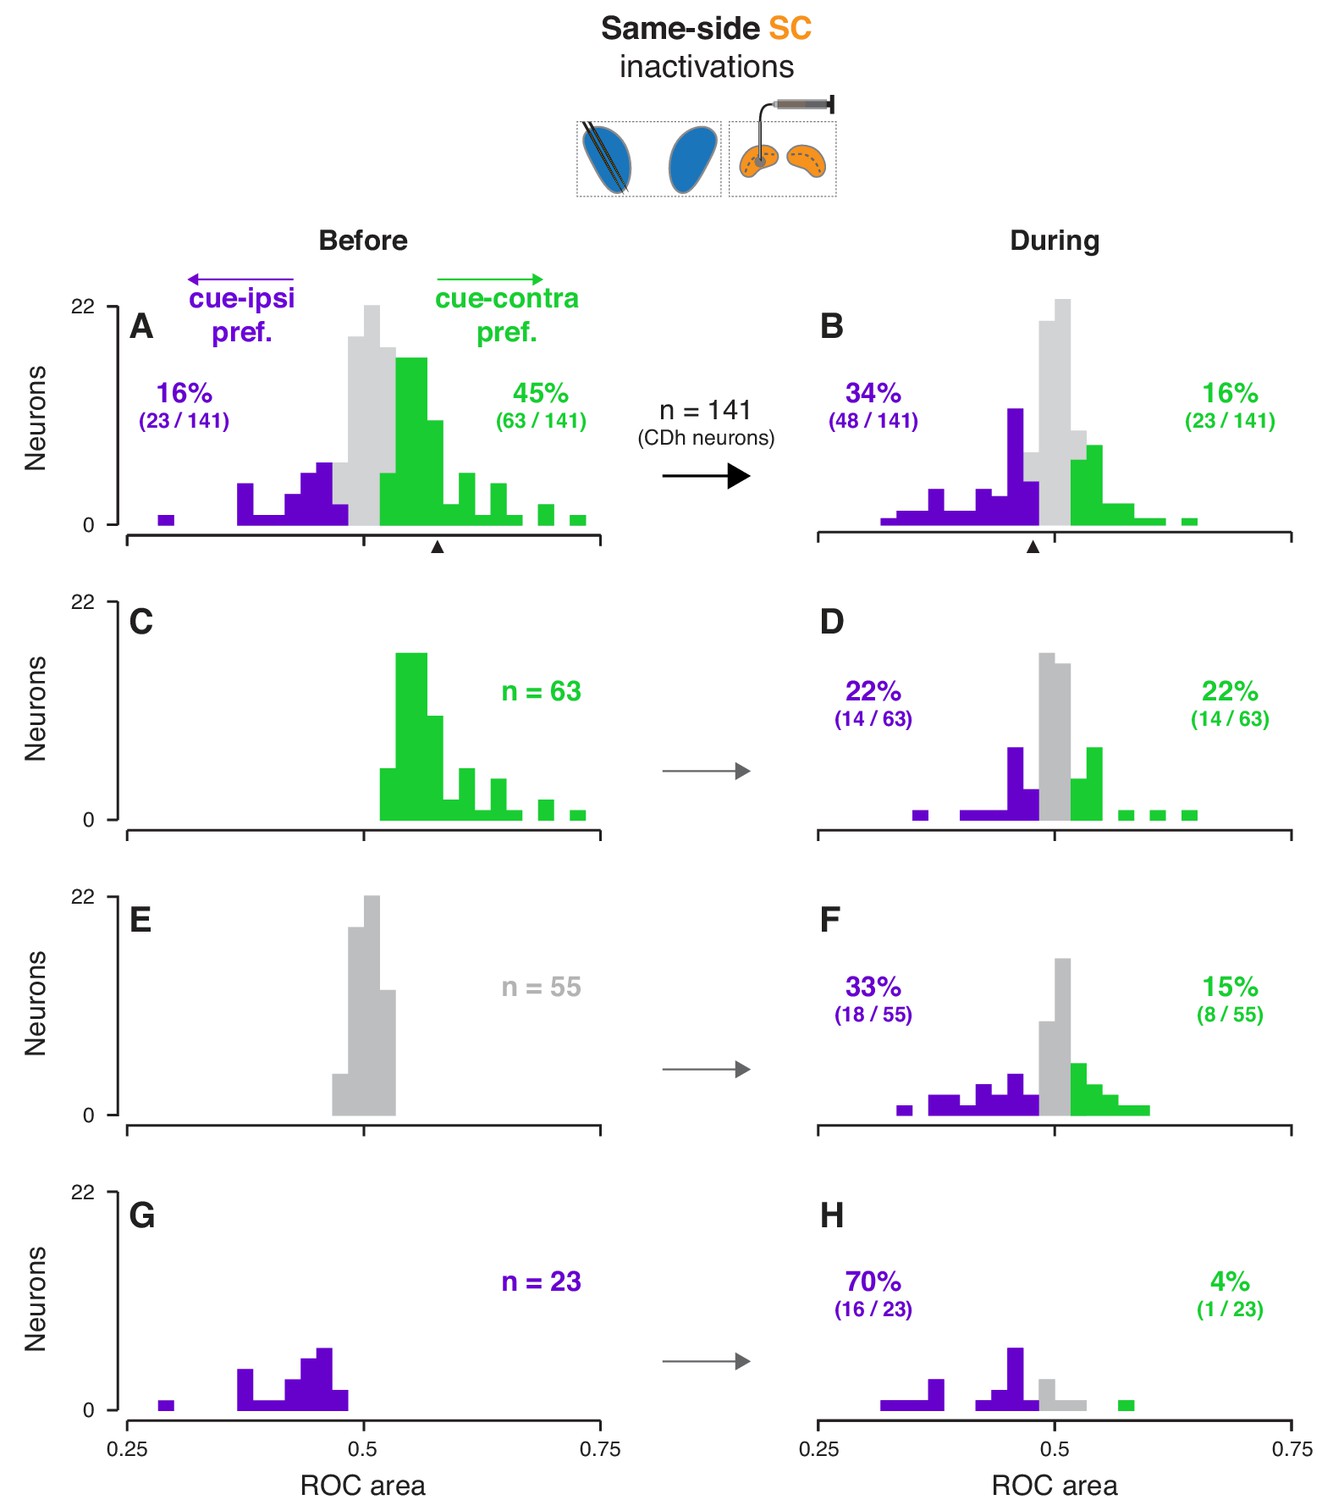
Effects of same-side SC inactivation on cue-side preferences in continuously isolated CDh neuron subpopulation.
(A) Distribution of individual CDh across-task-epochs ROC areas (cue-side preferences) before same-side SC inactivation; colored bars indicate neurons with significant cue-contra (green; ROC area CI >0.5) and cue-ipsi (purple; ROC area CI <0.5) preferences and gray bars indicate no-preference (ROC area CI ⊂ 0.5); colored-text percentages (and fractions) indicate the percentage (fraction) of units with significant cue-contra (green) or cue-ipsi (purple) preferences; black triangle below axis indicates ROC area value for example unit presented in Figure 2A–D. (B) Distribution of ROC areas (cue-side preferences) during same-side SC inactivation; presentation as in (A). (C) Distribution of before-inactivation ROC areas (cue-side preferences) restricted to CDh neurons with significant cue-contra preferences (green text indicates number of neurons with this preference); bar heights are identical to green bars in panel (A). (D) Distribution of during-inactivation ROC areas (cue-side preferences) restricted to CDh neurons with significant before-inactivation cue-contra preferences; colored text indicates the proportion (fraction) of units with significant before-inactivation cue-contra preferences that had significant during-inactivation cue-contra preferences (green) or cue-ipsi preferences (purple). (E) Presentation as in (C) but restricted to CDh neurons with no-preference before inactivation. (F) Presentation as in (D) but restricted to CDh neurons with no-preference before inactivation. (G) Presentation as in (C) but restricted to CDh neurons with significant before-inactivation cue-ipsi preferences. (H) Presentation as in (D) but restricted to CDh neurons with significant before-inactivation cue-ipsi preferences.
Figure 3—figure supplement 1

Effects of SC inactivation on CDh neuron firing rates.
(A) Average ROC area (cue-side preference) before (light line segments on black bars) and during (dark line segments on light bars) same-side SC inactivation in each task-epoch. Each line segment is the average ROC area (cue-side preference) and surrounding shaded region is the corresponding bootstrapped 95% confidence interval (CI) for one task-epoch. (B) Proportion of significant cue-contra (green) and cue-ipsi (purple) preferences of all independent subpopulation CDh neurons before same-side SC inactivation. Shaded regions represent 95% binomial parameter estimate CIs. (C) Proportion of significant cue-side preferences during same-side SC inactivation; presentation as in (B). (D) Average ROC area (cue-side preference) before and during opposite-side SC inactivation in each task-epoch; presentation as in (A). (E) Proportion of significant cue-side preferences before opposite-side SC inactivation; presentation as in (B). (F) Proportion of significant cue-side preferences during opposite-side SC inactivation; presentation as in (B). (G) Individual continuously isolated CDh neuron average firing rate before same-side SC inactivation plotted against average firing rate during inactivation. Black filled circles indicate neurons with significantly different average firing rate before compared to during inactivation, gray-filled circles indicate those with no significant difference. Black text near vertical axis indicates the proportion of neurons with significantly higher average firing rate during inactivation, text near horizontal axis indicates the proportion with significantly lower firing rate. (H) Average CDh neuron firing rates before opposite-side SC inactivation plotted against average firing rates during inactivation; presentation as in (G). (I) Normalized firing-rate ‘image’ from all continuously isolated CDh neurons in the cue-contra condition before same-side SC inactivation (top), and corresponding population average firing-rate trace (bottom); left portion is aligned on stimulus onset, right portion is aligned on direction-of-motion change. Each row is the normalized activity of one CDh neuron, and rows are sorted in descending order by the timing of the earliest peak of activity (measured across either cue-contra or cue-ipsi conditions). Shaded boxes with inset numerals below image indicate task-epoch timing. (J) Normalized firing-rate ‘image’ for cue-contra during same-side SC inactivation (top), and corresponding population average firing-rate trace (bottom); presentation as in (I). (K) Normalized firing-rate ‘image’ before opposite-side SC inactivation (top), and corresponding population average firing-rate trace (bottom); presentation as in (I). (L) Normalized firing-rate ‘image’ for cue-contra during opposite-side SC inactivation (top), and corresponding population average firing-rate trace (bottom); presentation as in (I). (M) Normalized firing rate ‘image’ for cue-ipsi before same-side SC inactivation (top), and corresponding population average firing-rate trace (bottom); presentation as in (I). (N) Normalized firing rate ‘image’ for cue-ipsi during same-side SC inactivation for cue-ipsi (top), and corresponding population average firing-rate trace (bottom); presentation as in (I). (O) Normalized firing rate ‘image’ for cue-ipsi before opposite-side SC inactivation (top), and corresponding population average firing-rate trace (bottom); presentation as in (I). (P) Normalized firing rate ‘image’ for cue-ipsi during opposite-side SC inactivation (top), and corresponding population average firing-rate trace (bottom); presentation as in (I).
Figure 3—figure supplement 2

Effects of opposite-side SC inactivation on cue-side preferences in continuously isolated CDh neuron subpopulation.
(A) Distribution of individual CDh across-task-epochs ROC areas (cue-side preferences) before opposite-side SC inactivation; colored bars indicate neurons with significant cue-contra (green; ROC area CI >0.5) and cue-ipsi (purple; ROC area CI <0.5) preferences and gray bars indicate no-preference (ROC area CI ⊂ 0.5); colored-text percentages (and fractions) indicate the percentage (fraction) of units with significant cue-contra (green) or cue-ipsi (purple) preferences. black triangle below axis indicates ROC area value for example unit presented in Figure 2E–H. (B) Distribution of ROC areas (cue-side preferences) during opposite-side SC inactivation; presentation as in (A). (C) Distribution of before-inactivation ROC areas (cue-side preferences) restricted to CDh neurons with significant cue-contra preferences (green text indicates number of neurons with this preference); bar heights are identical to green bars in panel (A). (D) Distribution of during-inactivation ROC areas (cue-side preferences) restricted to CDh neurons with significant before-inactivation cue-contra preferences; colored text indicates the proportion (fraction) of units with significant before-inactivation cue-contra preferences that had significant during-inactivation cue-contra preferences (green) or cue-ipsi preferences (purple). (E) Presentation as in (C) but restricted to CDh neurons with no-preference before inactivation. (F) Presentation as in (D) but restricted to CDh neurons with no-preference before inactivation. (G) Presentation as in (C) but restricted to CDh neurons with significant before-inactivation cue-ipsi preferences. (H) Presentation as in (D) but restricted to CDh neurons with significant before-inactivation cue-ipsi preferences.
Figure 3—figure supplement 3
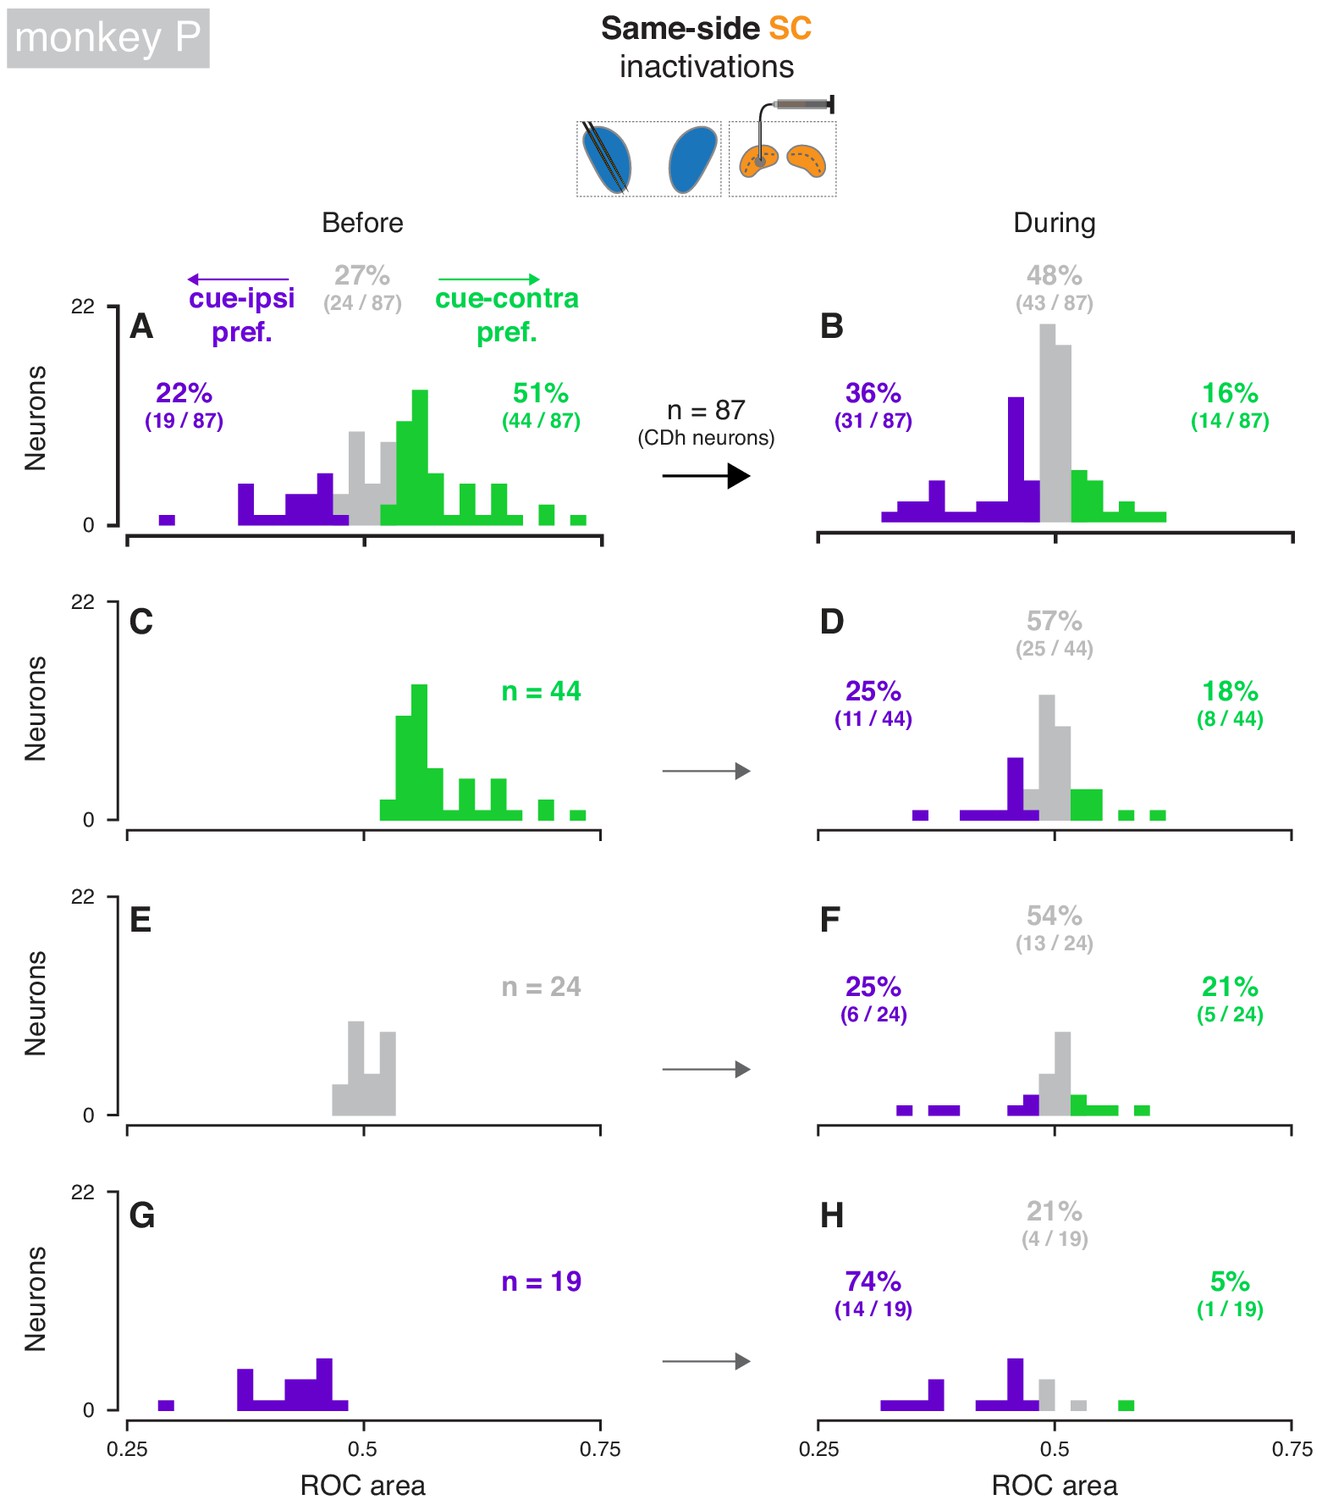
Effects of same-side SC inactivation on cue-side preferences in continuously isolated CDh neuron subpopulation (monkey P).
(A) Distribution of individual CDh across-task-epochs ROC areas (cue-side preferences) before same-side SC inactivation; colored bars indicate neurons with significant cue-contra (green; ROC area CI >0.5) and cue-ipsi (purple; ROC area CI <0.5) preferences and gray bars indicate no-preference (ROC area CI ⊂ 0.5); colored-text percentages (and fractions) indicate the percentage (fraction) of units with significant cue-contra (green), significant cue-ipsi (purple), or no significant preferences (gray). (B) Distribution of ROC areas (cue-side preferences) during same-side SC inactivation; presentation as in (A). (C) Distribution of before-inactivation ROC areas (cue-side preferences) restricted to CDh neurons with significant cue-contra preferences (green text indicates number of neurons with this preference); bar heights are identical to green bars in panel (A). (D) Distribution of during-inactivation ROC areas (cue-side preferences) restricted to CDh neurons with significant before-inactivation cue-contra preferences; colored text indicates the proportion (fraction) of units with significant before-inactivation cue-contra preferences that had significant during-inactivation cue-contra preferences (green) or cue-ipsi preferences (purple). (E) Presentation as in (C) but restricted to CDh neurons with no-preference before inactivation. (F) Presentation as in (D) but restricted to CDh neurons with no-preference before inactivation. (G) Presentation as in (C) but restricted to CDh neurons with significant before-inactivation cue-ipsi preferences. (H) Presentation as in (D) but restricted to CDh neurons with significant before-inactivation cue-ipsi preferences.
Figure 3—figure supplement 4
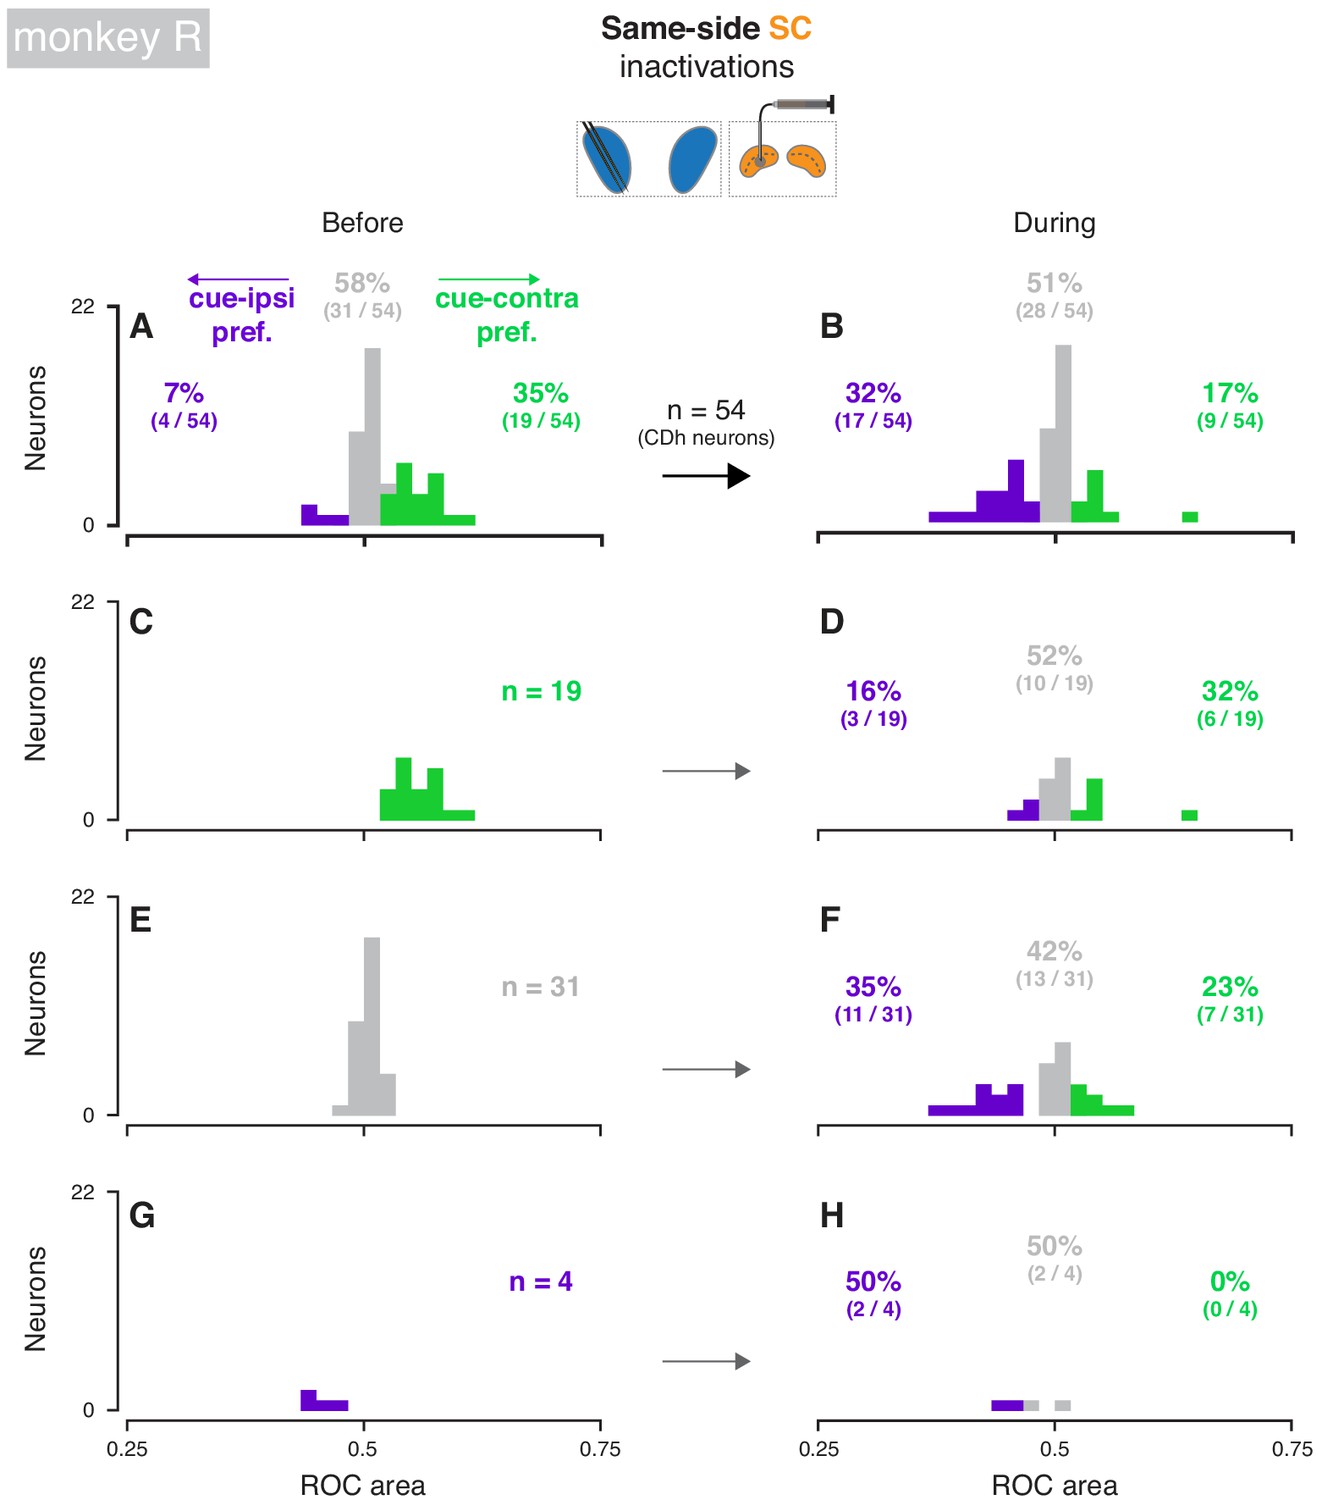
Effects of same-side SC inactivation on cue-side preferences in continuously isolated CDh neuron subpopulation (monkey R).
(A) Distribution of individual CDh across-task-epochs ROC areas (cue-side preferences) before same-side SC inactivation; colored bars indicate neurons with significant cue-contra (green; ROC area CI >0.5) and cue-ipsi (purple; ROC area CI <0.5) preferences and gray bars indicate no-preference (ROC area CI ⊂ 0.5); colored-text percentages (and fractions) indicate the percentage (fraction) of units with significant cue-contra (green), significant cue-ipsi (purple), or no significant preferences (gray). (B) Distribution of ROC areas (cue-side preferences) during same-side SC inactivation; presentation as in (A). (C) Distribution of before-inactivation ROC areas (cue-side preferences) restricted to CDh neurons with significant cue-contra preferences (green text indicates number of neurons with this preference); bar heights are identical to green bars in panel (A). (D) Distribution of during-inactivation ROC areas (cue-side preferences) restricted to CDh neurons with significant before-inactivation cue-contra preferences; colored text indicates the proportion (fraction) of units with significant before-inactivation cue-contra preferences that had significant during-inactivation cue-contra preferences (green) or cue-ipsi preferences (purple). (E) Presentation as in (C) but restricted to CDh neurons with no-preference before inactivation. (F) Presentation as in (D) but restricted to CDh neurons with no-preference before inactivation. (G) Presentation as in (C) but restricted to CDh neurons with significant before-inactivation cue-ipsi preferences. (H) Presentation as in (D) but restricted to CDh neurons with significant before-inactivation cue-ipsi preferences.
Figure 4 with 3 supplements
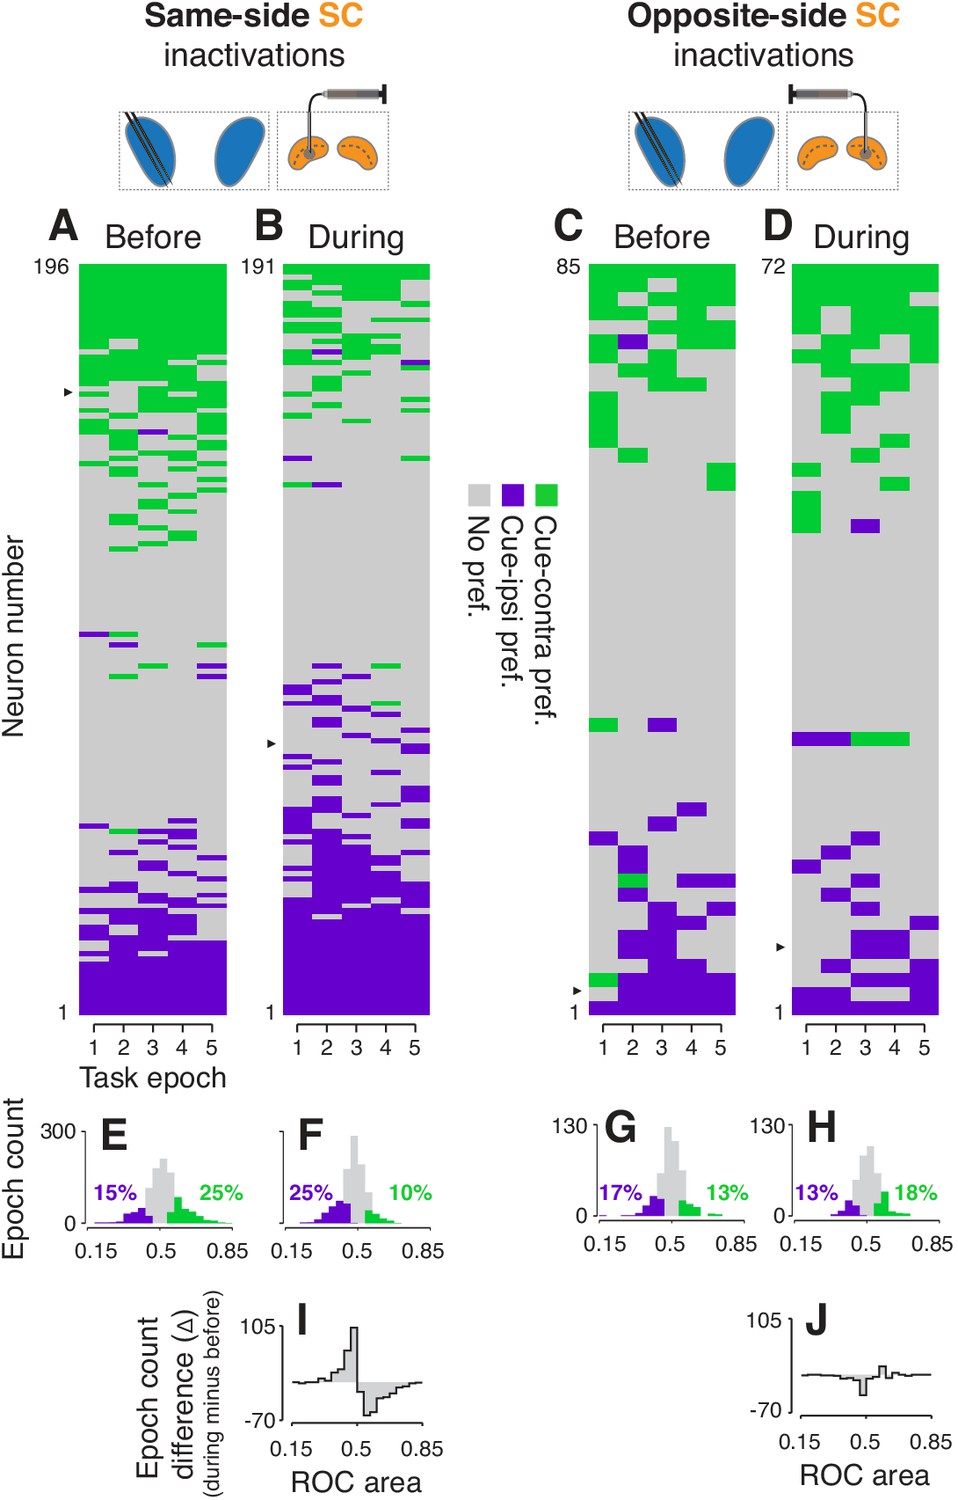
Effects of SC inactivation on cue-side preferences in independent CDh neuron subpopulations.
(A) Cue-side preferences in each task-epoch (columns) for each CDh neuron (rows) recorded before same-side SC inactivation. Green areas indicate significant cue-contra preference, gray areas indicate no significant preference, and purple areas indicate significant cue-ipsi preference. Rows (neurons) are sorted from most cue-contra preference at top to most cue-ipsi preference at bottom. Black arrowhead at left edge indicates the example neuron shown in Figure 2A. (B) Presentation as in panel (A), but for neurons recorded during same-side SC inactivation. Black arrowhead at left edge indicates the example neuron shown in Figure 2B. (C) Presentation as in panel (A), but for neurons recorded before opposite-side SC inactivation. Black arrowhead at left edge indicates the example neuron shown in Figure 2E. (D) Presentation as in panel (A), but for neurons recorded during opposite-side SC inactivation. Black arrowhead at left edge indicates the example neuron shown in Figure 2F. (E) Histogram of ROC areas comparing cue-contra to cue-ipsi for all CDh neurons recorded before same-side SC inactivation, collapsed across task-epochs. Green bars indicate significant cue-contra preferences, and purple bars indicate significant cue-ipsi preferences. Colored text indicates percentages of significant cue-side preference epochs. (F) Presentation as in (E), but for during same-side SC inactivation. (G) Presentation as in (E) but for before opposite-side SC inactivation. (H) Presentation as in (E) but for during opposite-side SC inactivation. (I) Difference-of-histograms plot showing the change in ROC area distribution during same-side SC inactivation. Histogram values in (E) were subtracted from values in (F), ignoring cue-side preferences. (J) Presentation as in (I) but for opposite-side SC inactivation data.
Figure 4—figure supplement 1
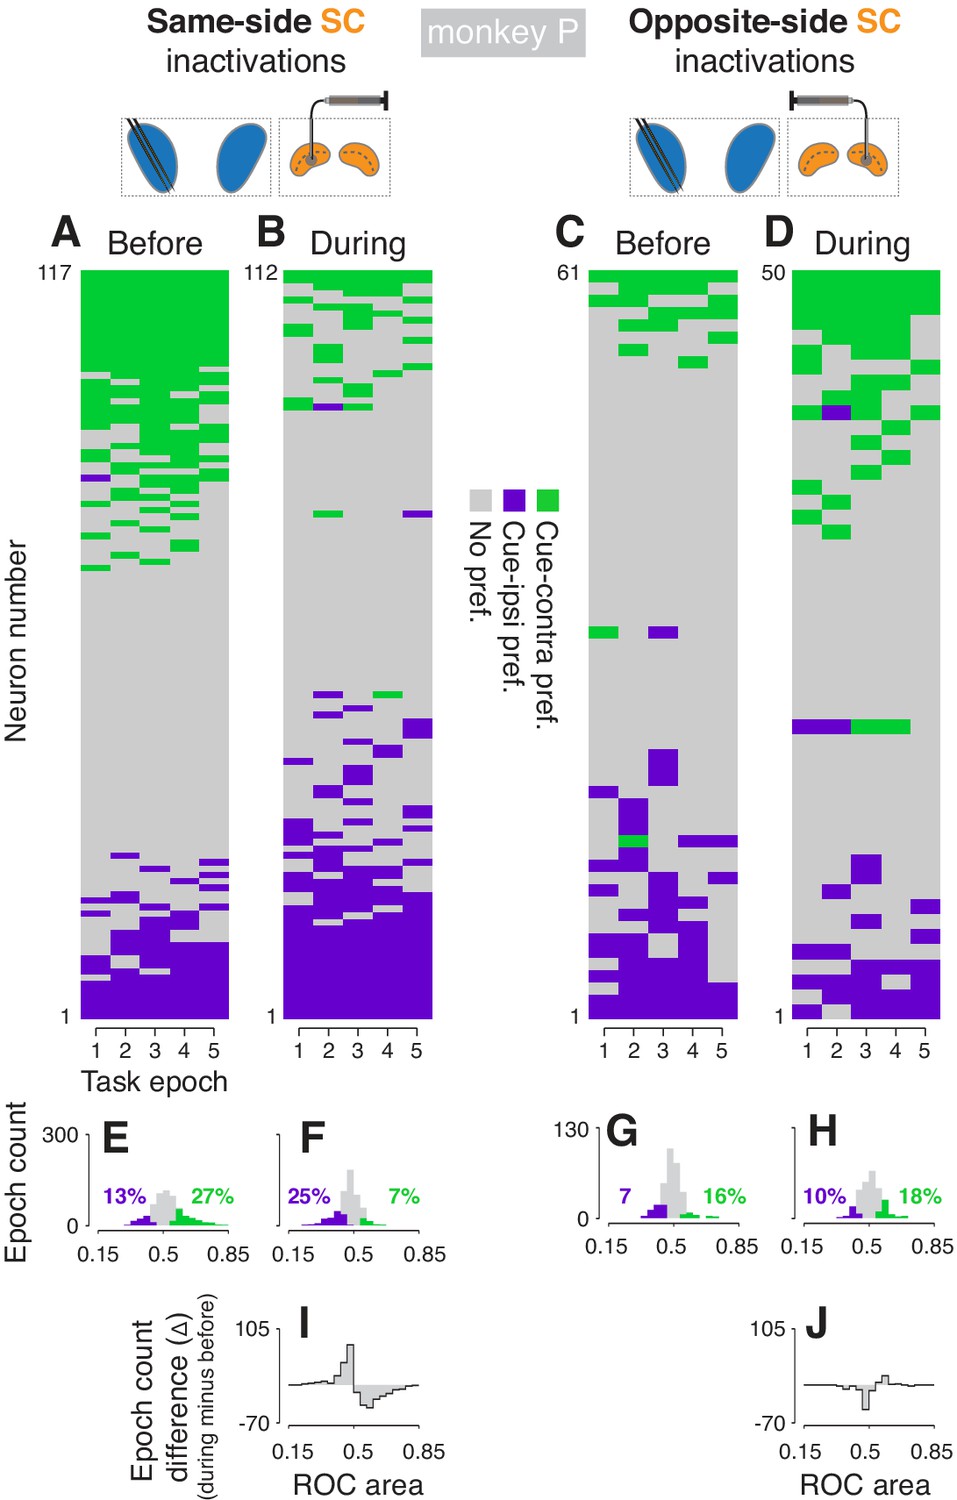
Effects of SC inactivation on cue-side preferences in independent CDh neuron subpopulations (monkey P).
(A) Cue-side preferences in each task-epoch (columns) for each CDh neuron (rows) recorded before same-side SC inactivation. Green areas indicate significant cue-contra preference, gray areas indicate no significant preference, and purple areas indicate significant cue-ipsi preference. Rows (neurons) are sorted from most cue-contra preference at top to most cue-ipsi preference at bottom. Black arrowhead at left edge indicates the example neuron shown in Figure 2A. (B) Presentation as in panel (A), but for neurons recorded during same-side SC inactivation. Black arrowhead at left edge indicates the example neuron shown in Figure 2B. (C) Presentation as in panel (A), but for neurons recorded before opposite-side SC inactivation. Black arrowhead at left edge indicates the example neuron shown in Figure 2E. (D) Presentation as in panel (A), but for neurons recorded during opposite-side SC inactivation. Black arrowhead at left edge indicates the example neuron shown in Figure 2F. (E) Histogram of ROC areas comparing cue-contra to cue-ipsi for all CDh neurons recorded before same-side SC inactivation, collapsed across task-epochs. Green bars indicate significant cue-contra preferences, and purple bars indicate significant cue-ipsi preferences. Colored text indicates percentages of significant cue-side preference epochs. (F) Presentation as in (E), but for during same-side SC inactivation. (G) Presentation as in (E) but for before opposite-side SC inactivation. (H) Presentation as in (E) but for during opposite-side SC inactivation. (I) Difference-of-histograms plot showing the change in ROC area distribution during same-side SC inactivation. Histogram values in (E) were subtracted from values in (F), ignoring cue-side preferences. (J) Presentation as in (I) but for opposite-side SC inactivation data.
Figure 4—figure supplement 2
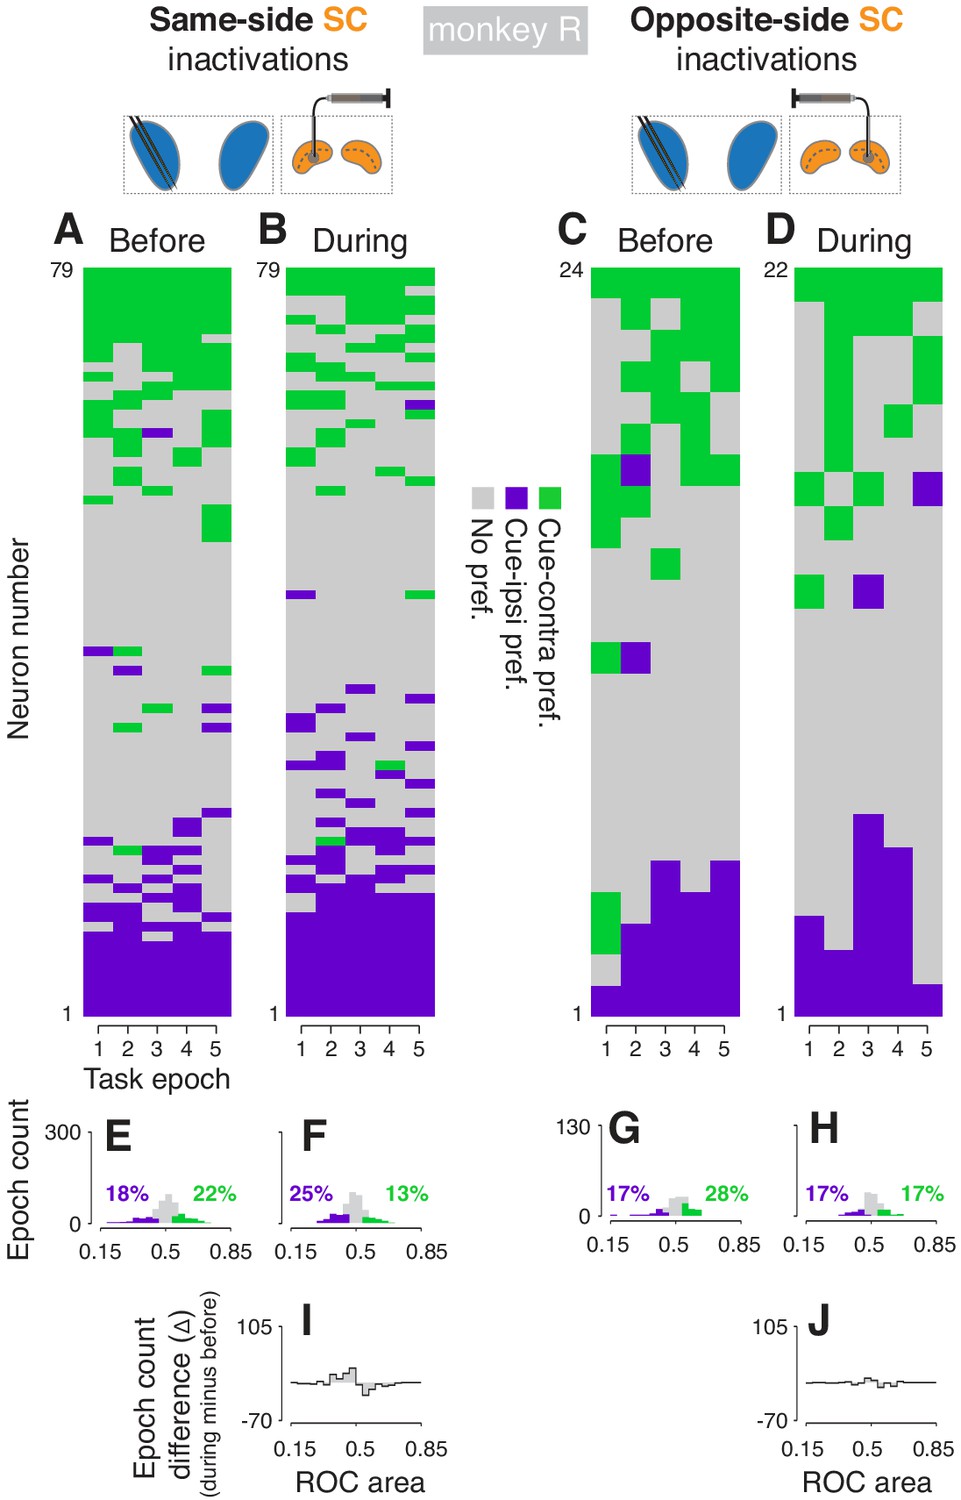
Effects of SC inactivation on cue-side preferences in independent CDh neuron subpopulations (monkey R).
(A) Cue-side preferences in each task-epoch (columns) for each CDh neuron (rows) recorded before same-side SC inactivation. Green areas indicate significant cue-contra preference, gray areas indicate no significant preference, and purple areas indicate significant cue-ipsi preference. Rows (neurons) are sorted from most cue-contra preference at top to most cue-ipsi preference at bottom. Black arrowhead at left edge indicates the example neuron shown in Figure 2A. (B) Presentation as in panel (A), but for neurons recorded during same-side SC inactivation. Black arrowhead at left edge indicates the example neuron shown in Figure 2B. (C) Presentation as in panel (A), but for neurons recorded before opposite-side SC inactivation. Black arrowhead at left edge indicates the example neuron shown in Figure 2E. (D) Presentation as in panel (A), but for neurons recorded during opposite-side SC inactivation. Black arrowhead at left edge indicates the example neuron shown in Figure 2F. (E) Histogram of ROC areas comparing cue-contra to cue-ipsi for all CDh neurons recorded before same-side SC inactivation, collapsed across task-epochs. Green bars indicate significant cue-contra preferences, and purple bars indicate significant cue-ipsi preferences. Colored text indicates percentages of significant cue-side preference epochs. (F) Presentation as in (E), but for during same-side SC inactivation. (G) Presentation as in (E) but for before opposite-side SC inactivation. (H) Presentation as in (E) but for during opposite-side SC inactivation. (I) Difference-of-histograms plot showing the change in ROC area distribution during same-side SC inactivation. Histogram values in (E) were subtracted from values in (F), ignoring cue-side preferences. (J) Presentation as in (I) but for opposite-side SC inactivation data.
Figure 4—figure supplement 3
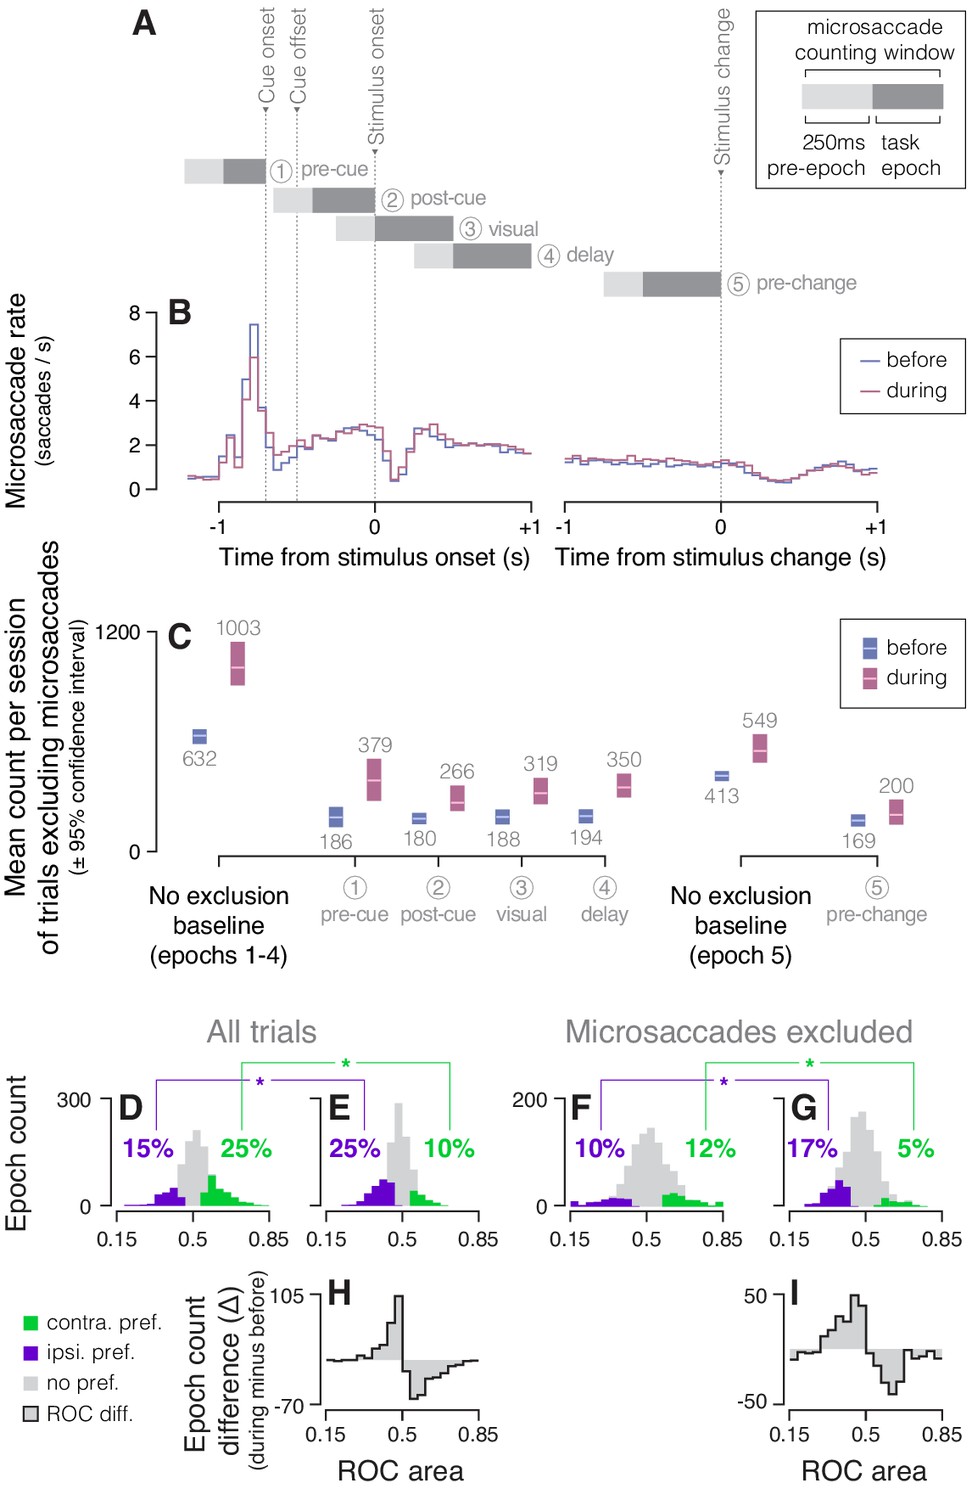
CDh cue-side preference changes during SC inactivation were unrelated to small saccadic eye movements (microsaccades).
(A) For each task-epoch, we chose a subset of trials in which no microsaccades (2°>amplitude > 0.35°) occurred in a time window including a 250 ms pre-epoch (light gray) and the epoch itself (dark gray). Each epoch’s ‘microsaccade counting window’ is shown aligned relative to task events (cue onset, cue offset, stimulus onset, stimulus change; vertical dotted lines). (B) The average microsaccade rate across all trials and sessions (n = 13) in non-overlapping 50 ms bins is plotted aligned to stimulus onset (left) and aligned to stimulus change (right), both before (dark blue) and during (dark red) SC inactivation. (C) Across-sessions (n = 13) mean trial count and bootstrapped 95% confidence intervals with accompanying text of mean count values (light gray); a baseline count of trials with no microsaccade-contingent exclusion indicates the numbers of trials used for data analysis throughout the main text. Separate baselines are presented for epochs 1–4 (including trials with and without a stimulus change) and for epoch 5 (including only trials with a stimulus change). Counts shown for each task-epoch indicate the number of trials with no microsaccades in the corresponding counting window used for the ‘microsaccades excluded’ analysis. (D) Histogram of ROC areas comparing cue-contra to cue-ipsi for all CDh neurons recorded before same-side SC inactivation, collapsed across task-epochs computed on all trials (no microsaccade exclusion). Green bars indicate significant cue-contra preferences, and purple bars indicate significant cue-ipsi preferences. Colored text indicates percentages of task-epochs with significant cue-contra (green) or cue-ipsi (purple) preferences, and asterisks indicate a χ2-proportions test comparing the proportion of significant cue-side epochs before to during SC inactivation yielded a p-value < 0.05 (cue-contra: χ2 = 73.7152, p << 0.01; cue-ipsi: χ2 = 24.2135, p << 0.01). Presentation as in (E), but for during same-side SC inactivation. (F) Presentation as in (D) but computed on the subset of trials with no microsaccades in each counting window (cue-contra: χ2 = 25.2891, p << 0.01; cue-ipsi: χ2 = 18.9124, p << 0.01). (G) Presentation as in (E) but computed on trials with no microsaccades. (H) Difference-of-histograms plot showing the change in ROC area distribution during same-side SC inactivation. Histogram values in (D) were subtracted from values in (E), ignoring cue-side preferences. (I) Presentation as in (H), but from histograms in (F) and (G) (no microsaccades).
Figure 5 with 2 supplements
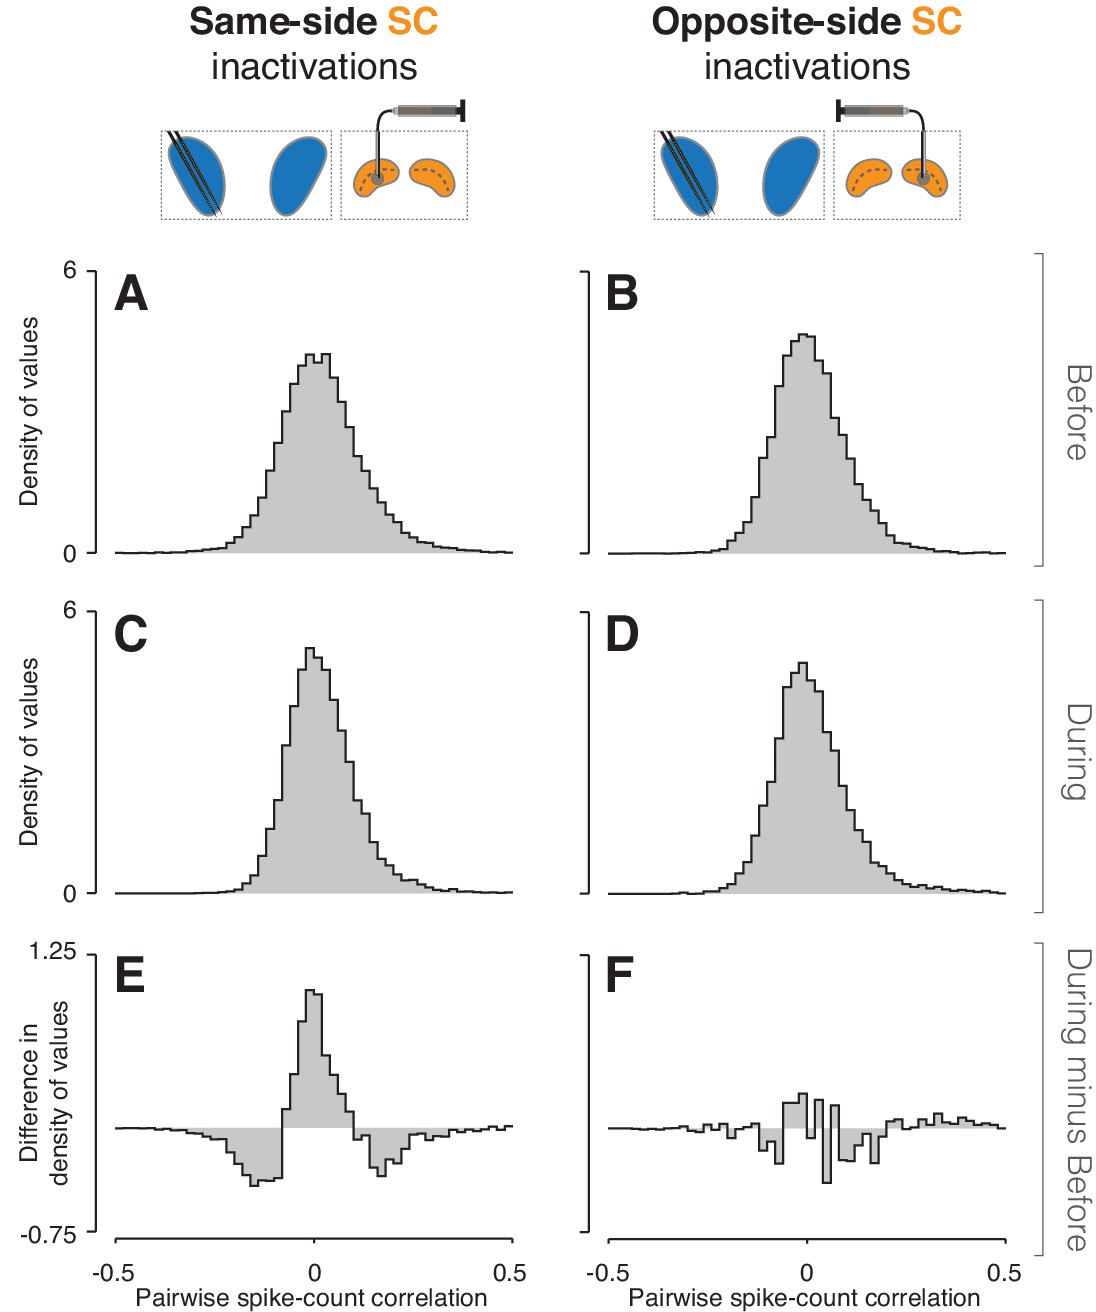
Inactivation effects on CDh pairwise neuronal correlations.
(A) Before same-side SC inactivation density histogram of pairwise spike-count correlations pooled across epochs and cue-side presentations (n = 4280 pairs). (B) Presentation as in (A) but for before opposite-side SC inactivation (n = 2302 pairs). (C) Presentation as in (A) but for during same-side SC inactivation (n = 4042 pairs). (D) Presentation as in (B) but for during opposite-side SC inactivation (n = 1468 pairs). (E) Density histogram difference: during same-side SC inactivation minus before same-side SC inactivation. (F) Presentation as in (E) but for opposite-side SC inactivations.
Figure 5—figure supplement 1
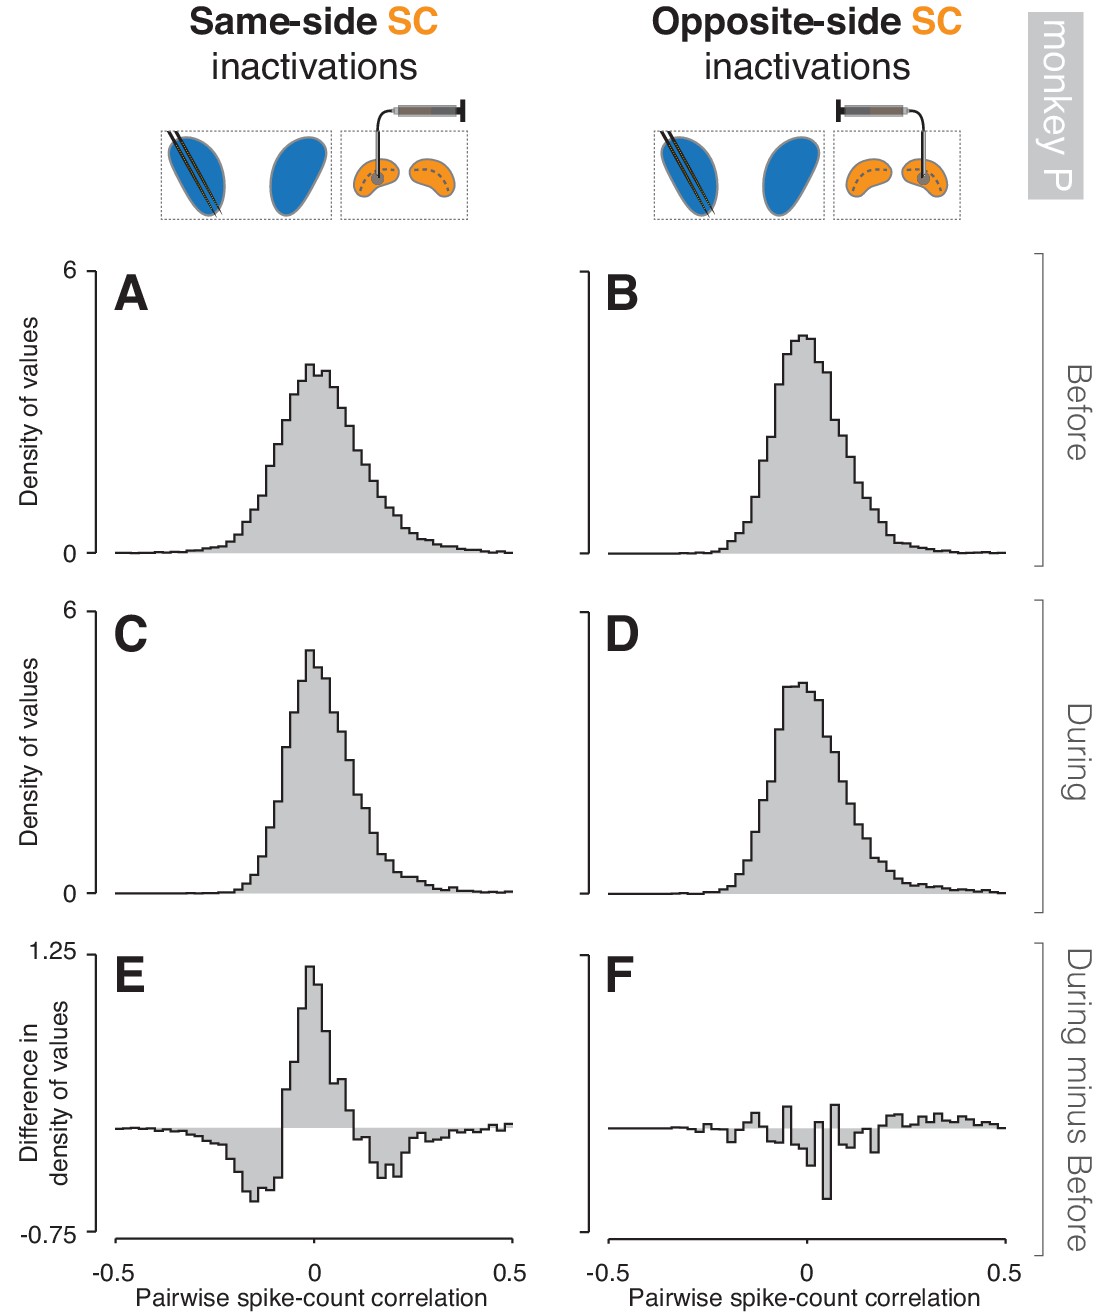
Inactivation effects on CDh pairwise neuronal correlations (monkey P).
(A) Before same-side SC inactivation density histogram of pairwise spike-count correlations pooled across epochs and cue-side presentations (n = 2774 pairs). (B) Presentation as in (A) but for before opposite-side SC inactivation (n = 2006 pairs). (C) Presentation as in (A) but for during same-side SC inactivation (n = 2536 pairs). (D) Presentation as in (B) but for during opposite-side SC inactivation (n = 1216 pairs). (E) Density histogram difference: during same-side SC inactivation minus before same-side SC inactivation. (F) Presentation as in (E) but for opposite-side SC inactivations.
Figure 5—figure supplement 2
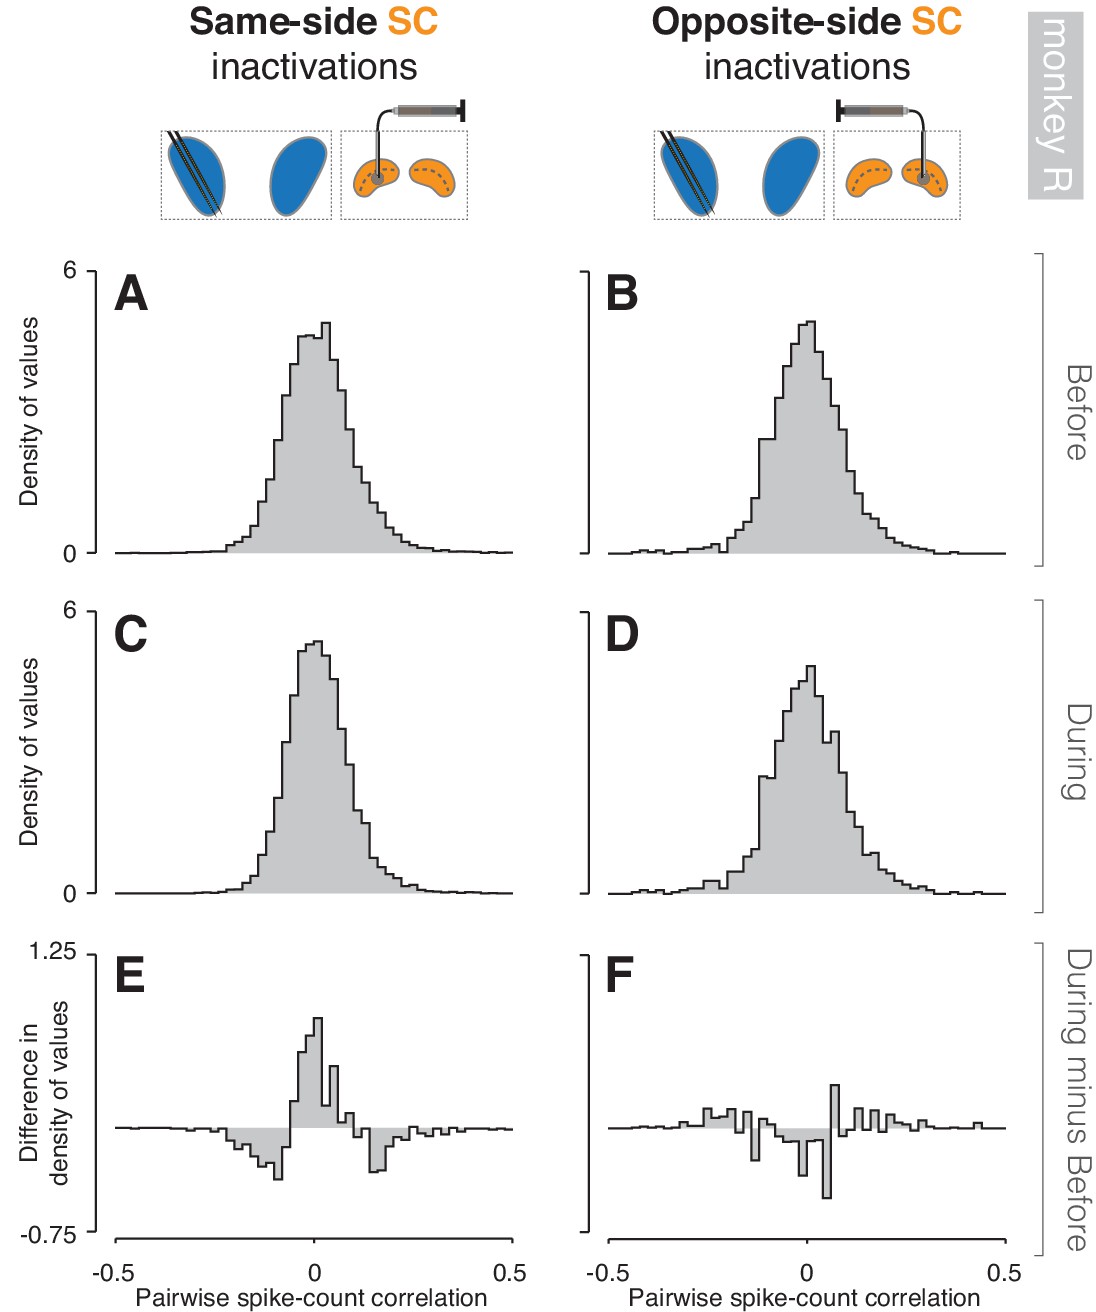
Inactivation effects on CDh pairwise neuronal correlations (monkey R).
(A) Before same-side SC inactivation density histogram of pairwise spike-count correlations pooled across epochs and cue-side presentations (n = 1506 pairs). (B) Presentation as in (A) but for before opposite-side SC inactivation (n = 1506 pairs). (C) Presentation as in (A) but for during same-side SC inactivation (n = 296 pairs). (D) Presentation as in (B) but for during opposite-side SC inactivation (n = 252 pairs). (E) Density histogram difference: during same-side SC inactivation minus before same-side SC inactivation. (F) Presentation as in (E) but for opposite-side SC inactivations.
Figure 6 with 2 supplements

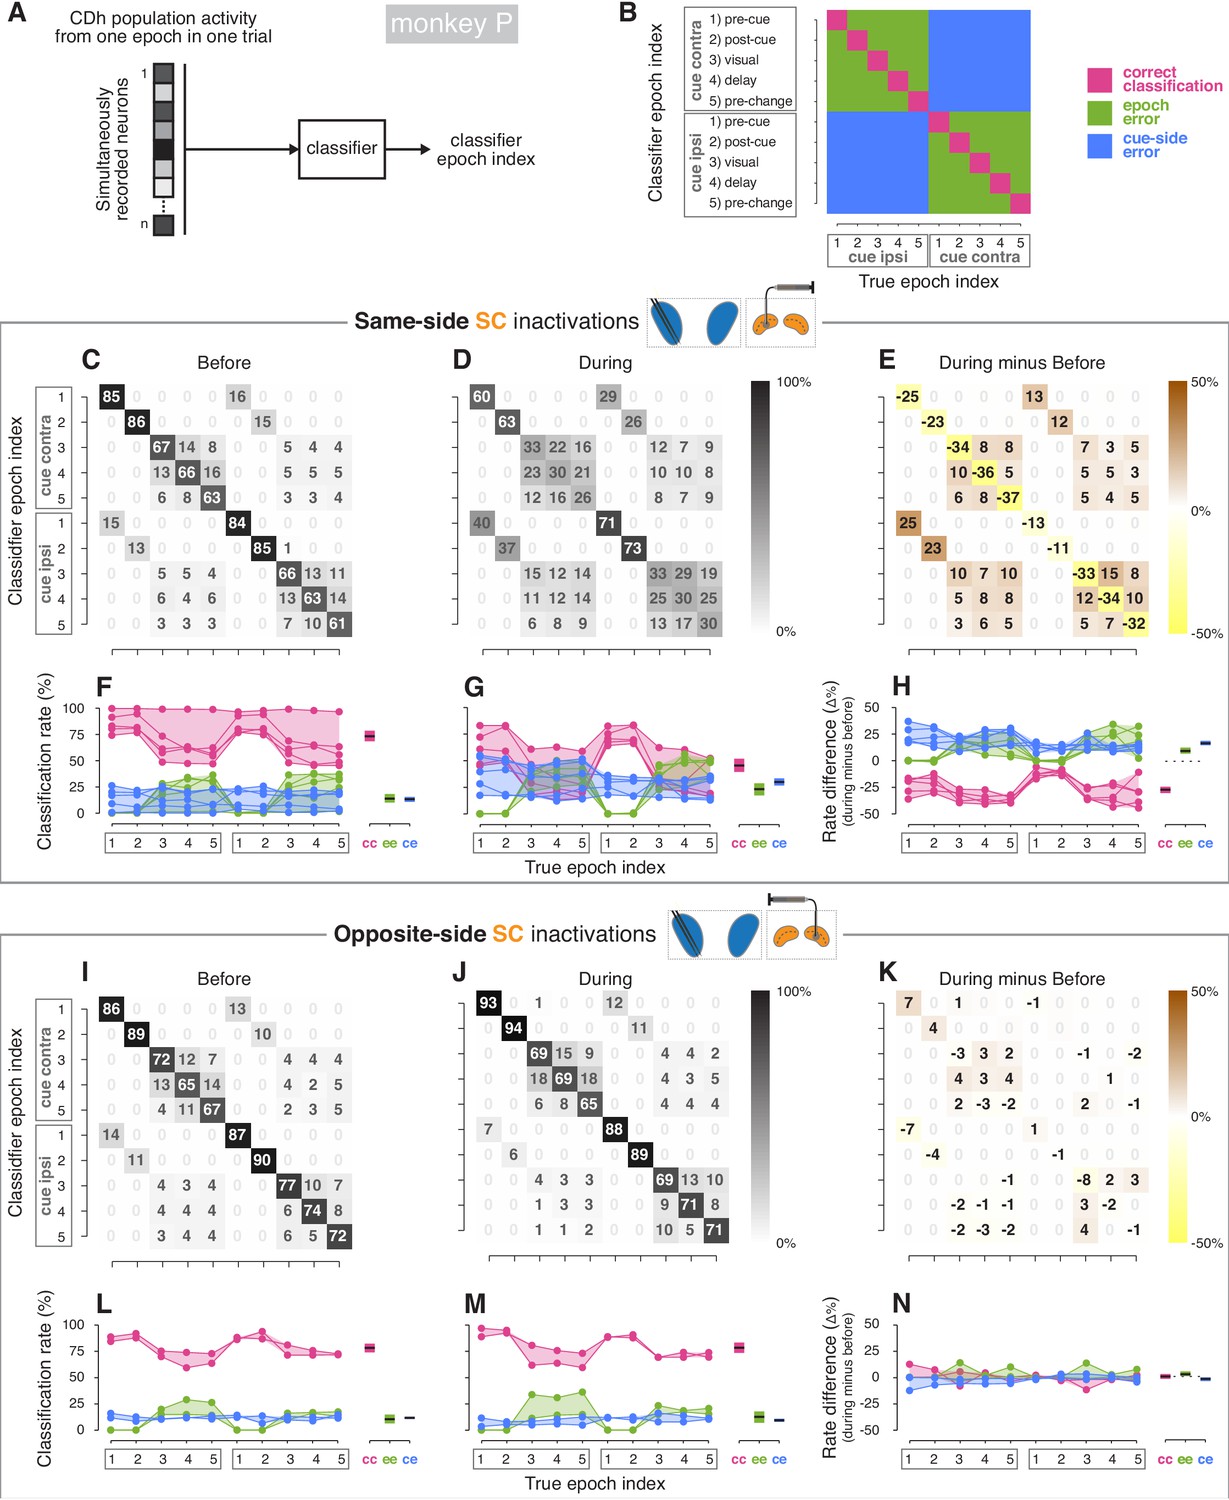
Classifier analyses.
(A) A boosted decision tree classifier took n-dimensional vectors (where n is the number of simultaneously recorded neurons before or during SC inactivation) of CDh neuronal activity from individual epochs in single trials and returned a ‘classifier epoch index’ indicating the classifier’s guess regarding both which task-epoch and which cue-side condition the activity came from. (B) A confusion matrix is traditionally used to show how frequently each possible classifier epoch index (vertical axis) is applied for each true epoch index. Here we have additionally color-coded a confusion matrix to highlight three categories of classification outcome: (1) correct classifications (magenta), (2) cue-side misclassifications (blue), and (3) epoch misclassifications (green). (C) Across sessions aggregated cross-validated confusion matrix before same-side SC inactivation. Cell shading starts at white for 0% with larger values grading darker up to black at 100%. For each ‘true epoch index’ column (for example, ‘pre-cue cue-contra’ in column 1), the numeral in each row is the (rounded) percentage of times classifiers assigned that row’s class label to all inputs of that column’s input (true) class. For example, the number 81 in the 1st row and 1st column indicates that, across classifiers/sessions, when classifiers were given ‘pre-cue cue-contra’ input vectors, 81% of those vectors were labelled as ‘pre-cue cue-contra’; the number 19 in column 1, row six indicates that the remaining 19% of the time, classifiers erroneously labelled ‘pre-cue cue- contra’ activity vectors as ‘pre-cue cue-ipsi’. (D) Presentation as in (C) but for during same-side SC inactivation. (E) Difference of aggregated confusion matrixes (during minus before). Cell color mapping starts at saturated yellow for −50% with larger values grading to white at 0%, followed by increasing positive values grading up to saturated brown at +50%. (F) Left: per-session breakdown of classifier performance with classification rates divided into outcome categories shown in panel (B). Connected dots are from a single session. For each true epoch index on the horizontal axis, colored dots show the percentage of times the single-session classifier epoch index fell into one of the three classification categories defined in (B) (correct classification, epoch misclassification, cue-side misclassification). Right: per-category breakdown of mean classification rates across sessions and true epoch indexes; cc: correct classifications, ee: epoch errors, ce: cue-side errors. Shaded areas indicate 95% bootstrapped confidence intervals on mean from individual session classification rates. (G) Presentation as in panel (F), but for during same-side SC inactivations. (H) Left: per-session differences in classification categories (during minus before). Right: per-category breakdown of difference in mean classification rates across sessions and true epoch indexes. Dotted line marks 0. (I–N) Presentation as in panels (C–H) but for opposite-side SC inactivation sessions.
Figure 6—figure supplement 1
Classifier analyses (monkey P).
(A) A boosted decision tree classifier took n-dimensional vectors (where n is the number of simultaneously recorded neurons before or during SC inactivation) of CDh neuronal activity from individual epochs in single trials and returned a ‘classifier epoch index’ indicating the classifier’s guess regarding both which task-epoch and which cue-side condition the activity came from. (B) A confusion matrix is traditionally used to show how frequently each possible classifier epoch index (vertical axis) is applied for each true epoch index. Here we have additionally color-coded a confusion matrix to highlight three categories of classification outcome: (1) correct classifications (magenta), (2) cue-side misclassifications (blue), and (3) epoch misclassifications (green). (C) Across sessions aggregated cross-validated confusion matrix before same-side SC inactivation. Cell shading starts at white for 0% with larger values grading darker up to black at 100%. For each ‘true epoch index’ column (for example, ‘pre-cue cue-contra’ in column 1), the numeral in each row is the (rounded) percentage of times classifiers assigned that row’s class label to all inputs of that column’s input (true) class. For example, the number 85 in the 1st row and 1st column indicates that, across classifiers/sessions, when classifiers were given ‘pre-cue cue-contra’ input vectors, 85% of those vectors were labelled as ‘pre-cue cue-contra’; the number 15 in column 1, row six indicates that the remaining 15% of the time, classifiers erroneously labelled ‘pre-cue cue- contra’ activity vectors as ‘pre-cue cue-ipsi’. (D) Presentation as in (C) but for during same-side SC inactivation. (E) Difference of aggregated confusion matrixes (during minus before). Cell color mapping starts at saturated yellow for −50% with larger values grading to white at 0%, followed by increasing positive values grading up to saturated brown at +50%. (F) Left: per-session breakdown of classifier performance with classification rates divided into outcome categories shown in panel (B). Connected dots are from a single session. For each true epoch index on the horizontal axis, colored dots show the percentage of times the single-session classifier epoch index fell into one of the three classification categories defined in (B) (correct classification, epoch misclassification, cue-side misclassification). Right: per-category breakdown of mean classification rates across sessions and true epoch indexes; cc: correct classifications, ee: epoch errors, ce: cue-side errors. Shaded areas indicate 95% bootstrapped confidence intervals on mean from individual session classification rates. (G) Presentation as in panel (F), but for during same-side SC inactivations. (H) Left: per-session differences in classification categories (during minus before). Right: per-category breakdown of difference in mean classification rates across sessions and true epoch indexes. Dotted line marks 0. (I–N) Presentation as in panels (C–H) but for opposite-side SC inactivation sessions.
Figure 6—figure supplement 2

Classifier analyses (monkey R).
(A) A boosted decision tree classifier took n-dimensional vectors (where n is the number of simultaneously recorded neurons before or during SC inactivation) of CDh neuronal activity from individual epochs in single trials and returned a ‘classifier epoch index’ indicating the classifier’s guess regarding both which task-epoch and which cue-side condition the activity came from. (B) A confusion matrix is traditionally used to show how frequently each possible classifier epoch index (vertical axis) is applied for each true epoch index. Here we have additionally color-coded a confusion matrix to highlight three categories of classification outcome: (1) correct classifications (magenta), (2) cue-side misclassifications (blue), and (3) epoch misclassifications (green). (C) Across sessions aggregated cross-validated confusion matrix before same-side SC inactivation. Cell shading starts at white for 0% with larger values grading darker up to black at 100%. For each ‘true epoch index’ column (for example, ‘pre-cue cue-contra’ in column 1), the numeral in each row is the (rounded) percentage of times classifiers assigned that row’s class label to all inputs of that column’s input (true) class. For example, the number 77 in the 1st row and 1st column indicates that, across classifiers/sessions, when classifiers were given ‘pre-cue cue-contra’ input vectors, 77% of those vectors were labelled as ‘pre-cue cue-contra’; the number 23 in column 1, row six indicates that the remaining 23% of the time, classifiers erroneously labelled ‘pre-cue cue-contra’ activity vectors as ‘pre-cue cue-ipsi’. (D) Presentation as in (C) but for during same-side SC inactivation. (E) Difference of aggregated confusion matrixes (during minus before). Cell color mapping starts at saturated yellow for −50% with larger values grading to white at 0%, followed by increasing positive values grading up to saturated brown at +50%. (F) Left: per-session breakdown of classifier performance with classification rates divided into outcome categories shown in panel (B). Connected dots are from a single session. For each true epoch index on the horizontal axis, colored dots show the percentage of times the single-session classifier epoch index fell into one of the three classification categories defined in (B) (correct classification, epoch misclassification, cue-side misclassification). Right: per-category breakdown of mean classification rates across sessions and true epoch indexes; cc: correct classifications, ee: epoch errors, ce: cue-side errors. Shaded areas indicate 95% bootstrapped confidence intervals on mean from individual session classification rates. (G) Presentation as in panel (F), but for during same-side SC inactivations. (H) Left: per-session differences in classification categories (during minus before). Right: per-category breakdown of difference in mean classification rates across sessions and true epoch indexes. Dotted line marks 0. (I–N) Presentation as in panels (C–H) but for opposite-side SC inactivation sessions.
Additional files
Download links
A two-part list of links to download the article, or parts of the article, in various formats.
Downloads (link to download the article as PDF)
Open citations (links to open the citations from this article in various online reference manager services)
Cite this article (links to download the citations from this article in formats compatible with various reference manager tools)
Attention-related modulation of caudate neurons depends on superior colliculus activity
eLife 9:e53998.
https://doi.org/10.7554/eLife.53998


