Intracellular calcium leak lowers glucose storage in human muscle, promoting hyperglycemia and diabetes
- Department of Physiology and Biophysics, Rush University Medical Center, United States
- Malignant Hyperthermia Investigation Unit (MHIU) of the University Health Network (Canada), Canada
- Department of Anaesthesia & Pain Management, Toronto General Hospital, UHN, University of Toronto, Canada
- Cell Biology Program, The Hospital for Sick Children, Canada
Figures
Figure 1 with 1 supplement

Glycemia and susceptibility to Malignant Hyperthermia.
(A) FH (muscle force in response to 3% halothane) vs. FBS in 560 subjects studied between the years 2009 and 2013 (the ‘legacy cohort’). Data for those with FH > 0.6 g, deemed susceptible to MH (‘MHS’), are represented in red. The linear best fit (solid line) yields a regression coefficient (slope) of 0.17 mM/g; the correlation coefficient r = 0.21, p of no correlation is < 0.001. Inset, distribution of FH in all patients. (B) Box plot of data in A. The means (S.E.M.) in mM, are 5.49 (0.090) for MH-negatives (‘MHN’) and 5.95 (0.088) for MHS; in a rank-sum (u) test, p of no difference is < 0.001. (C) FBS correlation with age. r = 0.23 and p is < 0.001 for both MHN and MHS; slopes are similar, 0.026 and 0.023 mM/yr respectively, which reflects an age-independent effect of the MHS condition. (D) FBS correlation with BMI. For MHN, r = 0.31; for MHS, r = 0.33; p < 0.001 for both. The regression coefficient is higher for MHN than MHS (0.081 and 0.066 mM/unit respectively). (E) Number of patients in four age bins delimited by the green lines. Black/white bars represent MHN and red-tone bars MHS individuals. Number of subjects with FBS ≥ 6 mM are represented by the upper segment of the bars. (F) Percentage of the total number in each bin and CHCT class. The fraction of patients with high FBS increases with age but the excess in MHS persists.
Figure 1—figure supplement 1
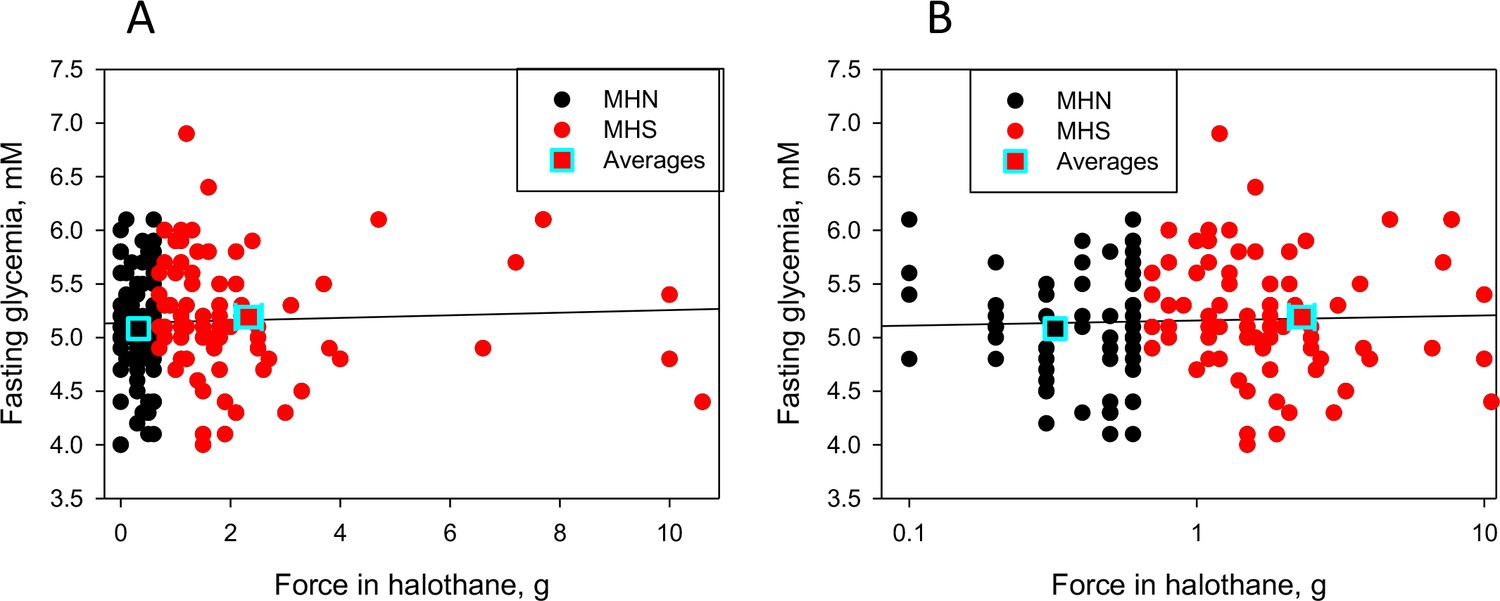
Response to halothane vs. FBS in members of the ‘recent’ cohort.
(A) FBS vs. force in response to halothane, FH, in muscle biopsies of the 78 MHN and 80 MHS patients of the 'recent' cohort (all patients for which we had data on 03-16-20). (B) Semilogarithmic plot of the same variables. MHS are defined by FH ≥ 0.7 g and/or force in caffeine, FC ≥ 0.3 g. The averages (5.08 for MHN and 5.22 for MHS, S.E.M. 0.06 and 0.06) were not significantly different (p = 0.12 in two-tailed t test). The regression coefficient b is 0.048 g/mM. 3 MHN and 4 MHS subjects had FBS > 6.0 mM.
Figure 2 with 5 supplements
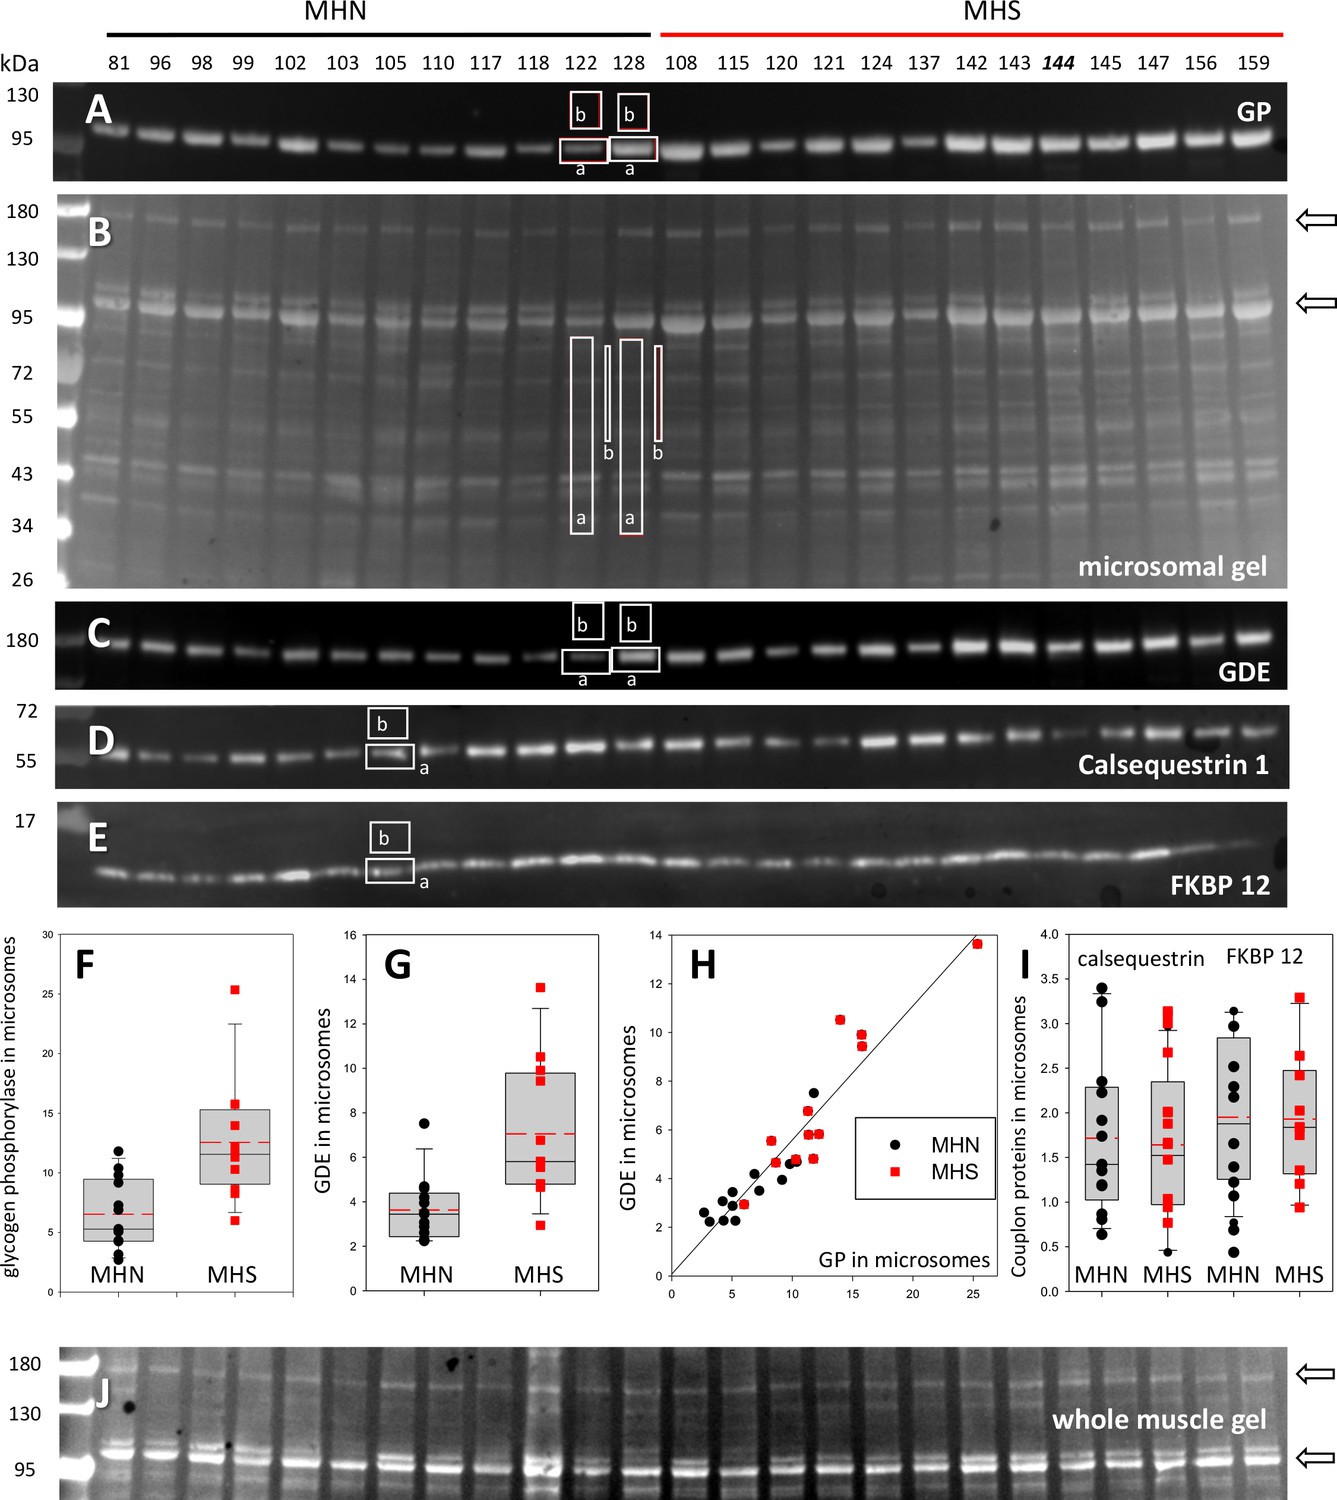
Protein content in patients’ microsomes.
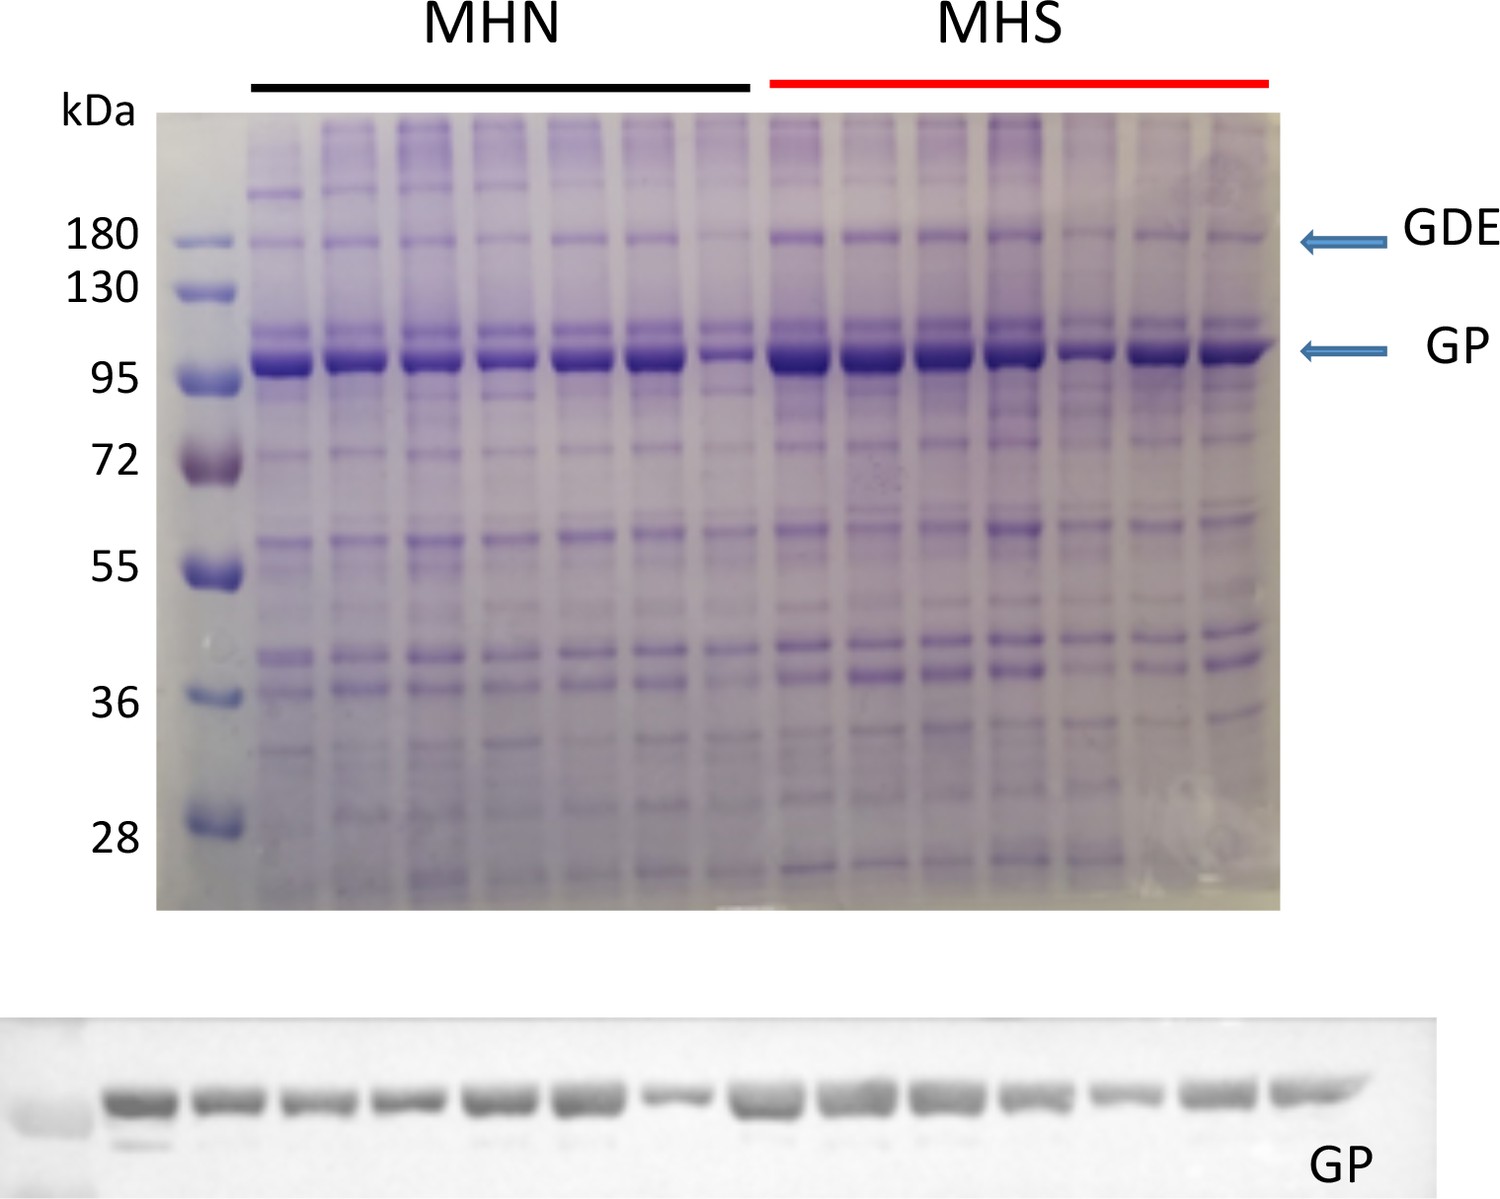
(A) Western blot analysis of glycogen phosphorylase (GP) for 25 subjects, in a luminescence scale with black as 0 and white as saturating value. The numbers above each lane are patient identifiers that apply to all 25-lane gels shown in the article. The twelve lanes under the black bar have protein from MHN patients; those under the red bar are from MHS patients, except #144, which was reclassified as MHN. (B) Ponceau-stained gel that originated all blots in the figure. A and B illustrate our custom quantitative analysis. The content of every protein quantified in blots was calculated as the signal mass within region a above background (average level in b). Content was normalized for quantity of preparation in the lane dividing by the signal similarly calculated in the gel in B. The signal in B is computed in a large area of the lane to average multiple proteins in the fraction. The method is fully demonstrated in Video 1. Arrows in B mark two bands, near 100 and 180 kDa, with a visibly greater signal in the MHS group. Their main components were GP and glycogen debranching enzyme (GDE) respectively. (C–E) Western blots of GDE, calsequestrin 1 and FKBP12 in different sections of gel B (identified by molecular weight markers at left). (F and G) Box plots of GP and GDE content. In both cases the content was greater on average for MHS and the differences significant (data in Table 1). (H) GP vs. GDE in blots A and C; r = 0.94; p < 10−4. (I) Comparing content of calsequestrin 1and FKBP12. The differences are not significant (Table 1). (J) Detail of a whole tissue gel of the same patients, to show lack of visible differences between MHS and MHN in region of GP and GDE (arrows). The contrast is highly increased to show bands. Full gel in whole tissue is in Figure 2—figure supplement 1; proportionality of signal and protein quantity in Figure 2—figure supplement 2, the technique to derive blots for multiple proteins from the same gel in Figure 2—figure supplement 3. Direct quantification of proteins in the gel in Figure 2—figure supplement 4 and the distribution of SERCA1 in microsomes in Figure 2—figure supplement 5.
Figure 2—figure supplement 1
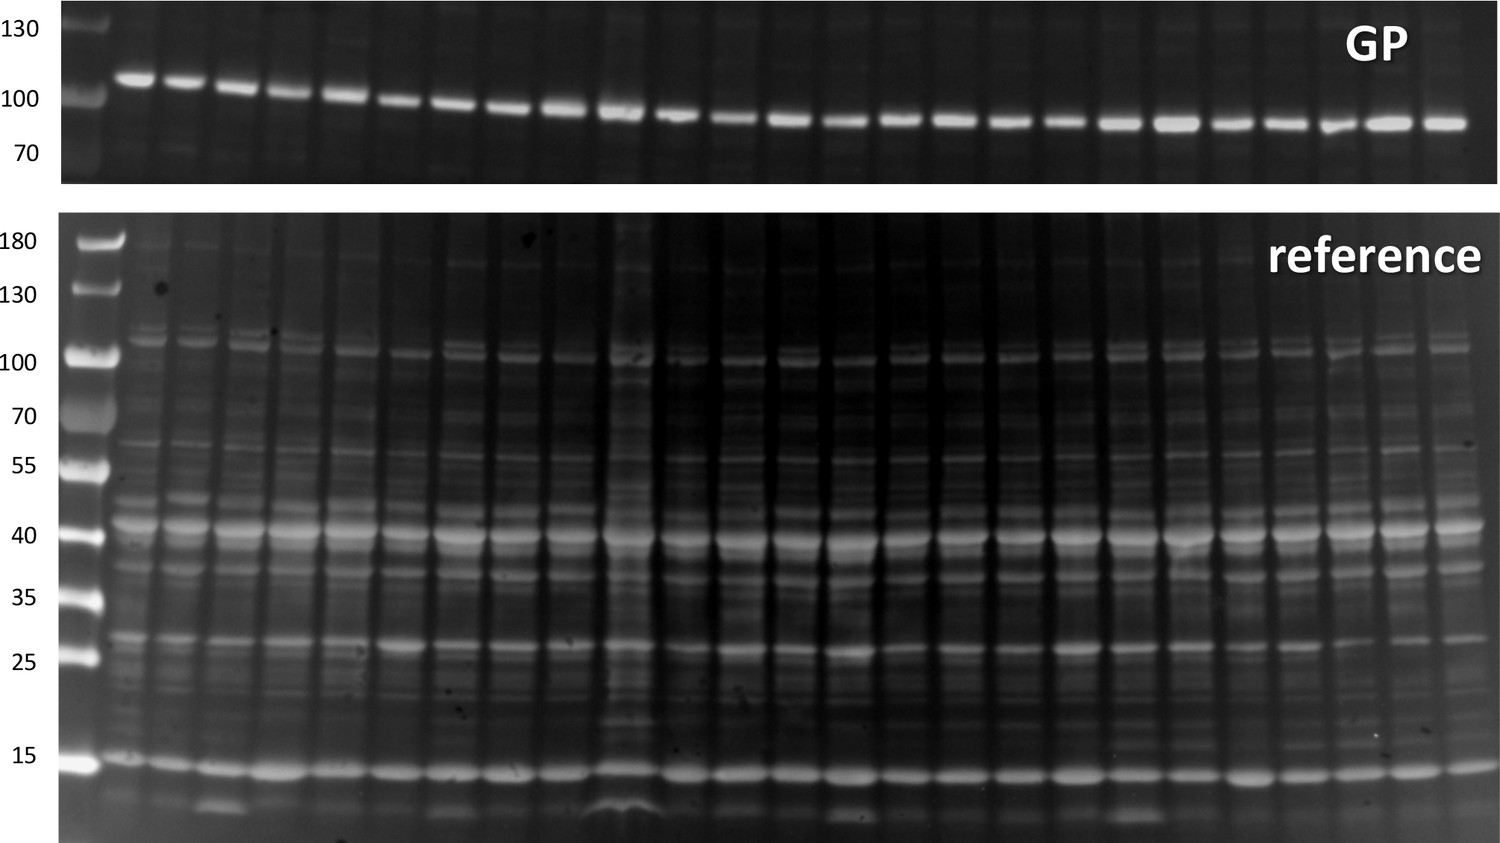
Glycogen Phosphorylase in whole tissue extract.
Top, Western blot of all-forms GP. Bottom, gel of whole tissue extract. Quantification is done as described with text Figure 2.
Figure 2—figure supplement 2
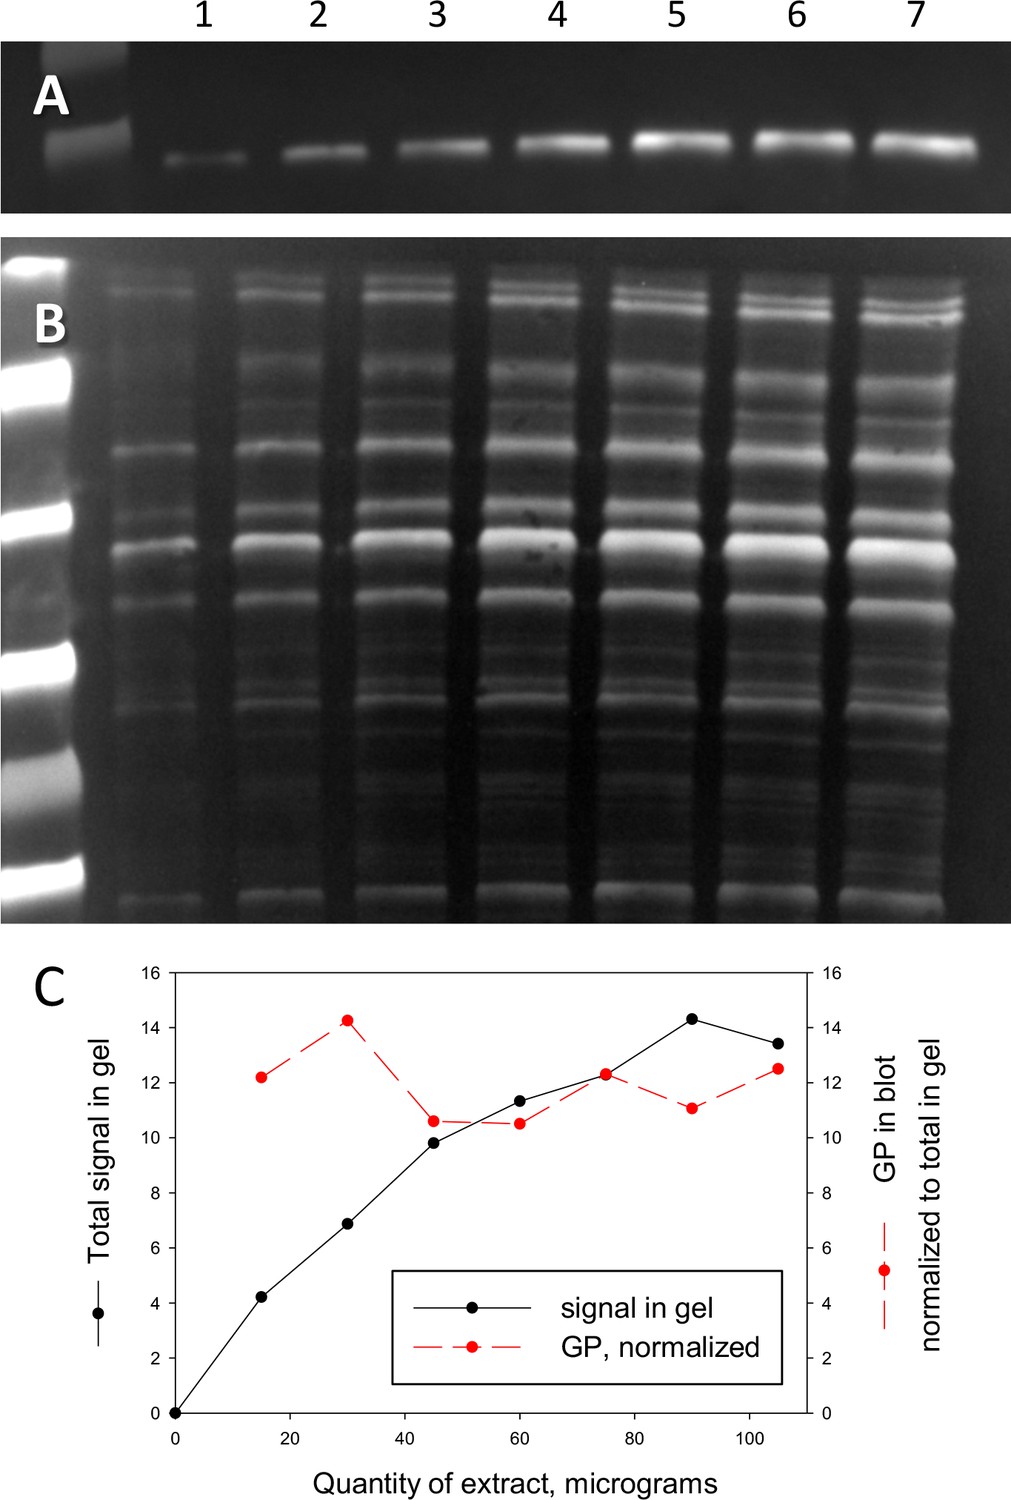
Relationship between blot signal and quantity of protein.
(A) Western blot of all-forms GP. (B) The originating electrophoretic gel. Increasing quantities of extract, in μg, were added to lanes as follows: 1–15, 2–30, 3–45, 4–60, 5–75, 6–90, 7–105. (C) Black symbols: the signal in the gel, quantified as described for text Figure 2; red: the blot signal, normalized by that in the gel. While the protein signal exhibits saturation (a well-known phenomenon Janes, 2015), the normalized blot signal (red) is approximately constant.
Figure 2—figure supplement 3
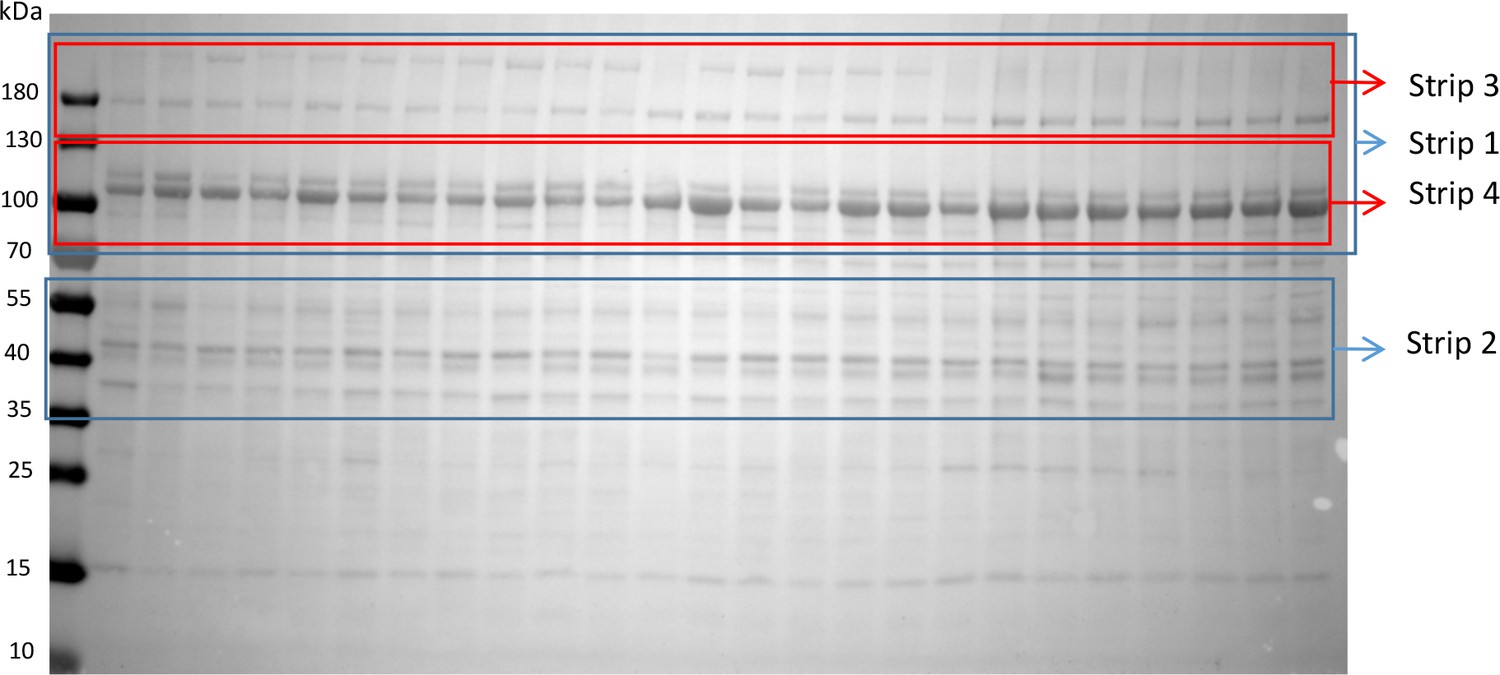
Procedure to derive blots for multiple proteins from the same gel.
Note pre-stained molecular weight markers. The nitrocellulose membrane was cut into strips. The position of cuts, placed to make strips that contained the stained band(s) of interest plus a suitable background region and markers, was determined by staining full length test membranes with antibodies of proteins of interest. The process could be iterated by further splitting ‘primary’ strips for staining of additional proteins on successive days. Each strip was washed extensively with 1X PBS containing 0.1% Tween before subsequent staining. Ranges of primary strips are delineated in blue and secondary ones in red. Example: Primary strips 1 and 2 (180–70 and 55–35 kDa) were cut first to detect PhK and GLUT4. Secondary strips 3 and 4 (180–130 and 130–70) were used on day 2, to detect GDE and GPa. To avoid mutual interference GP all-forms and GPa were detected in separate gels.
Figure 2—figure supplement 4
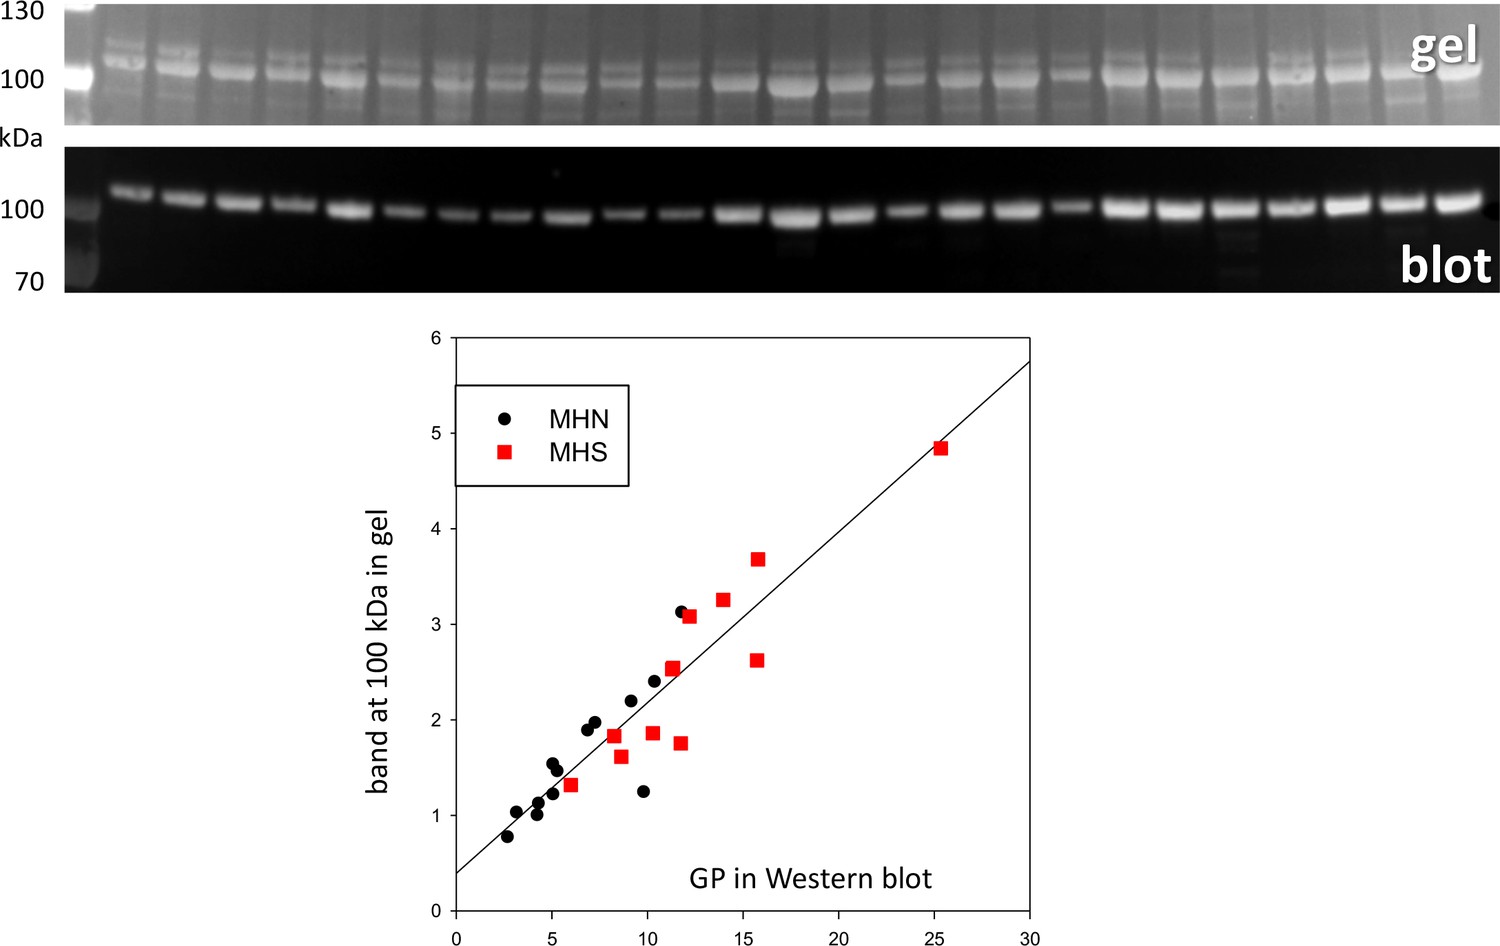
Direct quantification of GP in Ponceau-stained gel.
Top: gel of microsomal fraction. Middle: GP Western blot of same gel. The band at ~95 kDa was quantified in the gel using as reference for each lane the signal above background in the reference region marked in text Figure 2 for the corresponding lane. The graph plots the result vs. the quantity measured in the Western blot, evaluated by the procedure described with text Figure 2. r = 0.93.
Figure 2—figure supplement 5
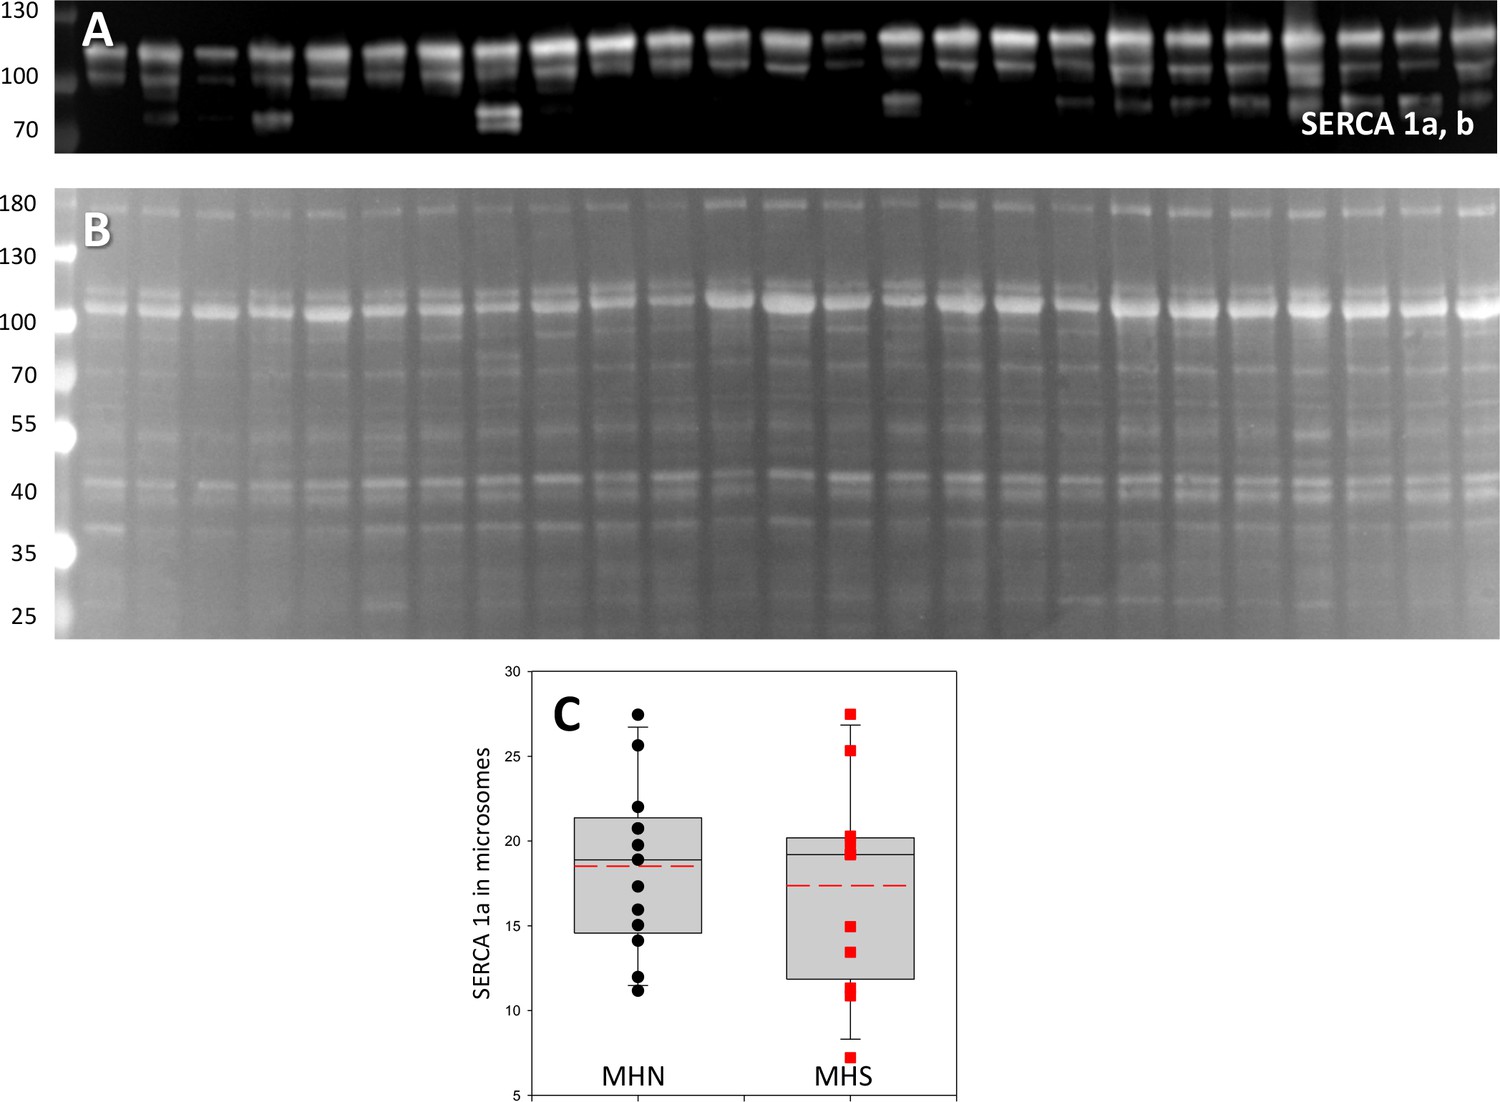
The distribution of SERCA 1.
(A) Western blot of SERCA1, which stains two isoforms. (B) Originating gel. The distribution of isoform a (the most intense band in A), was similar in MHN and MHS (p=0.61; Table 1). Isoform b was also similar (Table 1). The originating gel was also used for the Western blot of FKBP12 shown in Figure 2.
Figure 3 with 1 supplement
Phosphorylation of glycogen phosphorylase.
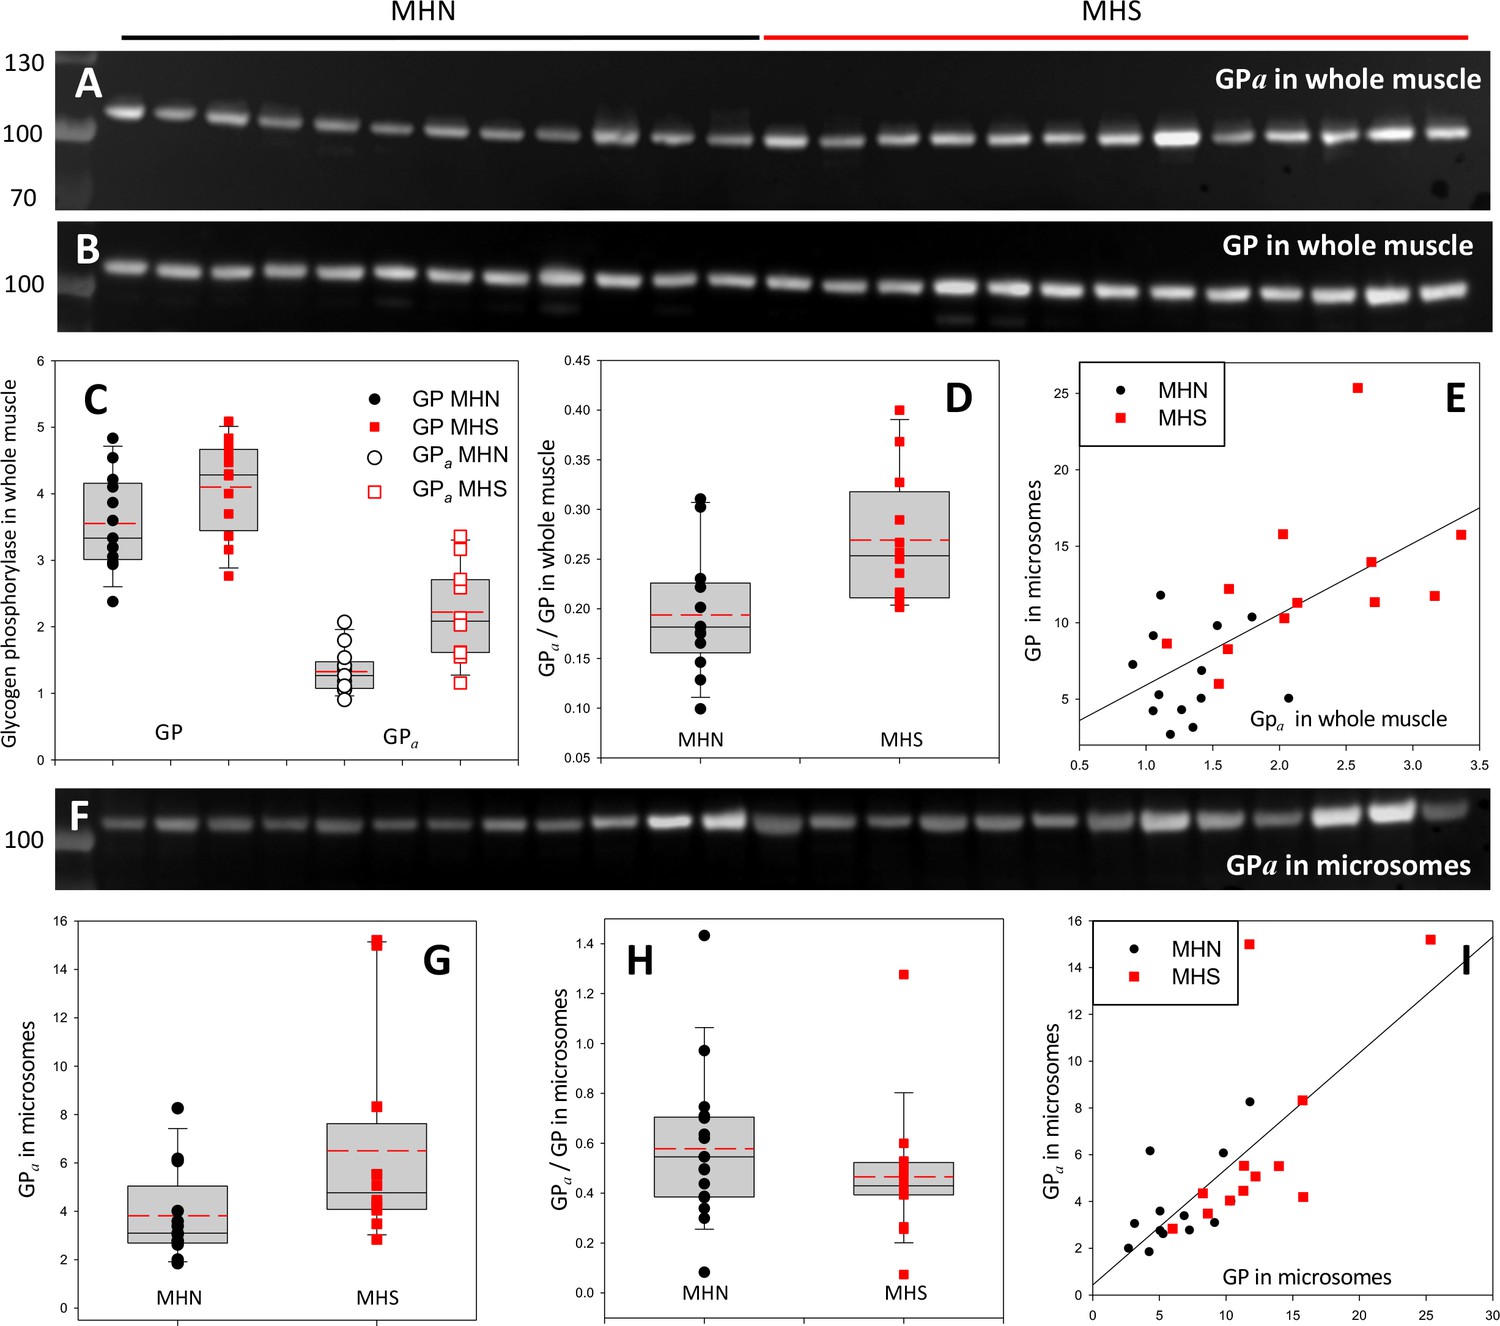
(A, B) Western blots of 13 MHN and 12 MHS whole tissue lysates, identified in Figure 2. Blots were derived from different gels loaded with aliquots of the same preparations. Originating gels for this blot and others are in Figure 3—figure supplement 1. (C) The distribution of band signals in blots A and B. Statistical measures are listed in Table 1. GP (all-forms) and GPa were higher in the MHS (p=0.07 for GP and 3 10−4 for GPa). (D) The median content ratio GPa/GP was 42% higher in the MHS (p = 0.005). (E) Cross-plot demonstrating correlation between GPa content in whole muscle and GP in microsomes (r = 0.64, p = 5 10−4). (F) Western blot of GPa in the microsomal fractions studied in Figure 2. (G, H) Distributions of GPa in blot F and of the content ratio GPa/GP (the all-forms GP content was determined with blot A of Figure 2). GPa was higher by 71% (p = 0.05) but the phosphorylation ratio did not change significantly in the microsomal fraction (p = 0.28). (I) GPa vs. GP in microsomes. The correlation is high and highly significant (r = 0.72, p < 10−4.).
Figure 3—figure supplement 1
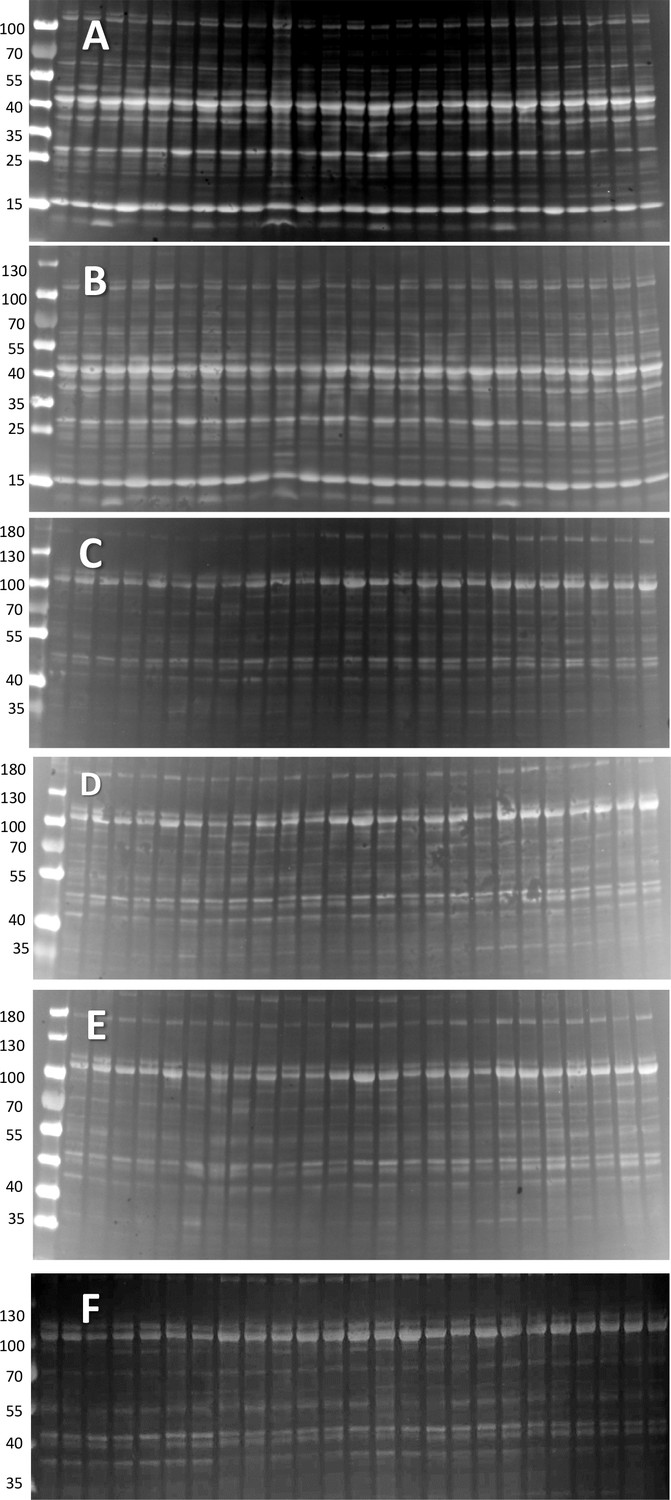
Protein gels for blots.
(A, B) Ponceau-stained whole tissue extract gels used to derive Western blots of PhK, GPa and GDE (A) and all-forms GP (B). C-F. Ponceau-stained microsomal extract gels used to derive Western blots of GS (C), GSa (D), GDE (E) and GLUT4 and Casq1 (F). The signal in each lane was used as reference of quantity of total protein in evaluating the protein content in the corresponding band of the Western blot (described in text Figure 2).
Figure 4 with 1 supplement
Locating phosphorylated and apo forms of glycogen phosphorylase.
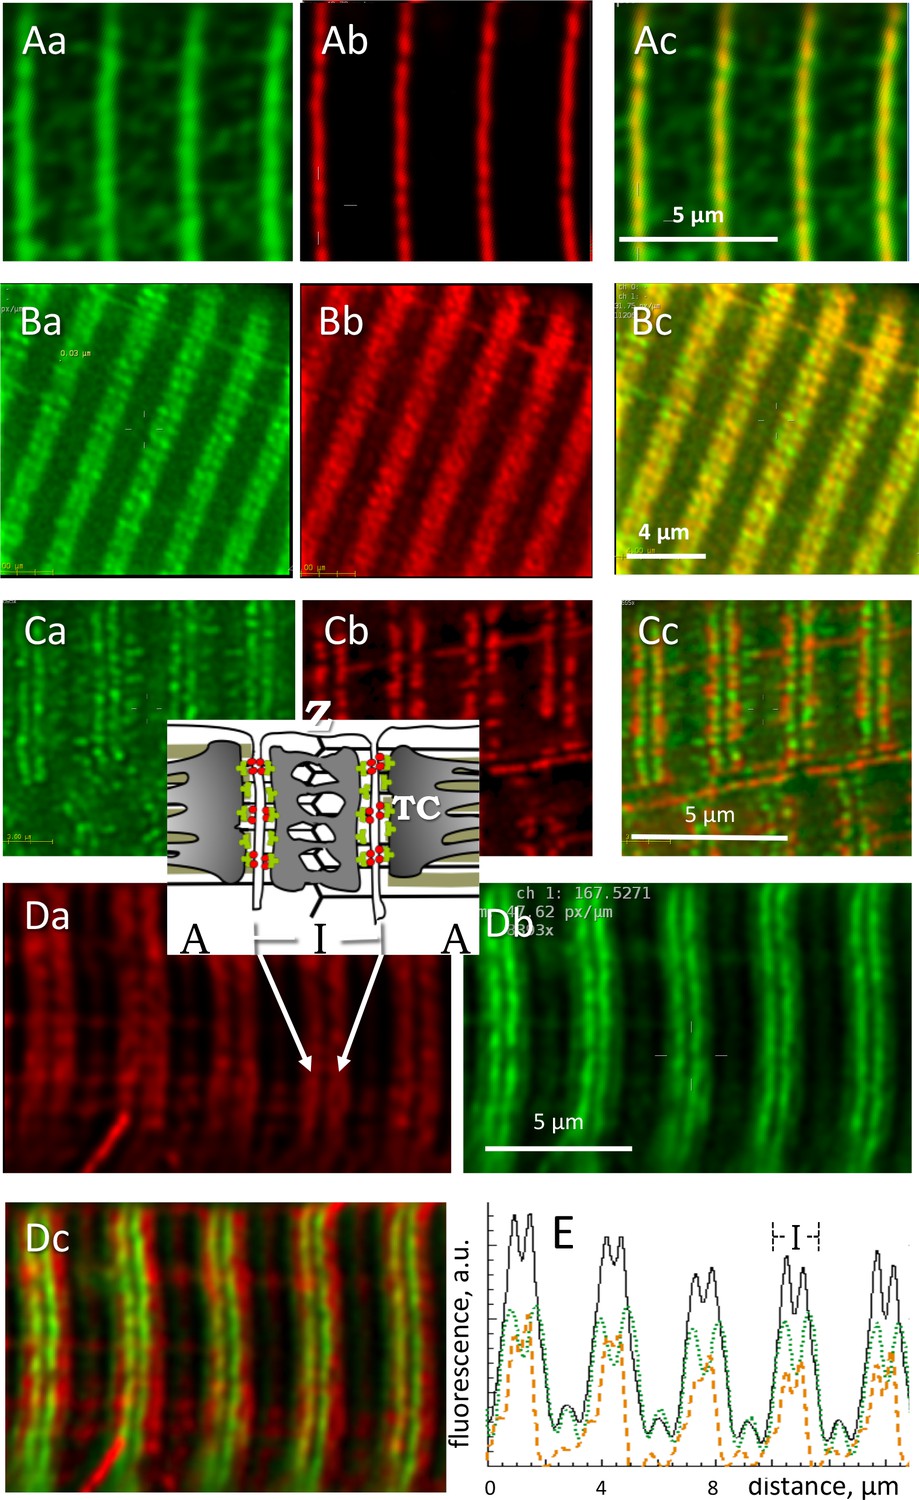
Structure elements are diagrammed in inset. (A) Images of all-forms GP (Aa), Z disk component α-actinin (Ab) and their overlay (Ac) in a biopsy from an MHN subject (# 139). Shown are individual images (‘sections’) from separate emission ranges (‘channels’) in a 2-channel z-stack, after correction for blurring (Materials and methods). GP largely overlaps with actinin and is seen as low intensity patches at other locations. (B) All-forms GP (Ba), cytochrome c oxidase subunit 4 (Cox4), located in mitochondria (Bb) and overlay (Bc). Both proteins are located largely in the sarcomeric I band, in patches with limited overlap. (C) Myocyte from adult mouse FDB expressing GP-GFP (Ca), co-stained with mitochondrial marker TMRE (Cb). Most GP is in the I band, without actual overlap with TMRE (Cc). No GP is detected in the mitochondrial fraction extracted from these muscles (Figure 4—figure supplement 1). (D) Human muscle cell co-stained for GPa and GP. Inset: location of Z disc and sarcomere bands I and A; TC, terminal cisternae of SR. GPa (Da) is distributed more broadly. Panel Dc shows in green a putative image of GPb (the apo form) obtained by subtracting from the all-forms GP fluorescence that of GPa, scaled by a factor that removes the ‘shoulder’ visible in the all-forms GP (Equation 5, Materials and methods). (E) The calculation is illustrated with image profiles F(x); black: FGP, green: FGPa, orange: FGPb. Panel Dc demonstrate the large difference in locations of GPa and GPb.
Figure 4—figure supplement 1
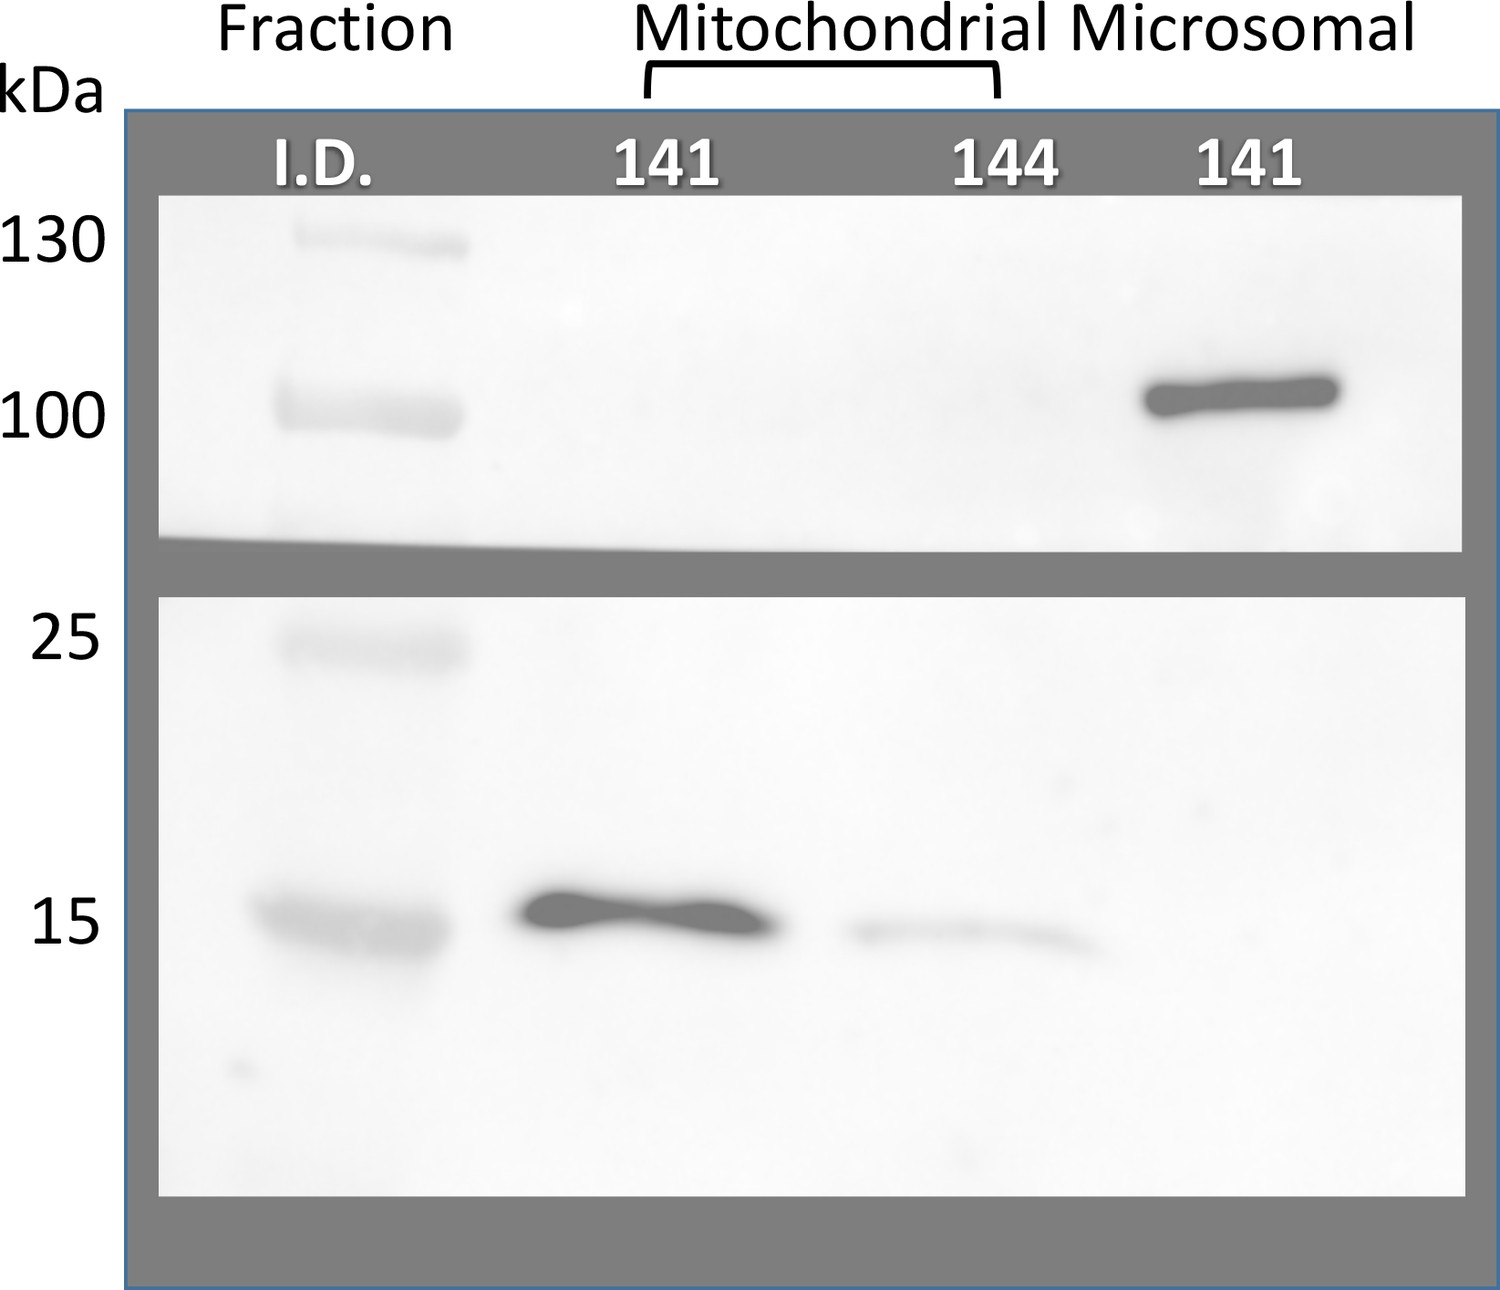
Absence of GP in mitochondrial fractions.
First two gel lanes: Mitochondrial fractions extracted from 100 mg tissue samples of biopsied muscle from two subjects, identified in the figure. Lane 3: microsomal fraction one of these patients. Western blots, in separate strips of the nitrocellulose membrane, of all-forms GP and CoxIV. The result shows no detectable anti-GP antibody in mitochondrial extracts.
Figure 5 with 2 supplements
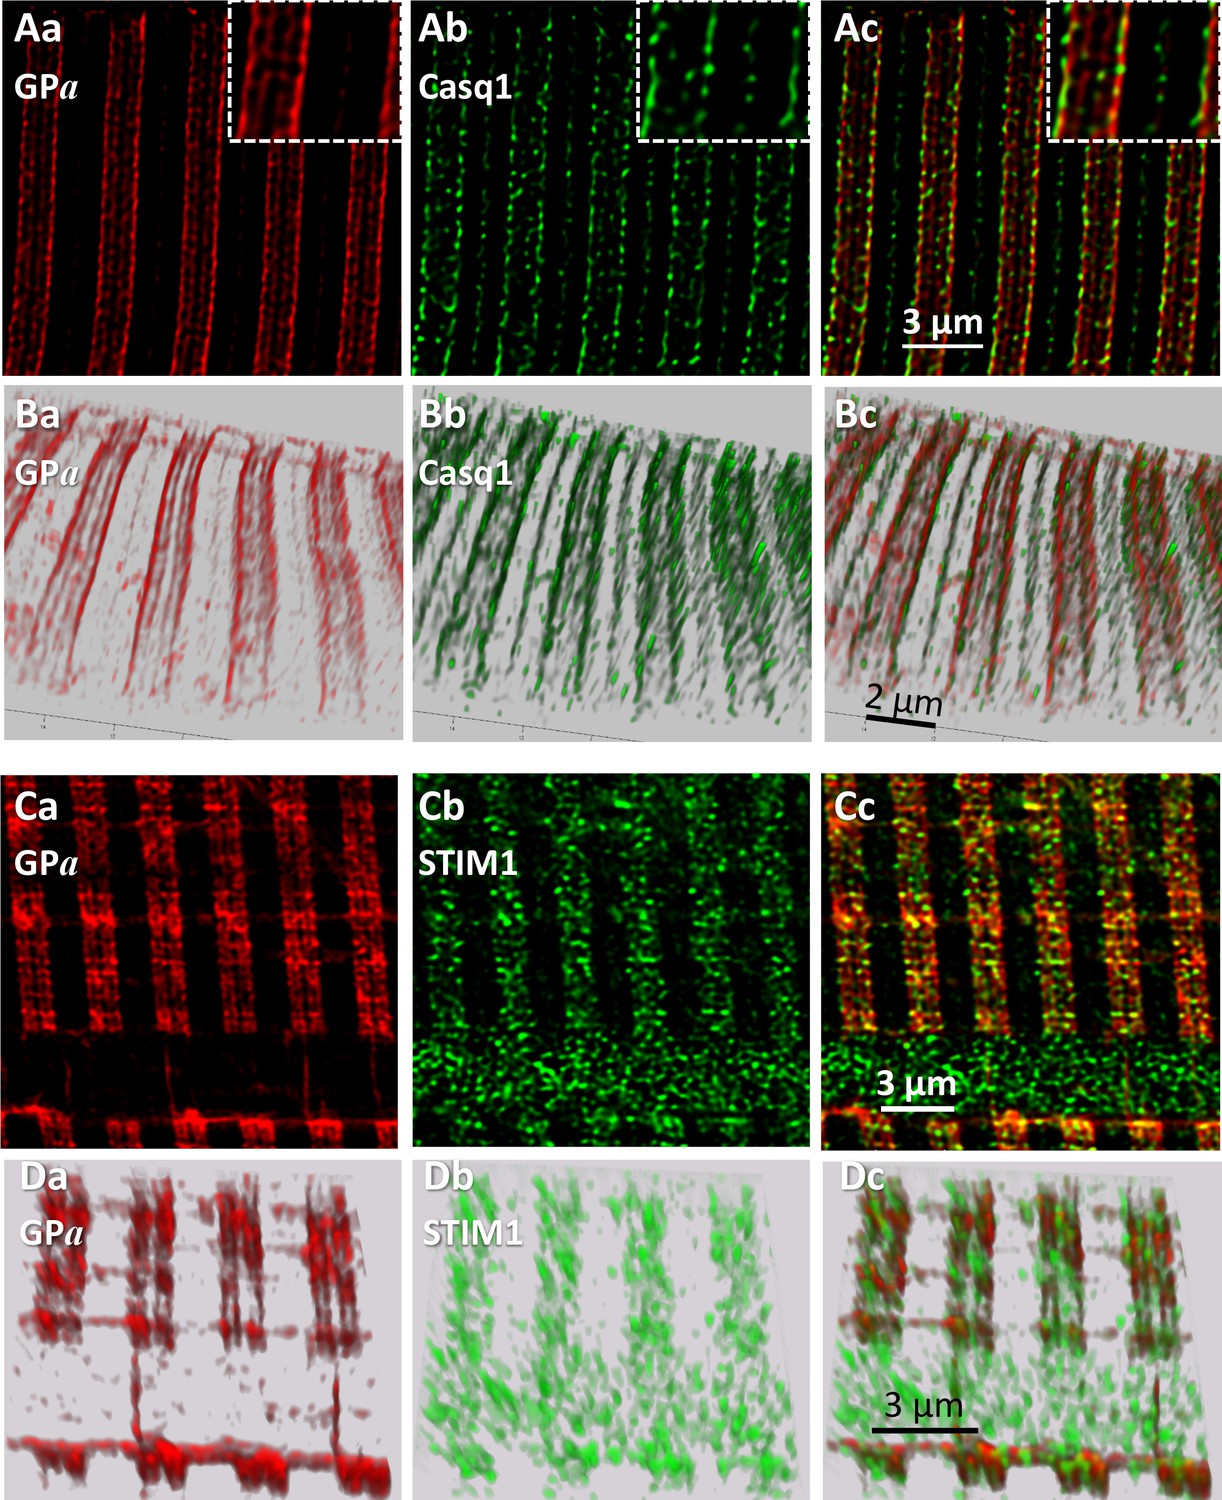
Phosphorylated glycogen phosphorylase, GPa, localizes at SR.
(A) Sections of a z-stack (corrected as in Figure 4) of human muscle co-stained for GPa and Casq1(I.D. #164, MHN). (B) 3-D renderings of the z-stacks that contained the sections in A. Both proteins delineate two terminal cisternae, TC, in every triad. The inset in Ac shows close proximity of the imaged proteins, without actual colocalization (documented with Figure 5—figure supplement 1). (C, D) Sections and stack from a human myofiber co-stained for GPa and STIM1 (I.D. #164, MHN). GPa delineates two TC in every triad (Ca, Da). STIM1 forms clusters in close proximity to the GPa bands, without actual colocalization. Minor quantities of both proteins are located outside triads. A large quantity of STIM1, unaccompanied by GPa, appears inside a nucleus (cf. (Lee et al., 2018). These images are the first to resolve TC with conventional optics (a resolution of ~100 nm is estimated with Figure 5—figure supplement 2).
Figure 5—figure supplement 1

Analysis of colocalization of GPa and STIM1.
(A) Enlarged part of text Figure 5 panel Cc. (B) Object-based analysis, by JACoP, of images in panels Ca (GPa) and Cb (STIM1) of Figure 5. Centers of signal mass of STIM1 ‘objects’ (i.e. automatically detected connected areas of fluorescence) are marked by a green symbol. Centers of objects in the GPa image are marked in red. Green and red locations are different but close. (C) Van Steensel’s approach to calculating the distance (van Steensel et al., 1996; Bolte and Cordelières, 2006): the discrete points correspond to the Pearson correlation coefficient r computed between the two images at set values of the shift of the STIM1 image in the x direction represented in the abscissa. The continuous line represent the best-fit Gaussian. The central value, 57 nm, is the distance estimate. While this nm-precision result cannot be taken at face value (possible error sources were discussed in Figure 5—figure supplement 2), the analysis is objective and automatic. 57 nm is of the order of a TC diameter (in the axial or x direction), therefore suggesting location of STIM1 and GPa within – or associated with – the same TC.
Figure 5—figure supplement 2
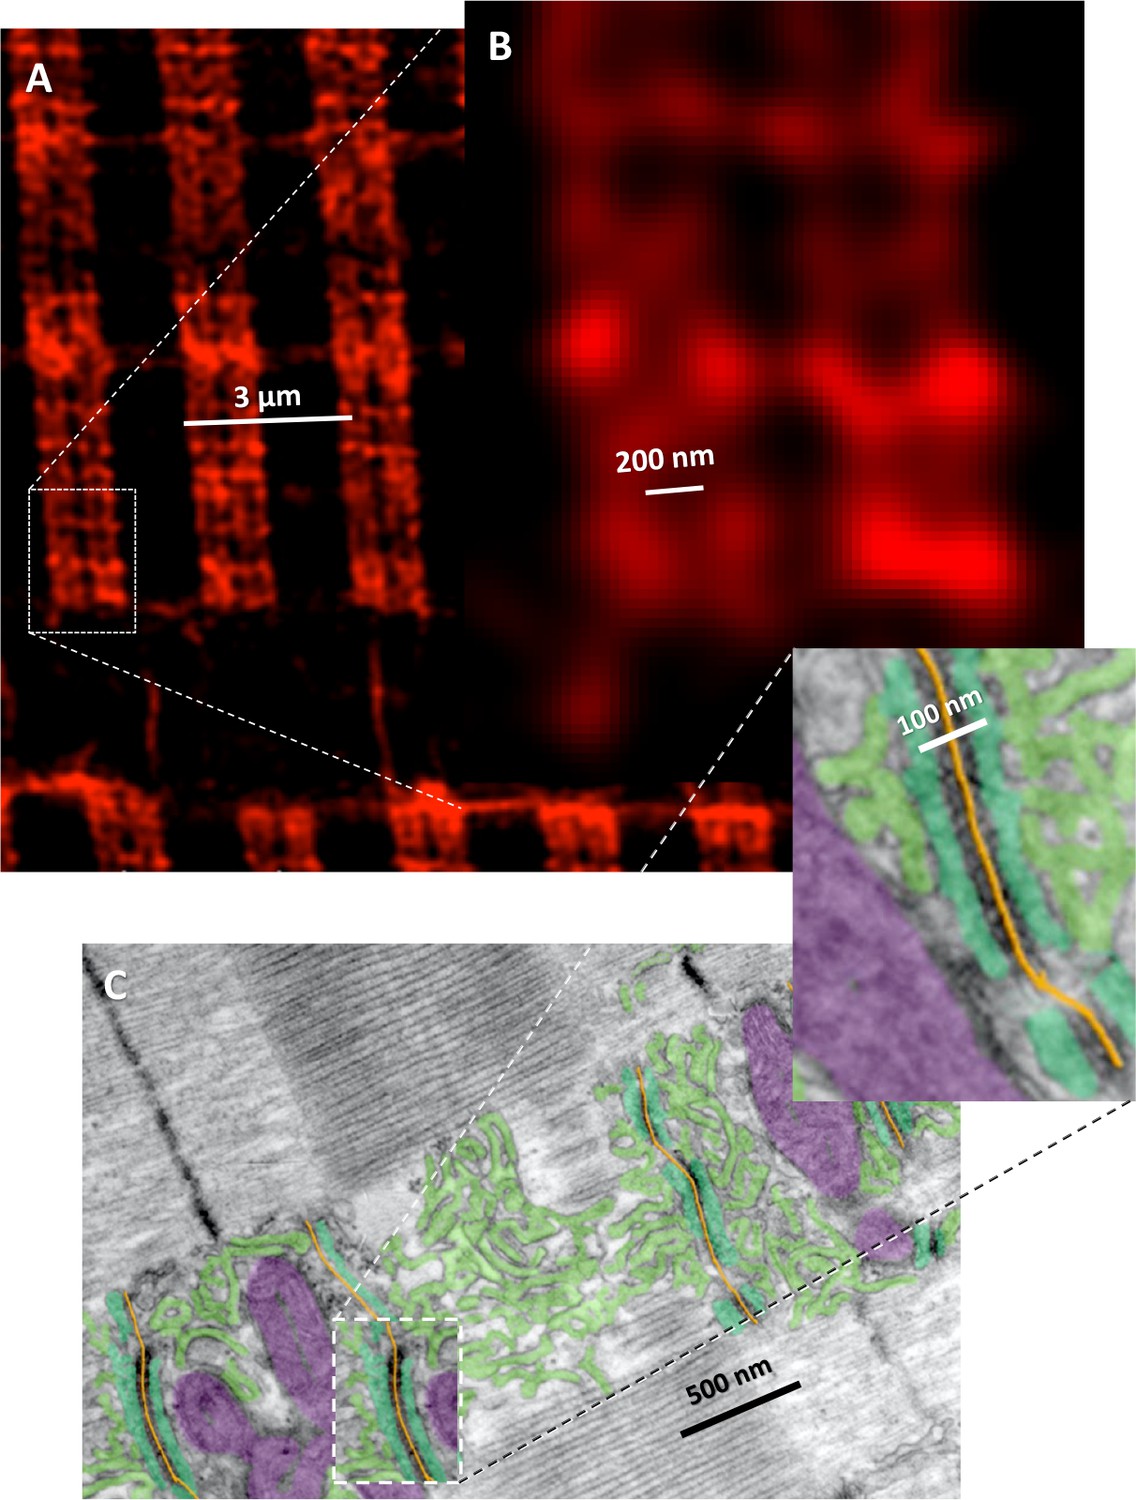
Interpretation of high resolution GPa images.
(A) Image of a human myofiber stained with anti-GPa antibody. Same as panel Ca in text Figure 5. (B) Magnification of area framed in A. (C) EM image of longitudinal section of mouse muscle, which grazes one myofibril, showing the SR (green) and its junctions with T tubules (yellow). RyRs are visible as dark periodic structures at T-SR junctions; mitochondria are colored purple. The image was obtained and colored by Dr. Clara Franzini-Armstrong. The comparison shows that the sets of 4 bands in A correspond to the two triads flanking a Z line in C. The separation between individual bands (2 Terminal Cisternae, TC, in a triad) in A is ~200 nm. In the EM the distance between TC is ~100 nm (inset). The difference may be due to compression and shrinkage of structures in the EM image (communicated by Dr. Franzini-Armstrong) and myofiber stretching, imperfect deblurring or swelling in the fluorescence image. The fluorescence image resolves structures separated by 100–200 nm.
Figure 6 with 1 supplement
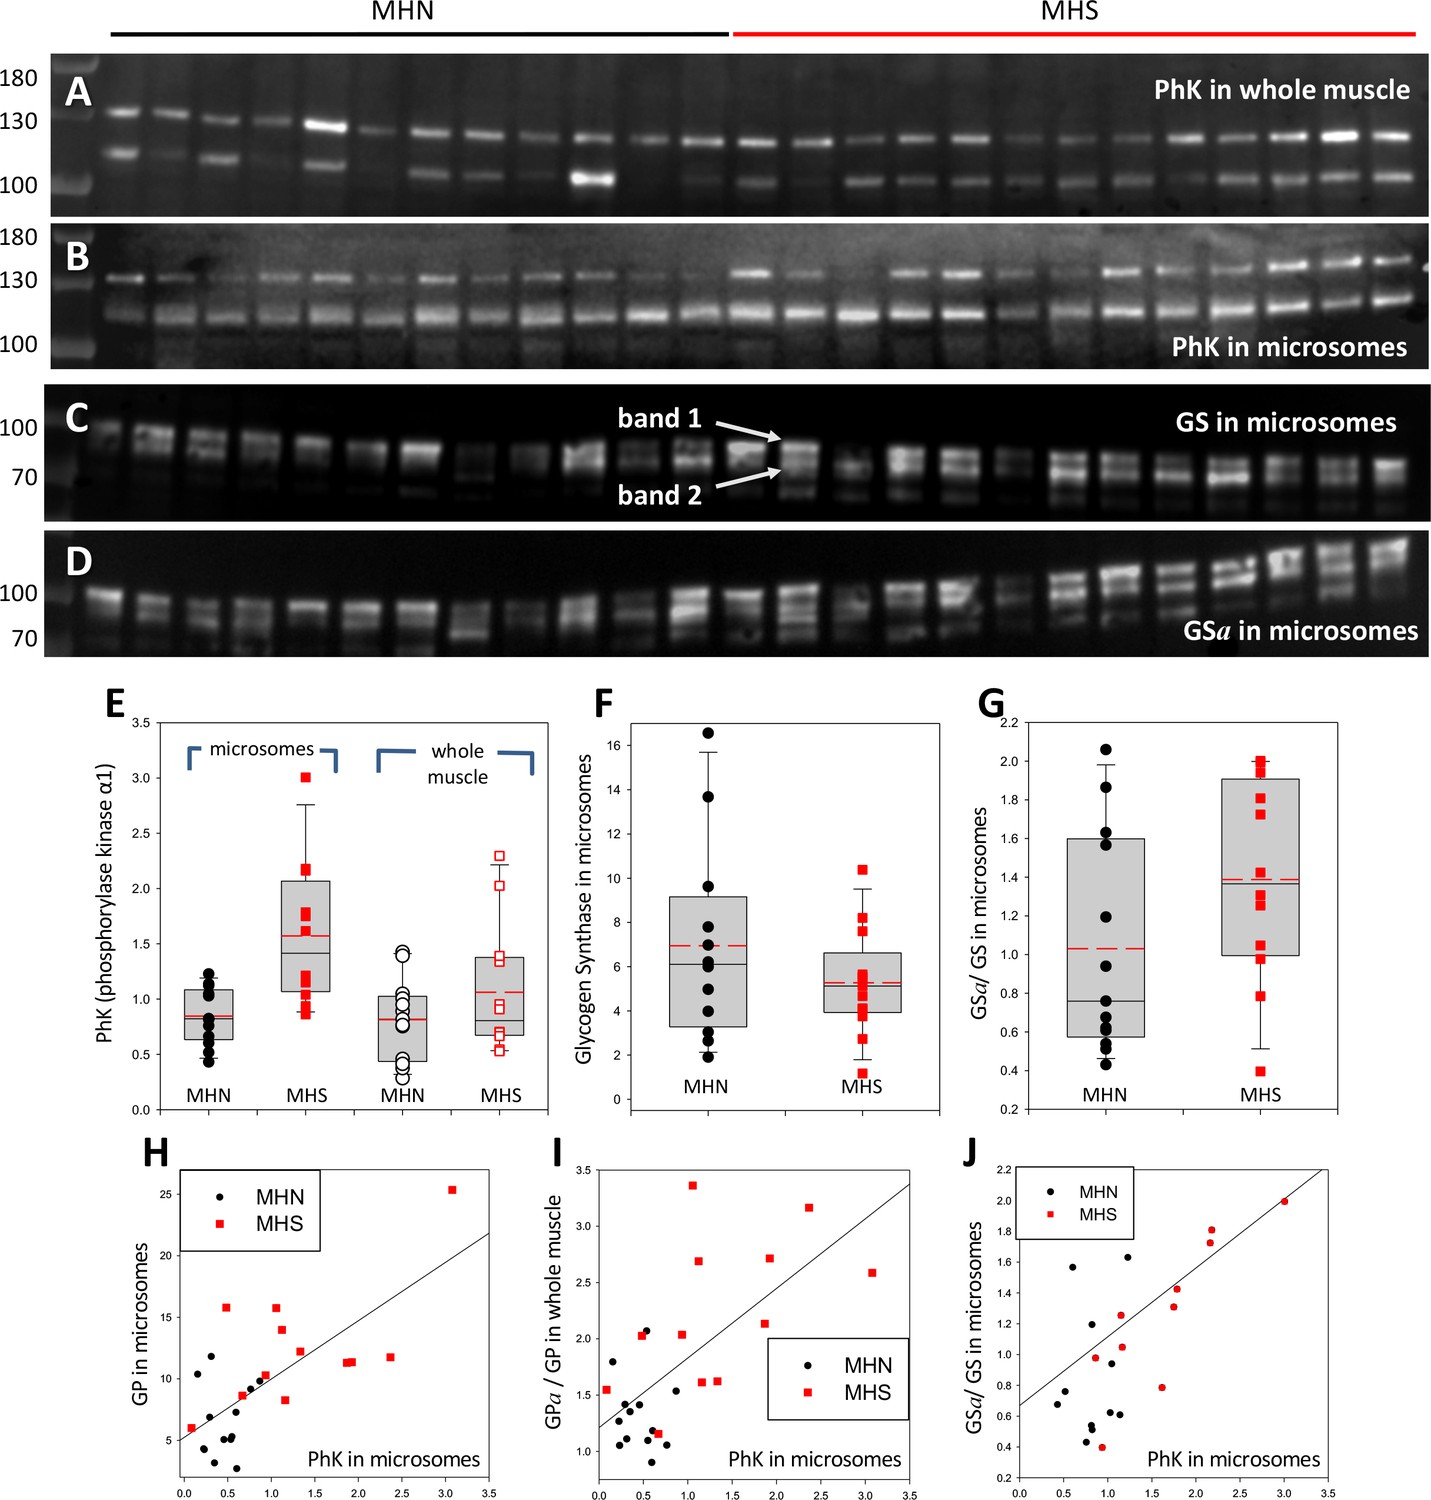
Phosphorylase kinase and glycogen synthase are enriched in MHS microsomes.
(A, B) Blots stained for PhK in whole muscle (A) or microsomes (B) from the patients identified in Figure 2. Two bands are stained. The correlation of their intensities (in Figure 6—figure supplement 1) indicates that the 115 band contains a lysis product of the ~130 kDa protein. (C, D) Blots of all-forms glycogen synthase (GS, consisting of GSa and GSb) and the phosphorylated enzyme (GSa). Originating electrophoretic gels for A-D are in Figure 3—figure supplement 1. Two bands, named 1 and 2, are stained. (E–F) The content of the PhK bands from microsomes is nearly double in the MHS patients (p = 5 10−4). In whole muscle the difference is not significant. Differences in the content of GS band one are small and not significant, but the median phosphorylation (GSa/GS) almost doubles (p = 0.11). GS band two does not change significantly (not shown). (H–J) The graphs show positive correlations between PhK content, phosphorylation of GP and GS and content of GP in microsomes. The correlation coefficients are high and ps of no correlation are uniformly low (Table 2). Remarkably, the microsomal PhK content correlates significantly with the degree of phosphorylation of GP in whole muscle, not in microsomes.
Figure 6—figure supplement 1
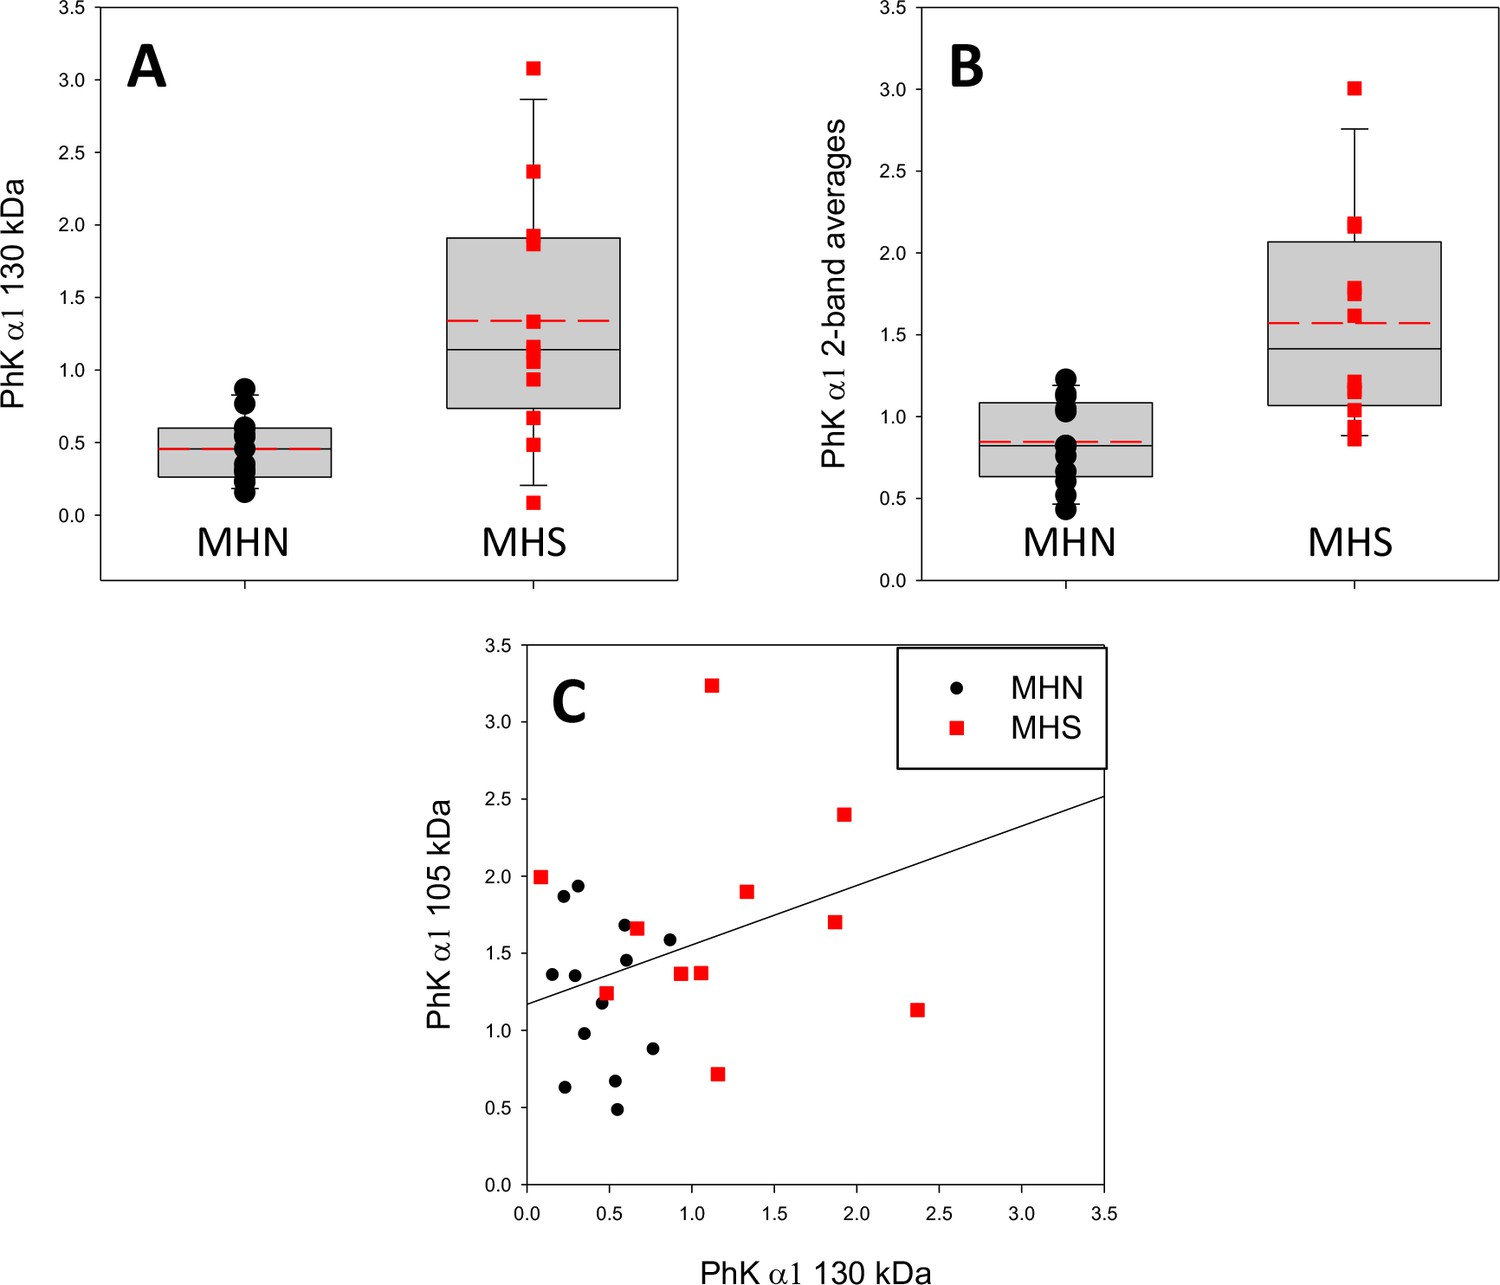
Analysis of two bands stained by the anti-PhK antibody.
(A) Distribution of 130 kDa PhK band derived from Western blot in text Figure 6. Means (S.E.M.): 0.46 (0.06) and 1.34 (0.24) respectively for MHN and MHS (p = 0.001). (B) Distribution of averages of 130 and 105 kDa bands. Means (S.E.M.): 0.85 (0.07) and 1.57 (0.18) respectively for MHN and MHS (p<0.001). (C) Cross plot of band intensities. r = 0.426, p = 0.03. The correlation analysis suggests that the 115 kDa band contains a lysis fragment of the 130 kDa subunit.
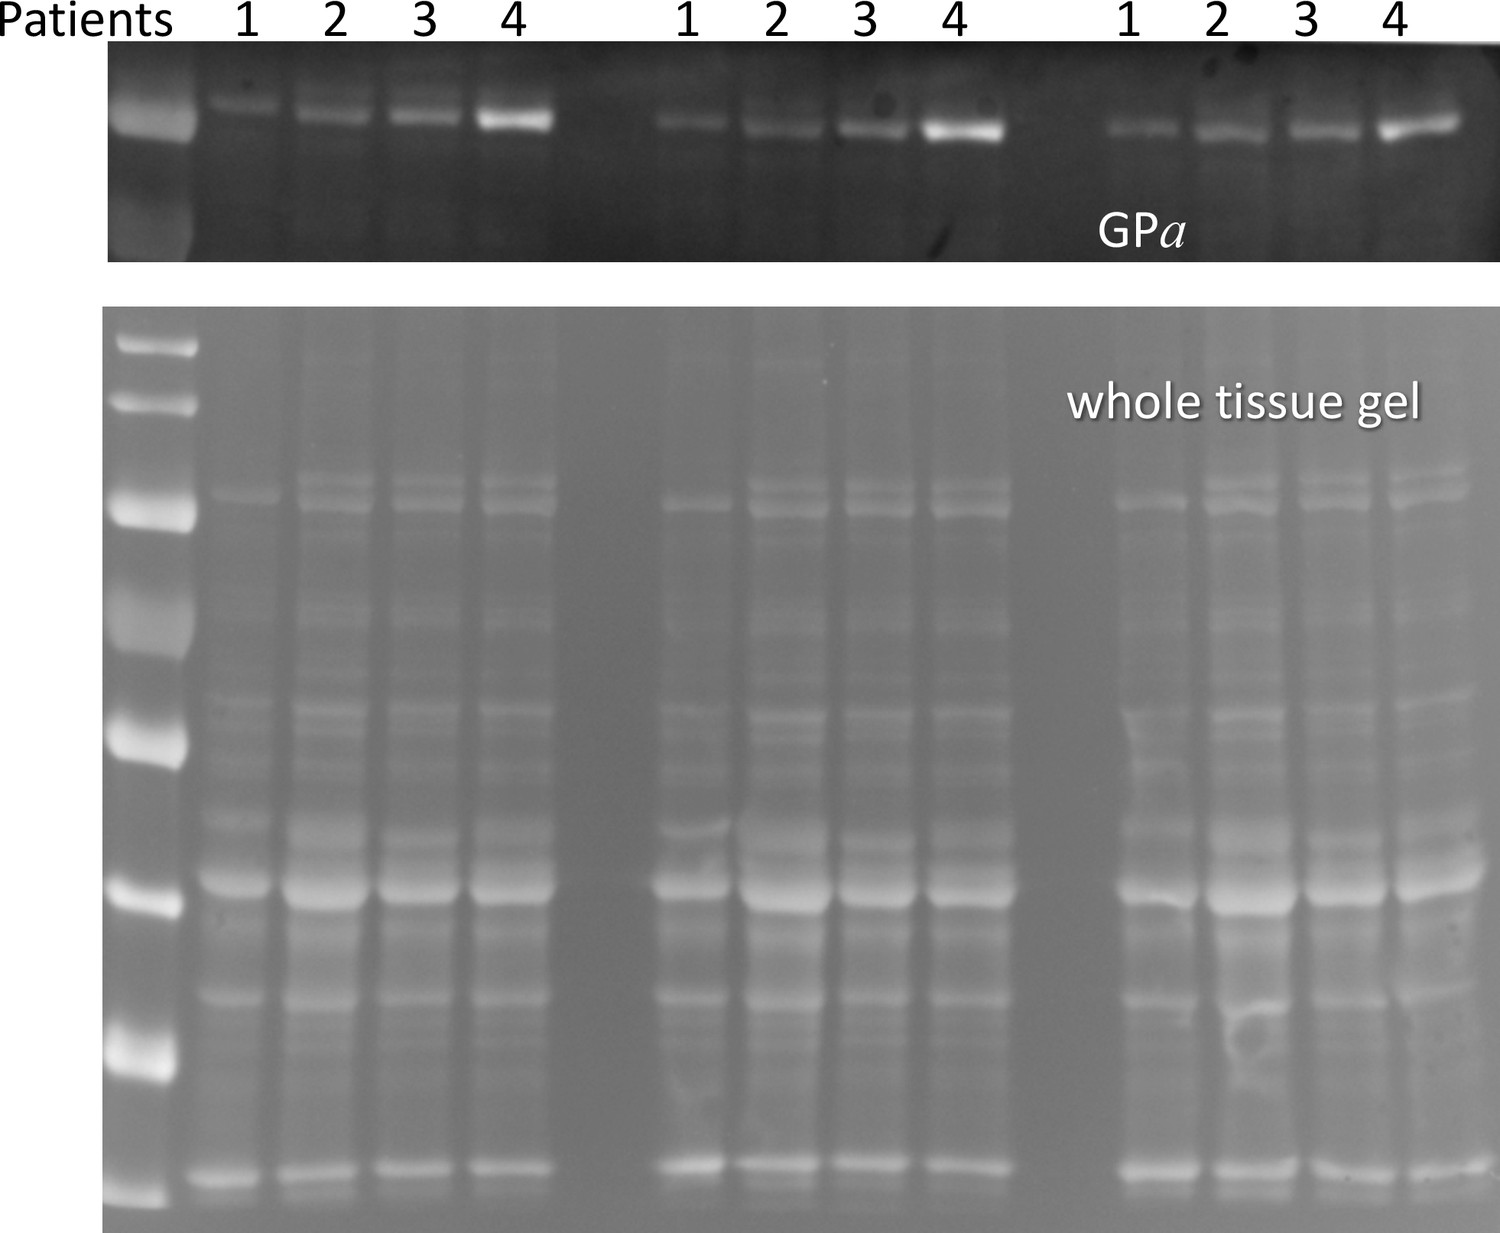
Figure 7
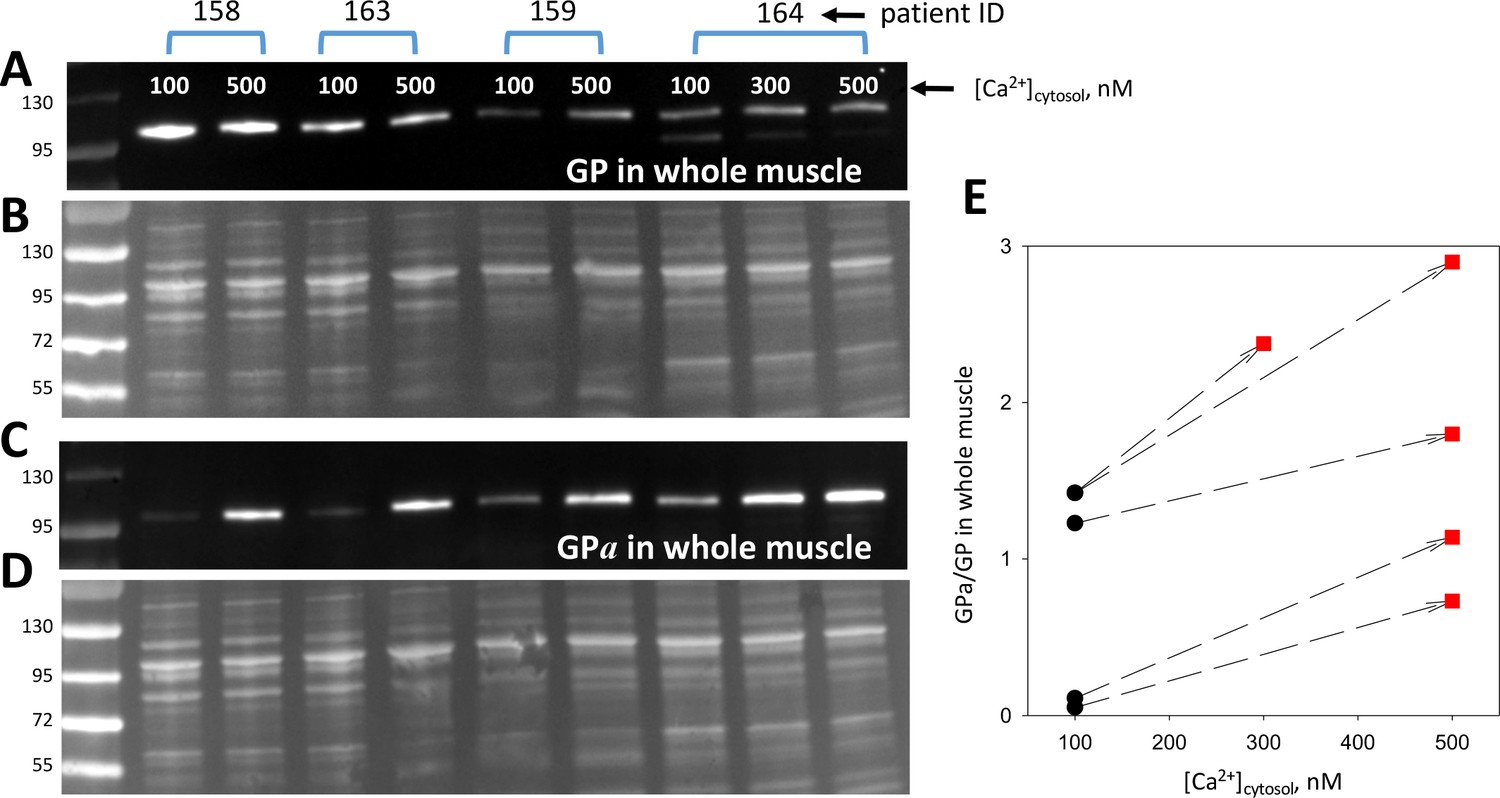
Phosphorylation is modulated by cytosolic calcium.
(A, C) Blots of GP and GPa in whole tissue fractions of permeabilized muscle bundles from four patients, exposed successively to two solutions of increasing [Ca2+]. (B, D) Protein gels from which blots in A and C were derived. Corresponding lanes in the two gels were loaded with the same extract, prepared from multiple, equally treated fiber bundles from the patients identified at top. (E) Applied [Ca2+]cyto vs. phosphorylation ratio, calculated from band signals in A and C after normalization by protein content in B and D. Phosphorylation increased at 500 nM [Ca2+] (p = 8 10−4). The effect was graded with [Ca2+] in the sample from patient # 164, which provided sufficient tissue for applying three Ca2+ concentrations.
Figure 8
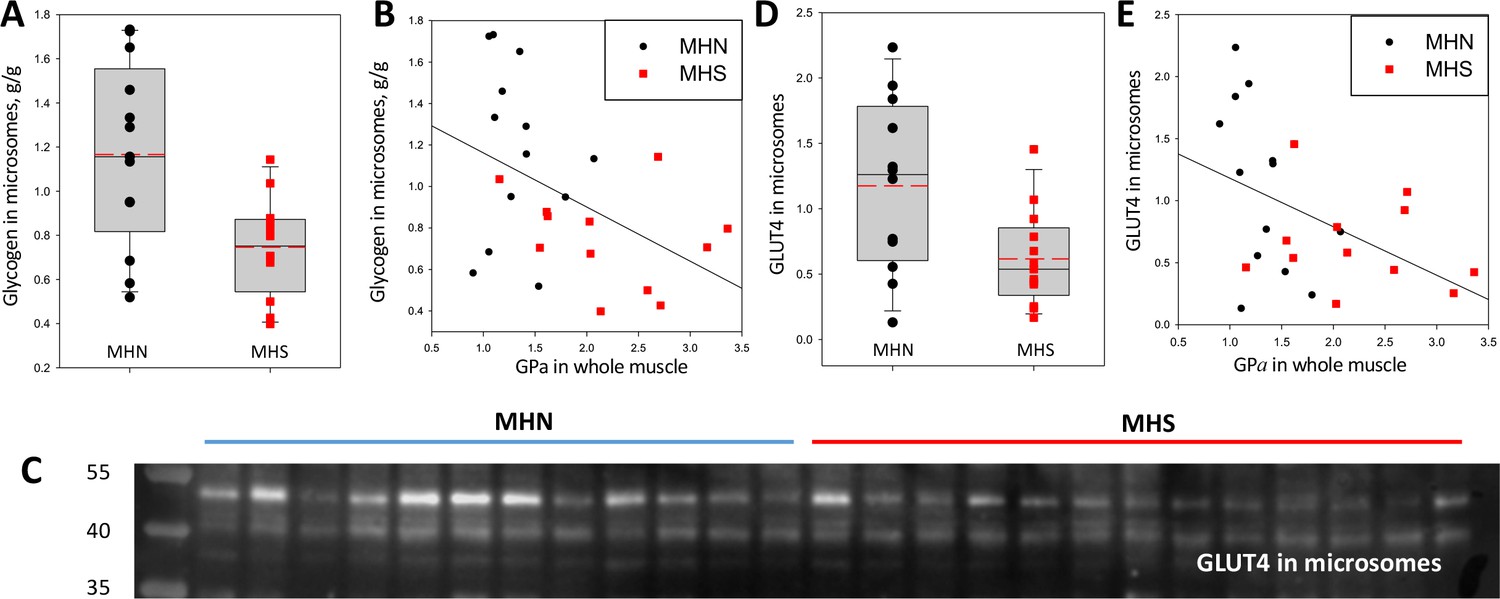
Glycogen and GLUT4 are lower in MHS patients.
(A) Distribution of glycogen content in microsomes. The median was 43% lower in MHS (p = 0.01). (B) Negative correlation of glycogen in microsomes with GPa in whole tissue (r = - 0.47, p = 0.02). (C) Western blot of GLUT4 in microsomes. The protein of interest is the band at ~50 kDa. (D) Distribution of signal intensity; the median content was lower by 54% in the MHS (p = 0.01, Table 1). (E) Negative correlation of GLUT4 in microsomes with GPa in whole tissue (r = - 0.46, p = 0.02). The gel originating the blot in C is panel F in Figure 3—figure supplement 1.
Figure 9

Glucose pathways and their alterations in MHS muscle.
Glycogen, resident in the intermyofibrillar space in the form of granules or SR-bound, is synthesized from transported glucose or broken down to glucose-1-phosphate (Glc-1-P). In MHS, [Ca2+]cyto is elevated (López Padrino, 1994) as a consequence (Rios, 2012) of an increased leak from the SR that results in a lower resting free SR calcium level. The lower [Ca2+]SR promotes influx via SOCE or other pathways (Eltit et al., 2013) resulting in higher [Ca2+]cyto. The change has two effects: (i) PhK activation that increases phosphorylation of GP and GS, to respectively enhance the breakdown and decrease the synthesis of glycogen. The resulting increase in Glc-1-P, Glc-6-P and glucose (Glc) hampers passive entry of glucose. (ii) Decrease of the basal activation by AMPK of the expression and membrane insertion of the glucose transporter GLUT4 (61), which contributes to reducing glucose entry. Concurrently, PhK, GPa, GSa and GDE move towards the intermyofibrillar space (not shown). Question marks indicate stages where evidence is lacking or conflicting. They include the site of interaction of PhK with its substrates, the location of GPa (whether in granules or attached to TC) and the possible effects of elevated [Ca2+] on GLUT4.
Figure 10
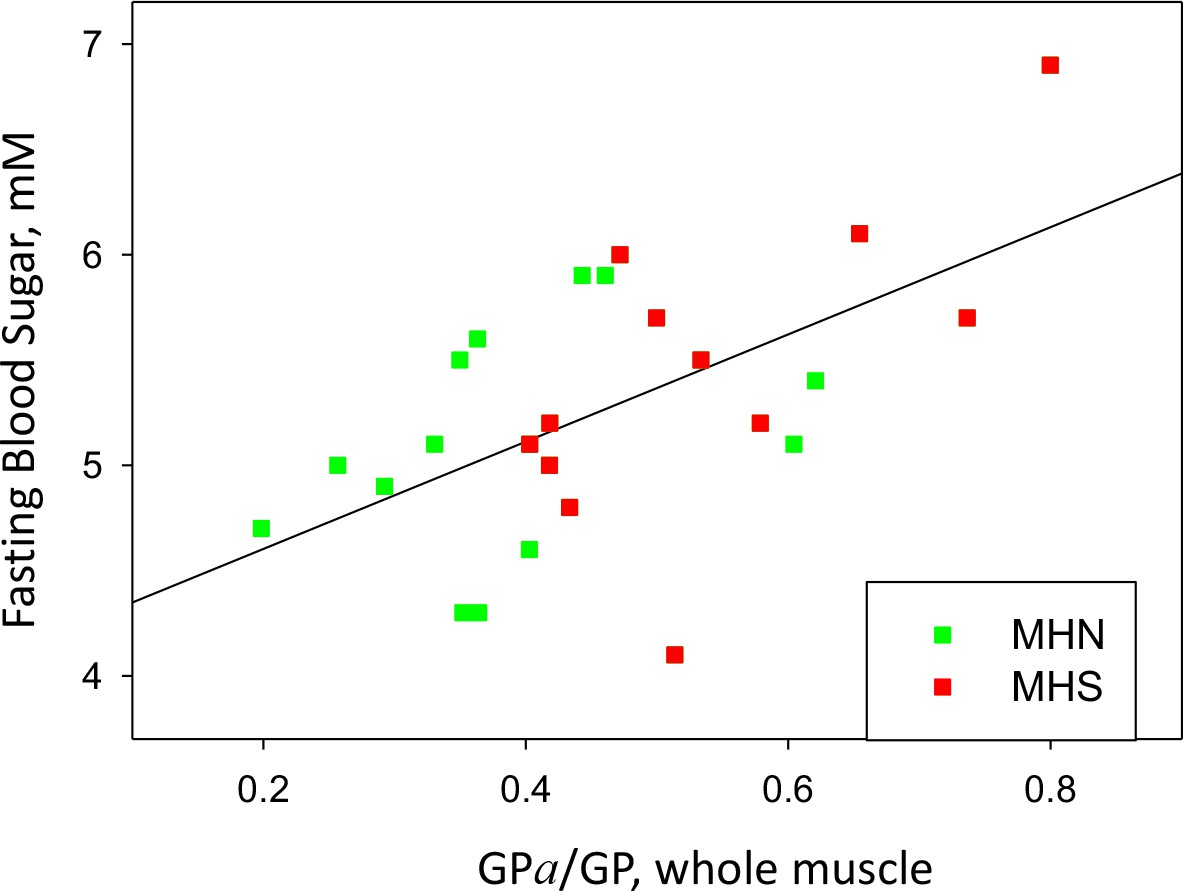
GP phosphorylation and glycemia.
Phosphorylation ratio of glycogen phosphorylase in the whole tissue extract, vs. FBS, for the 25 patients with a complete study. r = 0.58. p=0.002.
Appendix 1—figure 1
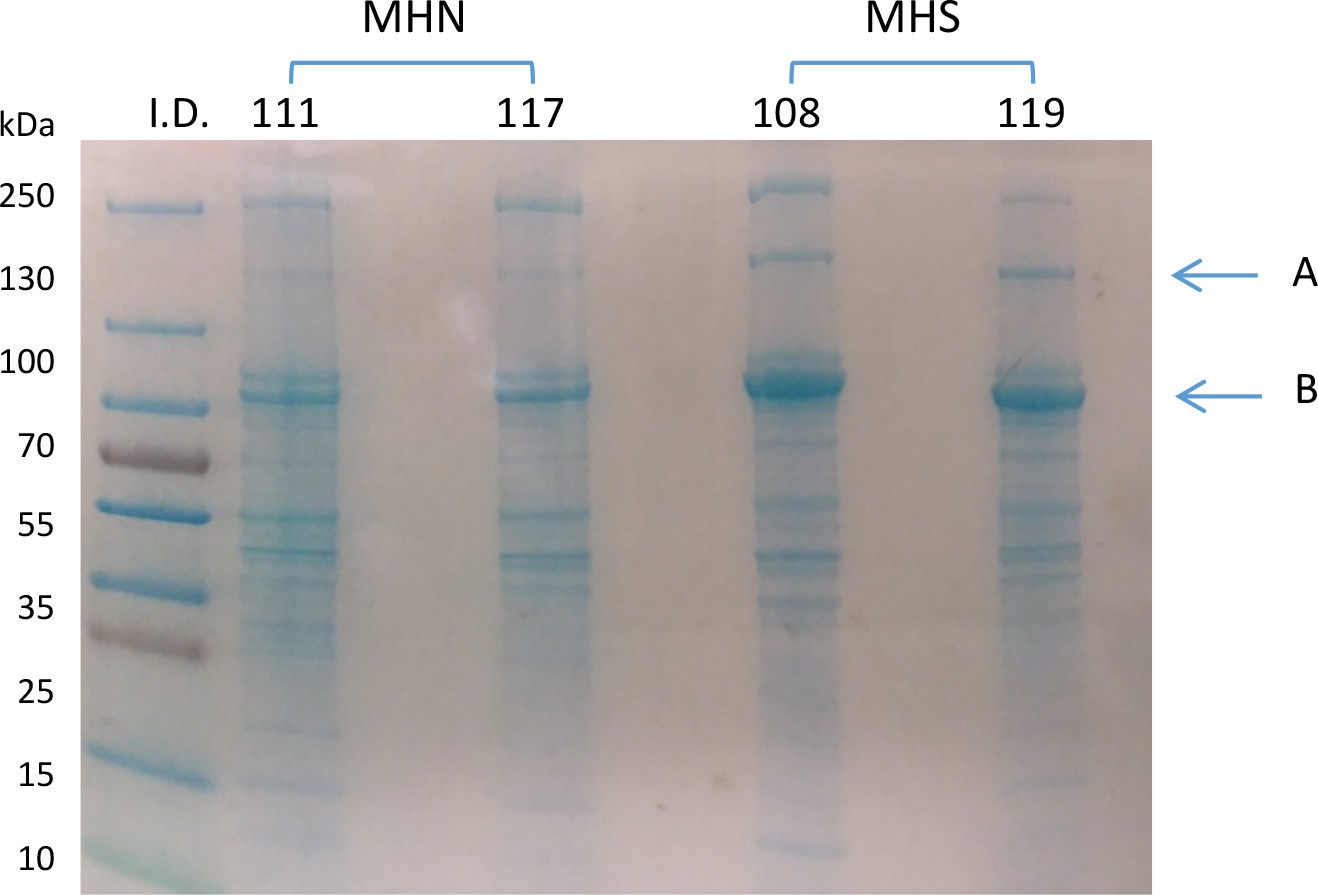
20 µg of microsomal extracts from muscle specimens of 2 MHN and 2 MHS patients identified in the figure were run by SDS PAGE.
The gel was stained with Gel Code Blue (Thermo Scientific). Bands of 170 and 100 KDa (A and B in figure) were excised for liquid chromatography-mass spectrometry (LC–MS) and further processed for protein identification at Rush University Proteomics Facility. The report includes an account of parameters of the dominant protein (Appendix 1—table 1) and a table of all identified peptides, presented as Supplementary file 1. The analysis was consistent with the presence of multiple proteins in both gel bands. The peptide count and protein sequence coverage identified the dominant proteins as glycogen debranching enzyme (GDE), Homo sapiens, molecular weight 175 KDa and glycogen phosphorylase muscle form (GP), Homo sapiens, with 97 KDa molecular weight. Additionally, SERCA1 was found in abundance in band B.
Appendix 2—figure 1
Example of the smaller gels used with this first group.
In the example and in every gel prepared from microsomes, the excess protein at ~100 and~180 kDa is noticeable.
Appendix 4—figure 1
Western blot of GPa for whole cell extracts of 4 patients.
Material from the same individual cell extract were loaded in three lanes as indicated. 5 repeated measurements were carried out for every lane. See Methods/Statistics/Replicates and Probable Error for additional information.
Videos
Video 1
Demonstration of a custom method to quantify Western blots.
Tables
Table 1
Muscle contents of proteins and glycogen, and glucose in blood.
mc – microsomal fraction; wm – whole muscle lysate. Rows 1–17 list statistical parameters for 13 MHN and 12 MHS subjects. Units for glycogen are g/g of protein in extract, mM for FBS and arbitrary for all other variables (Materials and methods). Row 18 lists parameters of fasting blood sugar in 78 MHN and 80 MHS patients of the recent cohort. In row 19 FBS parameters of 6 ‘metabolically normal and 6 ‘metabolically challenged’ patients (MN and MC, defined in Discussion) are listed in columns 3–5 and 6–8, respectively. § Significant at the 0.05 level by 2-tailed t test or *Mann-Whitney u test. Rows listing significant increases are colored red, reductions are in blue. The inclusion of two variables with p>0.05 is justified based on their correlations listed in Table 2.
| 1 | 2 | 3 | 4 | 5 | 6 | 7 | 8 | 9 | |
|---|---|---|---|---|---|---|---|---|---|
| MHN | MHS | ||||||||
| Species | Fraction | Mean | Median | S.E.M. | Mean | Median | S.E.M. | P | |
| 1 | GP | mc | 6.53 | 5.28 | 0.813 | 12.6 | 11.6 | 1.440 | 0.001* |
| 2 | wm | 3.55 | 3.33 | 0.198 | 4.10 | 4.28 | 0.208 | 0.07 | |
| 3 | GPa | mc | 3.81 | 3.09 | 0.522 | 6.50 | 4.76 | 1.22 | 0.05§ |
| 4 | wm | 1.32 | 1.26 | 0.090 | 2.22 | 2.08 | 0.198 | <0.001* | |
| 5 | GPa/GP | mc | 0.63 | 0.55 | 0.082 | 0.51 | 0.44 | 0.074 | 0.28 |
| 6 | wm | 0.39 | 0.36 | 0.061 | 0.54 | 0.51 | 0.065 | 0.005* | |
| 7 | PhK | mc | 0.85 | 0.82 | 0.070 | 1.57 | 1.41 | 0.180 | <0.001§* |
| 8 | wm | 0.81 | 0.82 | 0.101 | 1.06 | 0.81 | 0.169 | 0.57* | |
| 9 | GDE | mc | 3.63 | 3.44 | 0.402 | 7.05 | 5.81 | 0.902 | 0.002* |
| 10 | GS | mc | 6.95 | 6.10 | 1.29 | 5.27 | 5.12 | 0.666 | 0.26 |
| 11 | GSa/GS | mc | 1.03 | 0.76 | 0.157 | 1.39 | 1.37 | 0.150 | 0.11 |
| 12 | GLUT4 | mc | 1.18 | 1.23 | 0.189 | 0.62 | 0.54 | 0.105 | 0.01§ |
| 13 | Glycogen | mc | 1.17 | 1.15 | 0.116 | 0.75 | 0.75 | 0.066 | 0.01* |
| 14 | Casq1 | mc | 1.71 | 1.42 | 0.249 | 1.64 | 1.52 | 0.261 | 0.84 |
| 15 | FKBP12 | mc | 1.95 | 1.88 | 0.227 | 1.93 | 1.84 | 0.223 | 0.95 |
| 16 | SERCA1a | mc | 18.5 | 18.9 | 1.365 | 17.4 | 19.2 | 1.728 | 0.61 |
| 17 | SERCA1b | mc | 7.71 | 8.34 | 0.839 | 7.18 | 7.23 | 1.019 | 0.69 |
| 18 | FBS, recent cohort | 5.10 | 5.10 | 0.150 | 5.44 | 5.35 | 0.207 | 0.19 | |
| 19 | FBS, MN or MC | 5.05 | 5.05 | 0.256 | 5.90 | 5.85 | 0.241 | 0.03§* | |
Table 2
Correlations between contents (proteins and glycogen) in all patients.
mc – microsomal fraction; wm – whole muscle lysate. Numbers above diagonal are Pearson correlation coefficients r; below diagonal is p of no correlation. Significant positive correlations highlighted in red, significant negative correlations in blue. Some of the correlations of GLUT4 and glycogen with the enzyme contents are not significant in binary tests, but acquire significance in multivariate tests (Appendix 3). Contents of SERCA 1 (and Casq1 and FKBP12, not shown) had no significant correlation with the enzymes studied.
| GP | GPa | PhK | GSa/GS | GDE | GLUT4 | Glycogen | Serca 1 | |||||
|---|---|---|---|---|---|---|---|---|---|---|---|---|
| Mc | Wm | Mc | Wm | Mc | Wm | Mc | ||||||
| GP | mc | 0.41 | 0.72 | 0.64 | 0.83 | 0.52 | 0.53 | 0.94 | −0.46 | −0.47 | −0.24 | |
| wm | 0.02 | 0.38 | 0.52 | 0.49 | 0.69 | 0.36 | 0.34 | −0.25 | −0.66 | −0.30 | ||
| GPa | mc | <10−4 | 0.06 | 0.64 | 0.75 | 0.55 | 0.52 | 0.48 | −0.51 | −0.36 | 0.10 | |
| wm | <10−3 | <0.01 | <10−4 | 0.66 | 0.58 | 0.38 | 0.43 | −0.46 | −0.48 | −0.09 | ||
| PhK | mc | <10−4 | 0.01 | <10−4 | <0.01 | 0.57 | 0.48 | 0.42 | −0.23 | −0.47 | −0.14 | |
| wm | <0.01 | <10−3 | <10−3 | <0.01 | <0.01 | 0.37 | 0.49 | −0.06 | −0.21 | −0.27 | ||
| GSa/GS | mc | <0.01 | 0.08 | <0.01 | 0.06 | <0.01 | 0.07 | 0.37 | −0.41 | −0.14 | −0.19 | |
| GDE | <10−4 | 0.09 | 0.02 | 0.03 | 0.04 | 0.01 | 0.07 | −0.09 | −0.09 | −0.26 | ||
| GLUT4 | 0.02 | 0.21 | 0.01 | 0.02 | 0.25 | 0.77 | 0.04 | 0.66 | 0.39 | 0.23 | ||
| Glycogen | 0.02 | <10−3 | 0.07 | 0.02 | 0.02 | 0.31 | 0.48 | 0.67 | 0.05 | 0.15 | ||
| SERCA1 | 0.24 | 0.11 | 0.63 | 0.67 | 0.48 | 0.19 | 0.34 | 0.20 | 0.26 | 0.75 | ||
Key resources table
| Reagent type (species) or resource | Designation | Source or reference | Identifiers | Additional information |
|---|---|---|---|---|
| Antibody | anti-PYGM (Rabbit Monoclonal) | Invitrogen | Catalog #MA5-27442 | IF(1:200), WB (1:2000) |
| Antibody | anti-AGL (Rabbit Polyclonal) | Thermo Fisher scientific | Catalog # PA5-12142 | WB (1:1000) |
| Antibody | anti-PhKA1 (Rabbit Polyclonal) | Thermo Fisher scientific | Catalog #PA5-51508 | WB (1:1000) |
| Antibody | anti-glycogen synthase (Rabbit Polyclonal) | Cell Signalling Technology | Catalog #3893S | WB (1:1000) |
| Antibody | anti- phosphorylatedglycogen synthase (Rabbit Polyclonal) | Cell Signalling Technology | Catalog #3891S | WB (1:1000) |
| Antibody | anti-phosphorylatedglycogen phosphorylase (Sheep polyclonal) | MRC PPU Reagents | Clone #cS960A | IF(1:200), WB (1:2000) |
| Antibody | anti-SERCA1 (Mouse Monoclonal) | Thermo Fisher scientific | Catalog #MA3-912 | WB (1:2000) |
| Antibody | anti-FKBP12 (Rabbit Polyclonal) | Thermo Fisher scientific | Catalog # PA1-026A | WB (1:1000) |
| Antibody | anti-Casq1 (Mouse Monoclonal) | Thermo Fisher scientific | Catalog #MA3-913 | IF(1:200), WB (1:1000) |
| Antibody | anti-Glut4 (Mouse Monoclonal) | Santa Cruz Biotechnology | Catalog #Sc-53566 | WB (1:500) |
| Antibody | Anti-Actinin (Mouse Monoclonal) | Millipore sigma | catalog #A7811 | IF(1:200) |
| Antibody | anti-Stim1 (Mouse Monoclonal) | Invitrogen | catalog # MA1-19451 | IF(1:200) |
| Antibody | Anti-cox4 (Mouse Monoclonal) | Thermo Fisher scientific | Catalog #MA5-15686 | WB (1:1000) |
| commercial assay or kit | Glycogen assay | Sigma | Catalog #MAK016 | |
| recombinant DNA reagent | Pygm-GFP (Plasmid) | Sino Biologicals | Catalog # MG52459-ACG | |
| Biological sample (Homo-sapiens) | Gracilis muscle | MHIU, Toronto Gen. Hospital | unique patient # and date of collection | |
| Biological sample (Mus musculus) | FDB muscle | Charles River Laboratories, Boston, MA | Black Swiss |
Appendix 1—table 1
Col. 1, dominant protein in bands A (GDE) or B (GP).
Col. 2, individual patient identifier. Cols. 3 and 4, number of unique peptides and their sequence coverage, corresponding to the protein named in the first column. Numbers and sequence coverage data are consistent with predominant presence of GDE in band A and GP and SERCA1 in band B. The numbers of GDE and GP peptides in the respective bands are greater in MHS patients, which suggests a greater content that was confirmed with quantitative immunoblotting.
| GDE | Patient ID | unique peptide count | protein sequence coverage (%) |
|---|---|---|---|
| 111(MHN) | 10 | 6.4 | |
| 117(MHN) | 5 | 3.5 | |
| 108(MHS) | 18 | 13 | |
| 119(MHS) | 23 | 16 | |
| GP | Patient ID | unique peptide count | protein sequence coverage (%) |
| 111(MHN) | 46 | 57 | |
| 117(MHN) | 49 | 59 | |
| 108(MHS) | 68 | 69 | |
| 119(MHS) | 62 | 65 |
Appendix 2—table 1
Summary of biochemical analyses of alternative groups.
Quantitative comparisons of 7 MHN (selected among 14) and 7 MHS (selected among 11) samples run on the same 15-lane electrophoresis gel. §Significant at p ≤ 0.05 by two-tailed Student’s t test. *Significant at p ≤ 0.05 by Mann-Whitney u test.
| MHN | MHS | |||||||||
|---|---|---|---|---|---|---|---|---|---|---|
| Species | Fraction | Mean | Median | S.E.M. | N | Mean | Median | S.E.M. | N | P |
| GP | mc | 0.65 | 0.63 | 0.052 | 14 | 1.39 | 1.28 | 0.175 | 11 | <10-3* |
| wm | 0.90 | 0.89 | 0.036 | 7 | 0.94 | 1.28 | 0.061 | 7 | 0.450 | |
| GPa | wm | 1.30 | 1.06 | 0.176 | 7 | 1.69 | 1.64 | 0.121 | 7 | 0.027* |
| GPa/GP | wm | 1.43 | 1.20 | 0.170 | 7 | 1.92 | 1.83 | 0.102 | 7 | 0.069 |
| PhK | mc | 0.49 | 0.39 | 0.107 | 7 | 1.07 | 0.95 | 0.230 | 7 | <10-3* |
| wm | 1.04 | 1.00 | 0.214 | 7 | 1.89 | 1.87 | 0.267 | 7 | 0.029§ | |
| GDE | mc | 0.60 | 0.55 | 0.087 | 7 | 1.06 | 1.05 | 0.091 | 7 | 0.004* |
| GS | mc | 7.63 | 8.94 | 0.857 | 7 | 8.09 | 8.02 | 0.574 | 7 | 0.66 |
| GSa/GS | mc | 0.82 | 0.82 | 0.16 | 7 | 1.17 | 1.17 | 0.075 | 7 | 0.13 |
| Glycogen | mc | 1.93 | 1.97 | 0.074 | 7 | 0.93 | 0.65 | 0.307 | 7 | 0.008§ |
Appendix 3—table 1
Data for multivariate analysis.
‘whm ‘-- whole tissue extract; ‘mic’ -- microsomal fraction. The top set of data are derived from MHN patients and the bottom set from the MHS, but the analysis is blind to this distinction. Analysis by Multiple Regression, which inverts the problem, finding the best fit of PhK (3rd column) as a linear function of the quantities in columns 1 and 2. The following are the outputs of the analysis:
| GPa whm | GPa mic | PhK mic | GDE mic | GLUT4 mic | Glycogen mic |
|---|---|---|---|---|---|
| 2.07 | 2.75 | 0.54 | 2.38 | 0.75 | 14.78 |
| 1.42 | 3.39 | 0.29 | 1.62 | 1.30 | 16.24 |
| 1.79 | 4.00 | 0.15 | 2.04 | 0.24 | 12.81 |
| 1.10 | 2.62 | 0.55 | 0.77 | 1.23 | 23.65 |
| 1.05 | 3.10 | 0.76 | 2.77 | 2.23 | 26.27 |
| 1.05 | 1.85 | 0.23 | 0.70 | 1.84 | 8.50 |
| 1.18 | 2.00 | 0.60 | 0.80 | 1.94 | 21.67 |
| 1.35 | 3.05 | 0.35 | 0.47 | 0.77 | 24.71 |
| 0.90 | 2.78 | 0.59 | 0.38 | 1.62 | 7.22 |
| 1.41 | 3.58 | 0.46 | 2.33 | 1.32 | 16.26 |
| 1.27 | 6.16 | 0.22 | 0.37 | 0.56 | 12.73 |
| 1.11 | 8.25 | 0.31 | 1.85 | 0.13 | 19.03 |
| 1.53 | 6.07 | 0.87 | 0.95 | 0.43 | 6.31 |
| 1.62 | 5.07 | 1.33 | 1.03 | 1.45 | 11.72 |
| 1.16 | 3.48 | 0.67 | 0.81 | 0.46 | 14.52 |
| 1.55 | 2.83 | 0.08 | 1.81 | 0.68 | 9.48 |
| 2.04 | 4.04 | 0.93 | 0.91 | 0.79 | 9.08 |
| 2.13 | 4.46 | 1.87 | 0.88 | 0.58 | 4.53 |
| 1.61 | 4.35 | 1.16 | 1.03 | 0.54 | 11.06 |
| 2.03 | 4.19 | 0.48 | 1.14 | 0.17 | 8.81 |
| 3.36 | 8.32 | 1.06 | 2.32 | 0.42 | 10.68 |
| 2.69 | 5.51 | 1.12 | 0.93 | 0.92 | 14.64 |
| 2.59 | 15.20 | 3.08 | 4.10 | 0.44 | 5.59 |
| 3.16 | 15.00 | 2.37 | 1.59 | 0.25 | 8.81 |
| 2.71 | 5.52 | 1.92 | 2.73 | 1.07 | 4.86 |
Additional files
-
Source data 1
Raw data in multi-page worksheet.
- https://cdn.elifesciences.org/articles/53999/elife-53999-data1-v2.xlsx
-
Supplementary file 1
Mass spectrometry report table.
- https://cdn.elifesciences.org/articles/53999/elife-53999-supp1-v2.docx
-
Transparent reporting form
- https://cdn.elifesciences.org/articles/53999/elife-53999-transrepform-v2.pdf
Download links
A two-part list of links to download the article, or parts of the article, in various formats.
Downloads (link to download the article as PDF)
Open citations (links to open the citations from this article in various online reference manager services)
Cite this article (links to download the citations from this article in formats compatible with various reference manager tools)
Intracellular calcium leak lowers glucose storage in human muscle, promoting hyperglycemia and diabetes
eLife 9:e53999.
https://doi.org/10.7554/eLife.53999


