Structure of the AAA protein Msp1 reveals mechanism of mislocalized membrane protein extraction
- Howard Hughes Medical Institute, United States
- Department of Biochemistry and Biophysics, University of California, San Francisco, United States
- Centre for Integrative Biology, Department of Integrated Structural Biology, IGBMC, CNRS, Inserm, Université de Strasbourg, France
- UCSF/UCB Graduate Program in Bioengineering, University of California, San Francisco, United States
Figures
Figure 1 with 6 supplements
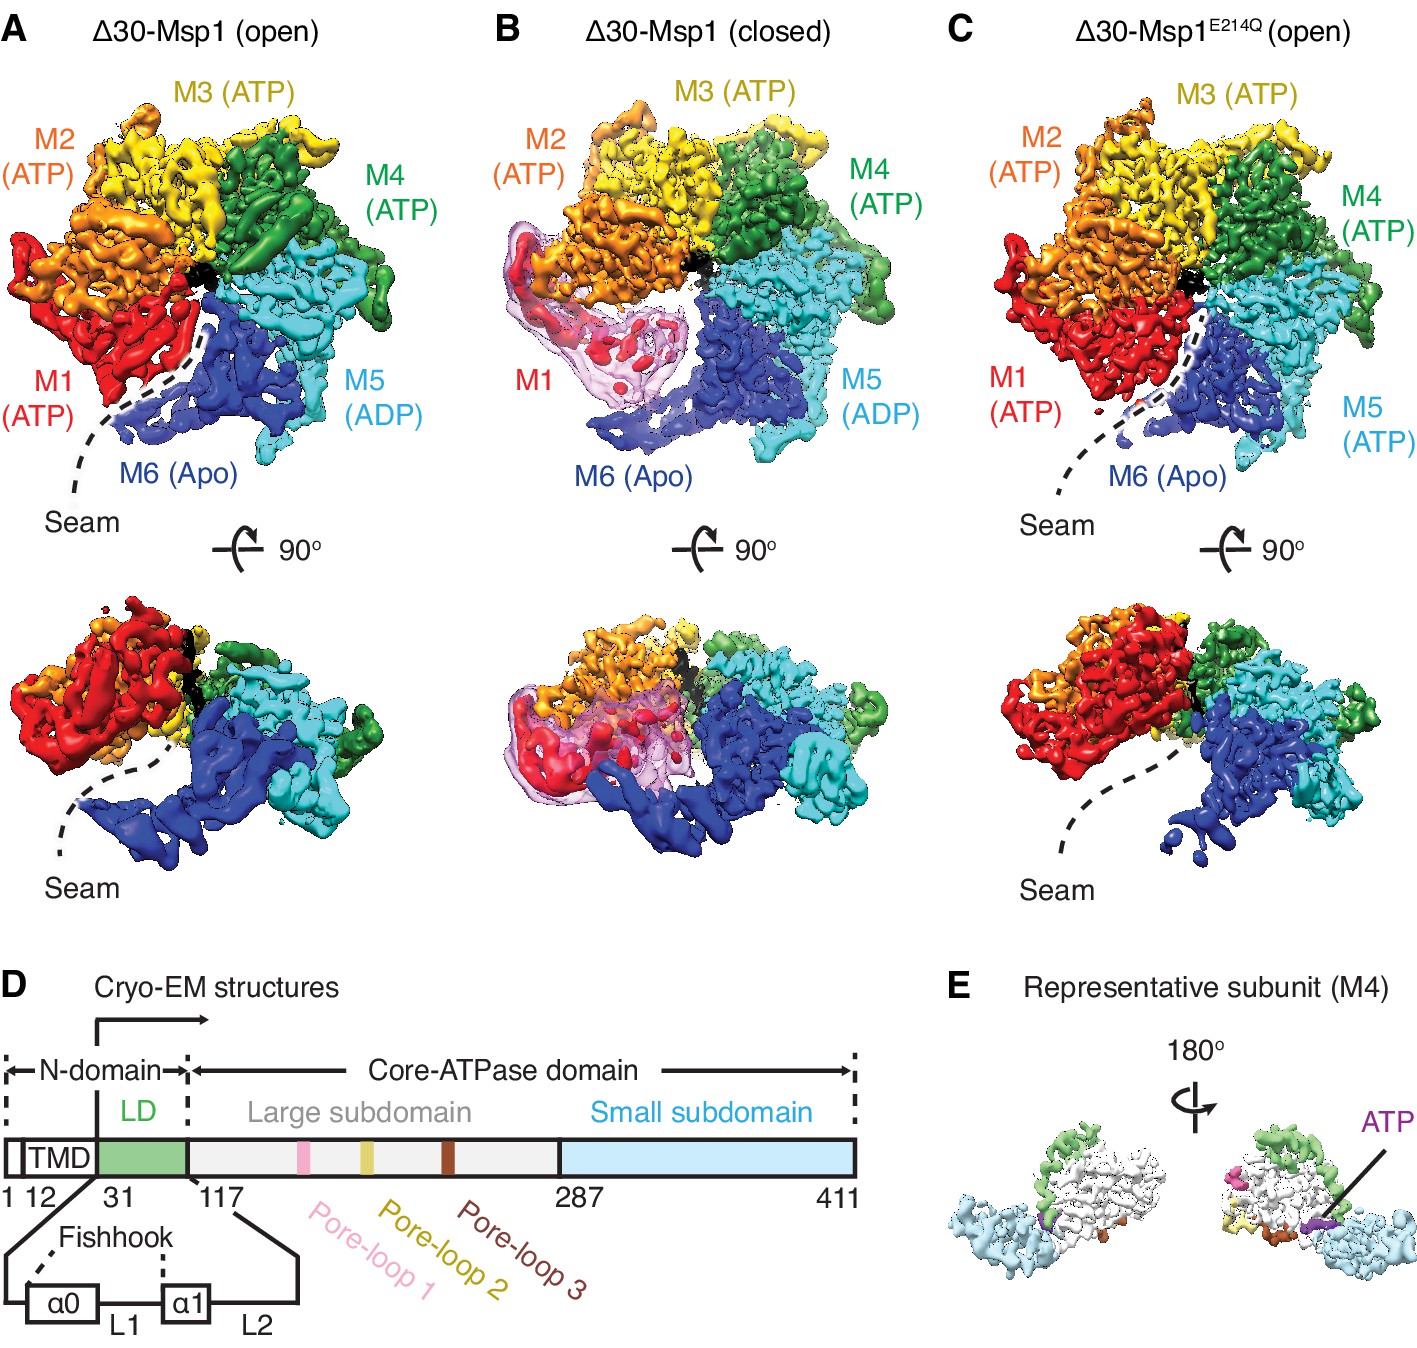
Architecture of the Msp1-substrate complexes.
(A to C) Final reconstructions of Δ30-Msp1 (open), Δ30-Msp1 (closed) and Δ30-Msp1E214Q complexes shown in top and side views. Each subunit (M1 to M6) is assigned a distinct color, and the substrate is shown in black. The spiral seams of the two open conformations (panels A and C) are denoted with dashed lines. In (B), the map for the mobile subunit M1 is depicted in two thresholds: in red is σ = 5.3 (same to the rest five subunits) and in light pink is σ = 2.5. (D) Schematic of individual domains and structural elements of Msp1. The numbers are based on the C. thermophilum Msp1. (E) A representative Msp1 subunit (M4) with domains and structural elements colored according to (D). ATP is shown in purple.
Figure 1—figure supplement 1
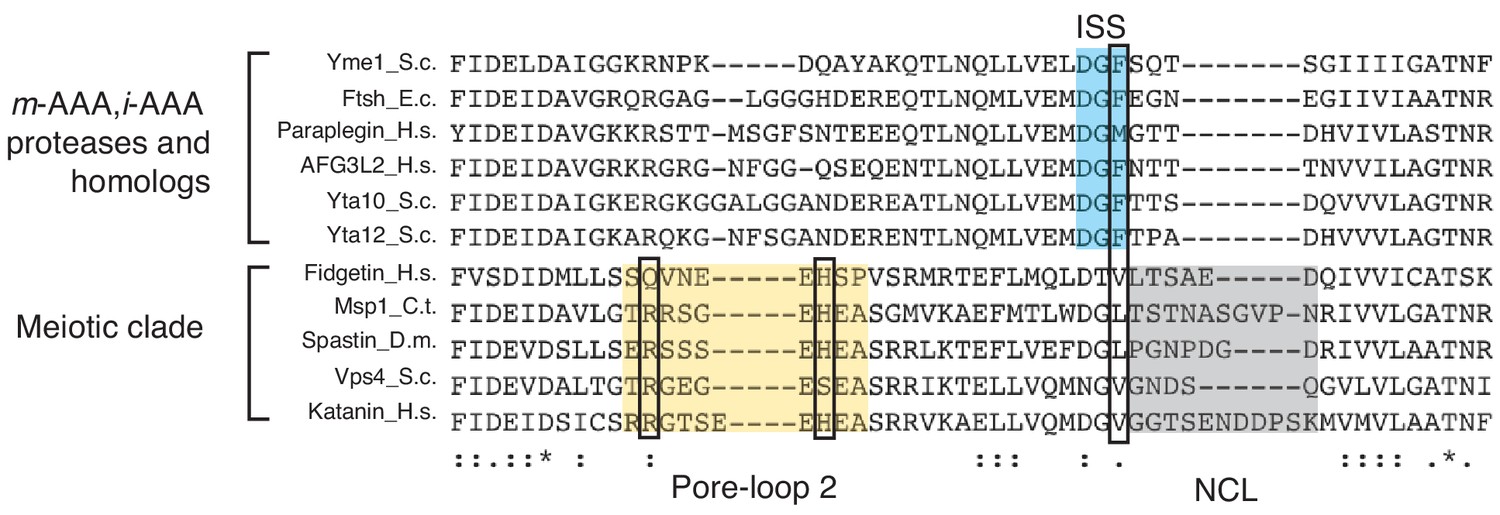
Sequence comparison of AAAMC ATPases to the mitochondrial AAA proteases suggests structural similarity within the meiotic clade.
The sequences of five major members of the meiotic clade AAA (AAAMC) proteins are aligned by the Clustal Omega software (Sievers et al., 2011). From top to bottom are fidgetin (H. sapiens), Msp1 (C. thermophilum), spastin (D. melanogaster), Vps4 (S. cerevisiae), and katanin (H. sapiens). The ISS motif in the AAA proteases are highlighted in blue. The key amino acid that is responsible for allosteric communication of nucleotide states in Yme1 is highlighted in a box. The meiotic clade has a valine or a leucine instead of a phenylalanine at this position. Pore-loop two is highlighted in yellow, and the NCL in gray. The H227 (highlighted in the box) that interacts with the peptide backbone is also present in fidgetin, katanin and spastin. The conserved arginine (R222 in Msp1) that mediates interactions with pore-loops 1 and 3 from subunits on both sides (Figure 3—figure supplement 2) is also highlighted in a box.
Figure 1—figure supplement 2
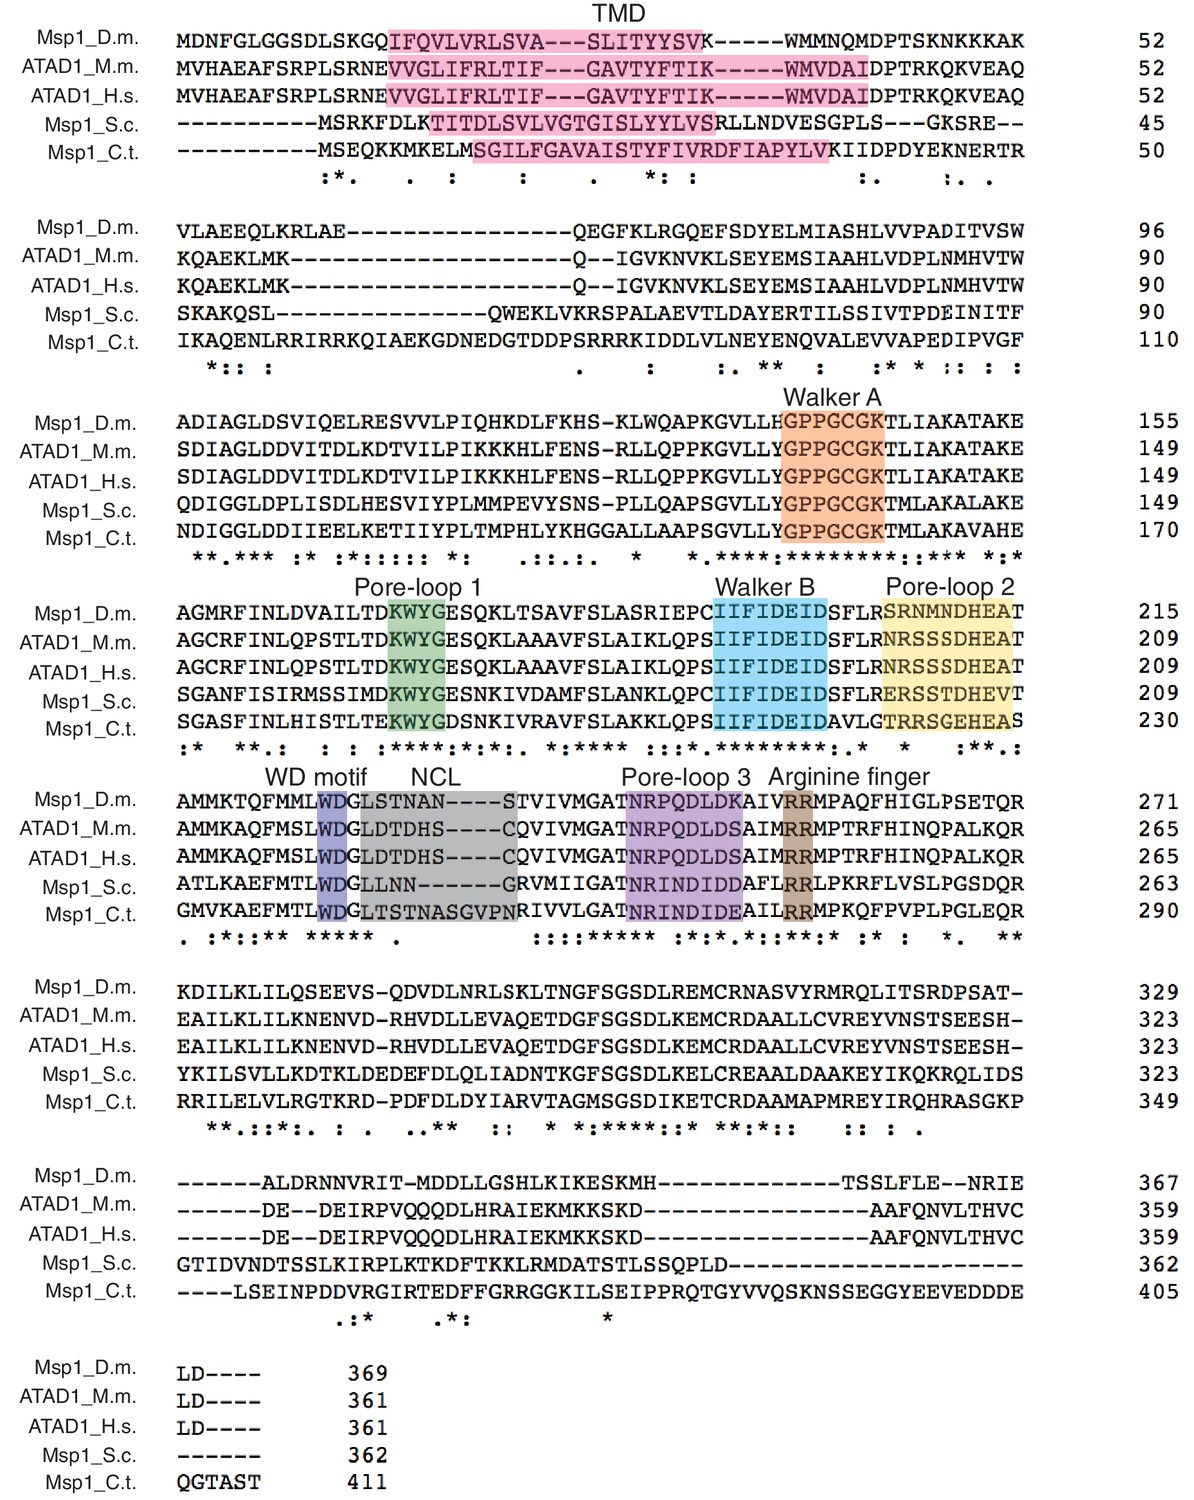
Primary sequence alignment of Msp1 homologs showing conserved structural elements.
The primary sequences of Msp1 from D. melanogaster; ATAD1 from M. musculus, H. sapiens, and Msp1 from S. cerevisiae and C. thermophilum are aligned using Clustal Omega (Sievers et al., 2011). The important structural elements such as the Walker A and Walker B motifs, the arginine fingers are strictly conserved. Pore-loops 1, 2 and 3 also show a high degree of conservation. The structural elements are colored individually and labeled above the sequences.
Figure 1—figure supplement 3
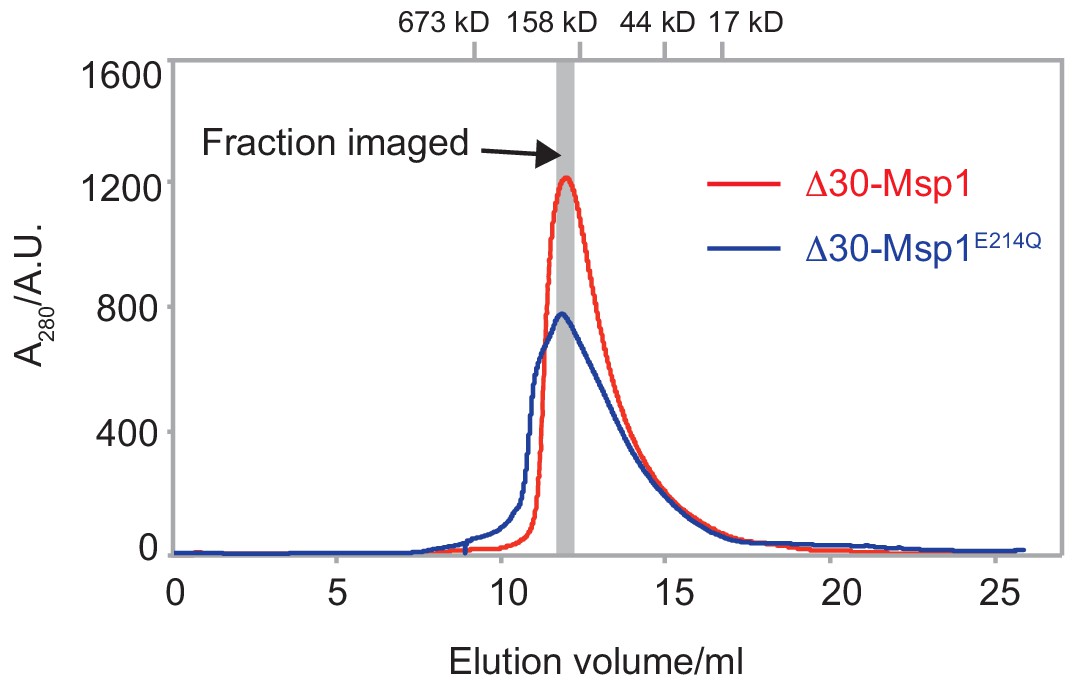
The SEC traces of the Δ30-Msp1 and the Δ30-Msp1E214Q proteins.
The SEC traces of both proteins show that the wild-type Msp1 (red line) forms a homogeneous oligomer on the gel filtration column, whereas Msp1 with a Walker B mutation (blue line) forms higher order oligomers too. The gray bar indicated the fraction that was imaged by EM. The gel filtration standards were indicated on the top of the graph. The x-axis represents the elution volume, and the y-axis represents the A280 absorbance.
Figure 1—figure supplement 4
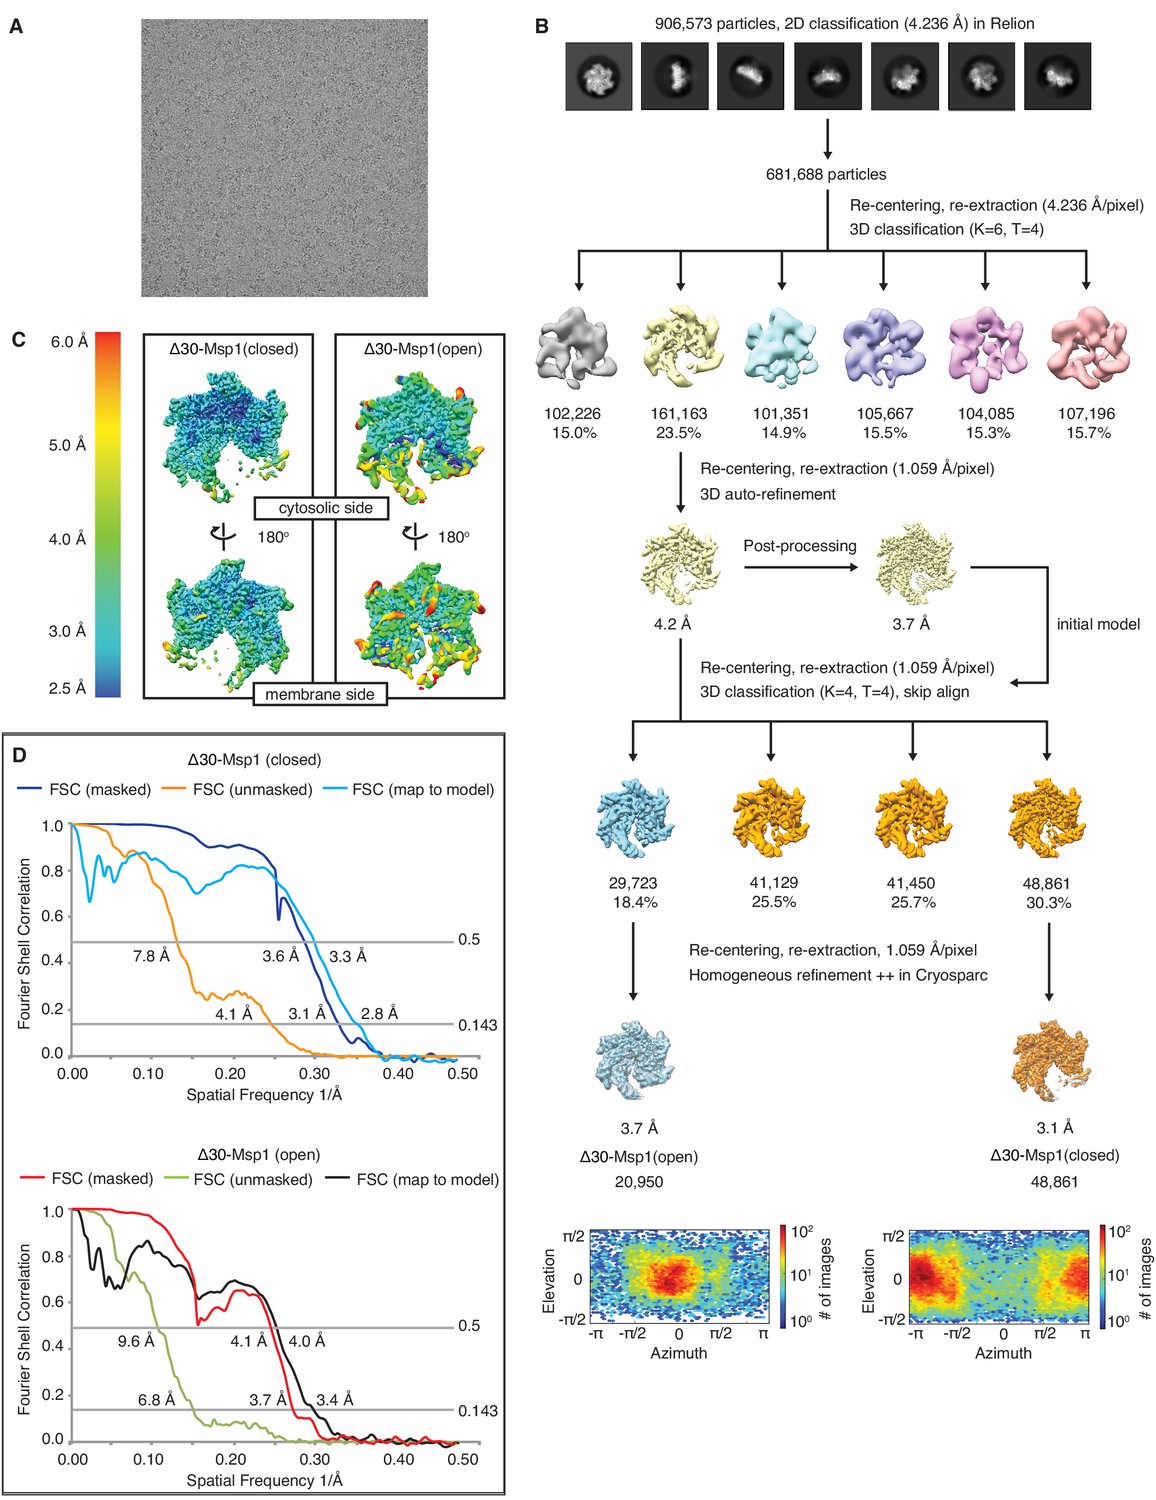
Data analysis scheme of the Δ30-Msp1 structures.
(A) Representative micrograph showing the quality of data used for the final reconstruction of the Δ30-Msp1 (open) and Δ30-Msp1 (closed) structures. (B) Data processing scheme showing the 2D and 3D classification done using the RELION software. The first rounds of 3D classification generated a consensus model of 3.7 Å resolution where the mobile subunit (M1) has poor density. To identify different conformations, we performed another round of 3D classification without alignment. This yielded two distinct conformations. The open and the closed conformations were individually refined in cryoSPARC to generate the final structures of 3.7 Å and 3.1 Å, respectively. Angle distributions are shown under the two structures, respectively. (C) Local resolution maps of the open and the closed conformations show that the core of the protein complex including the central pore and the nucleotide binding pockets are the best resolved regions. The side facing the cytosol is better resolved than the side facing the membrane. (D) Fourier Shell Correlation (FSC) plots of the 3D reconstructions of Δ30-Msp1: Δ30-Msp1 (closed) masked (dark blue), Δ30-Msp1 (closed) unmasked (orange) and Δ30-Msp1 (closed) map to model (light blue); Δ30-Msp1 (open) masked (red), Δ30-Msp1 (open) unmasked (green) and Δ30-Msp1 (open) map to model (black).
Figure 1—figure supplement 5
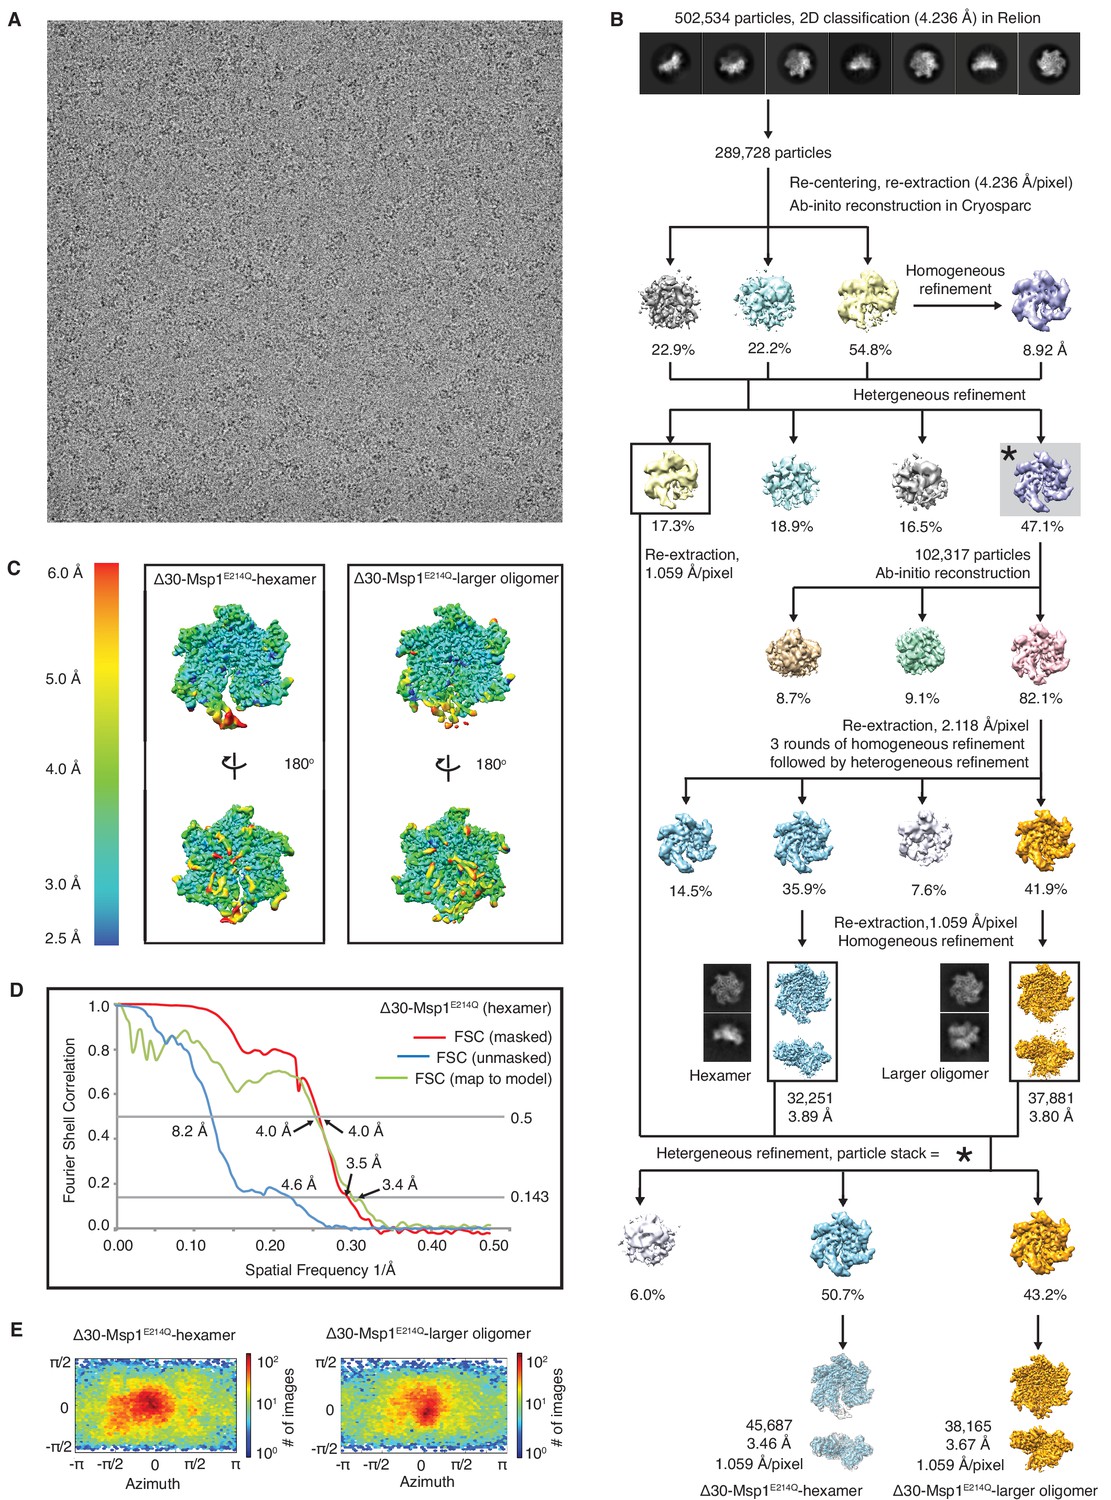
Data analysis flow for the Δ30-Msp1E214Q structure.
(A) Representative micrograph showing the quality of the data used to generate the 3D reconstruction. (B) Data processing scheme showing that the RELION software was used for 2D classification, and the cryoSPARC software was used to generate the ab initio 3D models. Rounds of homogeneous and heterogeneous refinement was performed to identify the hexamer and the larger oligomer species at 3.89 Å and 3.80 Å each. In order not to lose good particles along the many rounds of refinement, these two structures were used as input models to perform another round of heterogeneous refinement against the particle stack from the first round of heterogeneous refinement (indicated with *). The final refinement yielded reconstructions of 3.5 and 3.7 Å for the hexamer and the larger oligomer species respectively. (C) Local resolution maps of the hexamer and the larger oligomer structures generated with cryoSPARC. The core of the protein complex including the central pore and the nucleotide binding pockets are among the best resolved regions. The side facing the cytosol is better resolved than the side facing the membrane. (D) Fourier Shell Correlation (FSC) plots of the 3D reconstructions of the Δ30-Msp1E214Q hexamer: masked (red), unmasked (blue) and map to model (green). (E) Angle distribution of particles of the hexamer and the larger oligomer species generated by cryoSPARC. Model building for the larger oligomer showed potential clash between subunits, which is further described in Figure 1—figure supplement 6.
Figure 1—figure supplement 6
Structure of the larger oligomer shows potential steric clash between the additional subunit and the TMD of existing subunits.
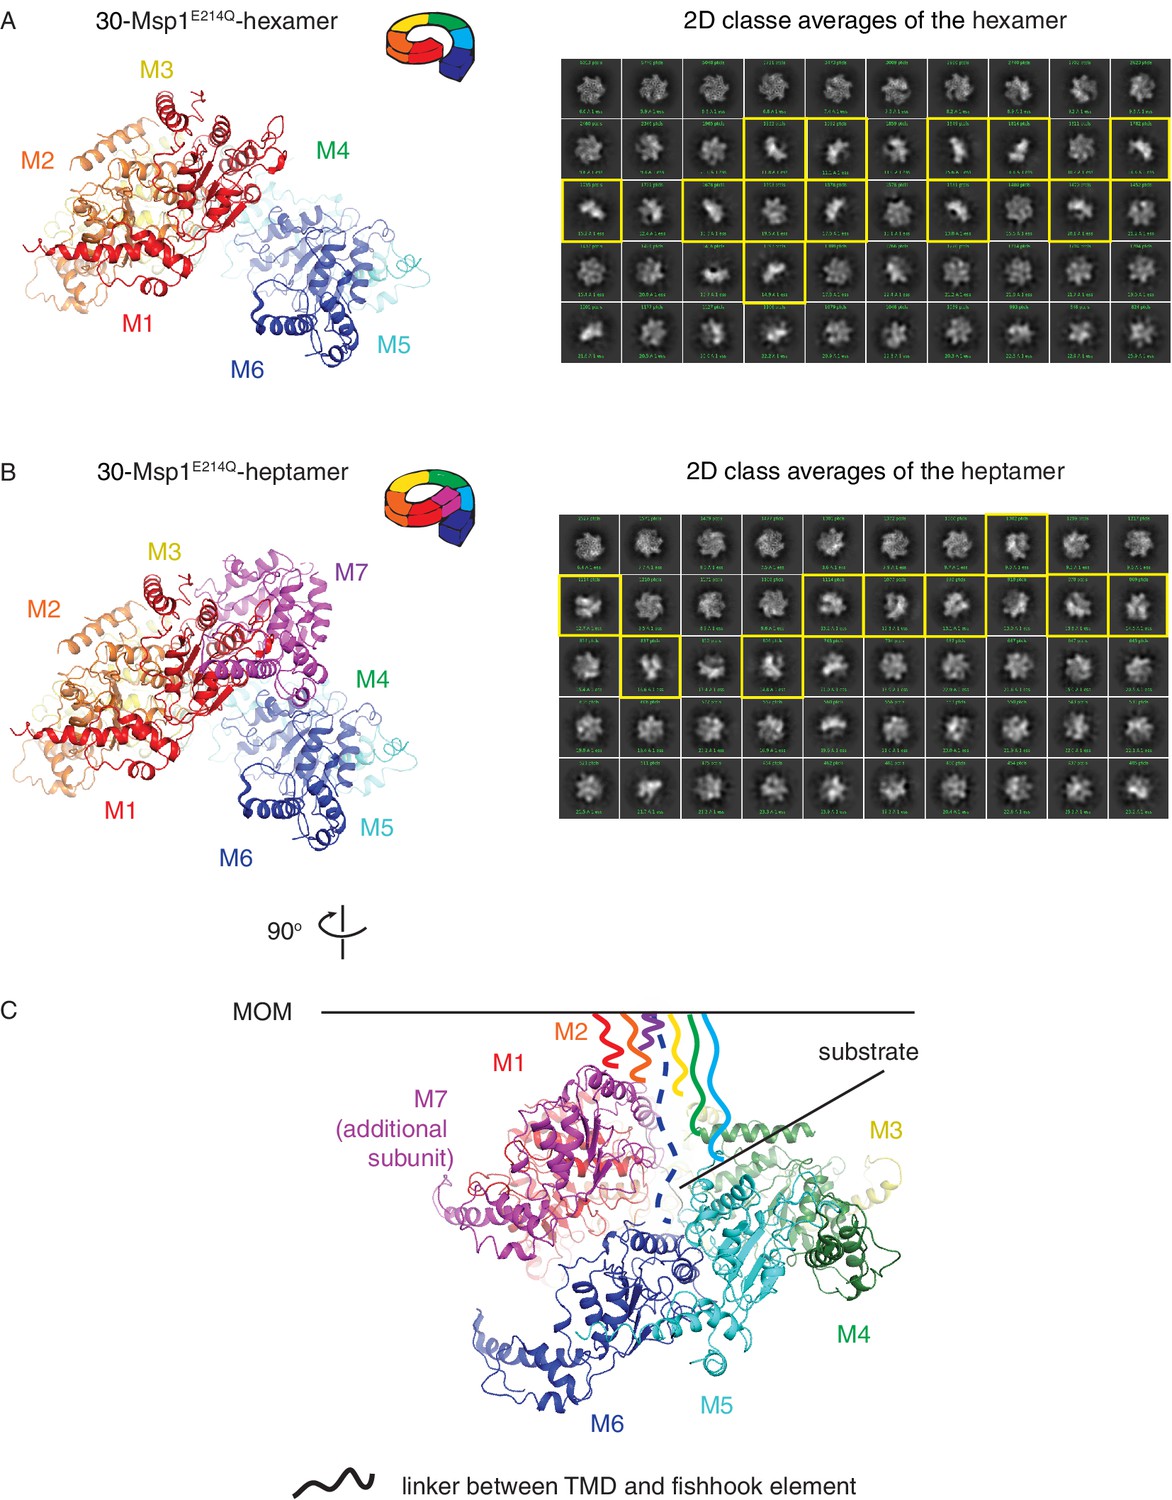
(A) Left: structure of the Δ30-Msp1E214Q -hexamer showing an open spiral conformation as described in Figure 1 and the main text. Each monomer is colored as in Figure 1. Right: 2D classification of the hexamer class. Representative side views that show a single layer of subunits are highlighted in yellow. (B) Left: structure of the Δ30-Msp1E214Q-heptamer showing an additional subunit (M7, colored in magenta) growing along the helix. Right: 2D classification of the heptamer class. Representative side views that show a two layers of subunits are highlighted in yellow. (C) Structure of the Δ30-Msp1E214Q-heptamer shown 90o rotated from the view in (B). The MOM is denoted as a black line. The part of the linker (central hub, see Figure 2A) that is not resolved in the structure that connects the fishhook element and the TMD is shown as squiggly lines with colors matching the subunit. For all seven subunits to be anchored in the membrane, M7 potentially clashes with the linker of M6.
Figure 2 with 1 supplement
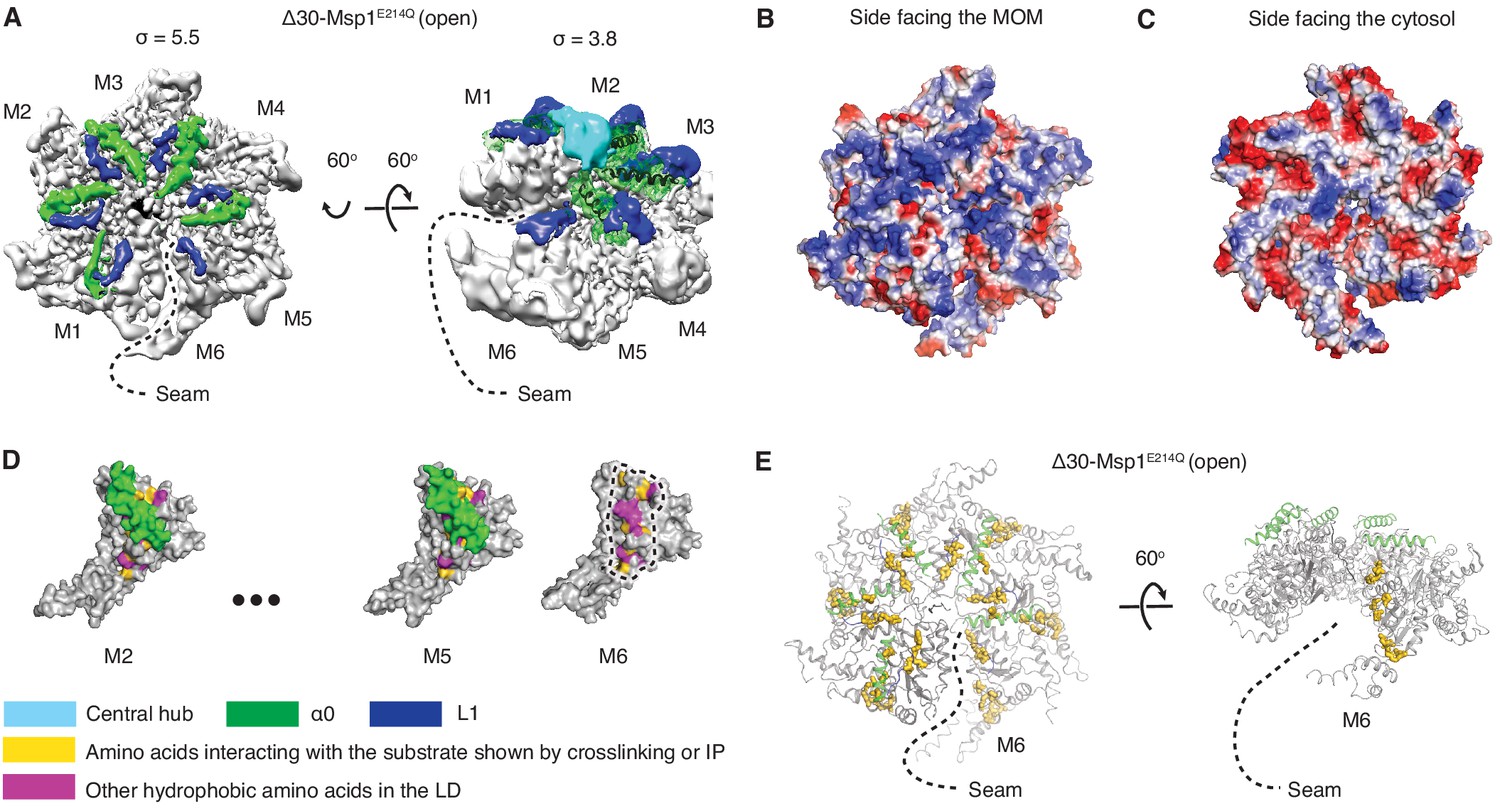
Structural details of the LD.
(A) Cryo-EM map of Δ30-Msp1E214Q showing the arrangement of the fishhook motifs in the spiral. M1-M5 shows significant density for the entire fishhook motif (α0 and the L1), whereas M6 shows density for L1 but not for α0. On the left, the structure is displayed at σ = 5.5, showing the fishhook motifs of different subunits radially organized with their N-termini pointing to the center of the spiral. On the right, the structure is displayed at σ = 3.8, showing the density of the central hub (cyan) emerge where the α0s of M1-M5 converge in a staggered alignment. (B and C) The electrostatic potential surface of the Δ30-Msp1E214Q structure shows that Msp1 displays a positively charged surface. Positive charges are colored in blue, negative charges in red, and neutral side chains in white. (D) Surface representation of individual subunits highlighting amino acids in the LD likely to engage the hydrophobic substrate. These amino acids are buried in by α0 in M2-M5 but exposed in M6 where α0 is melted. The labeled amino acids include the previously identified L89, Y92, E93, V101, P103, I106, D112, I113, G114, G115, I116, and other hydrophobic amino acids L87, V88, V96, A97, L98, V100, A102, P107, V108, F110. (E) Mapping of amino acids that interact with the substrate (identified in Li et al. (2019) by crosslinking or immunoprecipitation) to the Δ30-Msp1E214Q structure shows that on M6, they form a patch at the seam of the spiral. The central hub is colored in cyan, α0 in green, L1 in blue, previously identified amino acids that interact with the substrate in gold, and other hydrophobic amino acids in the LD in magenta.
Figure 2—figure supplement 1
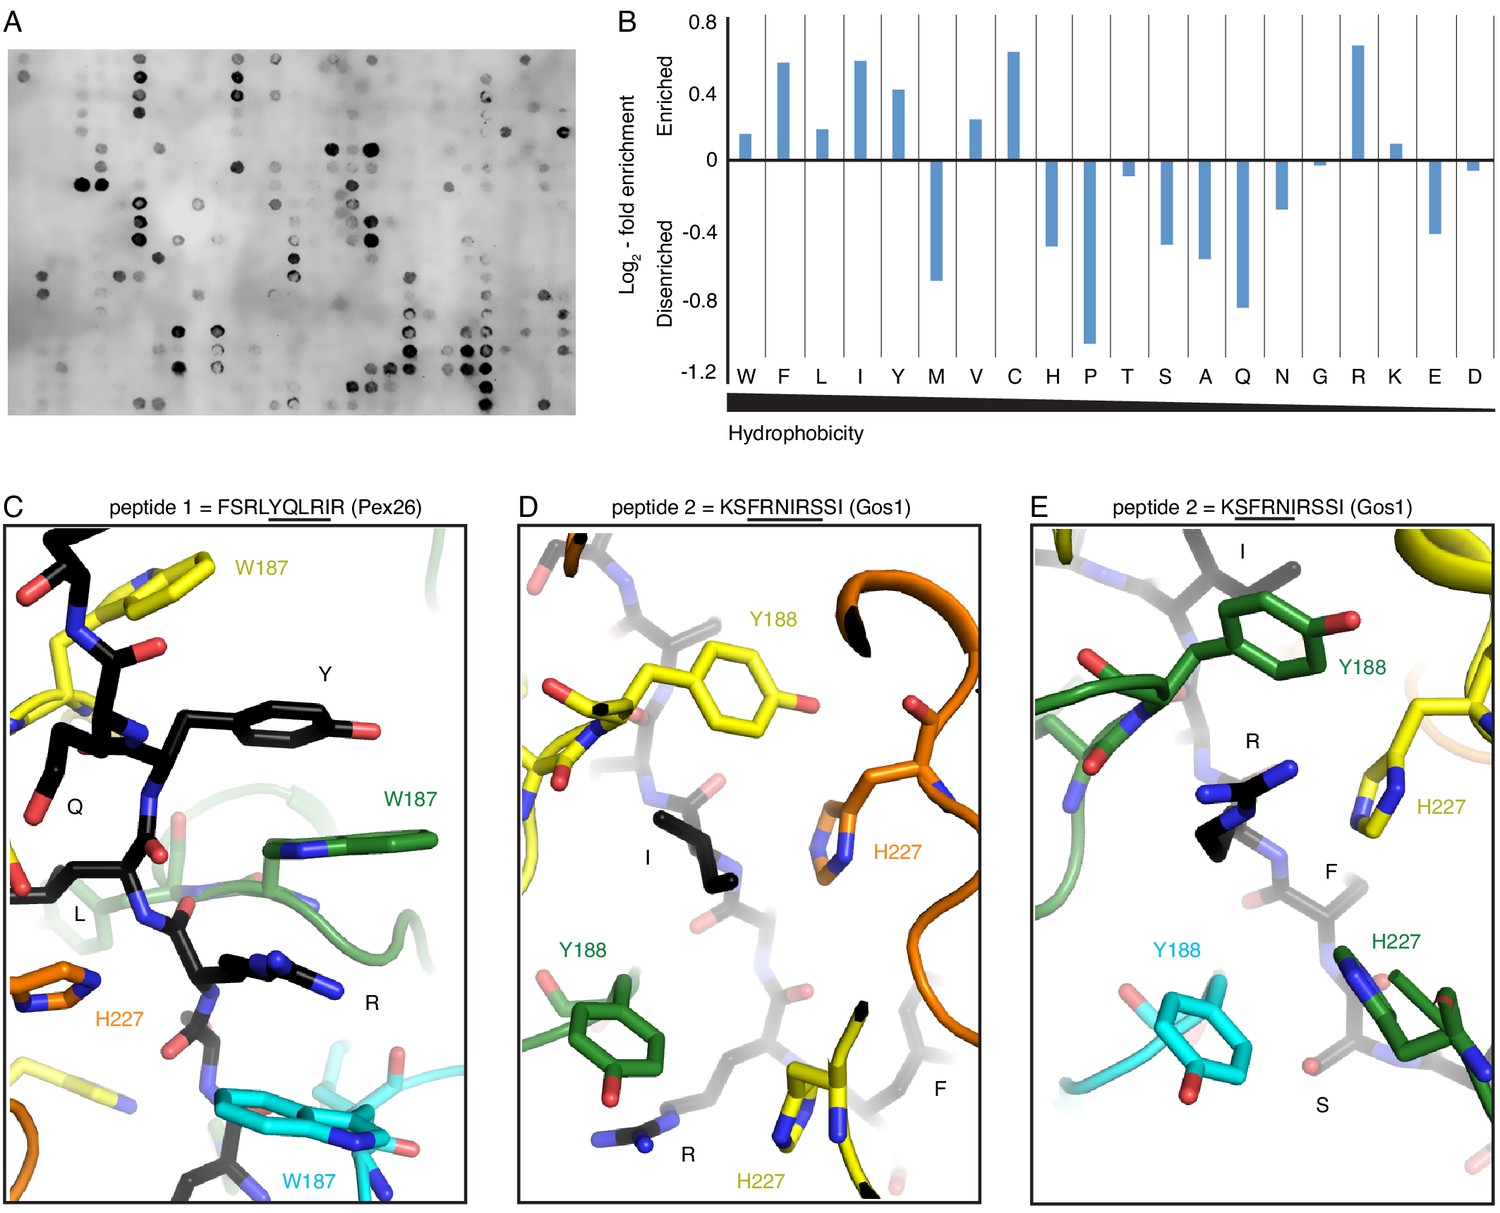
Peptide array and molecular modeling suggest Msp1’s substrate specificity.
(A) A peptide array showing the binding of Δ30-Msp1E214Q to the selected peptides. (B) Amino acid fold-enrichment is plotted against their hydrophobicity scale (Wimley and White, 1996). (C) As one of the top hits from the peptide array, a short peptide from the human Pex26 was modeled in the central pore. The tyrosine and the arginine form a continuous π-stacking network with pore-loop 1 W187. (D), (E) Part of the S. cerevisiae Gos1 peptide modeled in Msp1’s central pore showing the substrate’s side chains interacting with the tetrameric-aromatic cage formed by two pairs of interlocking H227-Y188.
Figure 3 with 2 supplements
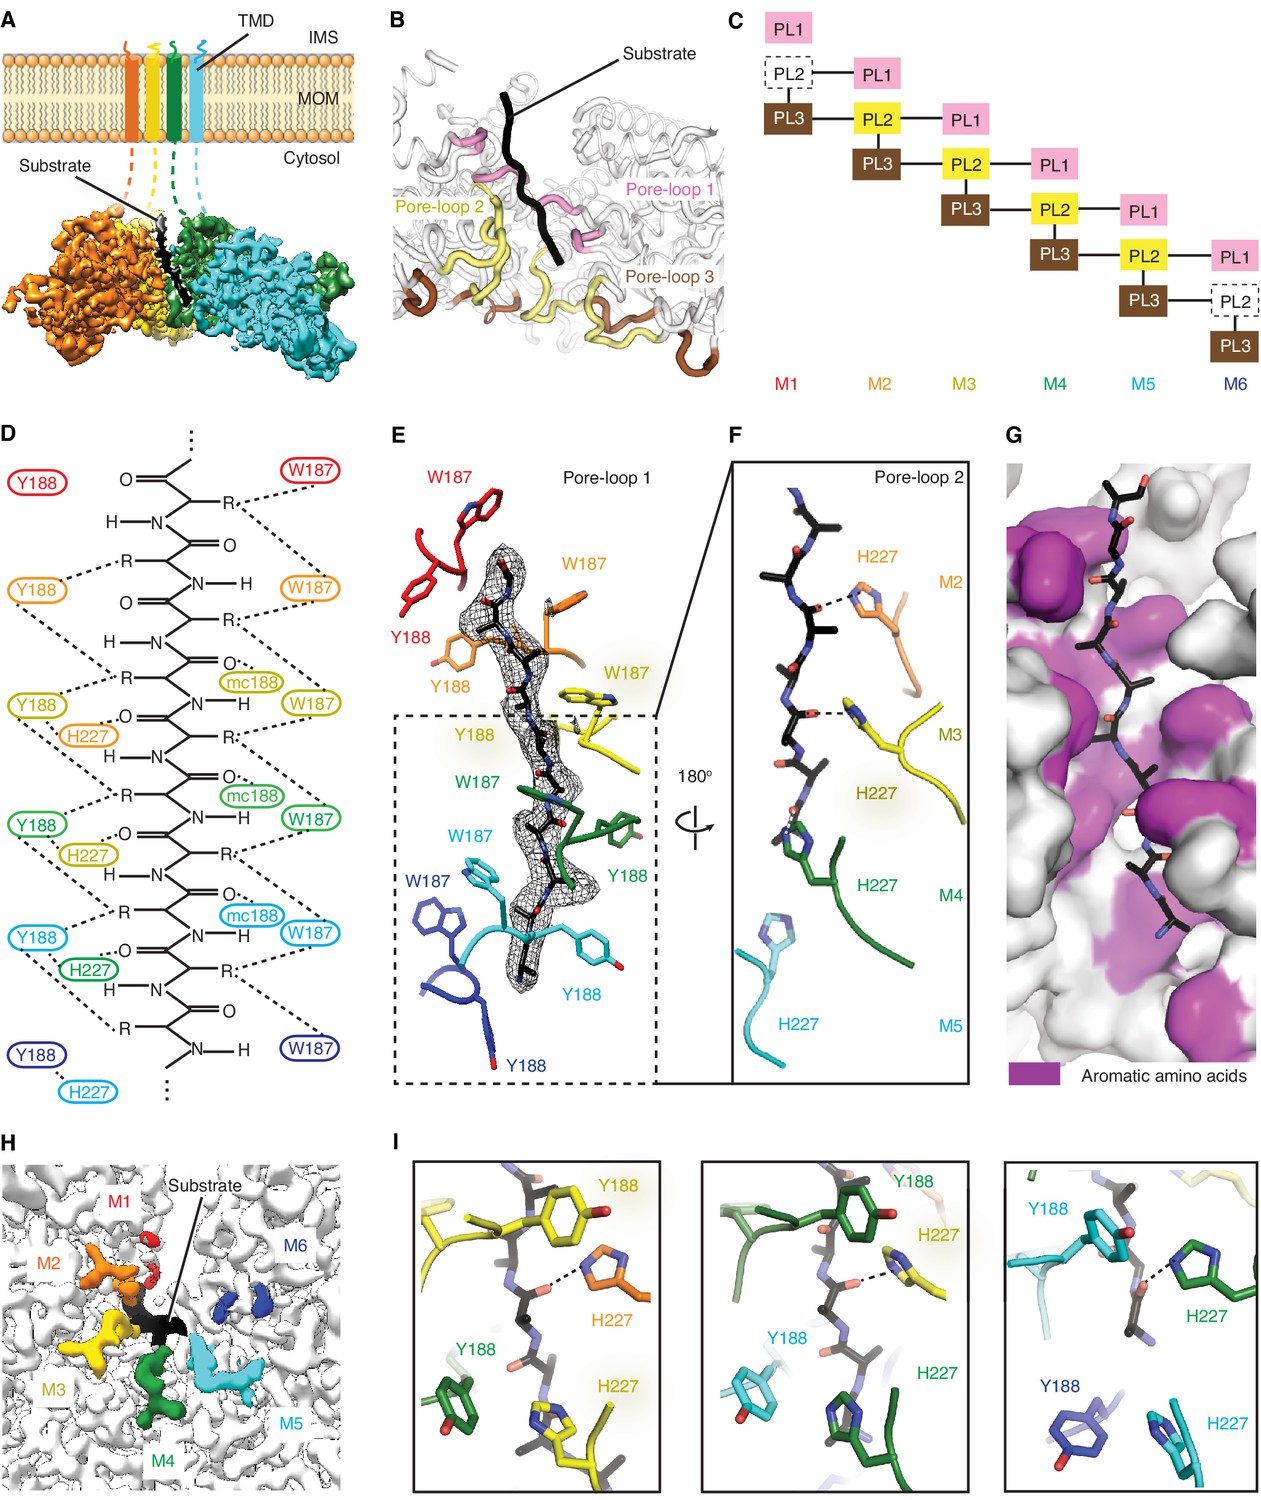
Msp1 interacts with the substrate via unique pore-loops.
(A) Cut-away view of the Δ30-Msp1E214Q map showing the substrate density (highlighted in white dashed lines) in the central pore. (B) Cartoon representation of the three pore-loops. Pore-loop one is shown in pink, pore-loop two in yellow and pore-loop three in brown. (C) Schematic diagram showing the interactions between pore-loops. Each line represents one interaction. The disordered pore-loops two in M1 and M6 are shown in boxes with dashed lines. (D) Schematic diagram showing that the pore-loops interact with the substrate through both side chain and main chain (mc) contacts. (E) Pore-loops one form a staircase around the substrate. The peptide density is shown in black mesh. (F) Pore-loops two form a second staircase below pore-loops 1. H227s form hydrogen bonds with the peptide backbone carbonyls (dashed lines). (G) Surface representation of the central pore, showing that the peptide (in stick representation) is surrounded by aromatic amino acids (colored in magenta) in the central pore. (H) Cryo-EM map showing the view of the central pore. Pore-loops 2 of M2-M5 are well-ordered, and those in M1 or M6 disordered. Pore-loops two are colored the same as in Figure 1. The substrate peptide is colored black. (I) Zoomed-in views of the peptide binding pockets showing that the substrate’s side chain is inserted into a tetrameric-aromatic cage formed by two pairs of interlocking Y188-H227 sidechains. From left to right are the tetrameric-aromatic cages formed by M2-M4, M3-M5, and M4-M6.
Figure 3—figure supplement 1
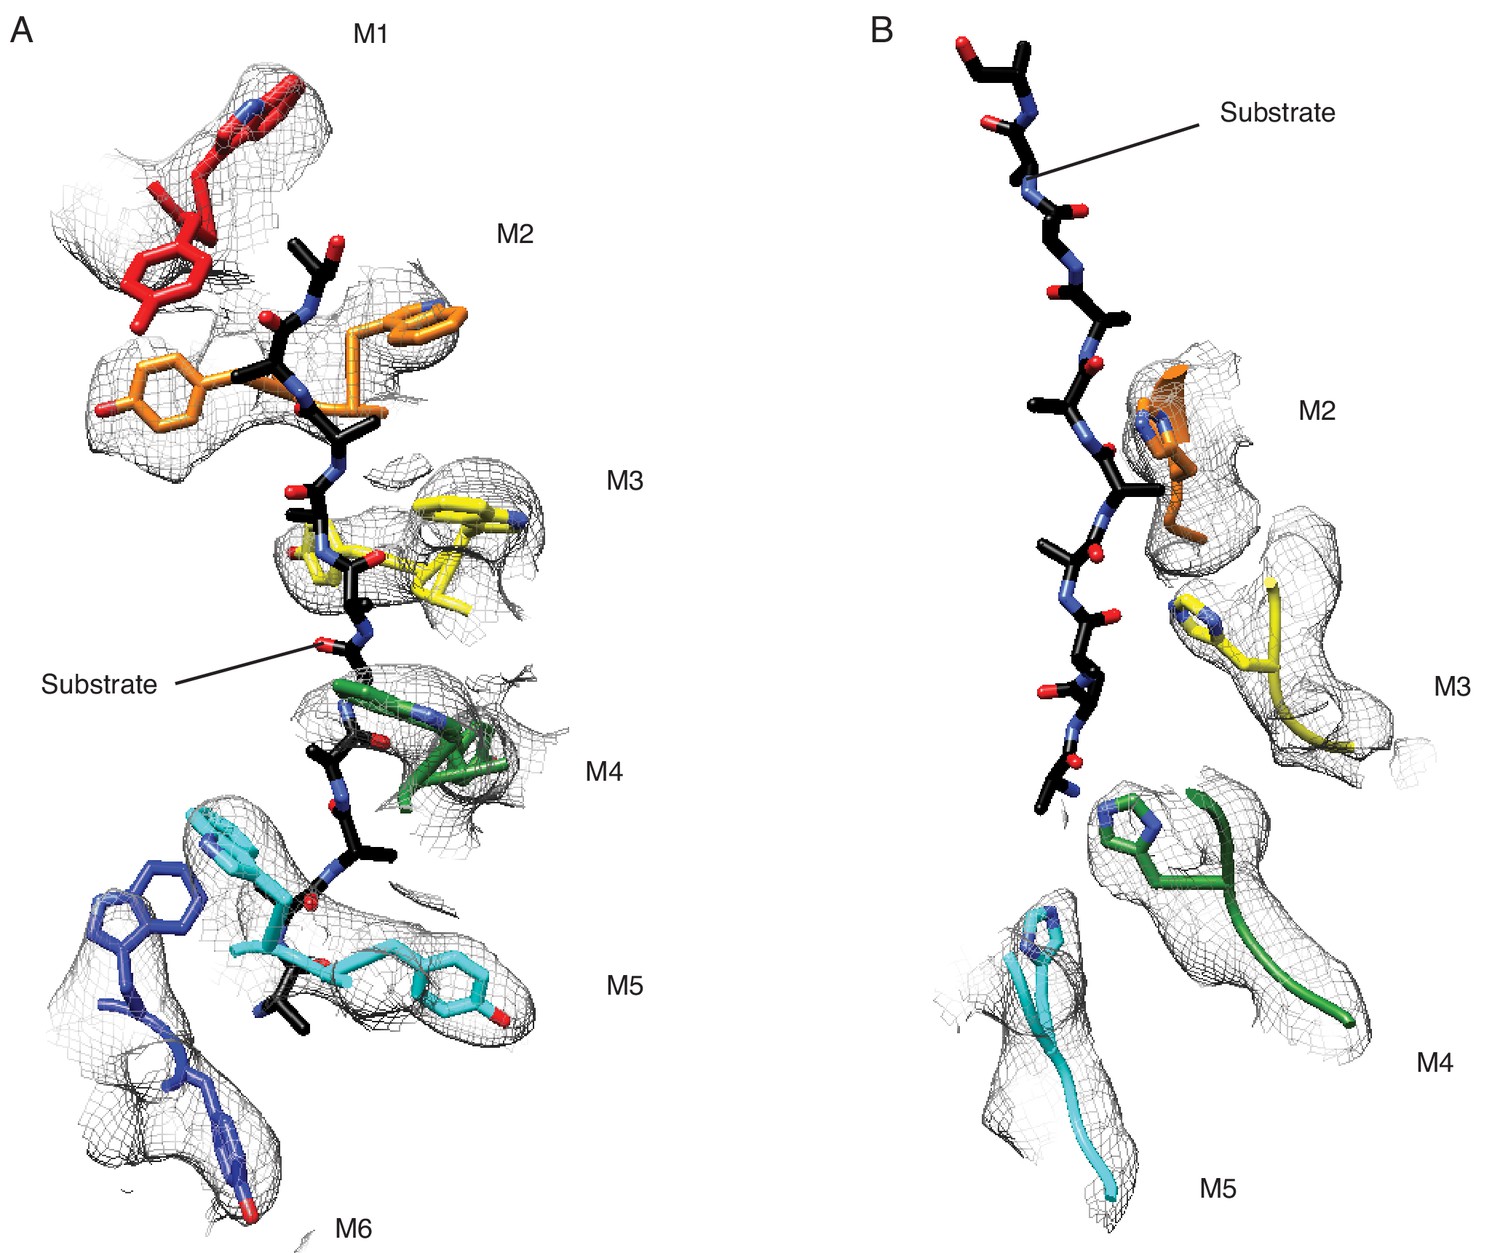
Structural details of the pore-loops’ interactions with the substrate.
(A) Pore-loops 1 (W187 and Y188) form a staircase around the peptide. (B) Pore-loops two from M2-M5 are well ordered, and H227 from M2-M4 directly contact the peptide backbone. The cryo-EM density is shown in meshes and the model in sticks.
Figure 3—figure supplement 2

Pore-loop two forms a web of interactions with pore-loops 1 and 3 from subunits on both sides.
View of the pore-loops in the Δ30-Msp1E214Q structure showing that pore-loop 2 interacts with pore-loop 1 through π - π stacking and pore-loop 3 via electrostatic and polar interactions. The π - π stacking interaction is shown with dashed lines, and the positive charges shown in blue, negative charges in red. Pore-loops 1 are shown in pink, pore-loops 2 in light yellow, and pore-loops 3 in brown.
Figure 4

Yeast growth assays.
Yeast growth assay showing mutations in the pore-loops, the WD motif and the ISS disrupt Msp1’s activity in vivo. All mutations are introduced to the S. cerevisiae Msp1 (S.c. Msp1) in the get3Δ msp1Δ background. The corresponding amino acid numbers in C. thermophilum are shown in parentheses. All the strains are grown on SD-URA plates at 37o C. This image is a representative of N = 3 trials.
Figure 5 with 1 supplement
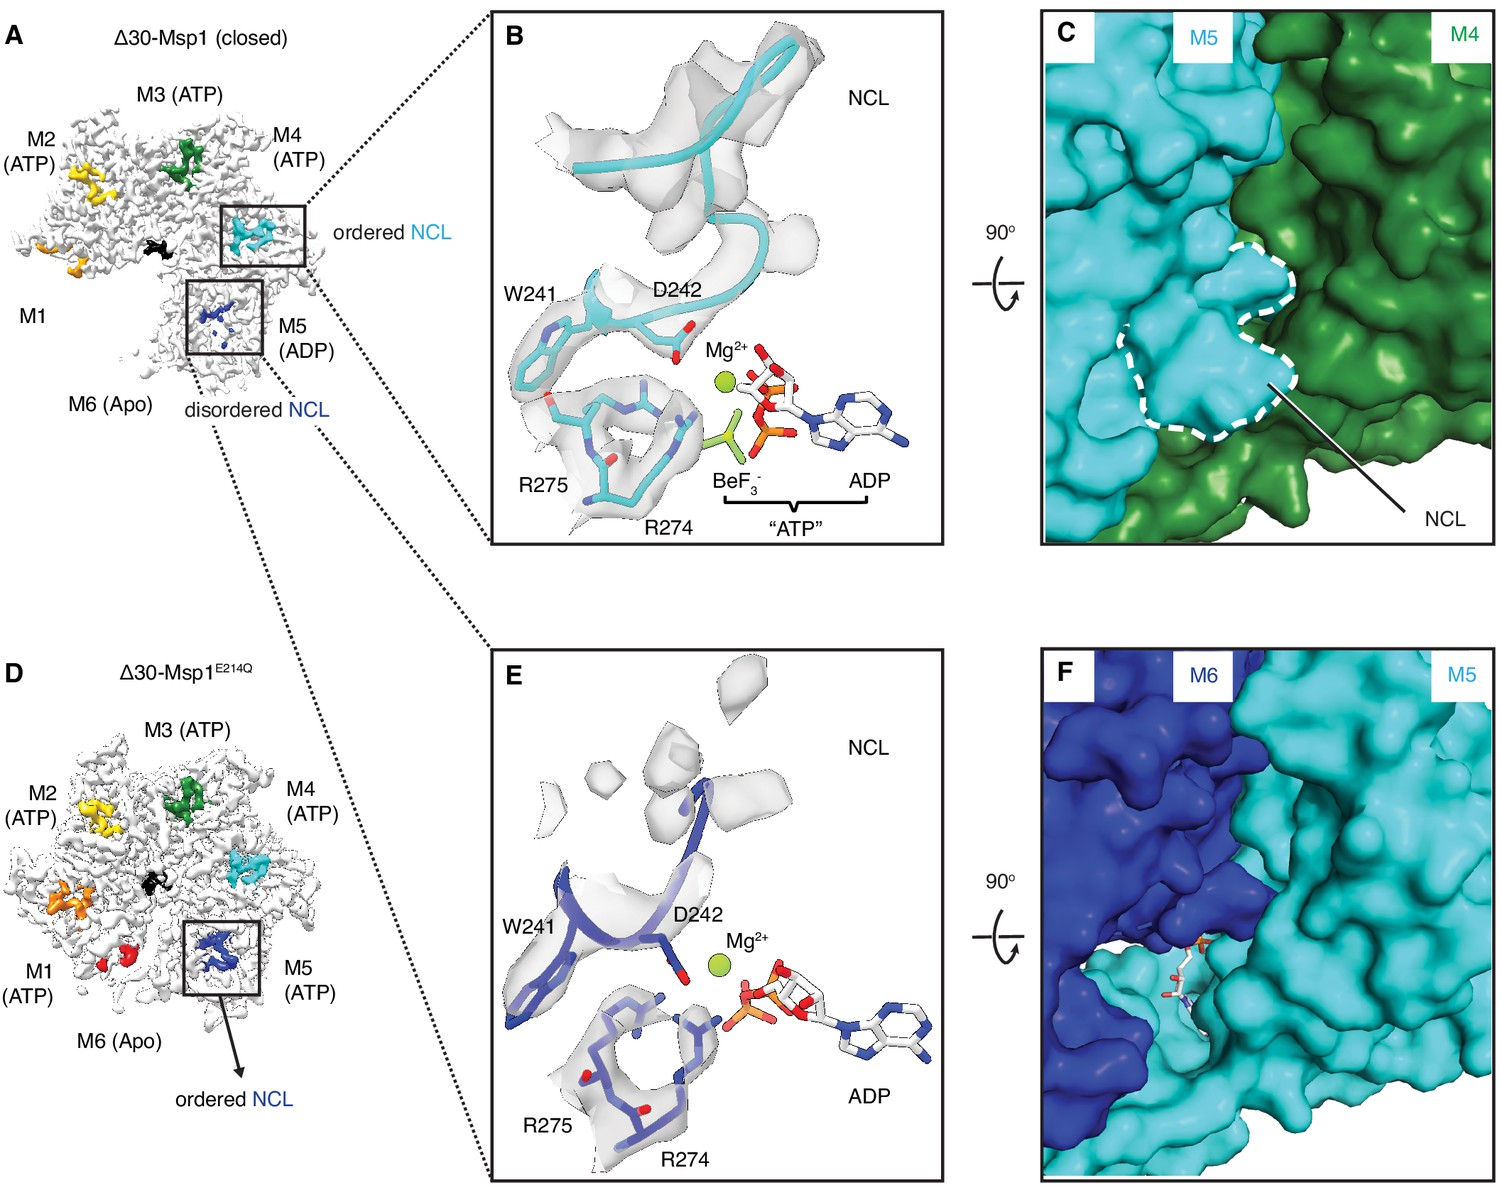
The NCL communicates the nucleotide-bound state between adjacent subunits.
(A) The cryo-EM map of Δ30-Msp1 showing that the NCLs interacting with the ATP-bound subunits (M2–M4) are well ordered, whereas those interacting with the ADP (M5) or the Apo (M1) subunits are disordered. (B) Map of the nucleotide-sensing elements in M5 showing well-ordered arginine fingers (R274, R275), WD motif (W241 and D242) and the NCL. (C) 90o rotated view of (B) showing the surface representation of the M4-M5 interface. The NCL in M5 is highlighted in dashed lines. (E) Map of the nucleotide-sensing elements in M6, showing its less rigid arginine fingers, WD motif, and disordered NCL. (F) 90o rotated views of (E) showing the surface representation of the M5-M6 interface. (D) The cryo-EM map of Δ30-Msp1E214 showing that the NCL of M6 is well-ordered as it senses the ATP-bound state of M5. The Msp1 subunits and their corresponding NCLs are colored as in Figure 1. Nucleotides and BeF3- are shown in stick representation and colored by element. Mg2+ is shown as a green spheres.
Figure 5—figure supplement 1
Structural details of nucleotide binding pockets in the Δ30-Msp1 (closed) complex.
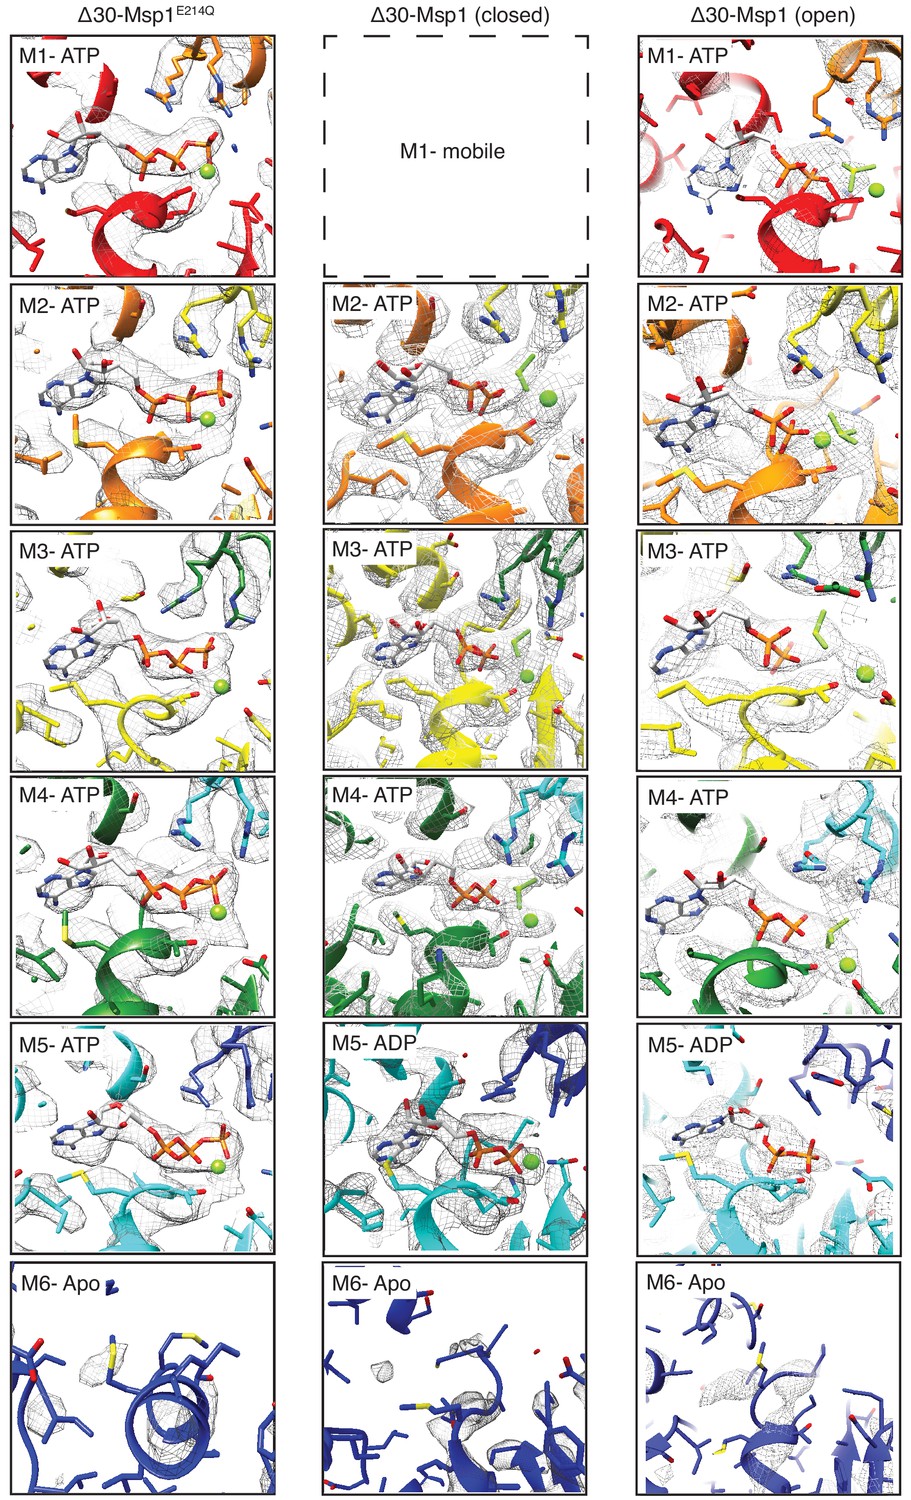
The cryo-EM density of the entire nucleotide binding pockets with all the subunits in all three structures (except for M1 in Δ30-Msp1, which has poor density due to its movement) is shown. In the ATP-bound subunits, well-resolved density for ATP or ADP•BeFx was observed, and the arginine fingers from the clockwise subunit also show strong, continuous density, suggesting the presence of the γ phosphate or the BeFx ion. In M5 of the Δ30-Msp1 structures however, only density for ADP was observed, and the density for the arginine fingers in M6 have discontinuous density, suggesting that this nucleotide-binding pocket lacks a BeFx ion in the majority of particles. Finally, in M6 of all three structures, the poor density of the nucleotide is indicative of low occupancy, and we therefore assign M6 as a nucleotide-free apo-subunit.
Figure 6 with 3 supplements

Mechanistic model for Msp1-mediated peptide extraction.
(A) Model for Msp1’s mechanism illustrated in three major steps. The Msp1 models on the left and the middle are of Δ30-Msp1E214; the right one is generated by rotating the Δ30-Msp1E214Q model counter clockwise by one monomer. A model TA protein substrate is shown in black, with its C-terminal tail inserted in the membrane (shown as a gray bar). The folded α0 is shown in cylinder representation, and the melted one in squiggly lines. Msp1 subunits are colored the same as in Figure 1 and α0 in tan. The positions of Msp1’s N-terminal transmembrane regions are schematically indicated. (B) Schematic model for the NCL-mediated inter-subunit communication. The disordered subunit and the dislodged NCLs are outlined with dashed lines. (C) Schematic model for substrate translocation through the central pore, showing the sequential disengagement of pore-loops 1 and 2 at the bottom (M6) position and the sequential engagement at the subunit at the top (M1) position. The disordered subunit and pore-loops are outlined in dashed lines.
Figure 6—figure supplement 1
Comparison of ISS and NCL.
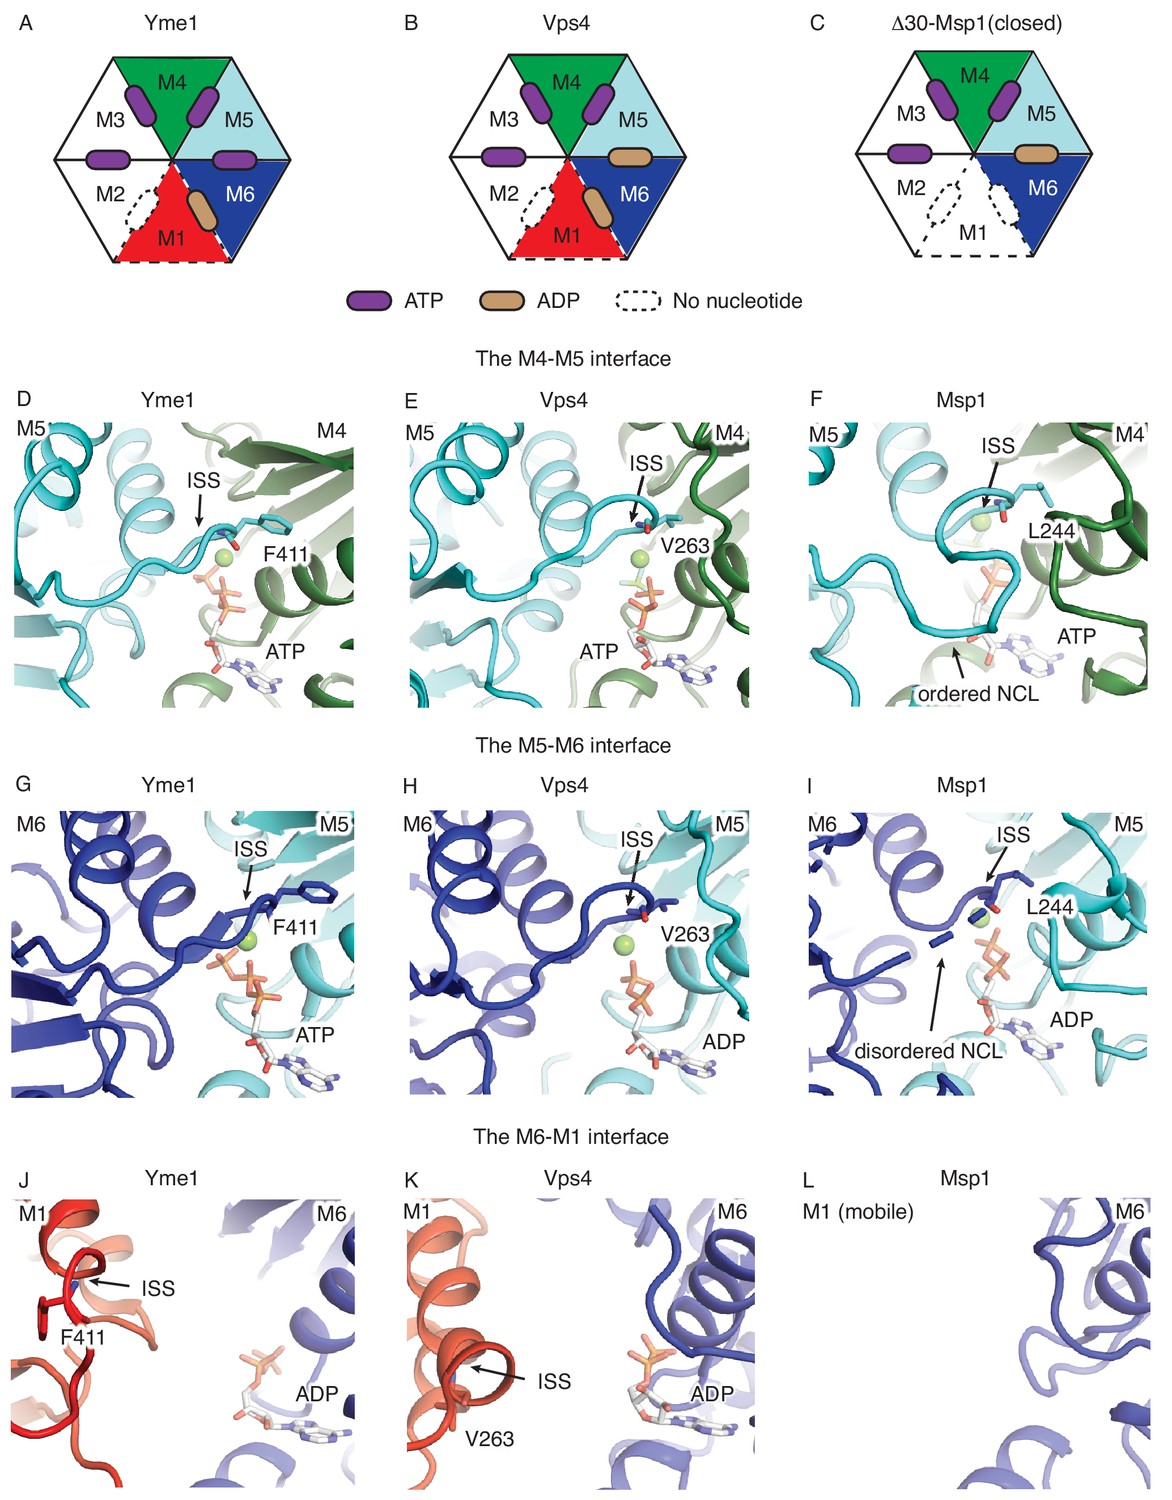
(A), (B), and (C) show the schematic views of the Yme1 (PDB ID: 6azo), Vps4 (PDB ID: 6ap1) and Msp1 hexamers, showing the nucleotide-bound states of each subunit. The mobile subunit (M1) is shown in dashed lines. The subunits are numbered according the Msp1 structure in this work. (D), (E) and (F) are the zoomed-in views of the M4-M5 interface; (G), (H) and (I) are the zoomed-in views of the M5-M6 interface and (J), (K) and (L) are the zoomed-in view of the M1-M6 interface. The protein is shown in cartoon representation, the nucleotide in stick representation, and the magnesium in spheres. The position of the ISS and the NCL are highlighted by arrows, and the key amino acid that participate in inter-subunit stacking (F411 in Yme1, V263 in Vps4 and L244 in Msp1) are shown in sticks. All protein subunits are colored according to Figure 1.
Figure 6—figure supplement 2
Cryo-EM map of the ISS motif in M1.
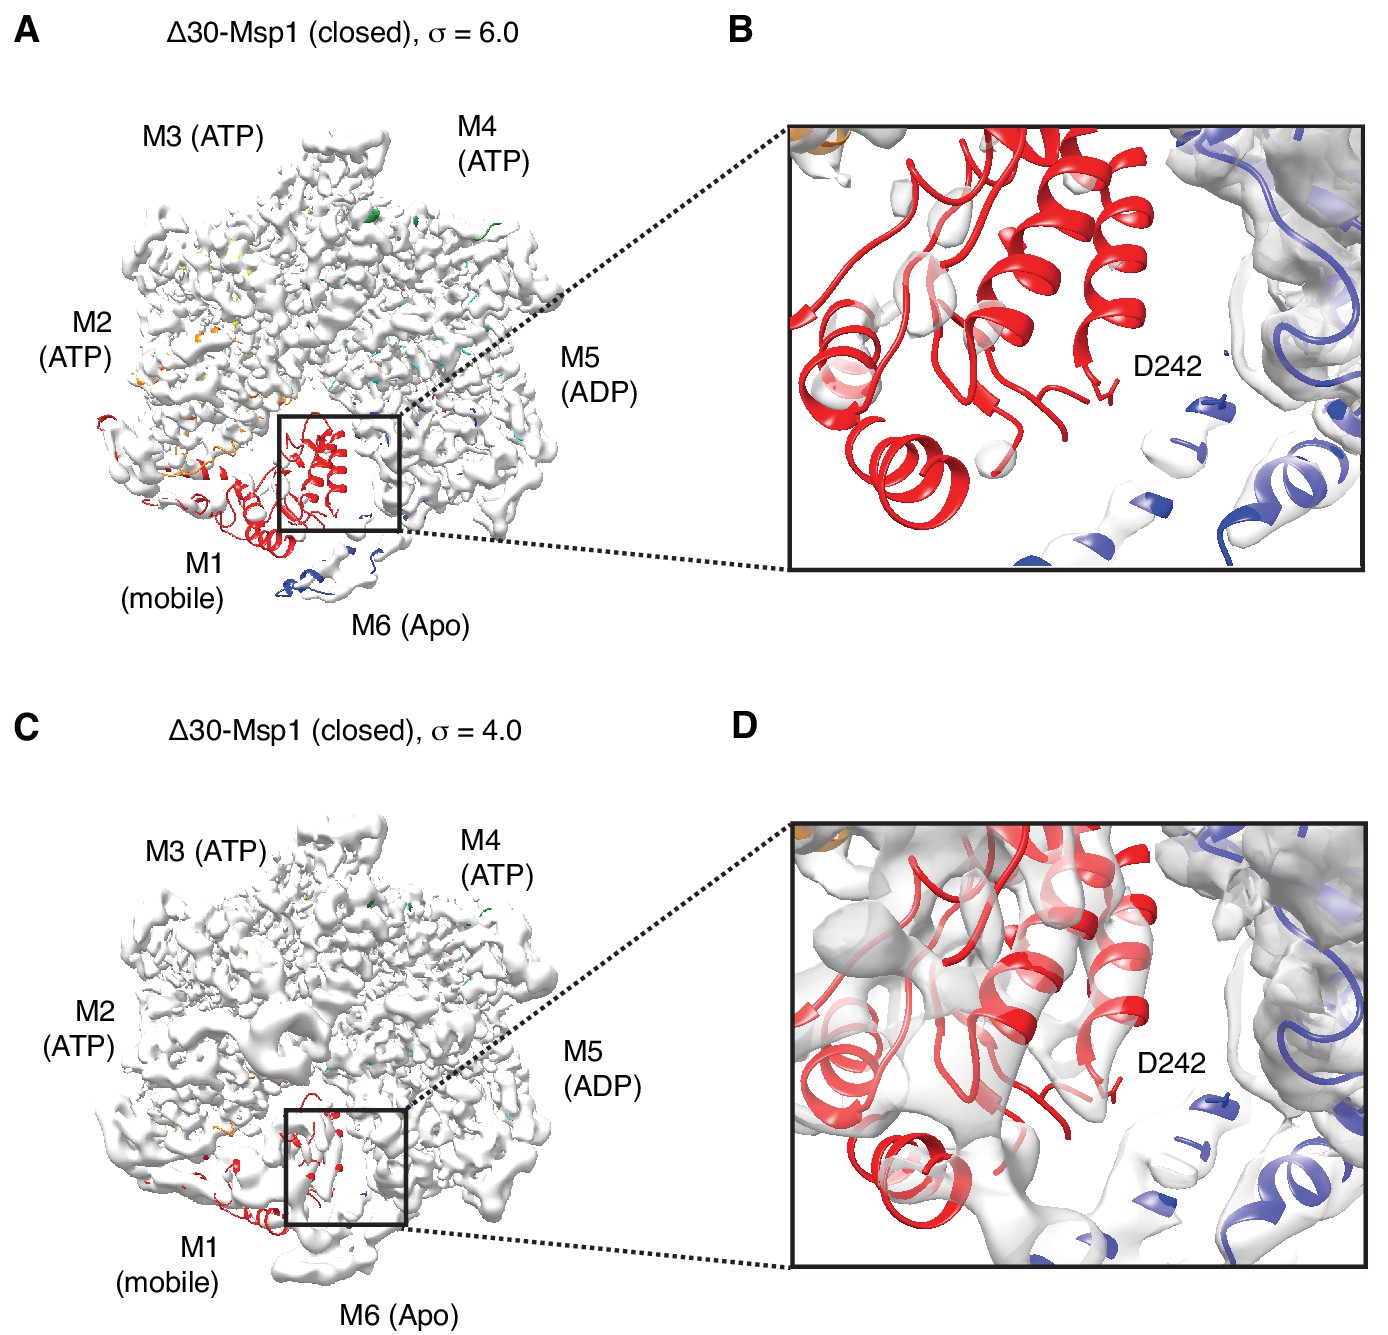
(A) Cryo-EM map of the Δ30-Msp1 shown at σ = 6.0. The M1 subunit is colored in red. (B) Zoom-in of the ISS region of M1 in panel (A). (C) Cryo-EM map of the Δ30-Msp1 shown at σ = 4.0. (D) Zoom-in of the ISS region of M1 in panel (B), where the density for the helix that bears the ISS motif is visible, but not sufficient to assign whether a helical refolding event has taken place.
Figure 6—figure supplement 3
Overlay of the Δ30-Msp1 (closed) to the Vps4-substrate complex structures.
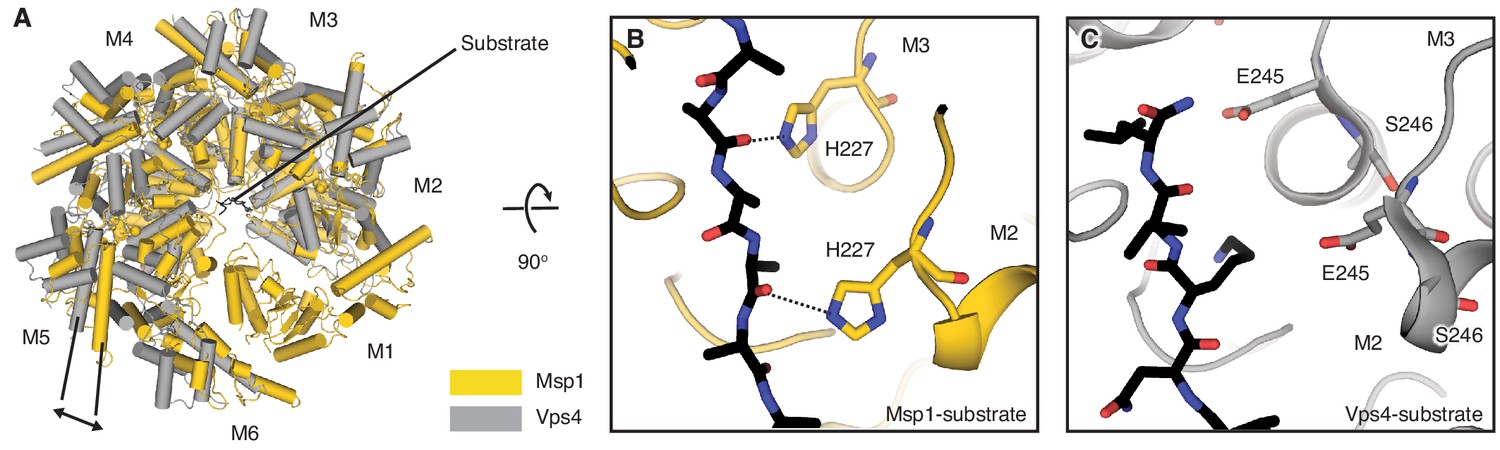
(A) M2 of the Δ30-Msp1 (closed) structure is superimposed to the corresponding subunit of the Vps4-substrate complex structure. As indicated by the arrow, Msp1 forms a tighter ring around the substrate than Vps4. Msp1 is colored in gold, and Vps4 is colored in gray. α helices are shown as cylinders. (B) Zoomed-in view of the central pore of Δ30-Msp1 (closed) structure showing close interactions between the pore-loop two and the substrate. H227 of M2 and M3 form hydrogen bonds with the peptide’s backbone carbonyl groups. (C) Zoomed-in view of the central pore of the Vps4-substrate complex shown in the same orientation as (B), showing that pore-loop 2 of Vps4 does not form any direct contact with the substrate.
Videos
Video 1
The linker domain (LD) of Msp1.
Video 2
The substrate interactions in the central pore.
Tables
Table 1
Data collection, reconstruction, and model refinement statistics.
| Data collection | |||
|---|---|---|---|
| Δ30-Msp1E214Q | Δ30-Msp1 | ||
| Microscope | Titan Krios | Titan Krios | |
| Voltage (keV) | 300 | 300 | |
| Nominal magnification | 22500x | 22500x | |
| Exposure navigation | Stage shift | Stage shift | |
| Electron exposure (e-Å−2) | 70 | 70 | |
| Exposure rate (e-/pixel/sec) | 7.85 | 7.85 | |
| Detector | K2 summit | K2 summit | |
| Pixel size (Å) | 1.059 | 1.059 | |
| Defocus range (μm) | 0.6–2.0 | 0.6–2.0 | |
| Micrographs | 1443 | 2502 | |
| Total extracted particles (no.) | 502534 | 902573 | |
| Reconstruction | |||
| Δ30-Msp1E214Q | Δ30-Msp1 (closed) | Δ30-Msp1 (open) | |
| EMDB ID | 20320 | 20318 | 20319 |
| Final particles (no.) | 45687 | 48861 | 29723 |
| Symmetry imposed | C1 | C1 | C1 |
| FSC average resolution at 0.143/0.5, unmasked (Å) | 4.6/8.2 | 4.1/7.8 | 6.8/9.6 |
| FSC average resolution at 0.143/0.5, masked (Å) | 3.5/4.0 | 3.1/3.6 | 3.7/4.1 |
| Applied B-factor (Å) | 89.9 | 83.7 | 70.8 |
| Final reconstruction package | cryoSPARC v0.55 private beta | ||
| Local resolution range | 2.8–6.0 | 2.5–5.5 | 2.5–6.0 |
| Refinement | |||
| PDB ID | 6PE0 | 6PDW | 6PDY |
| Protein residues | 1672 | 1469 | 1660 |
| Ligands | 10 | 11 | 13 |
| RMSD Bond lengths (Å) | 0.003 | 0.003 | 0.002 |
| RMSD Bond angles (o) | 0.685 | 0.671 | 0.639 |
| Ramachandran outliers (%) | 0.06 | 0.07 | 0.06 |
| Ramachandran allowed (%) | 12.25 | 10.63 | 10.90 |
| Ramachandran favored (%) | 88.69 | 89.30 | 89.04 |
| Poor rotamers (%) | 0.14 | 0.25 | 0.00 |
| CaBLAM outliers (%) | 6.09 | 6.74 | 6.86 |
| Molprobity score | 1.99 | 2.06 | 2.14 |
| Clash score (all atoms) | 7.40 | 9.27 | 11.29 |
| B-factors (protein) | 73.26 | 69.33 | 107.50 |
| B-factors (ligands) | 54.73 | 46.51 | 78.24 |
| EMRinger Score | 2.00 | 2.92 | 1.62 |
| Model refinement package | phenix.real_space_refine (1.13-2998-000) | ||
Key resources table
| Reagent type (species) or resource | Designation | Source or reference | Identifiers | Additional information |
|---|---|---|---|---|
| Gene (Chaetomium thermophilum) | Msp1 | Uniprot | G0S654 | |
| Genetic reagents (S. cerevisiae) | MATα leu2-3,112 TRP1 can1-100 ura3-1 ADE2 his3-11,15 (wild-type) | PMID: 24821790 | PWY1944 in the lab stock | |
| Genetic reagents (S. cerevisiae) | msp1Δ::HpHR | PMID: 24821790 | PWY1947 in the lab stock | |
| Genetic reagents (S. cerevisiae) | get3Δ::NATR | PMID: 24821790 | PWY1950 in the lab stock | |
| Genetic reagents (S. cerevisiae) | msp1Δ::HpHR get3Δ::NATR | PMID: 24821790 | PWY1953 in the lab stock | |
| Recombinant DNA reagent | GST-thrombin-C.thermo Msp1 (plasmid) | This paper | Materials and method section: cloning of Msp1 | |
| Recombinant DNA reagent | GST-thrombin-C. thermo Msp1 (E214) (plasmid) | This paper | Materials and method section: cloning of Msp1 | |
| Software, algorithm | MotionCor2 | PMID: 28250466 | RRID: SCR_016499 | |
| Software, algorithm | Relion | PMID: 23000701 | RRID: SCR_016274 | |
| Software, algorithm | Cryosparc | PMID: 28165473 | RRID: SCR_016501 | |
| Software, algorithm | UCSF Chimera | PMID: 15264254 | RRID: SCR_004097 | |
| Software, algorithm | GCTF | PMID: 26592709 | RRID: SCR_016500 | |
| Software, algorithm | Phenix | PMID: 20124702 | RRID: SCR_014224 | |
| Software, algorithm | Coot | PMID: 20383002 | RRID: SCR_014222 | |
| Software, algorithm | Pymol | Schrödinger, LLC | RRID: SCR_000305 |
Additional files
Download links
A two-part list of links to download the article, or parts of the article, in various formats.
Downloads (link to download the article as PDF)
Open citations (links to open the citations from this article in various online reference manager services)
Cite this article (links to download the citations from this article in formats compatible with various reference manager tools)
Structure of the AAA protein Msp1 reveals mechanism of mislocalized membrane protein extraction
eLife 9:e54031.
https://doi.org/10.7554/eLife.54031


