Vascular permeability in retinopathy is regulated by VEGFR2 Y949 signaling to VE-cadherin
- Department of Immunology, Genetics and Pathology, Rudbeck Laboratory, Science for Life Laboratory Uppsala University, Sweden
- Department of Clinical Neuroscience, Division of Eye and Vision, St. Erik Eye Hospital, Karolinska Institutet, Sweden
- IFOM-IEO Campus Via Adamello, Italy
- Max Planck Institute for Molecular Biomedicine, Germany
Figures
Figure 1
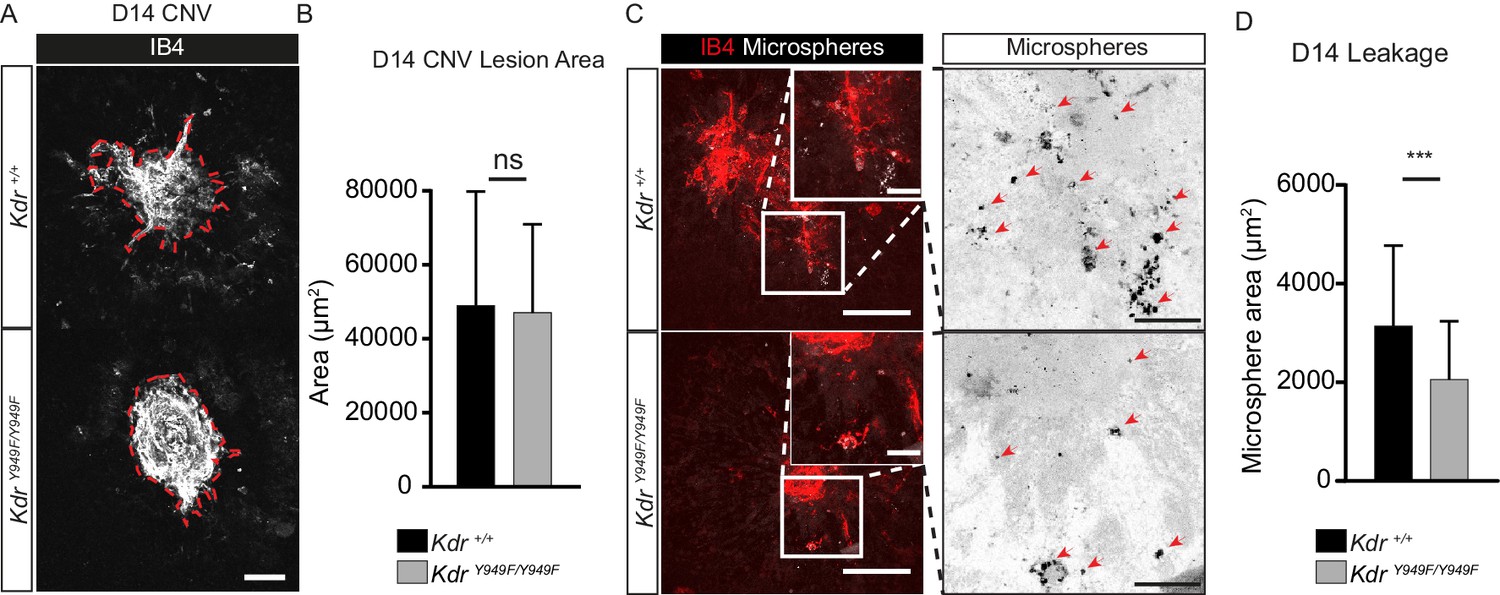
Reduced leakage from CNV lesions in KdrY949F/Y949F retinas at D14.
(A) Representative CNV lesions imaged from whole mount choroid tissue, collected at day (D) 14 after laser injury, from KdrY949F/Y949F and Kdr+/+ littermates, immunostained for isolectin B4 (IB4). Scale bar = 100 µm. Dotted red line highlights the extent of lesion formation. (B) Quantification of average lesion size at D14 after injury. n = 60–67 lesions per group from 9 to 11 mice per group. ns = not significant p=0.6882. (C) Representative images of D14 lesions from KdrY949F/Y949F and Kdr+/+ littermates immunostained for IB4 (red), showing accumulation of tail-vein injected, fluorescent 100 nm microspheres (white) in the tissue around the lesions. Insets enlarged (right) with microspheres shown as black dots on white background. Scale bar = 100 µm. Inset scale bar = 25 µm. Arrows point to areas of microsphere accumulation. (D) Quantification of the average area of accumulated microspheres per image after 2 min of circulation. n = 35–74 lesions per group from 7 to 14 mice per group. ***p<0.001 p=0.0006.
-
Figure 1—source data 1
Text file containing the ImageJ macro code used to quantify microsphere accumulation in CNV experiments.
- https://cdn.elifesciences.org/articles/54056/elife-54056-fig1-data1-v2.txt
-
Figure 1—source data 2
Excel file containing the collected CNV lesion size and microsphere area.
- https://cdn.elifesciences.org/articles/54056/elife-54056-fig1-data2-v2.xlsx
Figure 2 with 2 supplements
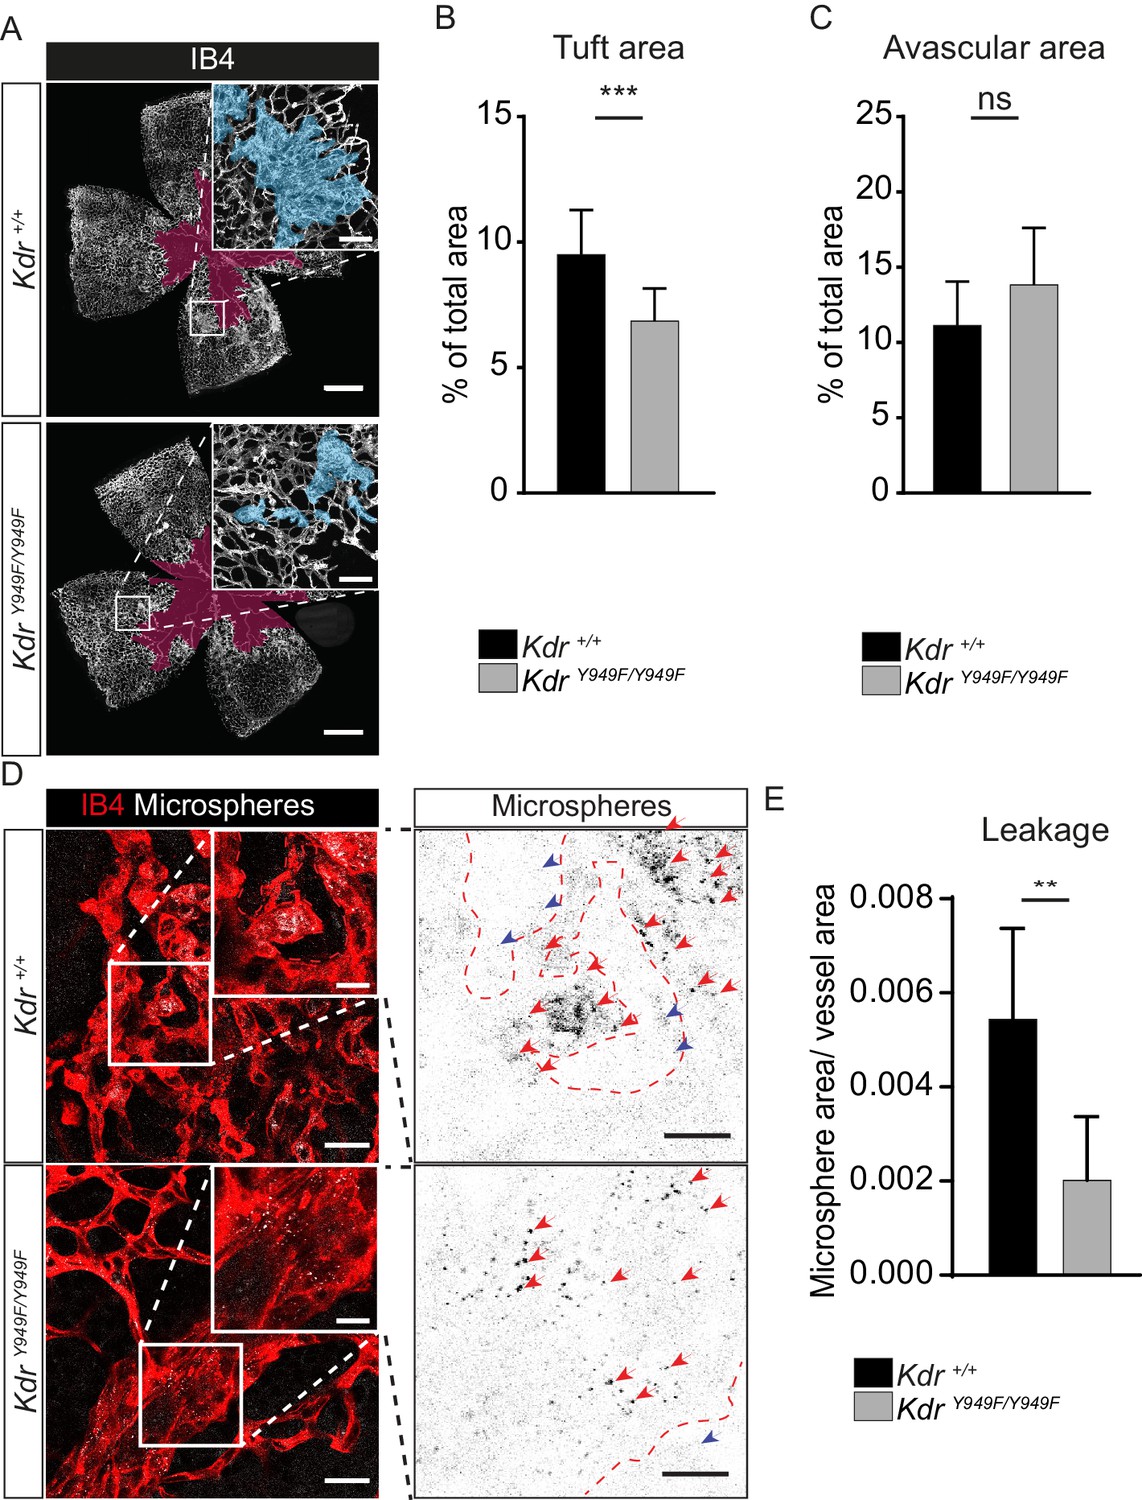
Reduced leakage from OIR lesions in KdrY949F/Y949F retinas at P17.
(A) Representative images of whole mount retinas from KdrY949F/Y949F and Kdr+/+ mice, collected on postnatal day (P)17 after OIR challenge, stained with isolectin B4 (IB4). Avascular tissue in the central retina is marked with purple overlay and neovascular tufts, clusters of disordered vessels, are indicated with blue overlay in the insets. See Figure 2—figure supplement 1A for corresponding images without color overlays. Scale bar = 500 µm. Inset scale bar = 100 µm. (B) Neovascular tuft coverage as percentage of total retina area. (C) Avascular area as percentage of total retina area. n = 10–14 mice, mean value of both eyes;***, p<0.00 p=0.003; ns, not significant p=0.0775. (D) Representative images of tufts from KdrY949F/Y949F and Kdr+/+ mice immunostained for isolectin B4 (IB4;red), showing accumulation of tail-vein injected green-fluorescent 25 nm microspheres (white) in the tissue around the tufts. Insets enlarged (right) with microspheres shown as black dots on white background. Scale bar = 25 µm. Inset scale bar = 10 µm. Dotted line representing the region of IB4 staining. Arrows point to accumulated microspheres; red arrows for microspheres within the IB4 positive region, blue arrows for microspheres away from the vessel wall. (E) Quantification of D, showing average area of accumulated extravasated microspheres, normalized to tuft area, per image after 15 min of circulation. n = 6–7 mice per group, 3–11 images per mouse; **p<0.01 p=0.0033.
-
Figure 2—source data 1
Text file containing the ImageJ macro code used to quantify microsphere accumulation in OIR experiments.
- https://cdn.elifesciences.org/articles/54056/elife-54056-fig2-data1-v2.txt
-
Figure 2—source data 2
Excel file containing the collected Kdr tuft area, avascular area, and extravasated microsphere area.
- https://cdn.elifesciences.org/articles/54056/elife-54056-fig2-data2-v2.xlsx
Figure 2—figure supplement 1
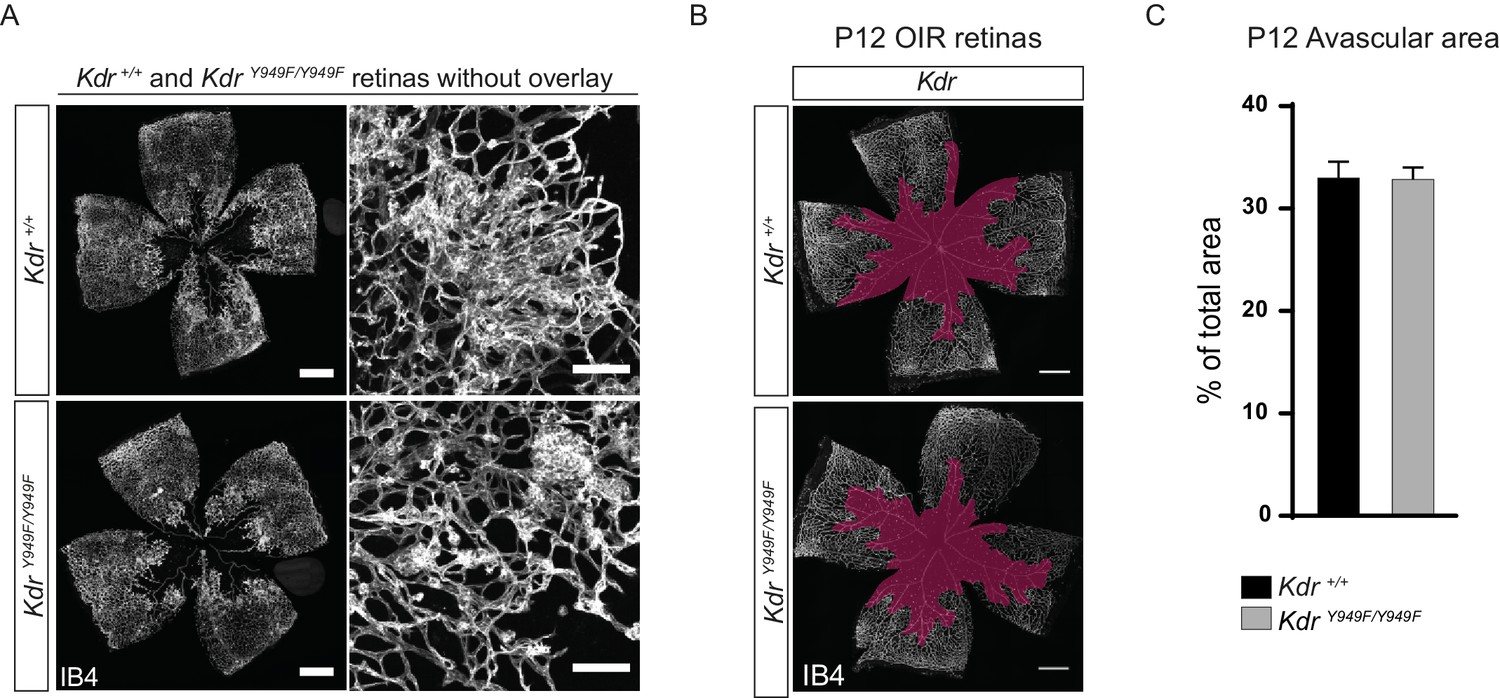
Retina vasculature following OIR.
(A) Whole mount retinas from KdrY949F/Y949F and Kdr+/+ as shown in Figure 2 but displayed without overlays. Panels showing close up of tuft detail are placed to the right-hand side of each full retina image. Scale bar = 500 µm. Inset scale bar = 100 µm. (B) Whole mount retinas collected at P12, after the vessel destruction phase of OIR and before extensive vessel regrowth, stained with isolectin B4 (IB4), showing no difference in the extent of vessel loss between KdrY949F/Y949F and Kdr+/+ mice, Scale bar = 500 µm. Avascularity shown with purple overlay. (C) Quantification of B).
Figure 2—figure supplement 2
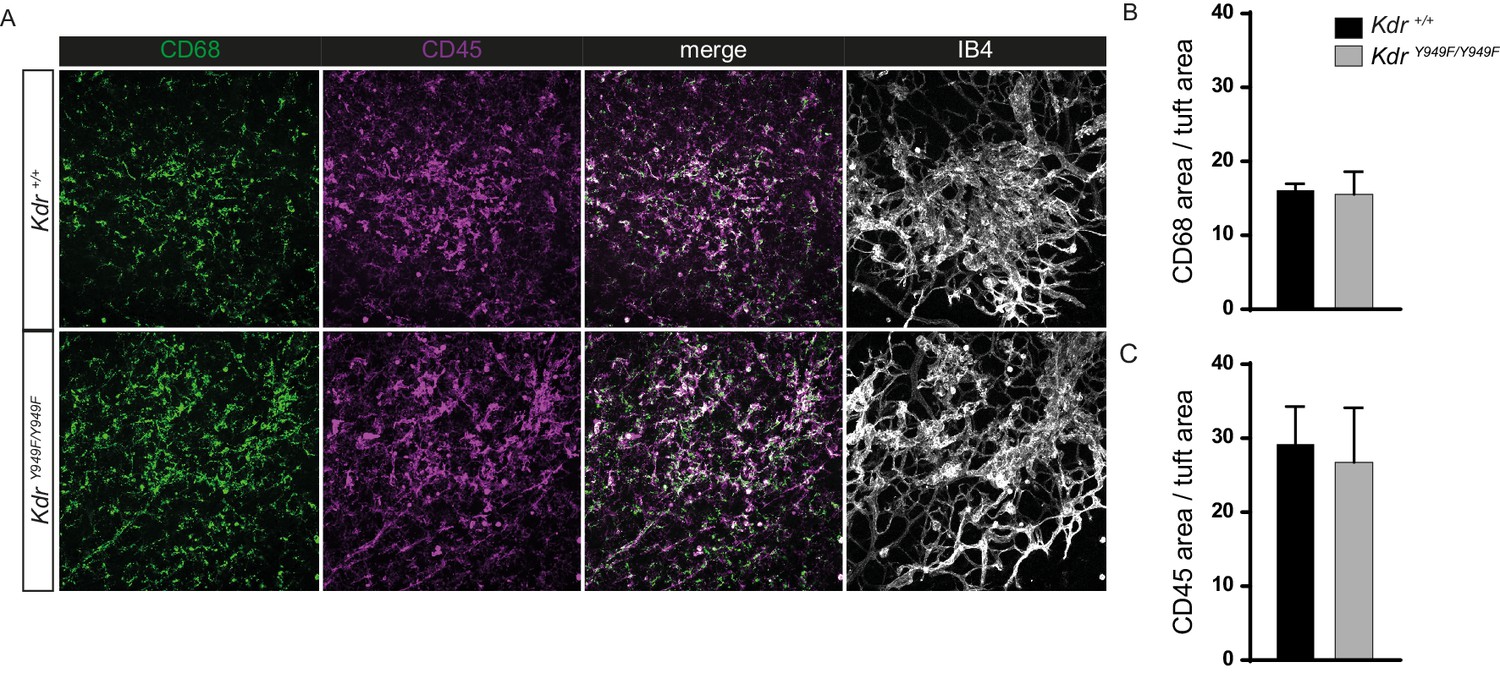
Inflammatory cells in retina tufts following OIR.
(A) Representative images of CD68 (green) and CD45 (purple) positive inflammatory cells within tuft regions of KdrY949F/Y949F and Kdr+/+ mice with IB4 (white) vessel area shown in the far right panel. (B) CD68 area and (C) CD45 area shown as the percentage of the total tuft area. Scale bar = 100 µm.
Figure 3 with 1 supplement
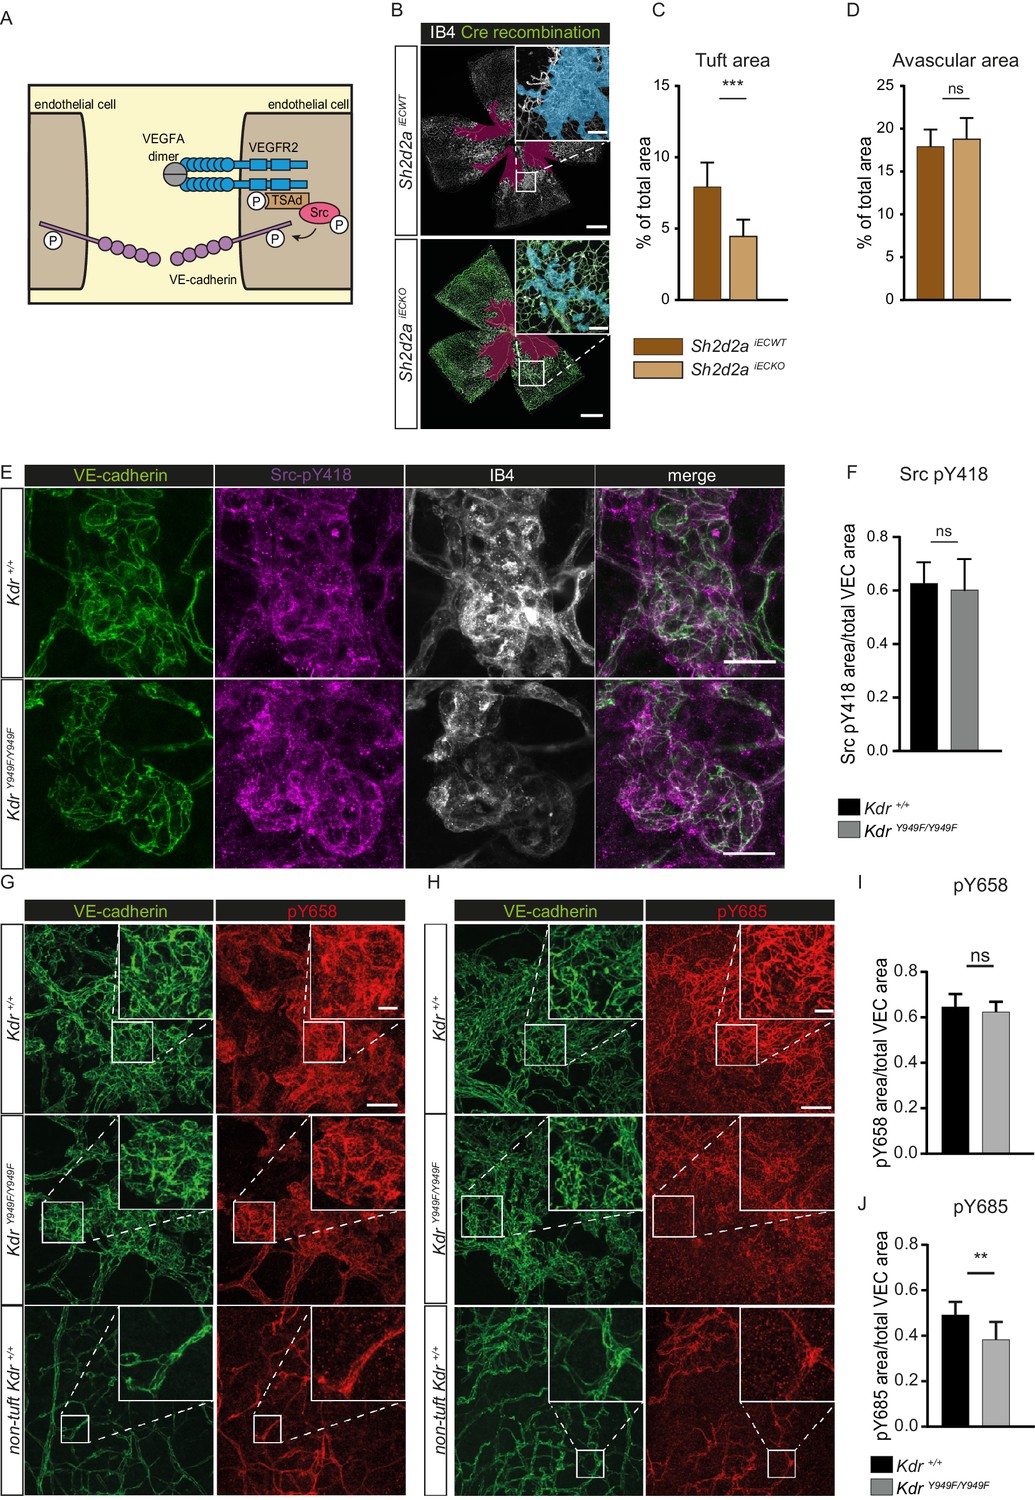
pY949 signaling axis involvement in retinopathy pathology.
(A) Graphic representation of VEGFR2 signaling cascade initiated by Y949 phosphorylation. (B) Representative images of whole mount retinas from Sh2d2aiECKO and Sh2d2aiECWT mice, collected on postnatal day (P)17 after OIR challenge, stained with isolectin B4 (IB4) with green color marking GFP-positive cells indicating TSAd-deficiency. Avascular area shown with purple overlay, neovascular tufts shown as blue overlay in inset. Scale bar = 500 µm. Inset scale bar = 100 µm. (C) Neovascular tuft coverage as percentage of total retina area. (D) Avascular area as percentage of total retina area. n = 10–15 mice, mean value of both eyes ***, p<0.001 p=0.0001; ns, not significant p=0.3680 E) Representative maximum intensity projections of tufts from KdrY949F/Y949F and Kdr+/+ mice immunostained for isolectin B4 (IB4; white), VE-cadherin (green), and pY418 c-Src (magenta). Scale bar = 25 µm. (F) Quantification shows percentage tuft junctional area, as defined by VE-cadherin immunostaining, positive for pY418 c-Src. n = 7–8 retinas from four mice per group; mean value from four images per retina ns = not significant p=0.6334. (G–H) Representative maximum intensity projections of tufts from KdrY949F/Y949F and Kdr+/+, as well as non-tuft regions from Kdr+/+ retinas immunostained for VE-cadherin (green) and G) VE-cadherin pY658 (red) or H) for VE-cadherin pY685 (red). (I) Quantification of percentage pY658 immunostaining in tufts, in relation to total tuft junctional (VE-cadherin) area. (J) Quantification of percentage pY685 immunostaining as in I. Scale bars in G, H = 50 µm. Inset scale bar = 10 µm. n = 4–6 mice, one retina per mouse, from three independent experiments, 5–9 images per group. ns, not significant p=0.4845, **p<0.01 p=0.0086.
-
Figure 3—source data 1
Excel file containing Sh2d2a OIR tuft and avascular area, Kdr junctional pSrc, and Kdr VE-cadherin phosphorylation area.
- https://cdn.elifesciences.org/articles/54056/elife-54056-fig3-data1-v2.xlsx
Figure 3—figure supplement 1
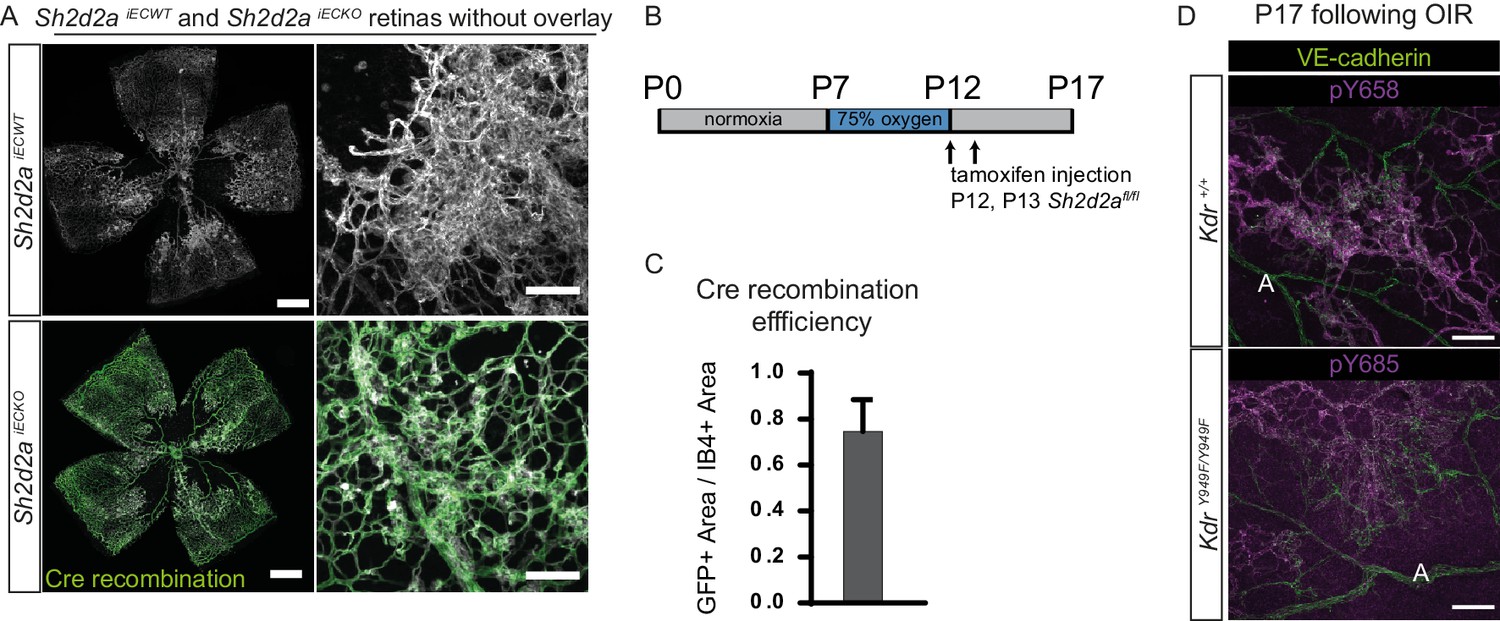
Retina vasculature following OIR in Shd2daiECKO and VE-cadherin phosphorylation in different vessel types.
(A) Whole mount retinas from Shd2daiECKO and Sh2d2aiECWT mice, as shown in Figure 3 but displayed without overlays. Panels showing close up of tuft detail are placed to the right-hand side of each full retina image. Scale bar = 500 µm. Inset scale bar = 100 µm. (B) OIR timeline, showing the period of increased oxygen concentration with timing of tamoxifen administration given for the experiments on Shd2daiECKO and Sh2d2aiECWT mice. (C) Bar graph showing the observed Cre-induced recombination in Sh2d2afl/fl animals crossed with an mT/mG strain. Recombination calculated as the GFP fluorescent area divided by the IB4 positive total vascular area. (D) Kdr+/+ retinas, immunostained for VE-cadherin (green) and VE-cadherin pY658 (magenta; upper) or VE-cadherin pY685 (magenta;l ower) showing phosphorylation of VE-cadherin in capillaries and veins and increased staining in neovascular tufts. Scale bar = 25 µm. A, artery.
Figure 4 with 1 supplement
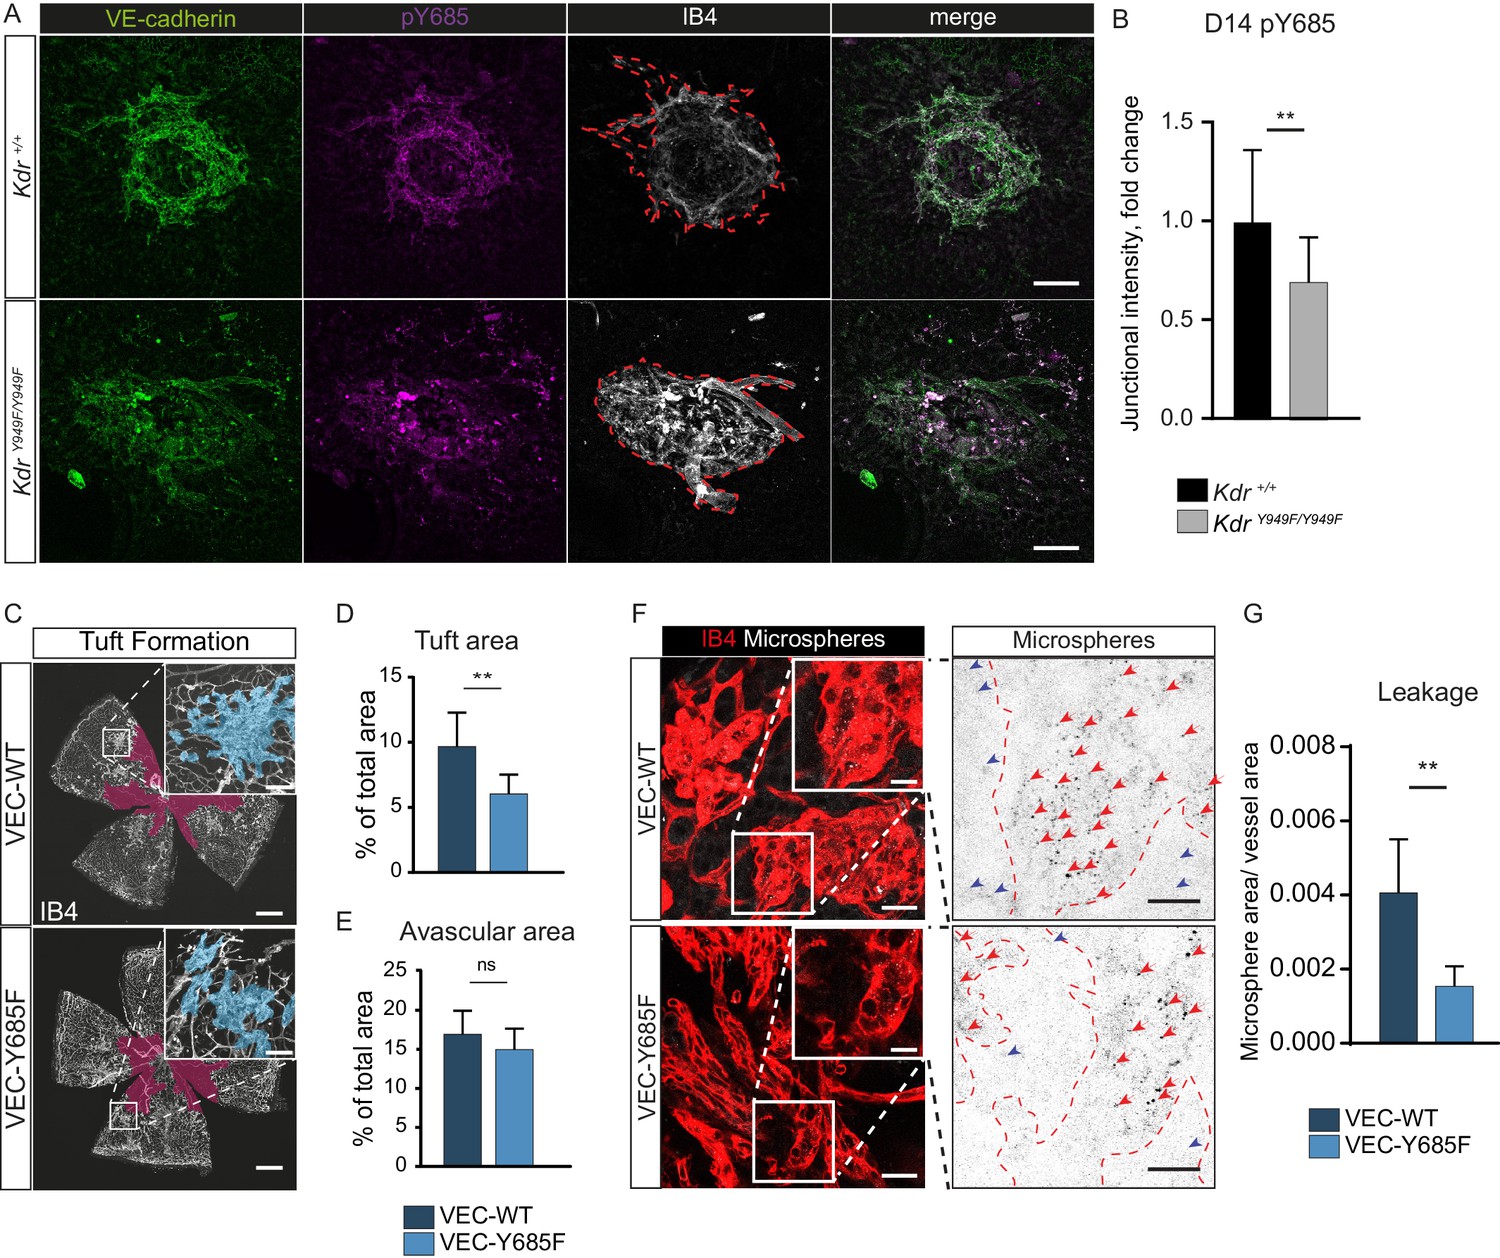
Involvement of VE-cadherin pY685 in lesion formation and vessel leakage.
(A) Representative CNV lesions imaged from whole mount choroid tissue, collected at D14 from KdrY949F/Y949F and Kdr+/+ littermates, immunostained for VE-cadherin (green), pY685 (magenta) and isolectin B4 (IB4; white). Scale bar = 100 µm; dotted red line highlights the extent of lesion formation in the IB4 channel. (B) Quantification of junctional pY685 immunostaining in the lesions. Junctional intensity expressed as the fold reduction of intensity as compared to the average Kdr+/+ lesion intensity. n = 14–28 lesions per group from 3 to 5 mice per group, **p<0.01 p=0.0071. (C) Whole mount retinas from VEC-Y685F mice and VEC-WT mice, collected on P17 after OIR challenge, stained for IB4. Avascular area shown with purple overlay, neovascular tufts shown as blue overlay in inset. Scale bar = 500 µm. Inset scale bar = 100 µm. (D) Tuft coverage and E) avascular area. n = 8–11 mice per group, average of two retinas per mouse. **p<0.05 p=0.0012; ns = not significant, p=0.1535. (F) Representative images of accumulation of 25 nm green-fluorescent microspheres (white) in VEC-Y685F and VEC-WT control mice stained for isolectin B4 (IB4; red), showing accumulation in the tissue around the tufts. Insets enlarged (right) with microspheres shown as black dots on white background. Scale bar = 25 µm. Inset scale bar = 10 µm. Dotted line representing the region of IB4 staining. Arrows point to accumulated microspheres; red arrows for microspheres within the IB4 positive region, blue arrows for microspheres away from the vessel wall. (G) Quantification of F showing average area of accumulated extravasated microspheres, normalized to tuft area, per image after 15 min of circulation. n = 5–7 mice per group; 10–18 images per mouse **p<0.01, p=0.0016.
-
Figure 4—source data 1
Excel file containing collected VE-cadherin pY685 staining in Kdr CNV lesions, VEC-Y685 tuft and avascular area, and VEC-Y685 extravasated microsphere area.
- https://cdn.elifesciences.org/articles/54056/elife-54056-fig4-data1-v2.xlsx
Figure 4—figure supplement 1

VEC-WT and VEC-Y685F mice in OIR.
(A) Whole mount retinas collected at P17 from VEC-WT and WT littermate controls stained with isolectin B4 (IB4). Insets to show detail. Scale bar = 500 µm. Inset scale bar = 50 µm. Avascularity shown with purple overlay, neovascular tuft formation shown with blue overlay. (B) Quantification of tuft formation. (C) Quantification of avascular area. (D) Whole mount retinas collected at P12, after the vessel destruction phase of OIR and before extensive vessel regrowth, stained with isolectin B4 (IB4), showing no difference in the extent of vessel loss between VEC-WT and littermate controls (C57Bl/6 WT), and VEC-Y685F and littermate controls (C57Bl/6 WT). Scale bar = 500 µm. Avascularity shown with purple overlay. (E) Quantification of D. (F) Representative maximum intensity projections of tufts from VEC-WT and VEC-Y685F mutant mice immunostained for VE-cadherin pY658 and pY685, Scale bar = 25 µm. (G) Extravasation of 25 nm microspheres in VEC-WT and WT littermate controls stained with isolectin B4 (IB4). Insets to show detail. Insets enlarged (right) with microspheres shown as black dots on white background. Dotted line representing the region of IB4 staining. Scale bar = 25 µm. Inset scale bar = 10 µm. Arrows point to accumulated microspheres.; red arrows for microspheres within the IB4 positive region, blue arrows for microspheres away from the vessel wall. (H) Quantification of microsphere extravasation normalized to tuft area in G. n = 5–6.
Tables
Table 1
Body weight at P17 of mice subjected to OIR.
| Mouse strain/genotype | Body weight (+ / - SD) |
|---|---|
| Kdr+/+ | 6.53 (0.94) |
| KdrY949F/Y949F | 6.86 (0.65) |
| Sh2d2aiECWT | 5.75 (0.76) |
| Sh2d2aiECKO | 5.68 (1.02) |
| VEC-Y685F – wildtype littermates | 6.49 (1.02) |
| VEC-Y685F | 6.37 (1.02) |
| VEC-WT – wildtype littermates | 5.83 (0.76) |
| VEC-WT | 5.94 (0.92) |
-
Table 1—source data 1
Excel file containing the bodyweight information for individual mice used in OIR experiments.
- https://cdn.elifesciences.org/articles/54056/elife-54056-table1-data1-v2.xlsx
Key resources table
| Reagent type (species) or resource | Designation | Source or reference | Identifiers | Additional information |
|---|---|---|---|---|
| Strain, strain background (Mus musculus) | KdrY949F/Y949F | DOI: 10.1038/ncomms11017 | C57Bl/6 background | |
| Strain; strain background (Mus musculus) | Sh2d2afl/fl; Cdh5-CreERT2 | DOI: 10.1126/scisignal.aad9256 | C57Bl/6 background | |
| Strain; strain background (Mus musculus) | mT/mG | DOI: 10.1002/dvg.20335 | C57Bl/6 background | |
| Strain; strain background (Mus musculus) | VEC-Y685F | DOI: 10.1038/ni.2824 | C57Bl/6 background | |
| Strain; strain background (Mus musculus) | VEC-WT | DOI: 10.1038/ni.2824 | C57Bl/6 background | |
| Antibody | Rat anti-VE-cadherin | BD Biosciences | Catalogue no: 555289 RRID:AB_395707 | (1:100) |
| Antibody | Rabbit anti-VE-cadherin pY658 | DOI: 10.1038/ncomms2199 | (1:50) | |
| Antibody | Rabbit anti-VE-cadherin pY688 | DOI: 10.1038/ncomms2199 | (1:50) | |
| Antibody | Rabbit anti-phospho-Src (Tyr418) | Thermo Fisher Scientific | Catalogue no: 44–660G RRID:AB_1500523 | (1:100) |
| Antibody | Goat anti-CD45 | BD Biosciences | Catalogue no: 553076 RRID:AB_394606 | (1:300) |
| Antibody | Rat anti-CD68 | BioRad Laboratories | Catalogue no: MCA1957 RRID:AB_322219 | (1:300) |
| Antibody | Donkey anti-Rat | Thermo Fisher Scientific | Catalogue no: A-21208 RRID:AB_141709 | (1:500) |
| Antibody | Donkey anti-Rabbit | Thermo Fisher Scientific | Catalogue no: A-31572 RRID:AB_162543 | (1:500) |
| Antibody | Donkey anti-Goat | Thermo Fisher Scientific | Catalogue no: A-21432 RRID:AB_2535853 | (1:500) |
| Software | ImageJ | NIH, Bethesda, MD, USA | RRID:SCR_003070 | |
| Software | GraphPad Prism | GraphPad | RRID:SCR_002798 | |
| Other | Alexa Fluor 488-Isolectin B4 | Thermo Fisher Scientific | Catalogue no I21411 RRID:AB_2314662 | (1:500) |
| Other | Alexa Fluor 594-Isolectin B4 | Thermo Fisher Scientific | Cataolgue no: I21413 RRID:AB_2313921 | (1:500) |
| Other | Alexa Fluor 647-Isolectin B4 | Thermo Fisher Scientific | Catalogue no: I32450 RRID:SCR_014365 | (1:500) |
| Other | Fluoro-Max Dyed Blue Aqueous Fluorescent Particles | Thermo Fisher Scientific | Catalogue no: B0100 | |
| Other | Fluoro-Max Dyed Green Aqueous Fluorescent Particles | Thermo Fisher Scientific | Catalogue no: G25 |
Additional files
Download links
A two-part list of links to download the article, or parts of the article, in various formats.
Downloads (link to download the article as PDF)
Open citations (links to open the citations from this article in various online reference manager services)
Cite this article (links to download the citations from this article in formats compatible with various reference manager tools)
Vascular permeability in retinopathy is regulated by VEGFR2 Y949 signaling to VE-cadherin
eLife 9:e54056.
https://doi.org/10.7554/eLife.54056


