Tracking cells in epithelial acini by light sheet microscopy reveals proximity effects in breast cancer initiation
- Cell Biology and Biophysics Unit, EMBL, Germany
- Advanced Light Microscopy Facility, EMBL, Germany
- Luxendo Light-Sheet, Bruker Corporation, Germany
- Centre for Bioimage Analysis, EMBL, Germany
Figures
Figure 1 with 1 supplement

Establishment of stochastic tumorigenesis in mammary acini.
(a) Schematic representation of the mouse models and the in vitro culture methods used. Acini are grown from single cells harvested from the mammary glands of either bi-trangenic (B) or tri-trangenic (T) mice, transduced with lentiviral particles in solution and re-seeded into 3D cultures. Doxycycline is added to the medium to induce the expression of oncogenes in cells expressing rtTA. B mice have the MYC and Neu oncogene constructs in their genome. These oncogenes are activated in single cells infected with the Inducer-reporter (pLenti-rtTA-GFP) lentiviral particles in the presence of doxycycline, modeling stochastic breast tumorigenesis (right panel). T mice have the rtTA transducer construct along with the oncogenes and all cells in T acini can be induced to express oncogenes in 3D culture in the presence of doxycycline. T mice infected with Reporter (pLenti-NULL-GFP) lentiviral particles are used as infection controls (left panel). Both viral particles mark single cells in the acini with H2B-GFP. (b) Representative immunofluorescence staining images of fixed 3D gels with B acini transduced with Inducer-reporter virus or T acini transduced with Reporter virus before induction (top), 24 hr post induction and (middle) and 72 hr post induction (bottom) with doxycycline. GFP expressing transduced cells (green), MYC oncoprotein (magenta), DAPI nuclear stain (blue). Scale bar, 10 µm.
Figure 1—figure supplement 1

Normalization of doxycycline concentration for the stochastic model using qPCR analysis.
Fold changes in the mRNA expression of transgenes, MYC and Neu, in transduced mammary epithelial cells of B mice (n = 2) infected with Inducer-reporter virus or T mice (n = 2) with Reporter virus. The doxycycline dosage of 800 ng/ml (T800) is well established in the T cells and was used as control to normalize the gene expression, and to determine the dose for transduced B cells (600 ng/ml). Data represented as mean ± SEM; *p<0.05.
Figure 2
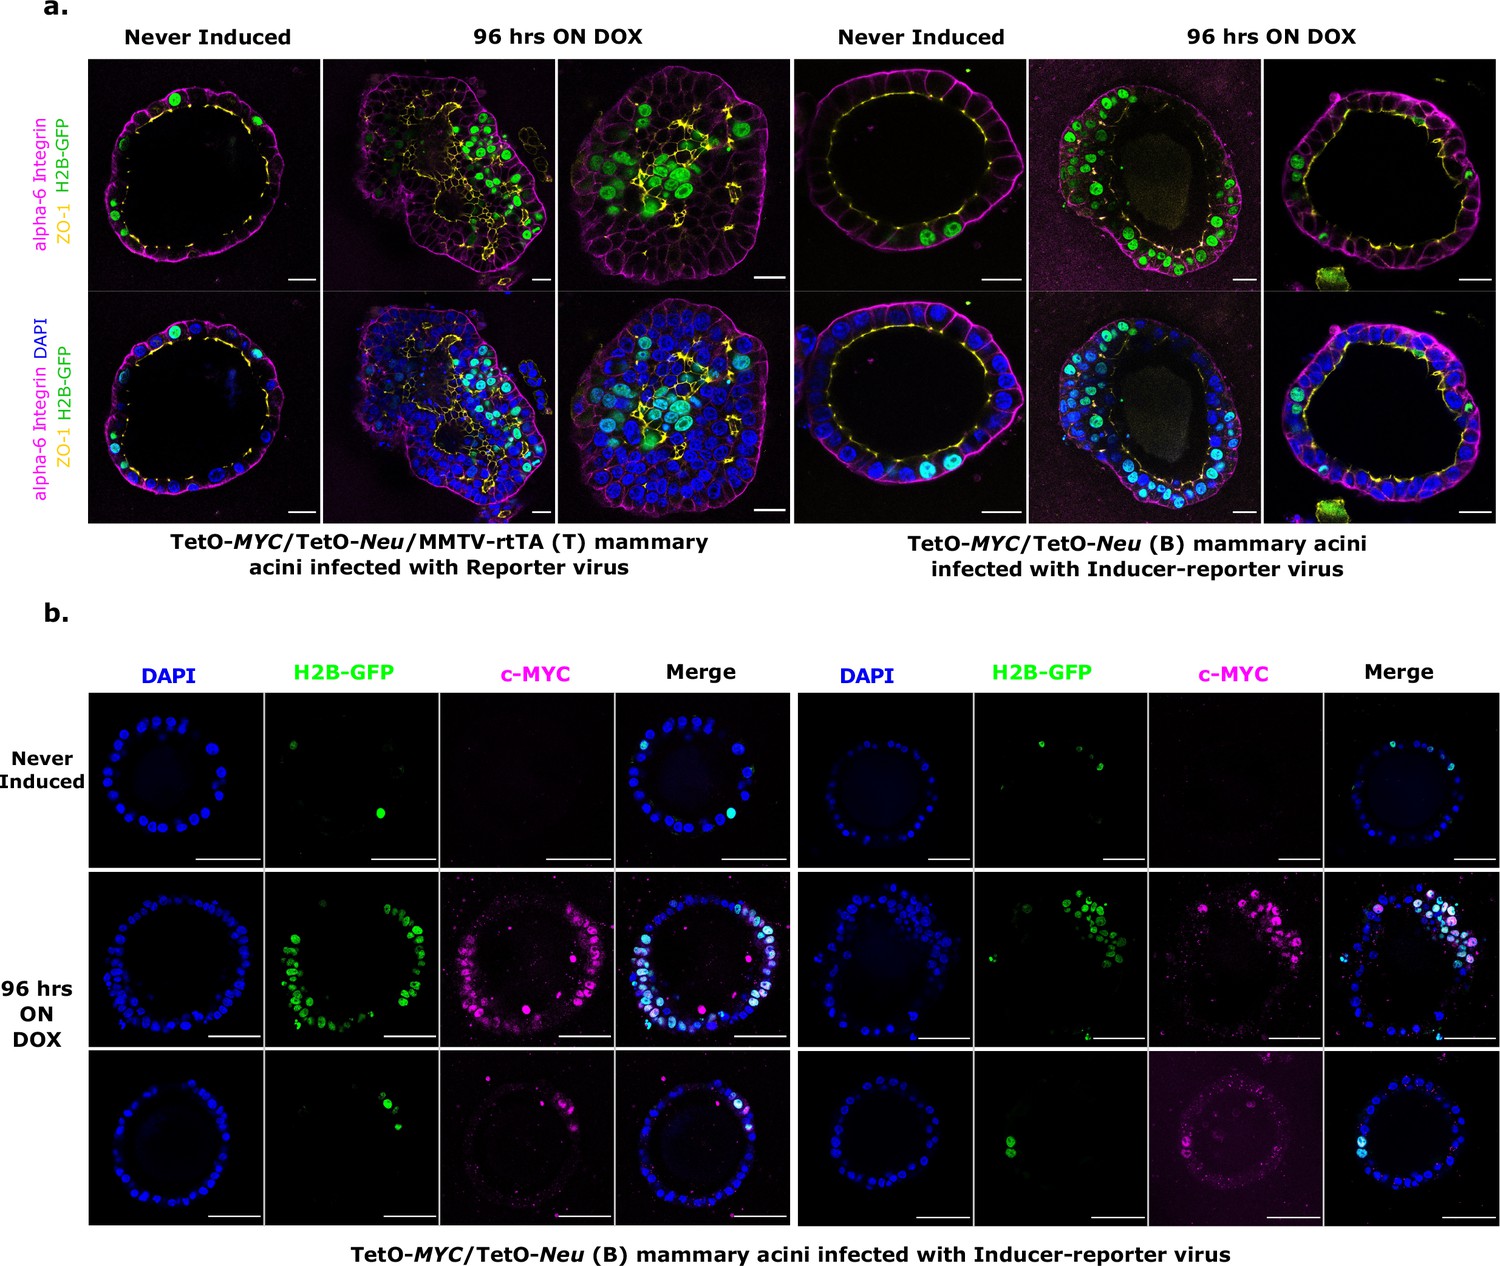
Characterization of stochastic tumorigenesis in mammary acini.
(a) Representative immunofluorescence staining images of fixed 3D gels with T acini transduced with Reporter virus (left panels) and B acini transduced with Inducer-reporter virus (right panels), before induction and 96 hr post induction with doxycycline. Polarity markers include alpha-6-Integrin (magenta) and ZO-1 (yellow). Transduced cells are marked with GFP (green) and nucleus is counterstained with DAPI (blue). Scale bar, 20 µm.(b) Representative immunofluorescence staining images of fixed 3D gels with B acini transduced with Inducer-reporter virus before induction (top panels) and 96 hr post induction (middle and bottom panels) with doxycycline. GFP expressing transduced cells (green), MYC oncoprotein (magenta), DAPI nuclear stain (blue). Scale bar, 50 µm.
Figure 3 with 6 supplements
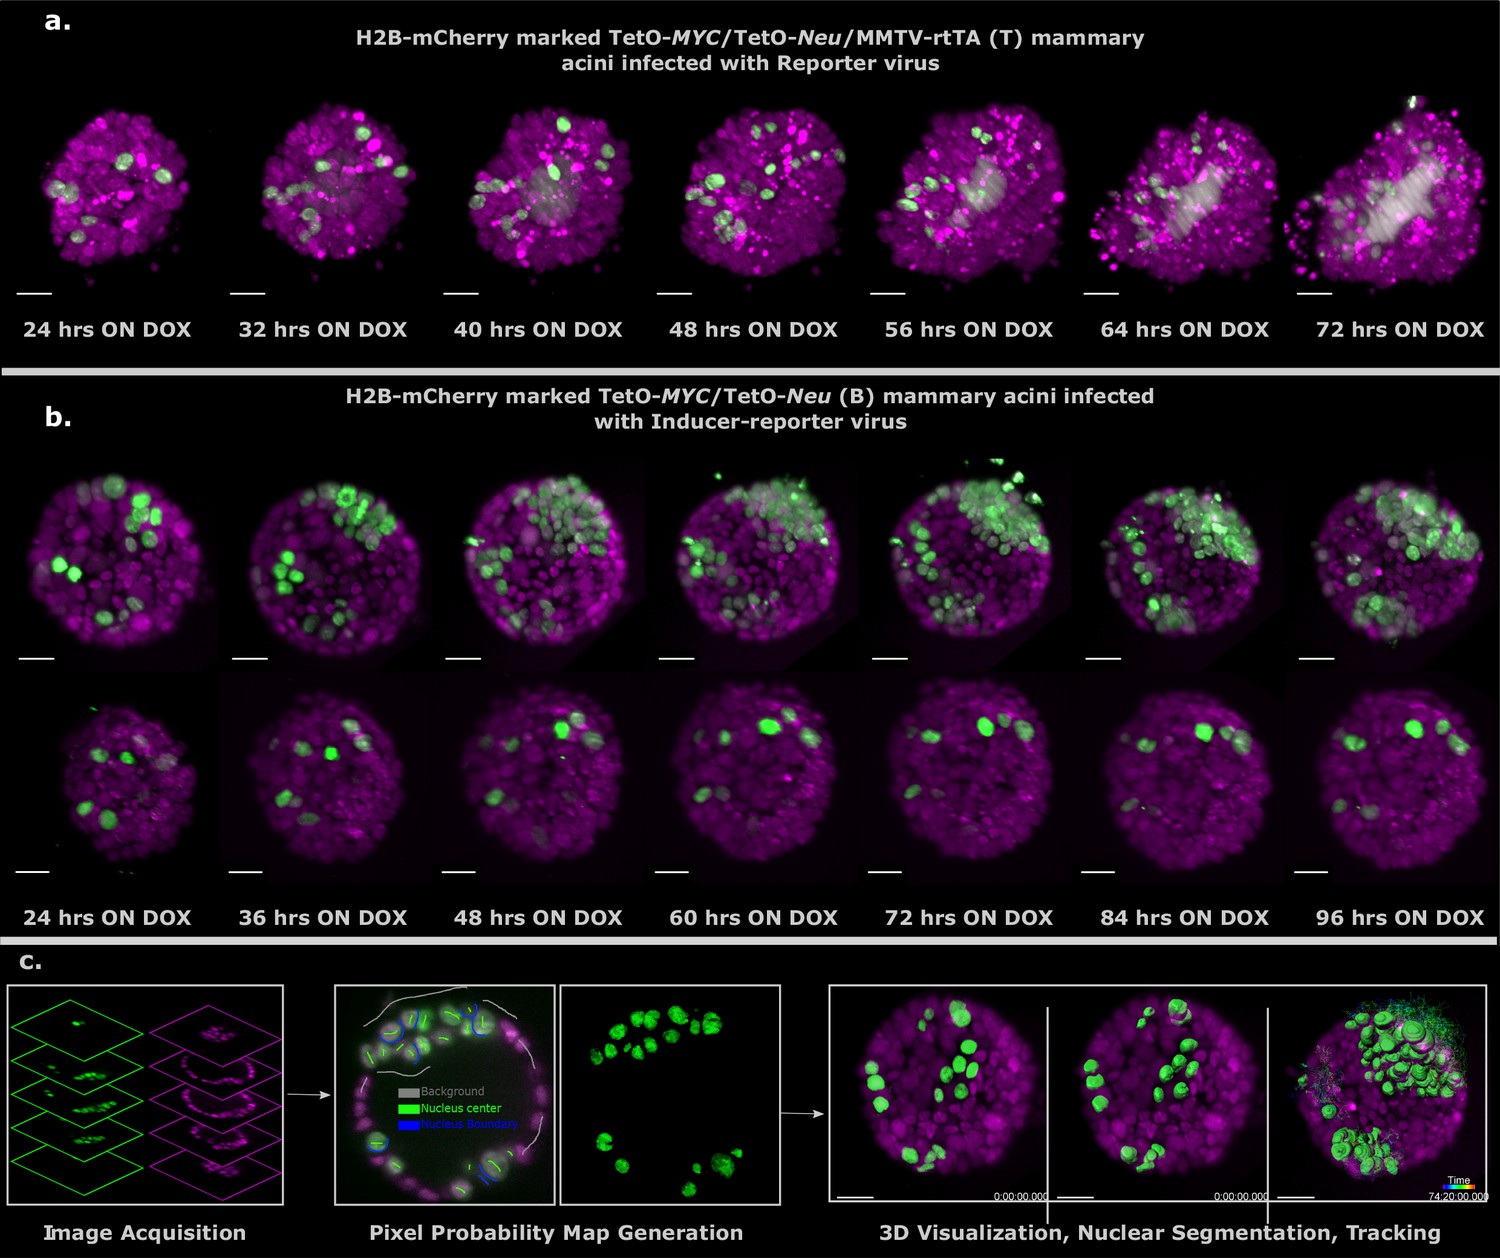
Light sheet imaging of stochastic tumorigenesis in mammary acini 3D images of selected timepoints during live-cell time-lapse microscopy of induced T acini transduced with Reporter virus.
(a) or B acini transduced with Inducer-reporter virus (b). All cells in the acini express H2B-mCherry (magenta) and only cells transduced with lentiviral particles express H2B-GFP (green). Imaging was started 24 hr after oncogenic induction with doxycycline. In (b) the upper panel shows the proliferative phenotype seen with stochastic transformation, whereas the lower panel shows the non-proliferative phenotype observed in some stochastically transformed acini. (Imaging conditions: H2B-mCherry 594 nm Ex, 610 LP Em; H2B-GFP 488 nm Ex and 497–554 nm Em). Scale bar, 20 µm. (c) Schematic representation of the big-image data analysis pipeline developed to analyze the light sheet microscopy images. Images are acquired in two channels (H2B-mCherry in magenta and H2B-GFP in green) at 10 min intervals for 3–4 days. Big Data Processor Fiji plugin is used to pre-process the raw images and CATS Fiji plugin is used for generation of pixel probability maps (Figure 3—figure supplement 2). Image pixels of the H2B-GFP images are classified into background (black), nucleus center (green), nucleus boundary (blue) classes by manual training. Processed raw images along with the probability maps from the nucleus center channel (green) are exported to Imaris for 3D visualization, nuclear segmentation and single-cell tracking.
Figure 3—figure supplement 1
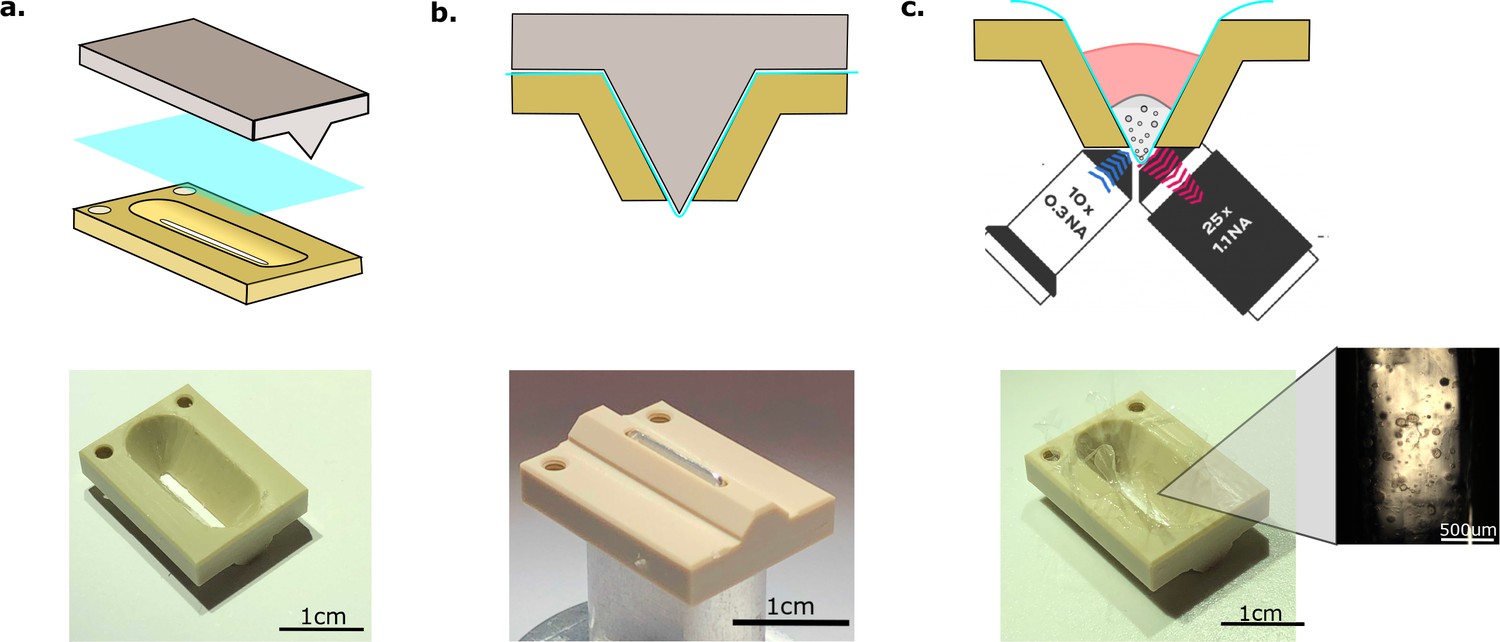
Sample holder preparation and sample mounting.
The FEP membrane is glued onto the sample holder (a) with the help of a mold and biocompatible glue (b). Gel slivers are transferred to the FEP sheet trough in the sample holder (c) and overlaetO-Neu (B). Reporter H2B-mCherry was crossed into the B and T lines using a R26-H2B-mCherry line (Abe and Fujimori, 2013) (RIKEN, CDB0239K). All ten mammary glands were harvested (from virgin female mice between 8 and 10 weeks old), digested and singularized for establishing acinar cultures. All mice used in this study were housed according to the guidelines of the Federation of European Laboratory Animal Science Associations (FELASA). .
Figure 3—figure supplement 2
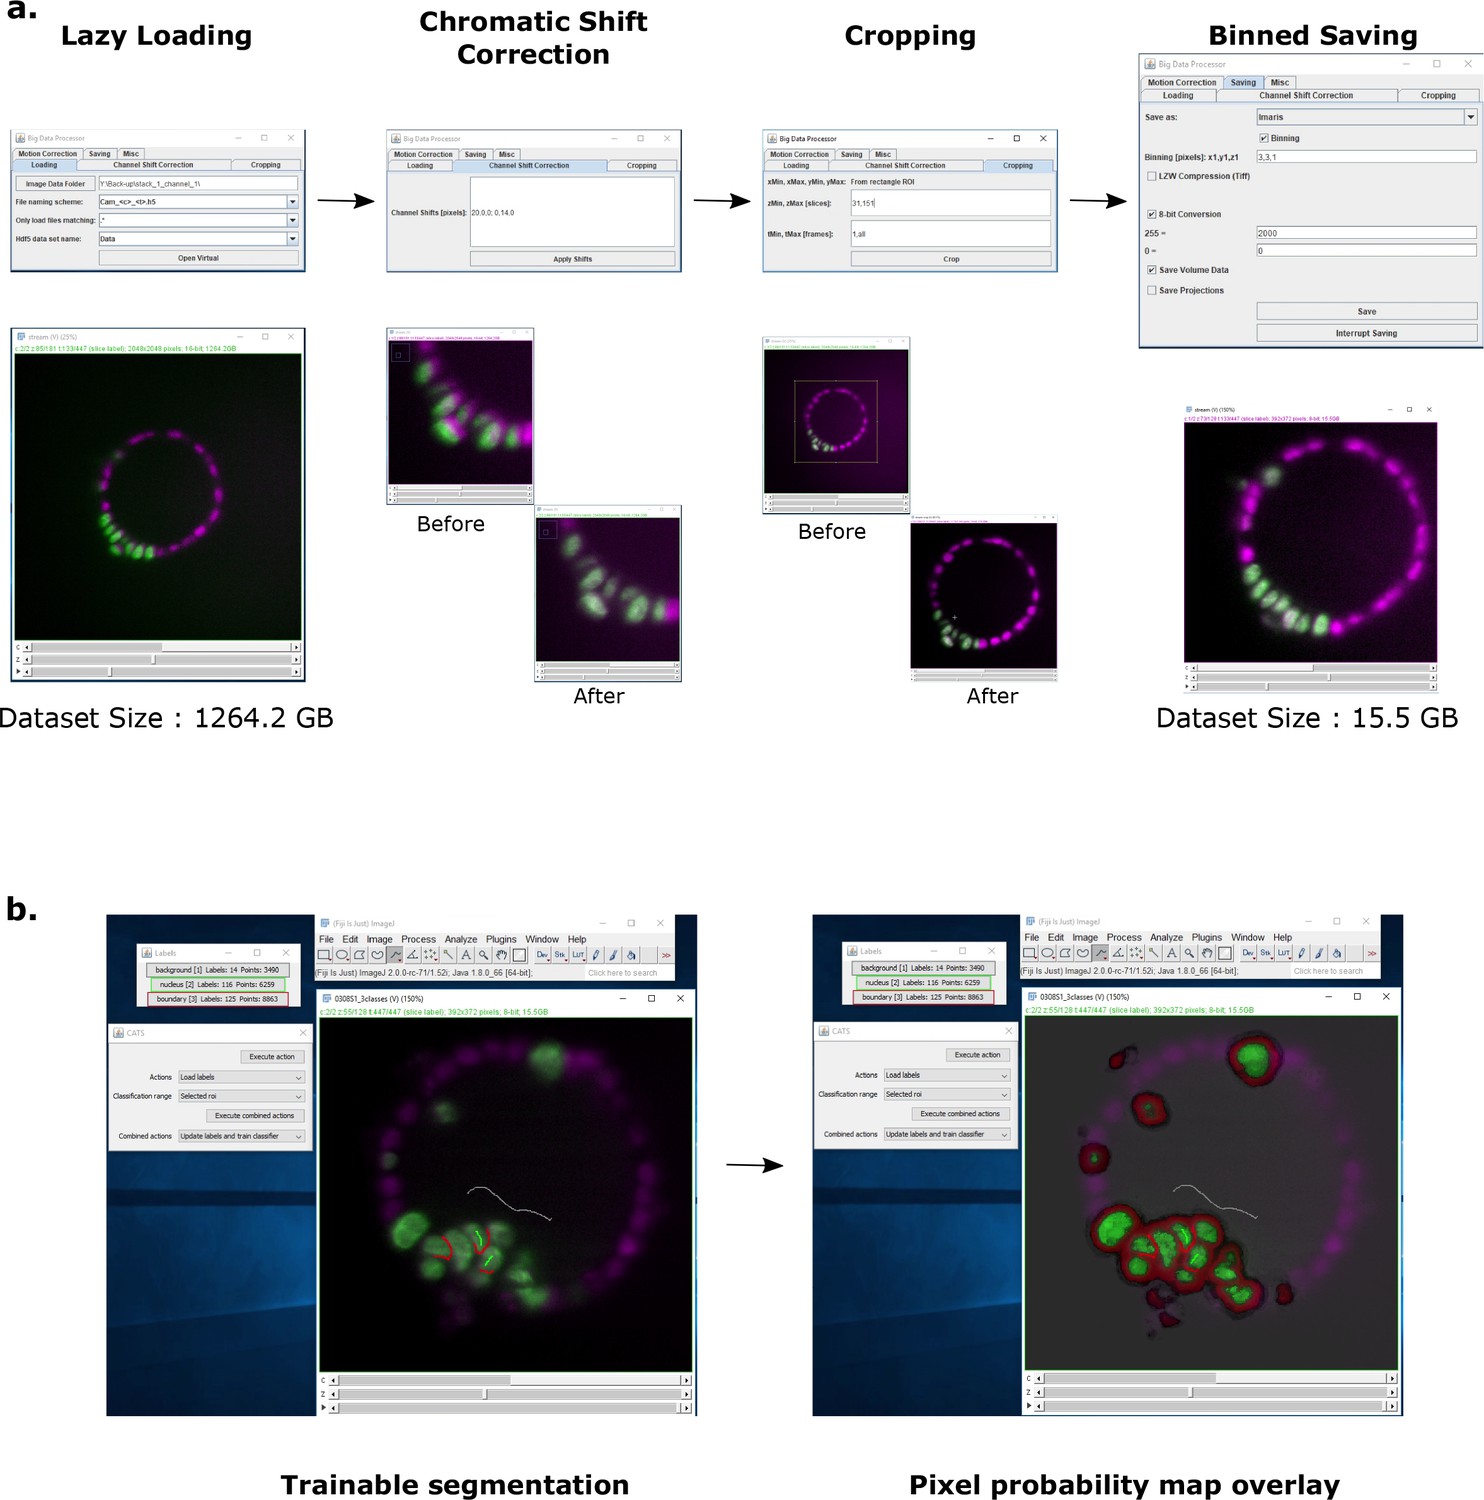
Image pre-processing and pixel probability generation using Fiji plugins.
(a) The Big Data Processor Fiji plugin was employed for pre-processing light-sheet microscopy images. Two-channel raw images were lazily loaded in 2D slice mode for visual inspection. Channel shift correction was performed to align the two channels. Then, the whole dataset was cropped in x,y,z to remove black pixels and empty planes. The cropped dataset was then saved in an 8-bit Imaris format with 3 × 3 binning applied in x and y. (b) The CATS Fiji plug-in was used to generate pixel probability maps for H2B-GFP images. Left panel shows the manual training done by drawing labels on the dataset to classify pixels into 3 classes: background (grey), nucleus boundary (red) and nucleus center (green). The right panel shows the pixel probability output for all three classes overlaid on the intensity data. Only the pixel probabilities from the nucleus center class were exported from CATS and linked to the Imaris dataset for further segmentation and tracking on Imaris.
Figure 3—figure supplement 3

Cell segmentation accuracy Image panels show the H2B-mCherry signal (magenta) along with the segmented H2B-GFP cells of an acinus at four equidistant timepoints.
Segmentation accuracy was assessed, counting: True Positives (correctly segmented cells, highlighted in green), False Merges (two cells merged as one, highlighted in orange), and False Splits (one cell split in two, highlighted in purple). Unidentified cells are indicated as False Negatives and Ground Truth indicates the actual number of cells at each timepoint. The average True Positive to Ground Truth ratio for the four timepoints is 0.92. Scale bar, 20 μm.
Figure 3—video 1
Video file for acinus shown in Figure 3a, showing fluorescence SPIM miscroscopy data in 2-color 3D projections (mcherry- magenta; GFP- green) over 72 hr of induction with doxycycline.
Generated via Imaris.
Figure 3—video 2
Video file for acinus shown in Figure 3b (upper panel), showing fluorescence SPIM miscroscopy data in 2-color 3D projections (mcherry- magenta; GFP- green) over 72 hr of induction with doxycycline.
Generated via Imaris.
Figure 3—video 3
Video file for acinus shown in Figure 3b (lower panel,, showing fluorescence SPIM miscroscopy data in 2-color 3D projections (mcherry- magenta; GFP- green) over 72 hr of induction with doxycycline.
Generated via Imaris.
Figure 4 with 2 supplements
Proximity of transformed cells in a normal epithelium enhances tumor proliferation and establishment.
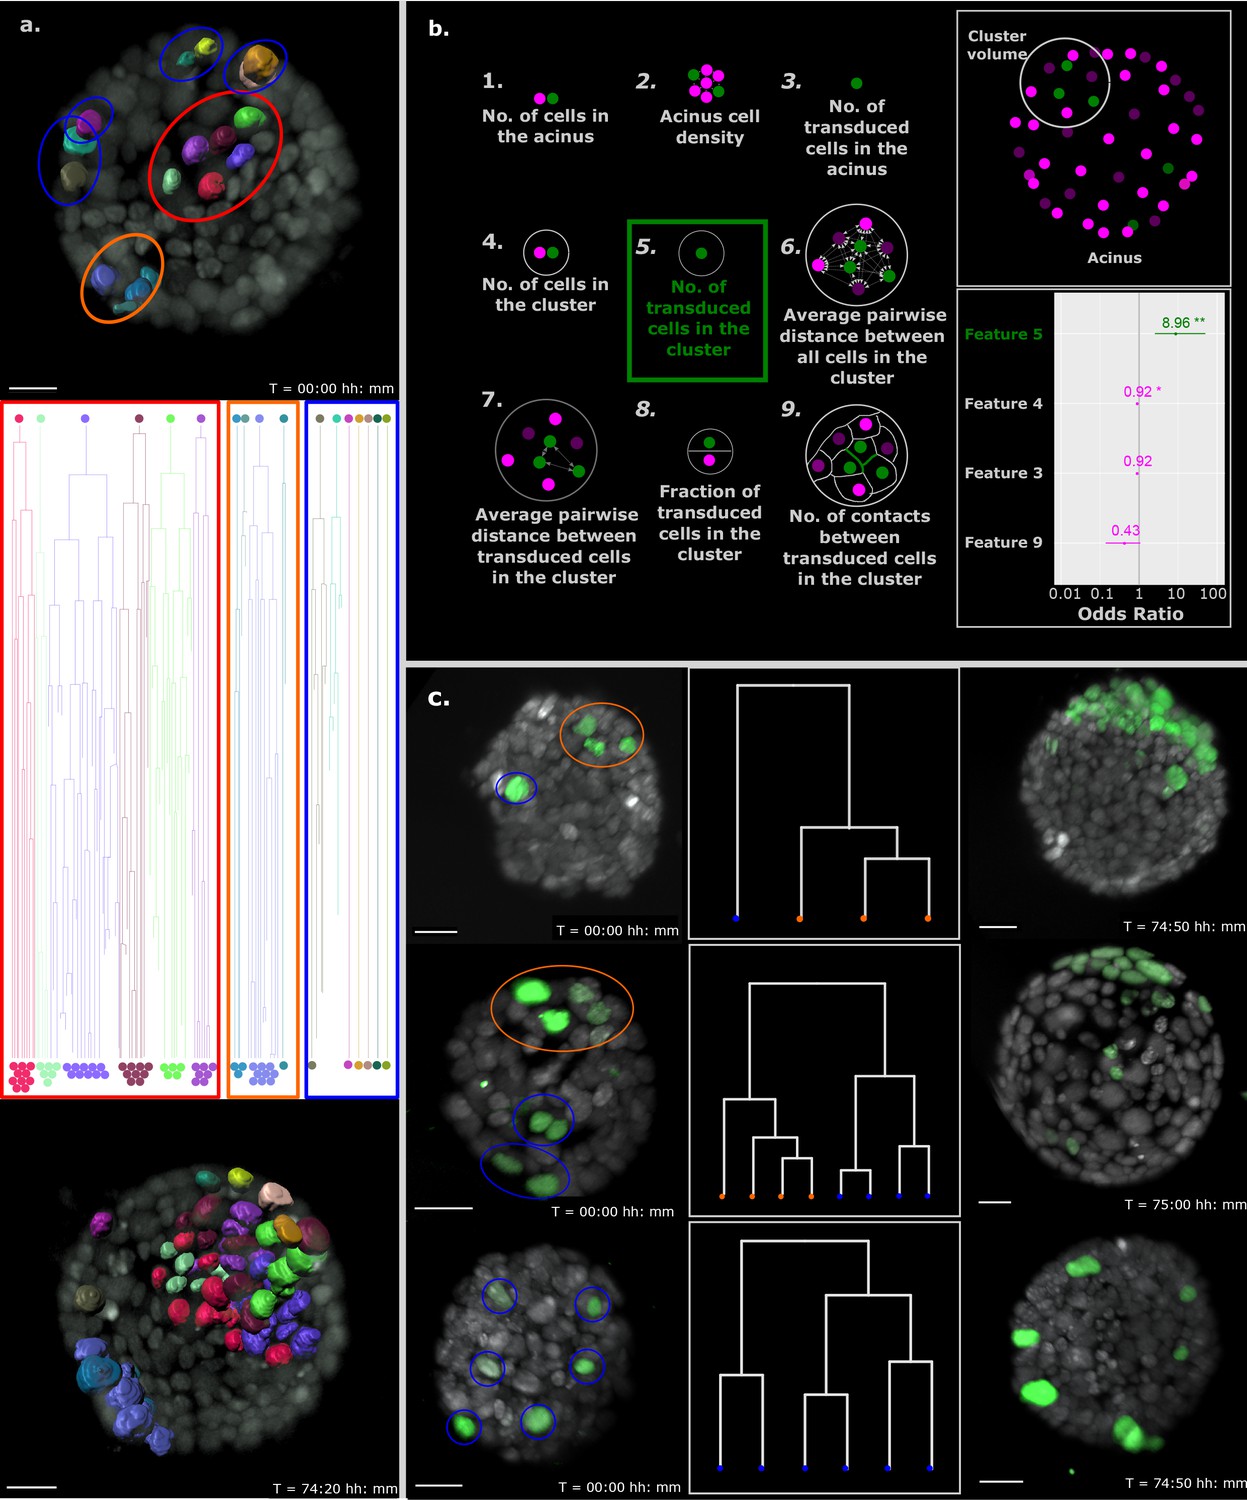
(a) Single-cell tracking results for every cell in a representative B acinus transduced with the Inducer-reporter virus. Top panel shows the acinus at the beginning of the time-lapse (24 hr post induction) with each transduced cell surface rendered with Imaris. The middle panel shows the lineage trees of each individual cell over the time-lapse recording. Lineage trees of single cells are grouped into proliferative (highlighted in red, orange) and non-proliferative (highlighted in blue) cell clusters. The bottom panel shows the acinus at the end of the time-lapse (~76 hr post induction with doxycycline). Color coding of each cell maintained in all panels. Scale bar, 15 µm. (b) Schematic representation of the 9 features of stochastically transformed cells extracted at the beginning of time-lapse imaging. These features were assessed for their impact on tumor cell proliferation within B acini transduced with the Inducer-reporter virus using logistic regression. Lower right panel: Coefficients (represented as odds ratios) of the three features included in the best logistic regression model, colored horizontal bars represent the 95% confidence interval of the estimate. ** indicates p-value (of having no effect)<0.01, * indicates p-value<0.05. The vertical grey line indicates the position of no effect. (c) Representative B mammary acini stochastically transduced with the Inducer-reporter virus and induced with doxycycline. Left panels show acini 24 hr post induction. Color highlights indicate clusters of transduced cells identified from hierarchical clustering (shown in middle panels) with proliferative clusters highlighted in orange and non-proliferative clusters highlighted in blue. Right panels show the same acini ~ 72–76 hr post induction. Scale bar, 20 µm.
Figure 4—figure supplement 1
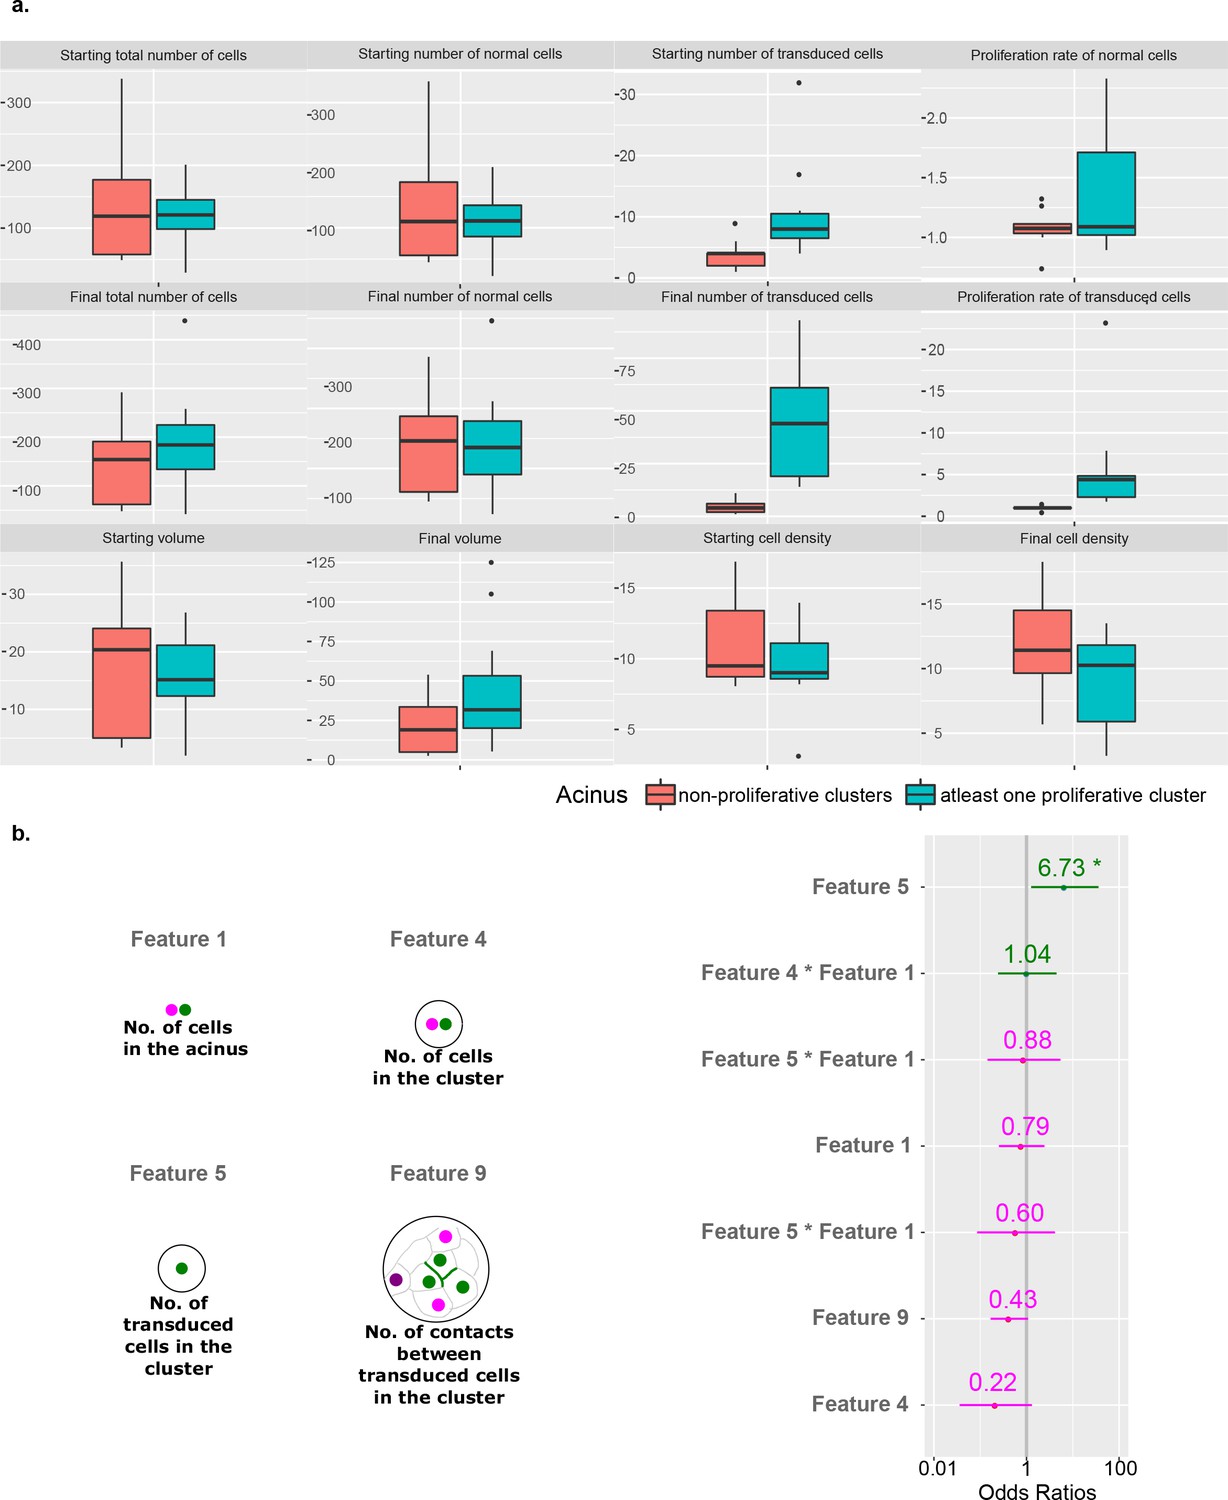
Acini feature analysis to exclude acinus-specific effects on proliferation of transduced cell clusters.
(a) Comparison of acinus level features including numbers of cells (all, transduced and normal cells), cell proliferation rate (transduced and normal cells), acinus volume and acinus cell density for B acini grouped by the presence (blue) of at least one proliferative cluster or non-proliferative clusters (orange). (b) Mixed model regression analysis to identify features linked to tumorigenic outcome (using an Odds Ratio), including the three most important fixed effect features (Feature 5, 4 and 9) with random effect for each acinus and interaction terms for the Feature 1 (comparable to acinus size).
Figure 4—figure supplement 2
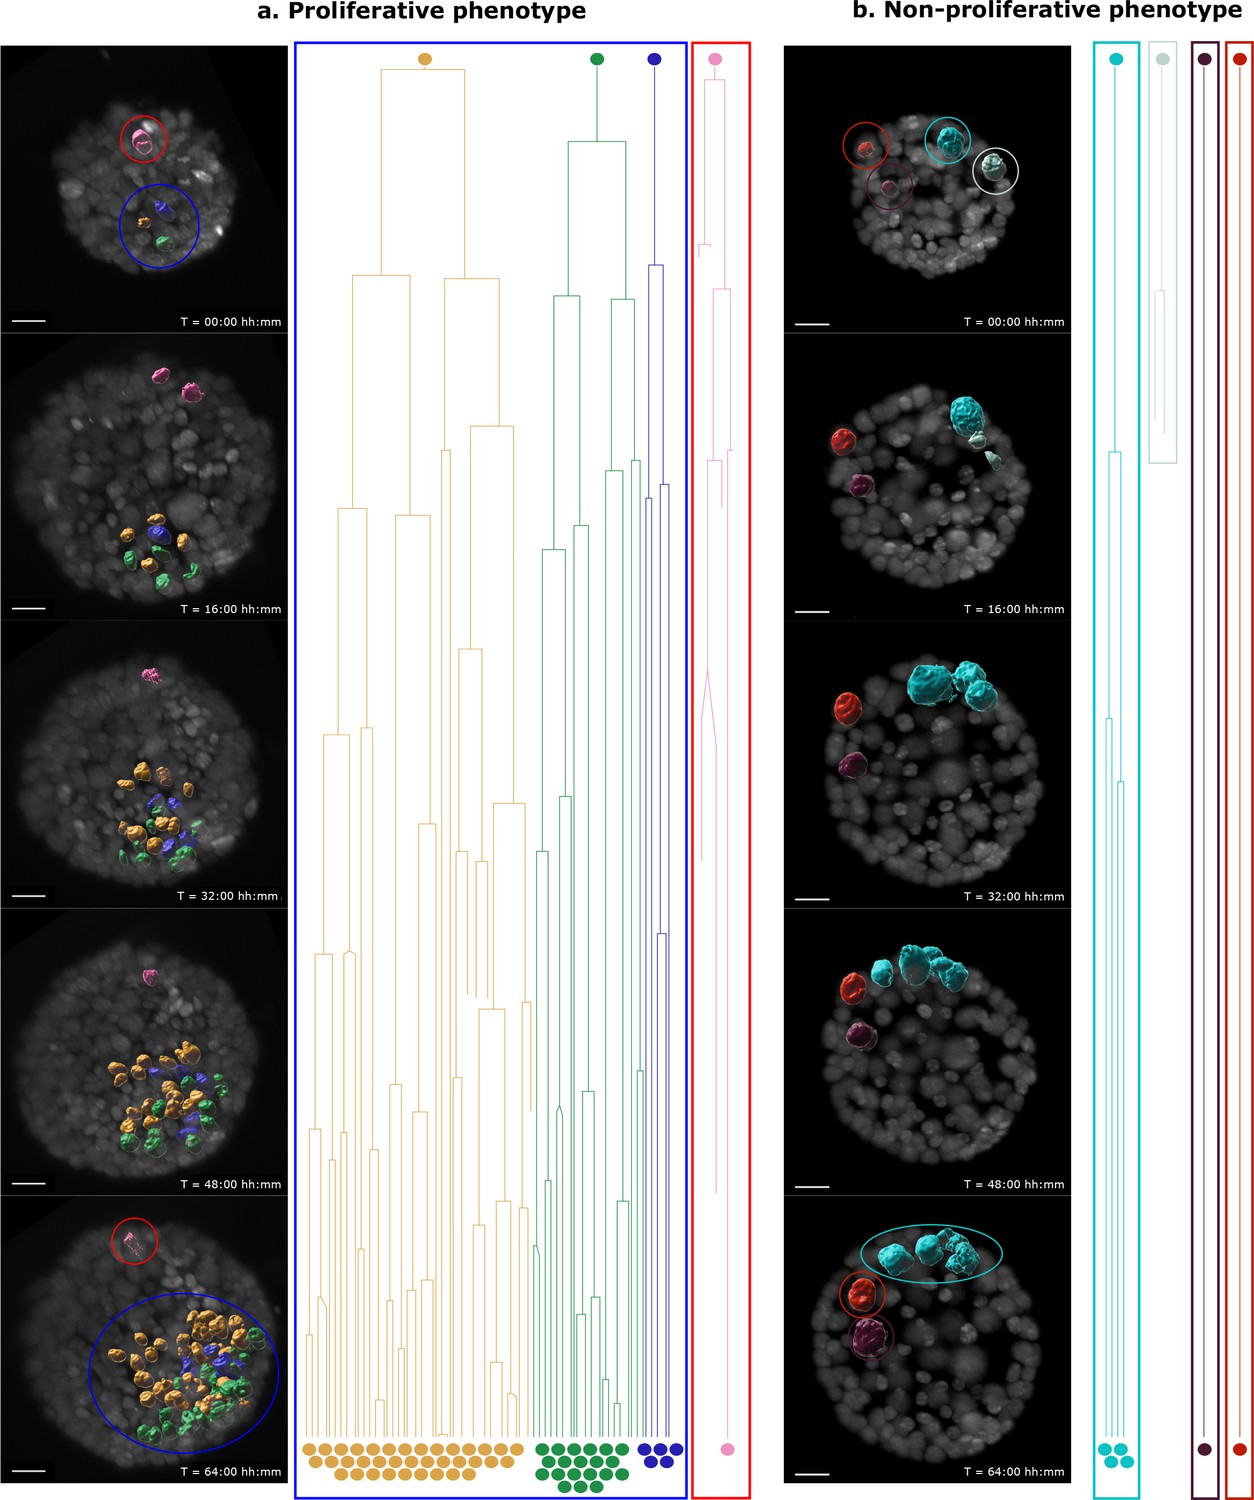
Proliferative and non-proliferative cell clusters can be found within the same B acinus.
Single-cell tracking results are presented for every cell in representative B acini transduced with the Induced-reporter virus starting at 24 hr post doxycycline induction. (a) Acinus with differential outcome for 2 cell clusters – one with a single transduced cell (red) and the other with 3 transduced cells (blue). The cluster containing 3 cells shows heightened cell proliferation and establishment of a multi-layered neoplastic region, while the single cell fails to substantially expand. This demonstrates differential outgrowth of clusters within the same acinus, similar to the example shown in Figure 3a. (b) Acinus with a non-proliferative phenotype is similar in size to (a) and has 4 single cell clusters. None of these clusters show heightened proliferation of transduced cells, but either display normal cell division rates over 64 hr (turquoise), no proliferation at all (red, purple) or inability to survive following a division (grey). (a,b) Images show selected timepoints (0, 16, 32, 48 and 64 hr) of the time-lapse recording. Each transduced cell surface is rendered with Imaris and color coded according to the lineage. Lineage trees of single cells are grouped into proliferative and non-proliferative cell clusters. Color coding is maintained in all panels. Scale bar, 15 μm.
Tables
Key resources table
| Reagent type (species) or resource | Designation | Source or reference | Identifiers | Additional information |
|---|---|---|---|---|
| Strain, strain background (M. musculus, FVB/NJ strain) | TetO-MYC/TetO-Neu/MMTV-rtTA | Moody et al., 2002 Havas et al., 2017 | Tri-transgenic (T) strain | |
| Strain, strain background (M. musculus, FVB/NJ strain) | TetO-MYC/TetO-Neu | Moody et al., 2002 Havas et al., 2017 | Bi-transgenic (B) strain | |
| Strain, strain background (M. musculus, FVB/NJ strain) | R26-H2B-mCherry | Abe and Fujimori, 2013 | RIKEN, CDB0239K | |
| Recombinant DNA reagent | pWPXL plasmid | Didier Trono; Addgene | RRID:Addgene_12257 | 2nd generation lentiviral transfer plasmid |
| Recombinant DNA reagent | pLVPT-GDNF-rtTR-KRAB-2SM2 | Patrick Aebischer and Didier Trono; Addgene | RRID:Addgene_11647 | Template for pGK promoter |
| Recombinant DNA reagent | pCMV-VSV-G | Bob Weinberg; Addgene | RRID:Addgene_8454 | Envelope protein for producing lentiviral and MuLV retroviral particles |
| Recombinant DNA reagent | psPAX2 | Didier Trono; Addgene | RRID:Addgene_12260 | 2nd generation lentiviral packaging plasmid |
| Tranfectedconstruct (M. musculus) | pLv-pGK-H2B-GFP | This paper | Reporter Virus | Drives expression of Reporter-GFP |
| Transfected construct (M. musculus) | pLv-pGK-rtTA-p2A-H2B-GFP | This paper | Inducer-reporter Virus | Drives expression of rtTA and Reporter-GFP |
| Antibody | Anti-c-MYC (D84C12) (Rabbit monoclonal) | Cell signalling Technologies | Cat. # 5605; RRID:AB_1903938 | IF dilution (1:900) |
| Antibody | Anti-alpha6-integrin (clone NKI-GoH3) (mouse monoclonal) | Millipore | Cat. # MAB1378; RRID:AB_2128317 | IF dilution (1:80) |
| Antibody | Anti-ZO1 (61–7300) (rabbit polyclonal) | Life Technologies | Cat. # 61–7300; RRID:AB_2533938 | IF dilution (1:500) |
| Sequence-based reagent | Neu Fw | This paper | PCR primers | CGTTTTGTGGTCATCCAGAACG |
| Sequence-based reagent | Neu Rv | This paper | PCR primers | CTTCAGCGTCTACCAGGTCACC |
| Sequence-based reagent | MYC Fw | This paper | PCR primers | GCGACTCTGAGGAGGAACAAGA |
| Sequence-based reagent | MYC Rv | This paper | PCR primers | CCAGCAGAAGGTGATCCAGACT |
| Sequence-based reagent | mCherry Fw | This paper | PCR primers | GAGGCTGAAGCTGAAGGAC |
| Sequence-based reagent | mCherry Rv | This paper | PCR primers | GATGGTGTAGTCCTCGTTGTG |
| Sequence-based reagent | PUM11 Fw | This paper | PCR primers | AATGTGTGGCCGGATCTTGT |
| Sequence-based reagent | PUM11 Rv | This paper | PCR primers | CCCACAGTGCCTTATACACCA |
| Commercial assay or kit | RNA PureLink Mini Kit | Thermo Fisher | Cat. # 12183018A | RNA Extraction Kit |
| Commercial assay or kit | SuperScript VILO cDNA Synthesis Kit | Thermo Fisher | Cat. # 11754050 | cDNA Synthesis Kit |
| Software, algorithm | Big Data Processor (plugin) | Fiji; Tischer et al., 2019a | RRID:SCR_018484 | |
| Software, algorithm | CATS (plugin) | Fiji; Tischer and Pepperkok, 2019b | RRID:SCR_018486 | |
| Software, algorithm | Imaris | Imaris x64 | Bitplane; RRID:SCR_007370 | Software available at: http://bitplane.com |
| Other | DAPI stain | Thermo Fisher | Cat# 62248; RRID:AB_2307445 | (1 mg/mL), (1:1000 dilution) |
Additional files
-
Source code 1
Transduced Cell Cluster - Feature Analysis.
- https://cdn.elifesciences.org/articles/54066/elife-54066-code1-v1.zip
-
Supplementary file 1
Comprises of an html file describing the Source code 1 in ‘Feature_Analysis.Rmd’.
- https://cdn.elifesciences.org/articles/54066/elife-54066-supp1-v1.zip
-
Supplementary file 2
Comprises of an .xlsx file with 20 sheets, one for each acinus analyzed, and contains the x,y,z coordinates for each cell in the respective acinus at the beginning of the SPIM recording.
This file was input into the source code to carry out the acinus feature analysis described in Figure 4b and Figure 4—figure supplement 1.
- https://cdn.elifesciences.org/articles/54066/elife-54066-supp2-v1.xlsx
-
Supplementary file 3
Comprises of an .xlsx file with 20 sheets, one for each acinus analyzed, and contains the x,y,z coordinates for each cell in the respective acinus at the end of the SPIM recording.
This file was input into the source code to carry out the acinus feature analysis described in Figure 4b and Figure 4—figure supplement 1.
- https://cdn.elifesciences.org/articles/54066/elife-54066-supp3-v1.xlsx
-
Supplementary file 4
Comprises of an .xlsx file with 20 sheets, one for each acinus analyzed, and contains the ‘label’ for each transduced cell (corresponding to the labels in Supplementary file 2) in the respective acinus at the beginning of the SPIM recording.
This file was input into the source code to carry out the acinus feature analysis described in Figure 4b and Figure 4—figure supplement 1.
- https://cdn.elifesciences.org/articles/54066/elife-54066-supp4-v1.xlsx
-
Transparent reporting form
- https://cdn.elifesciences.org/articles/54066/elife-54066-transrepform-v1.docx
Download links
A two-part list of links to download the article, or parts of the article, in various formats.
Downloads (link to download the article as PDF)
Open citations (links to open the citations from this article in various online reference manager services)
Cite this article (links to download the citations from this article in formats compatible with various reference manager tools)
Tracking cells in epithelial acini by light sheet microscopy reveals proximity effects in breast cancer initiation
eLife 9:e54066.
https://doi.org/10.7554/eLife.54066


