Genetic profiling of protein burden and nuclear export overload
- Donnelly Center for Cellular and Biomolecular Research, Department of Medical Genetics, University of Toronto, Canada
- Research Core for Interdisciplinary Sciences, Okayama University, Japan
- Matching Program Course, Okayama University, Japan
- Graduate School of Environmental and Life Science, Okayama University, Japan
- Department of Life Sciences, School of Agriculture, Meiji University, Japan
- Graduate School of Frontier Sciences, University of Tokyo, Japan
- RIKEN Center for Sustainable Resource Science, Japan
Figures
Figure 1 with 2 supplements

Experimental scheme of genetic interaction (GI) analysis.
(A) Each mutant from a deletion mutant array (DMA) and a temperature-sensitive mutant array (TSA) was combined with GFP overproduction (GFP-op) using the synthetic genetic array (SGA) method (Baryshnikova et al., 2010). The colony size of each derivative strain grown on synthetic complete (SC)–Ura and SC–Leu/Ura plates was measured to calculate a genetic interaction (GI) score (ε). Four colonies were analyzed for each strain, and the entire experiment was duplicated. (B) The structure of the plasmid used to overexpress GFP. The plasmid copy number, and thus the expression level of GFP, can be changed by changing the growth conditions. (C and D) Effect of GFP production on growth under each condition. The size of colonies of each strain grown on agar medium was measured (n > 12). The Y7092 strain was used as the host. The maximum growth rate was measured in liquid culture (n > 4). The average, standard deviation (error bar), and p-value of Student’s t-test are shown.
Figure 1—figure supplement 1
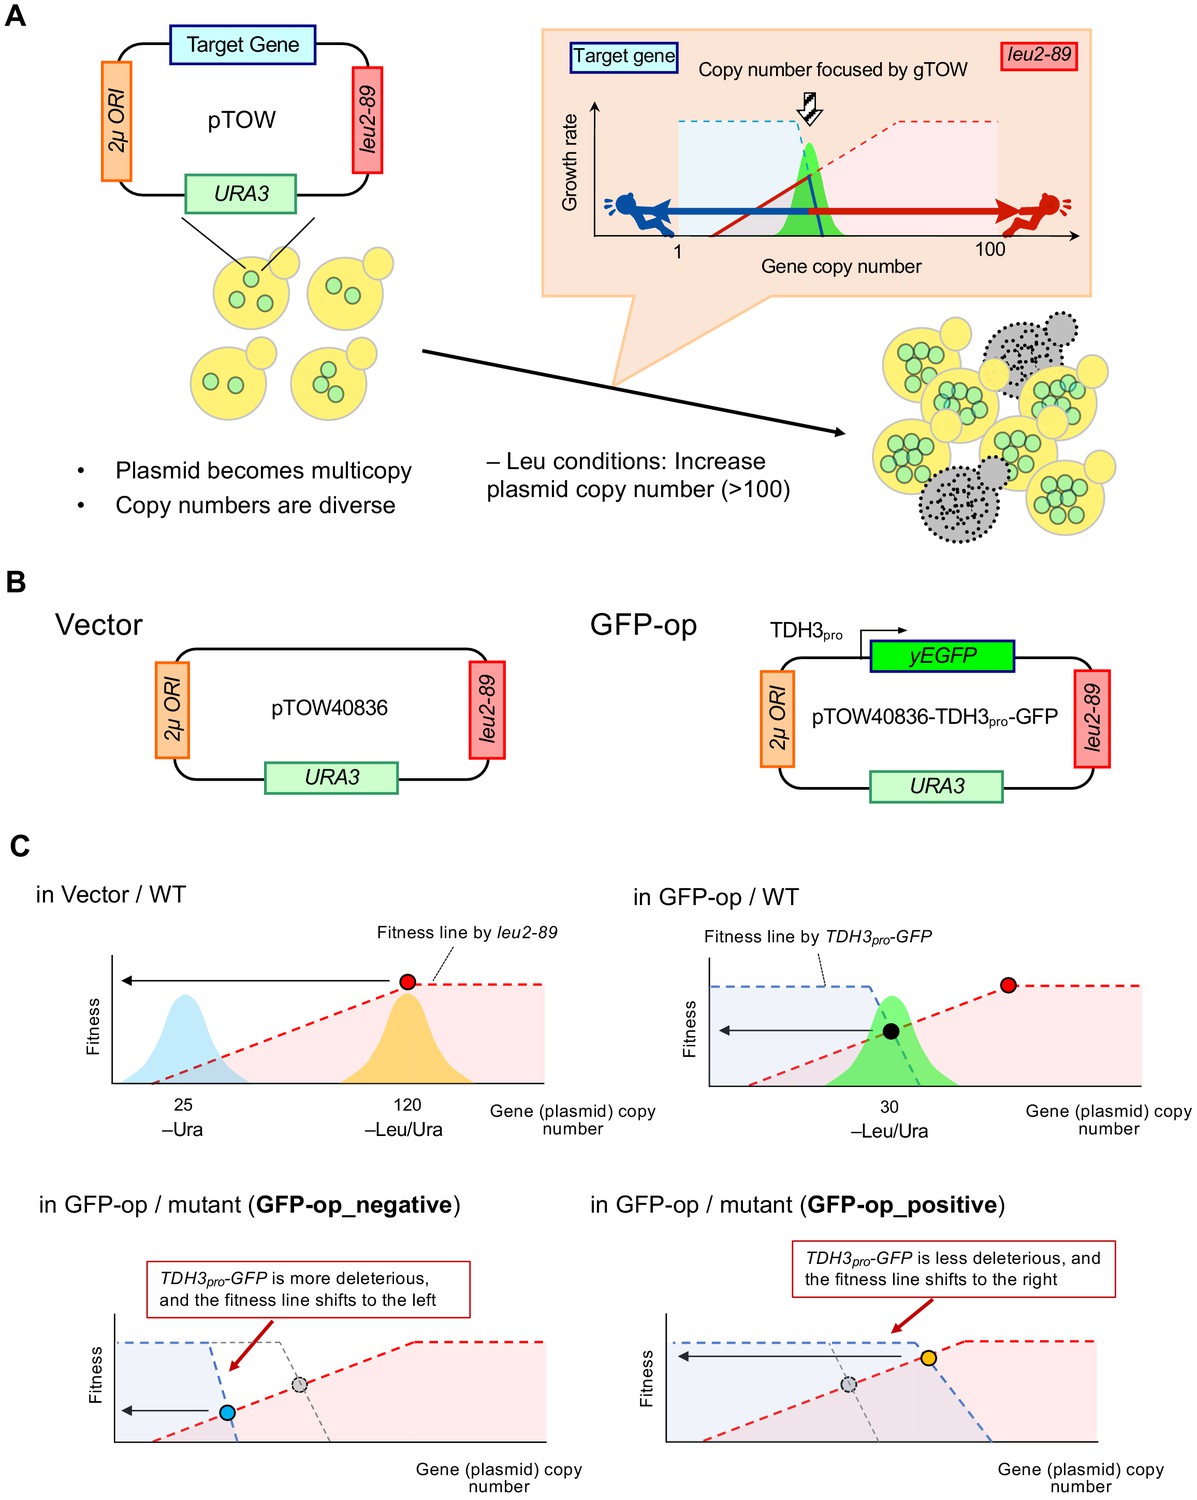
Background principles of genetic tug-of-war to determine plasmid copy number and growth rate.
(A) Outline of the genetic tug-of-war method. The explanation of the method is described below. (B) Structure of the plasmid vector (pTOW40836) and the GFP-op plasmid (pTOW40836-TDH3pro-GFP) used in this study. In the case of tGFP-op and NETS-tGFP-op, TDH3pro-yEGFP is replaced by PYK1pro-tGFP and PYK1pro-NES-tGFP (shown in Figure 5A). (C) Principles for determining plasmid copy number and growth rate (fitness) in each condition. The intracellular copy number of the plasmid used in this study varies according to the principle of genetic tug-of-war (gTOW). The copy number of the plasmid is related to the growth rate of the cell. The original genetic tug-of-war method was published in Moriya et al., 2006, and a detailed explanation of the method is also described in Moriya et al., 2012. In the genetic tug-of-war method, the target gene is cloned on a plasmid carrying two selective markers of nutrient requirement, URA3 and leu2-89, and a 2µ plasmid origin (A and B). The plasmid is introduced into the ura3 leu2-deficient strain and first cultured in –Ura medium. This plasmid will be multicopied due to the function of the 2µ origin, and the number of copies in the population will vary. In this case, a vector without an insert (A) results in a copy number of about 25 (C, in Vector/WT). If an excess of the target gene adversely affects growth, the copy number of the plasmid will be lower than the vector even under –Ura conditions, but it will have little effect on growth. For example, the copy number has been found to be about 10 in pTOW40836-TDH3pro-GFP (B), which was used in this study (Eguchi et al., 2018). If we transfer the plasmid-bearing strains to the -Leu/Ura conditions, the copy number of the plasmid rises to about 120. This is because the other marker, leu2-89, is a LEU2 allele with a large deletion in its promoter and is expressed at a significantly lower level than the wild-type LEU2 allele. As a result, cells with high plasmid copy numbers are selected, and the number of copies of the plasmid retained by the population is around 120 copies in the vector case (C, in Vector/WT). In the case of a plasmid incorporating TDH3pro-GFP as a target, the copy number of TDH3pro-GFP also increases with the increase in plasmid copy number caused by leu2-89, resulting in a growth inhibition effect due to GFP overexpression. This acts as a bias to lower the copy number. Thus, the copy number of intracellular plasmids in –Leu/Ura is determined by the tug-of-war between the copy number elevation bias of leu2-89 and the copy number lowering bias of TDH3pro-GFP. In –Leu/Ura conditions, pTOW40836-TDH3pro-GFP has a copy number of about 30, at which time GFP is about 15% of the total protein in the cell (C, in GFP-op/WT) (Eguchi et al., 2018). The relationship between plasmid copy number and growth rate (fitness) can be explained by the figure in (C) When the vector is introduced into the wild type and grown in –Leu/Ura medium, the plasmid copy number rises following the fitness line made by leu2-89. Shown as blue and orange areas are hypothetical histograms of cell populations with plasmids of the copy number shown. The growth rate of cells carrying pTOW40836-TDH3pro-GFP and the copy number of the plasmid depends on the intersection of the fitness line of leu2-89 and the fitness line created by TDH3pro-GFP. This is because this intersection is the highest fitness point for cells cultured with –Leu/Ura. In mutants susceptible to GFP overexpression, the TDH3pro-GFP fitness line shifts to the left (C, in GFP-op/mutant (GFP-op_negative mutants)). This causes the fitness (and plasmid copy number) of this mutant strain overexpressing GFP to be lower than the wild type. In contrast, in mutants resistant to GFP overexpression, the TDH3pro-GFP fitness line shifts to the right (C, in GFP-op/mutant (GFP-op_positive mutants)). This increases the fitness (and plasmid copy number) of this GFP-overexpressing mutant strain over the wild type.
Figure 1—figure supplement 2
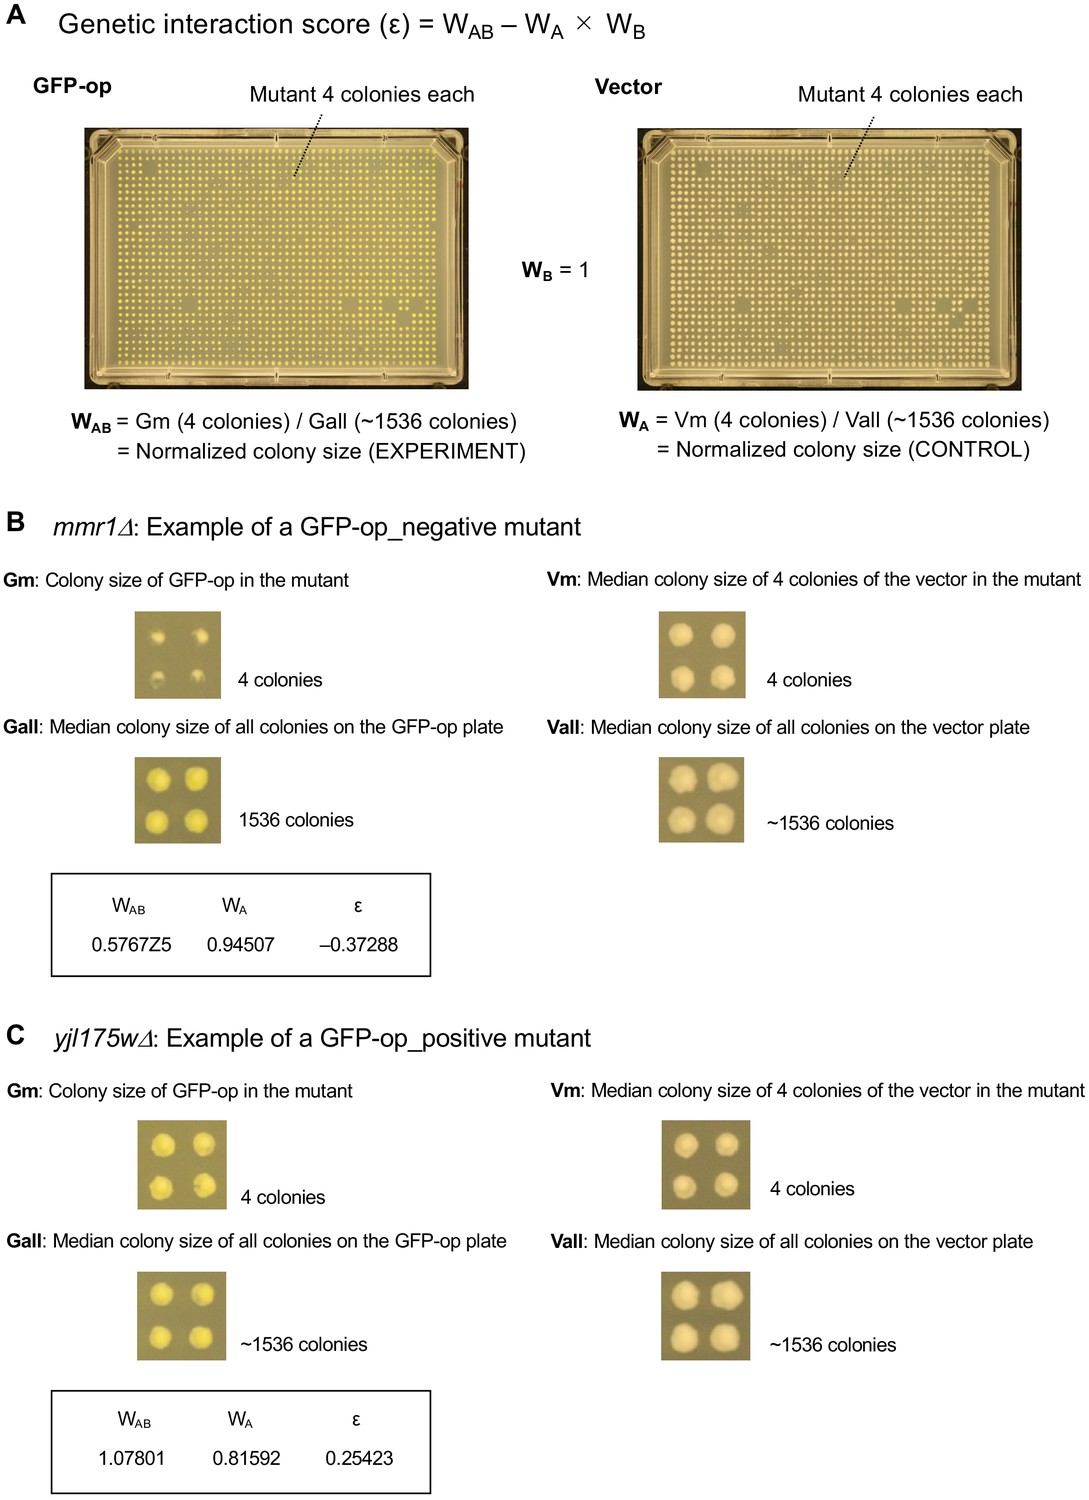
Measurement of fitness and calculation of genetic interaction score.
Figure 2 with 5 supplements
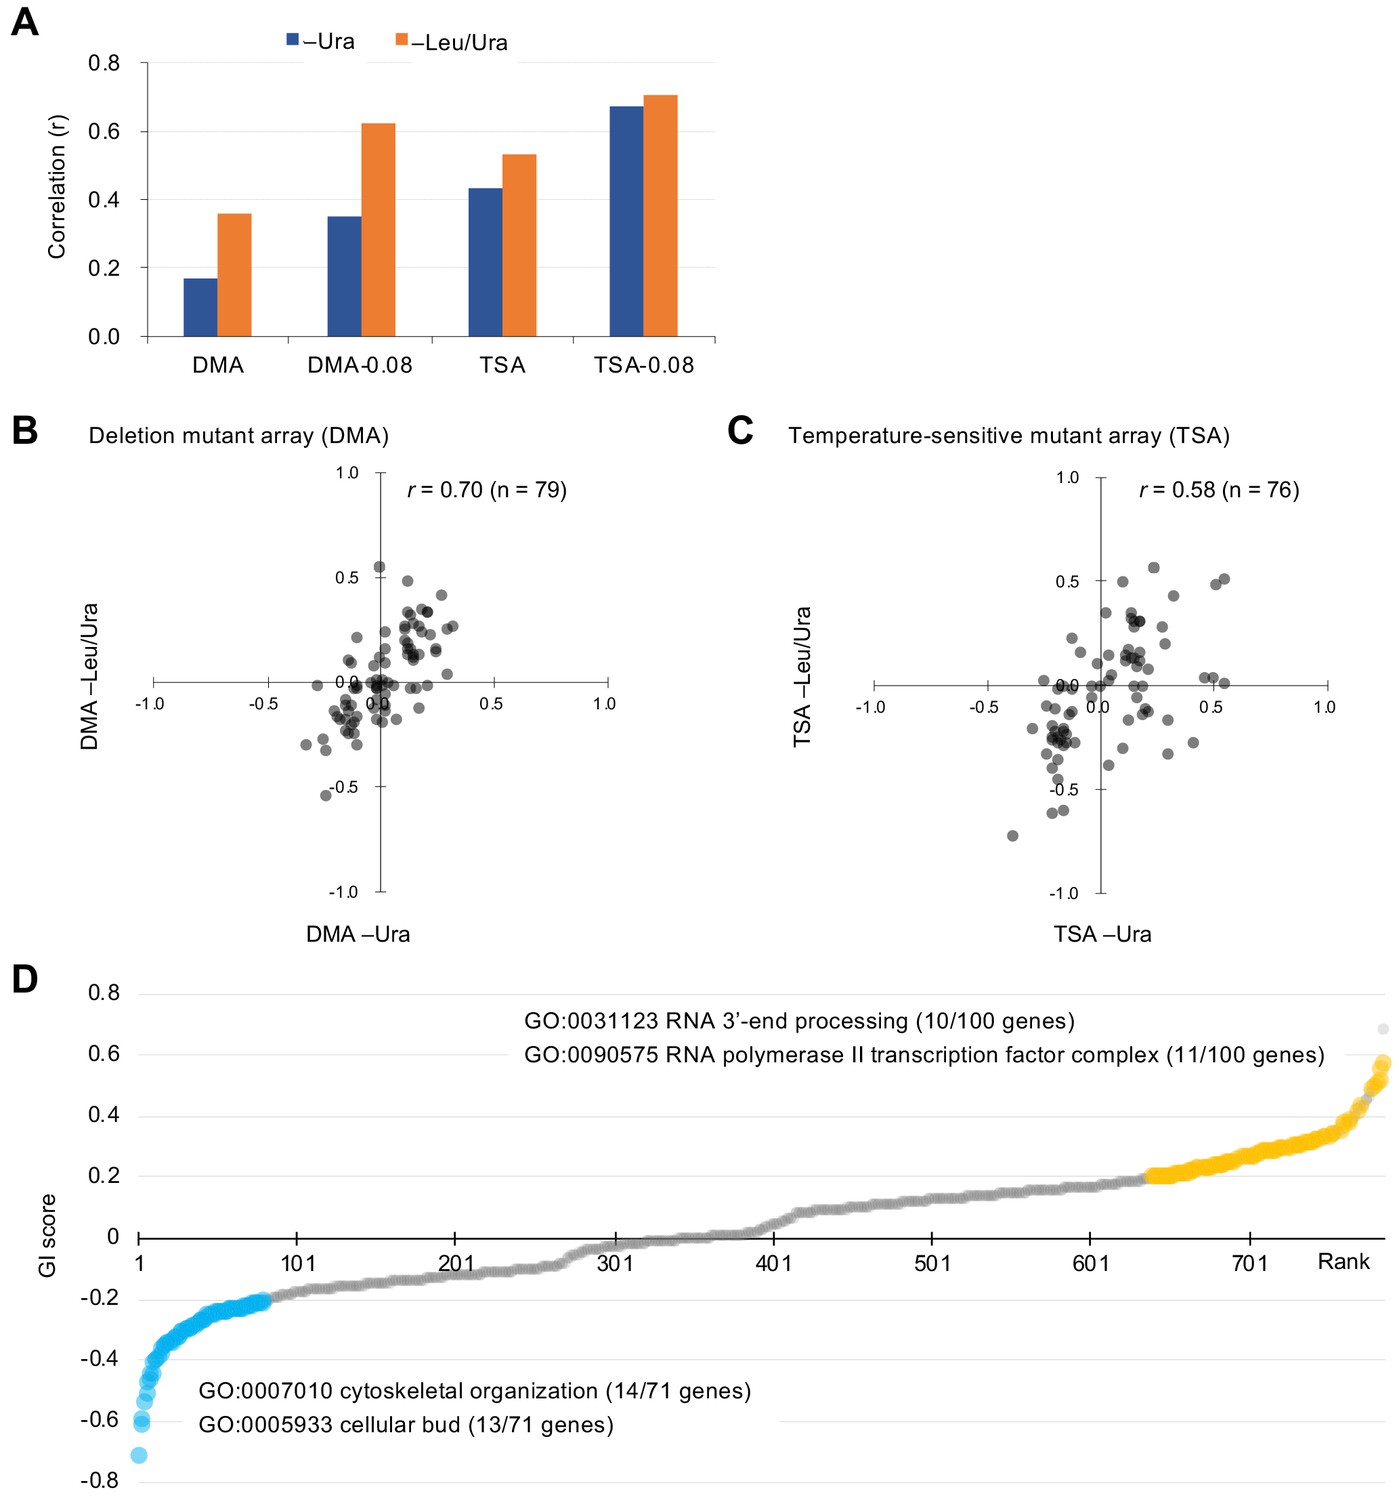
Characteristics of GI scores.
(A) Pearson correlation coefficient (r) of GI scores from experimental duplicates. DMA and TSA: comparison of all GI scores of duplicates obtained by the GI analysis using DMA and TSA. DMA-0.08 and TSA-0.08: comparison of GI scores of duplicates with value > |0.08| obtained by the GI analysis using DNA and TSA. Figure 2—figure supplement 1 shows an independent comparison. (B and C) Comparison of average GI scores of DMA (B) and TSA (C) mutants both with GI scores in the duplicates > |0.08| under –Ura and –Leu/Ura conditions. (D) GI score (ε) of mutants isolated ordered by score ranking. Mutants with low (<0.2) and high (>0.2) scores are shown in light blue and orange, with enriched GOs in those mutants. The score in –LU is shown. The full list of enriched genes is in Supplementary file 1.
-
Figure 2—source data 1
Raw data of GFP-op SGA analysis; associated with Figure 2A–C; Figure 2—figure supplement 1; Figure 2—figure supplement 5A; Figure 3; Figure 4—figure supplement 3D; Figure 5—figure supplement 1.
- https://cdn.elifesciences.org/articles/54080/elife-54080-fig2-data1-v2.xlsx
-
Figure 2—source data 2
Isolated GFP-op, tGFP-op, and NES-tGFP-op positive and _negative mutants by this study; associated with Figure 2, 4C; Figure 4D; Figure 5—figure supplement 2; Figure 5C; Figure 5D; Figure 5E; Figure 6A.
- https://cdn.elifesciences.org/articles/54080/elife-54080-fig2-data2-v2.xlsx
Figure 2—figure supplement 1
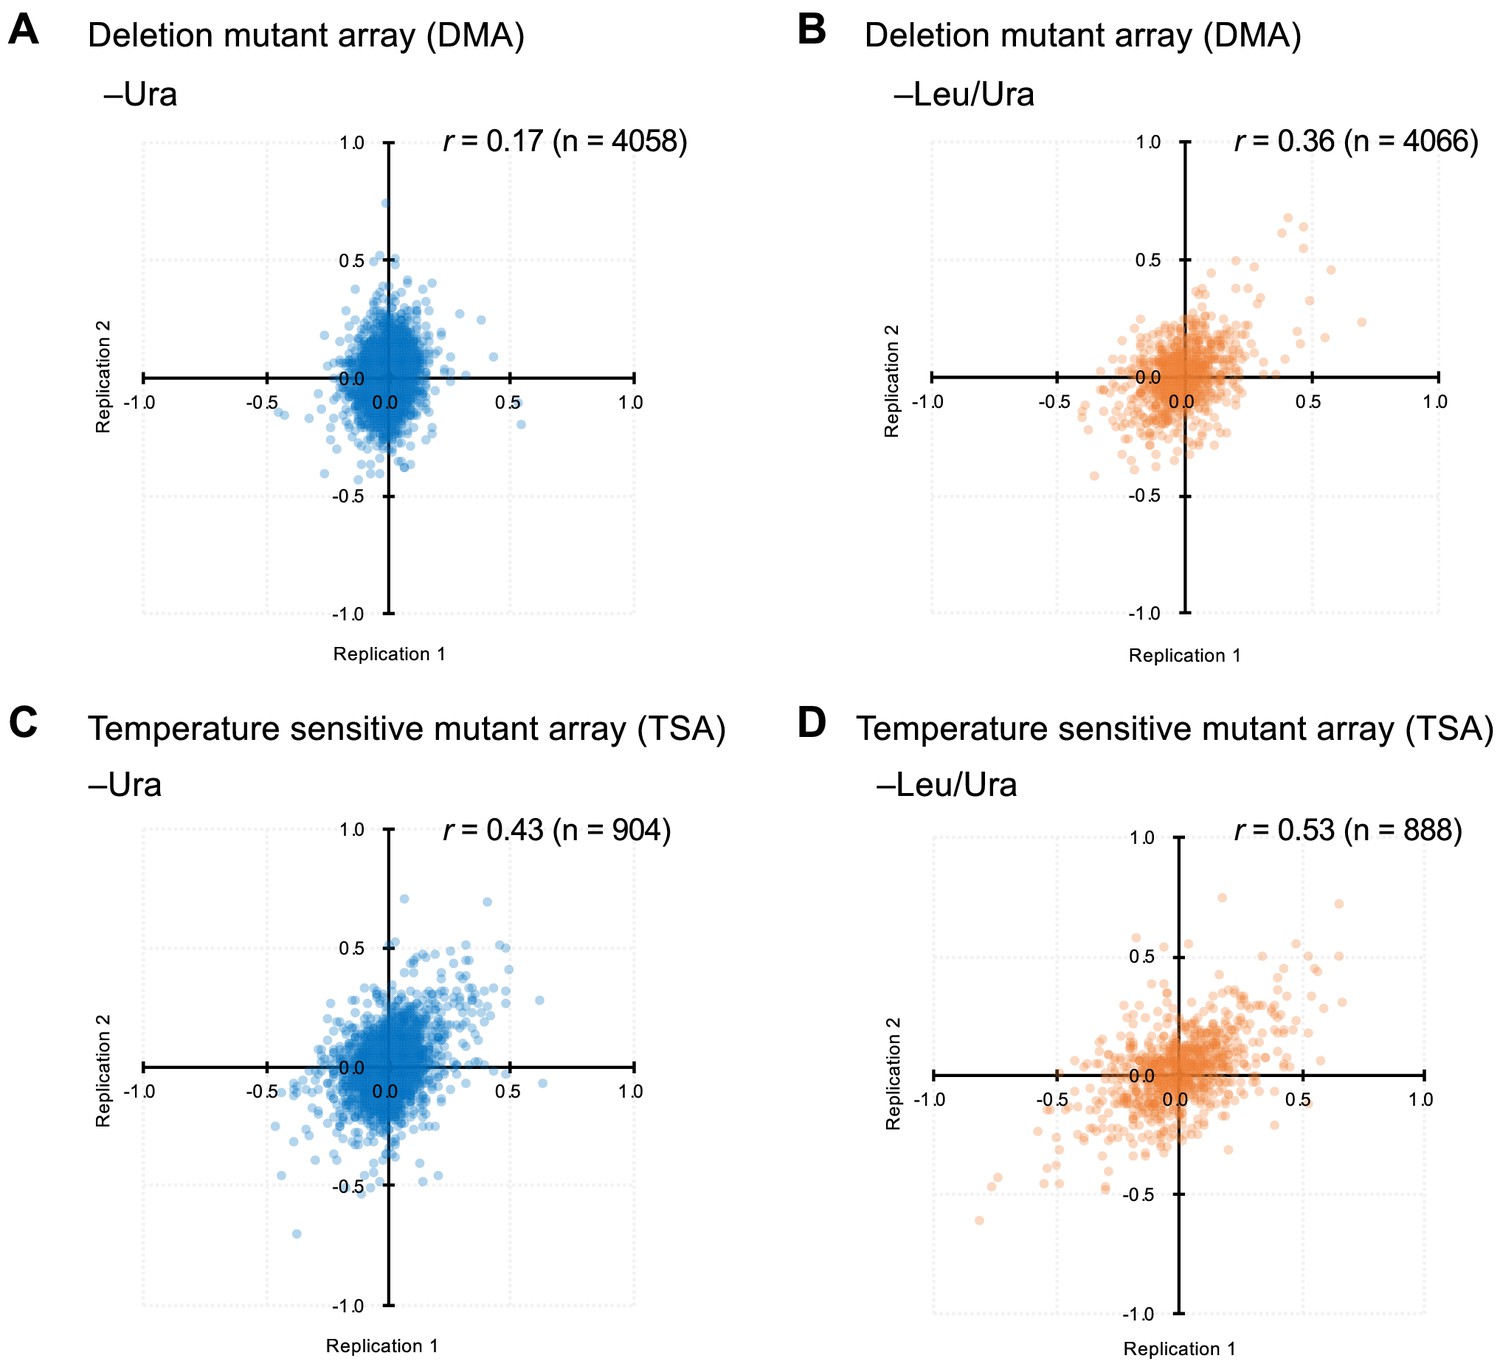
Comparison of GI scores from experimental duplicates.
(A-D) indicates the conditions and mutants used.
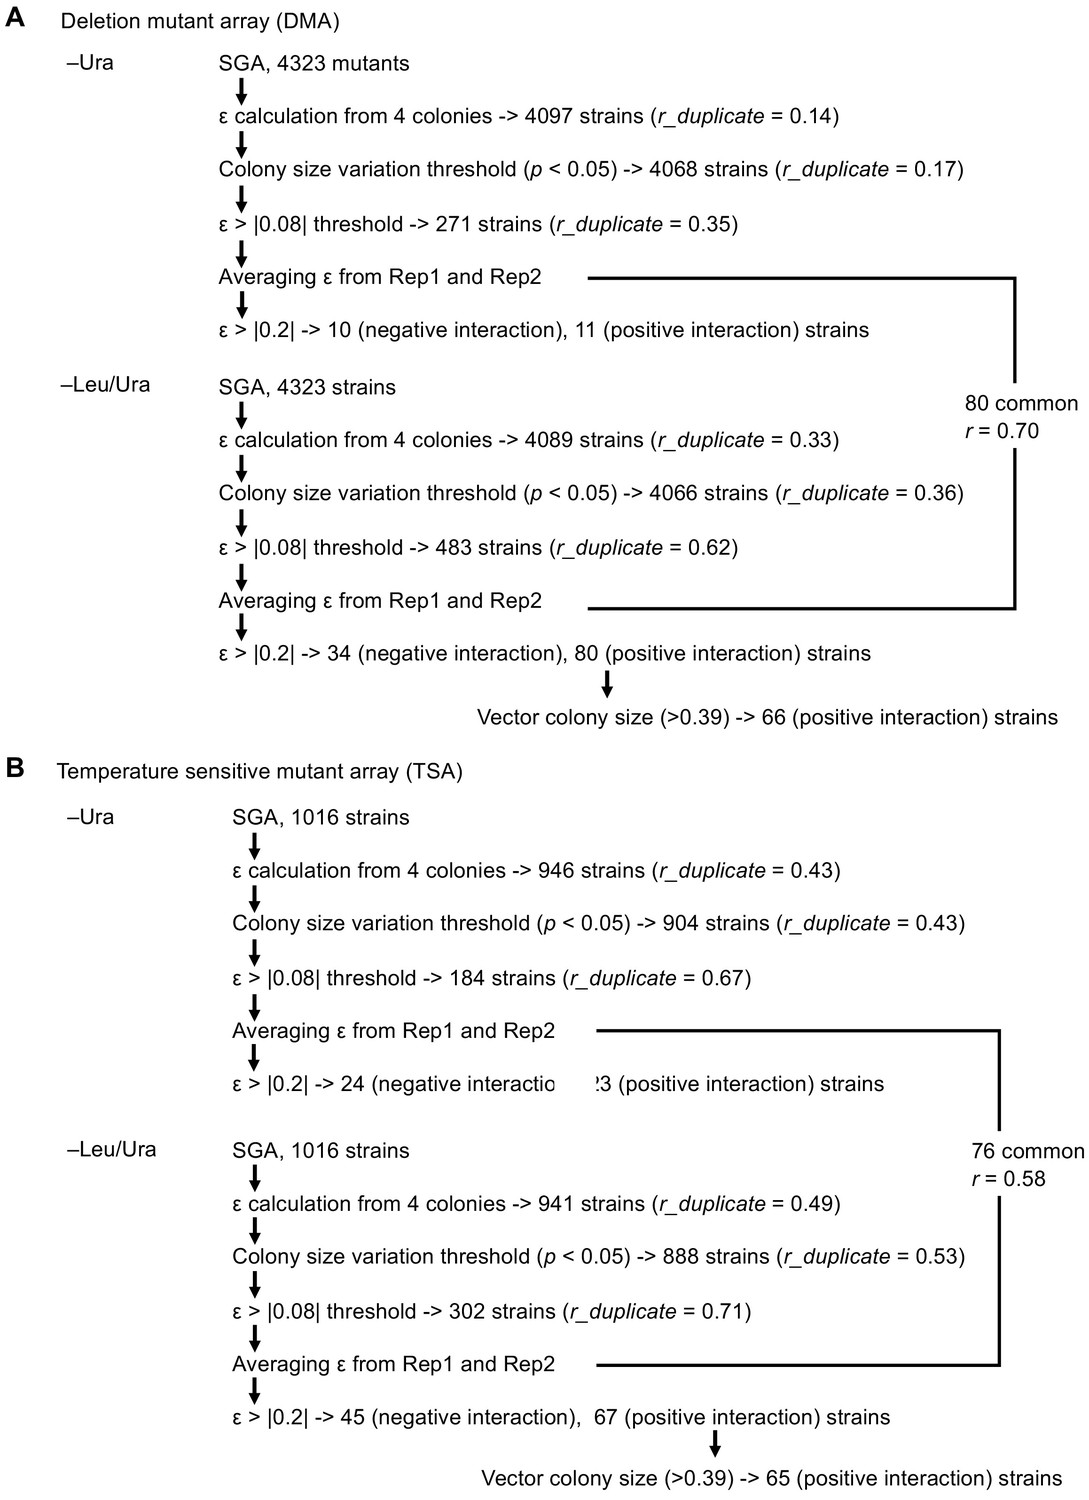
Figure 2—figure supplement 2
Scheme to isolate mutants showing GIs of high confidence with GFP-op.
(A) Analysis with DMA, and (B) analysis with TSA.
Figure 2—figure supplement 3
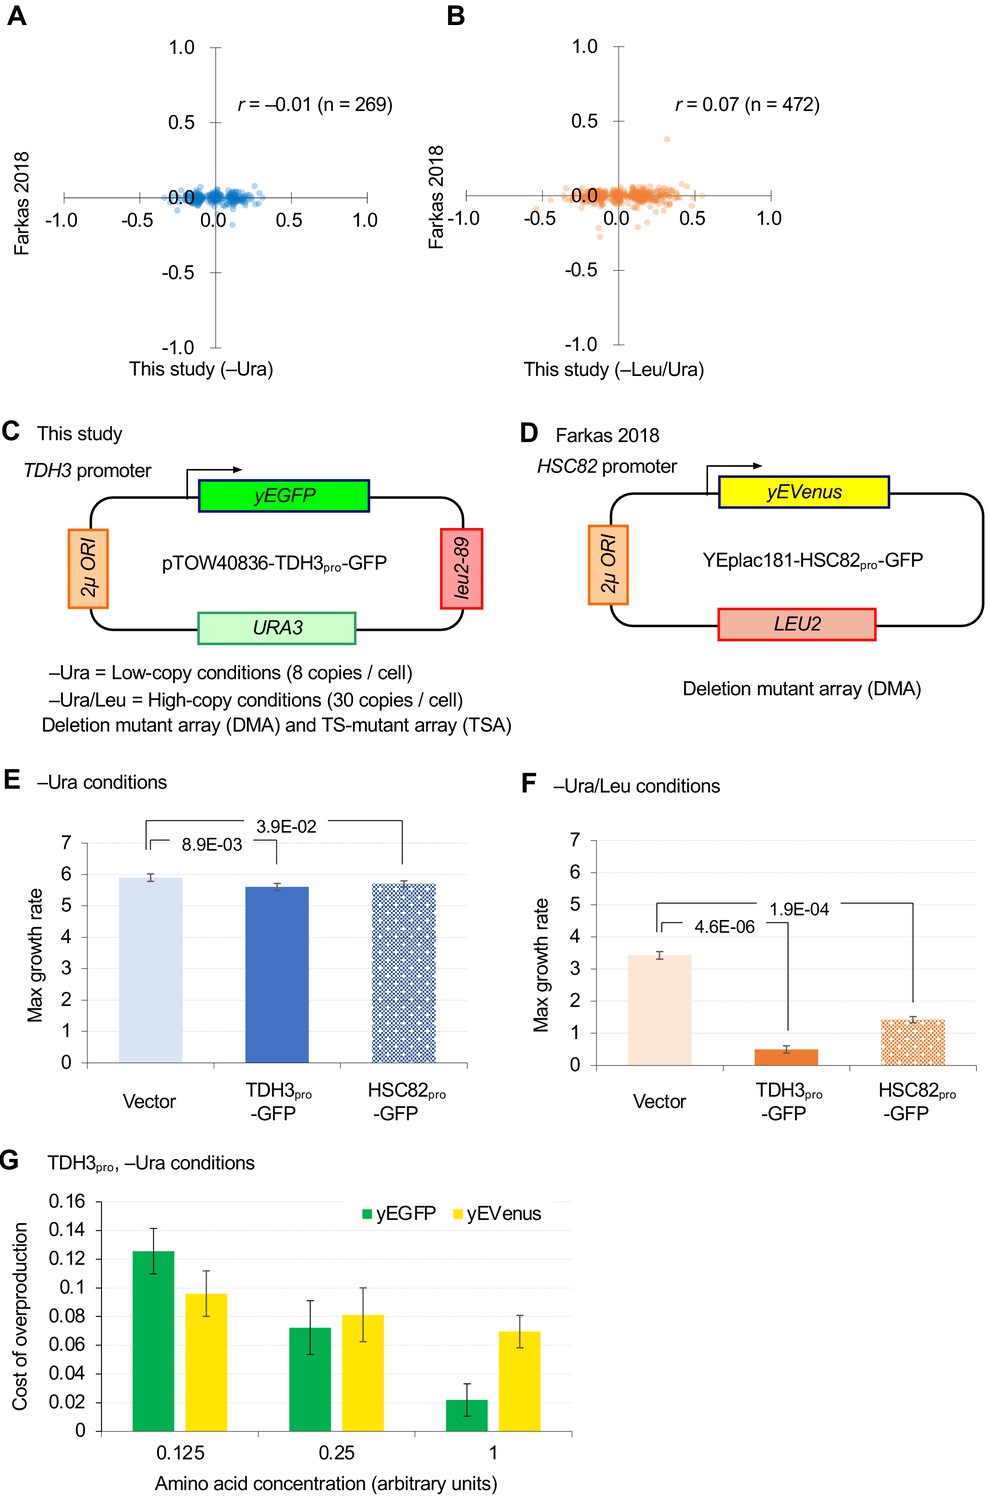
Comparison of GI analyses in this study and a previous study (Farkas et al., 2018).
(A and B) Comparison of GI scores of DMA mutants isolated by ε > |0.08| thresholding in this study. (C and D) Plasmids and conditions used in this study and the previous study. (E and F) Effects of overproduction of GFP from TDH3 promoter (TDH3pro) and HSC82 promoter (HSC82pro) on the plasmid pTOW40836 in –Ura (C) and –Leu/Ura (D) conditions. The average, standard deviation (error bar), and p-value of Student’s t-test are shown. (G) The cost of GFP and yEVenus overexpression when amino acid supplements are diluted. Growth rates of BY4743 strains harboring pTOW40836, pTOW40836-TDH3pro-GFP, and pTOW40836-TDH3pro-yEVenus were measured in liquid SC–Ura medium and in liquid SC–Ura medium supplemented with amino acid supplements in the units indicated. Auxotrophic amino acids (His and Leu) were added at a concentration of 1×. The cost of GFP and yEvenus overexpression in each medium was calculated as 1 – (growth rate of overexpressing strain/growth rate of vector control). Graphs show the mean of the four biological replicates, and error bars indicate their standard deviation.
Figure 2—figure supplement 4
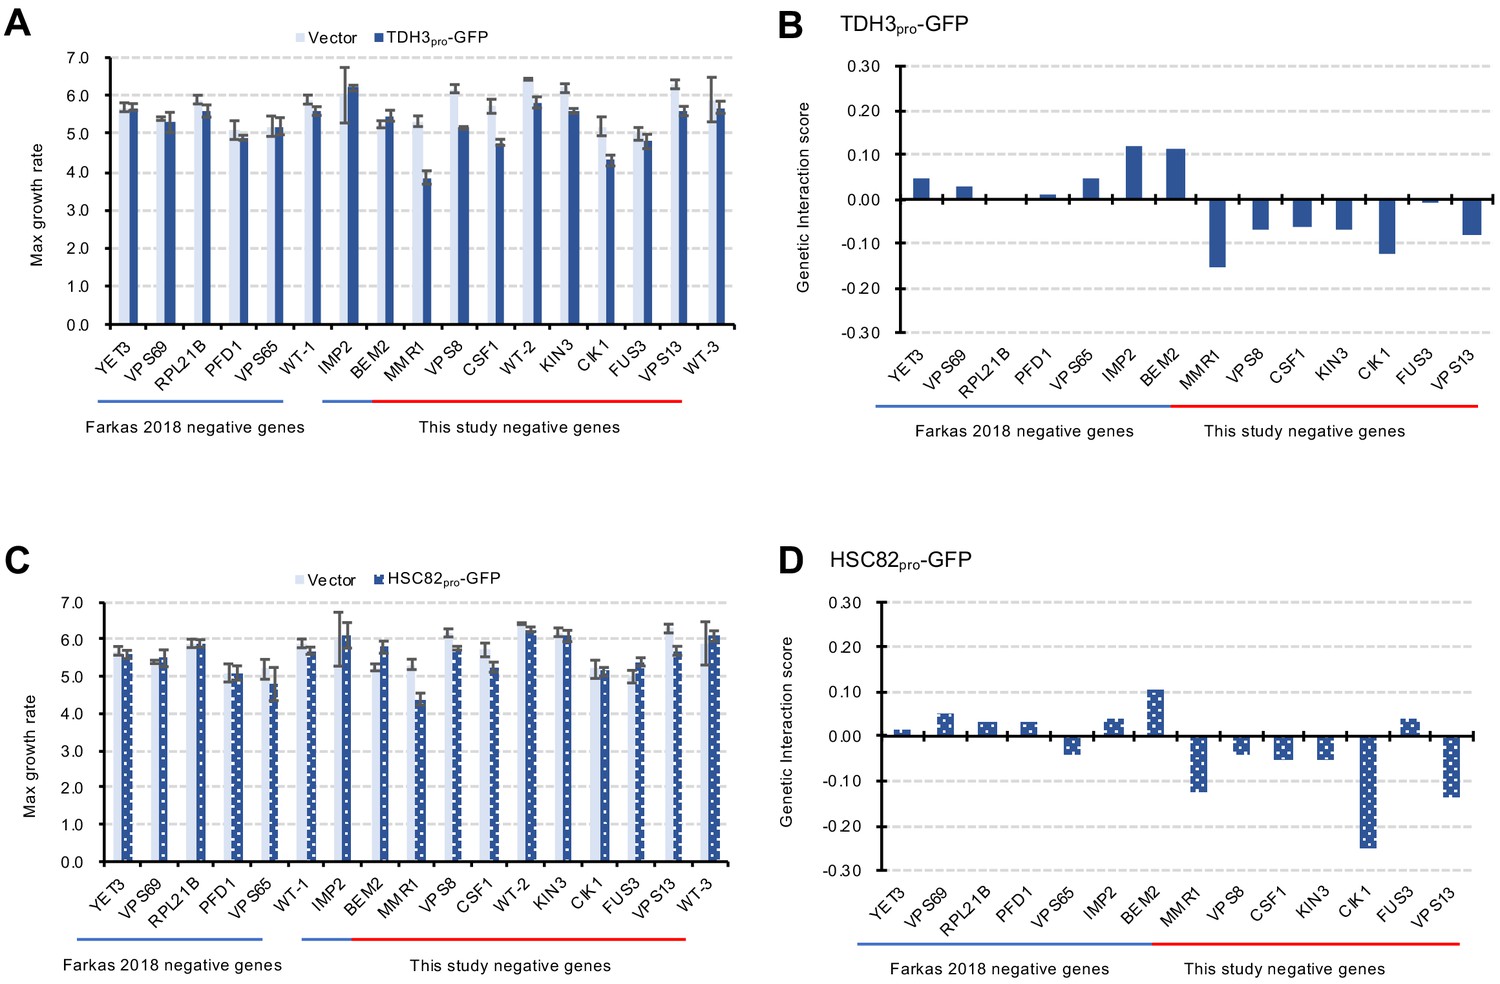
Verification of GIs with independent liquid growth measurement.
(A and C) Maximum growth rates of mutant cells with TDH3pro-GFP (A) and HSC82 pro-GFP (C) plasmids in synthetic complete (SC)–Ura medium. Average and standard deviation (error bar) of four independent experiments is shown. (B and D) GI scores of mutants and GFP-op from TDH3 pro (B) and HSC82 pro (D). GI score was calculated as follows: GI score (ε)=WAB – WA × WB. Where WAB: Gm/Vw, WA: Gw/Vw, WB: Vm/Vw Gw: Average max growth rate of GFP-op_wild type (four independent measurements) Gm: Average max growth rate of GP-op_mutant (four independent measurements) Vw: Average max growth rate of Vector_wild type (four independent measurements) Vm: Average max growth rate of Vector_mutant (four independent measurements).
Figure 2—figure supplement 5
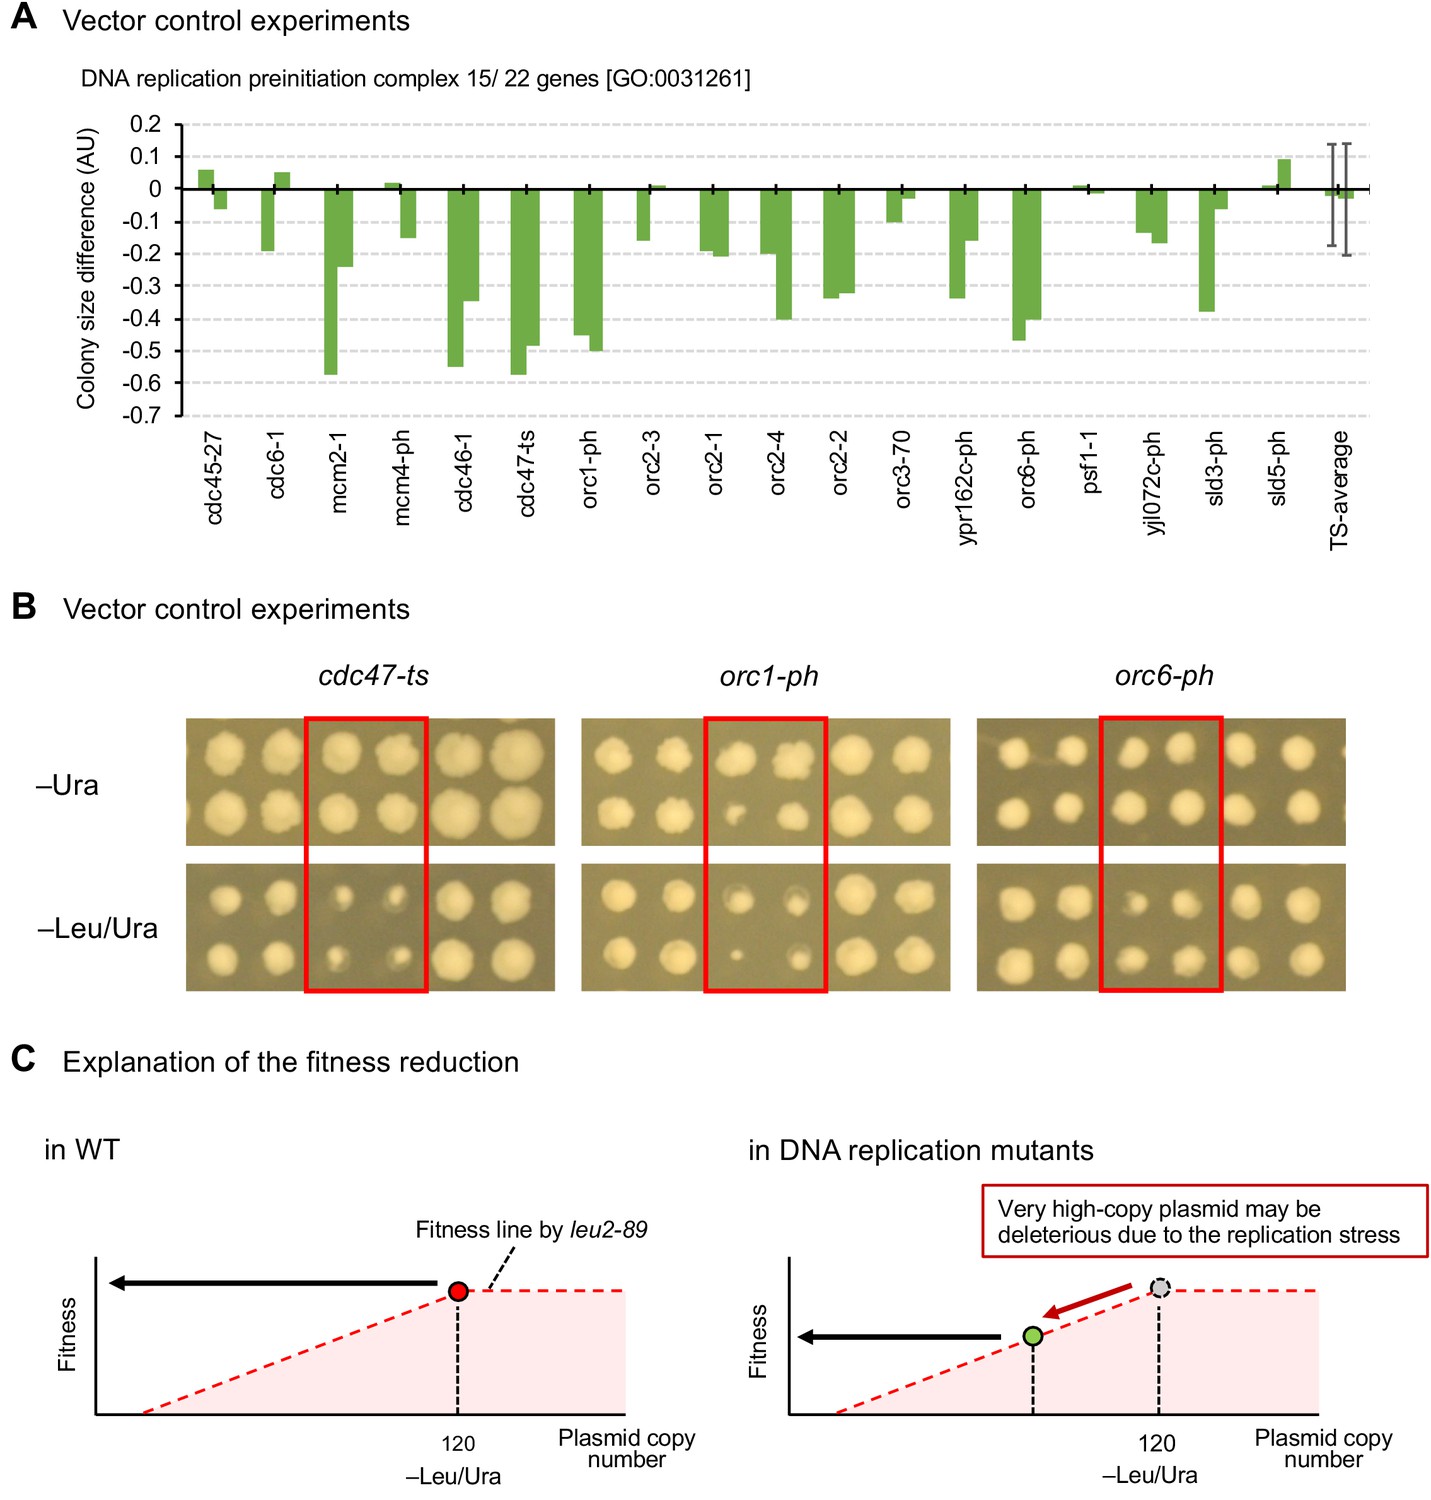
Mutants of replication initiation complex specifically show growth defects in the high-copy conditions.
(A) Colony size differences of vector control experiment of genes categorized as GO categories ‘DNA replication preinitiation complex [GO:0031261]’ on synthetic complete (SC)–Ura and SC–Leu/Ura plates. AU = (colony size on –Leu/Ura plate) / (colony size on –Ura plate). AUs of each mutant from duplicated experiments are shown. The average AU and standard deviation (error bar) of temperature-sensitive mutants are shown. (B) Representative mutants showing growth defects under high-copy conditions (–Leu/Ura) in the vector control experiments. (C) An explanation for the reduced fitness of vector controls in replication mutants. The fitness of cells harboring the pTOW40836 vector under -Leu/Ura conditions is dependent on the plasmid copy number. The inability to maintain pTOW40836 at a high copy number in the replication mutant is likely to result in reduced fitness.
Figure 3
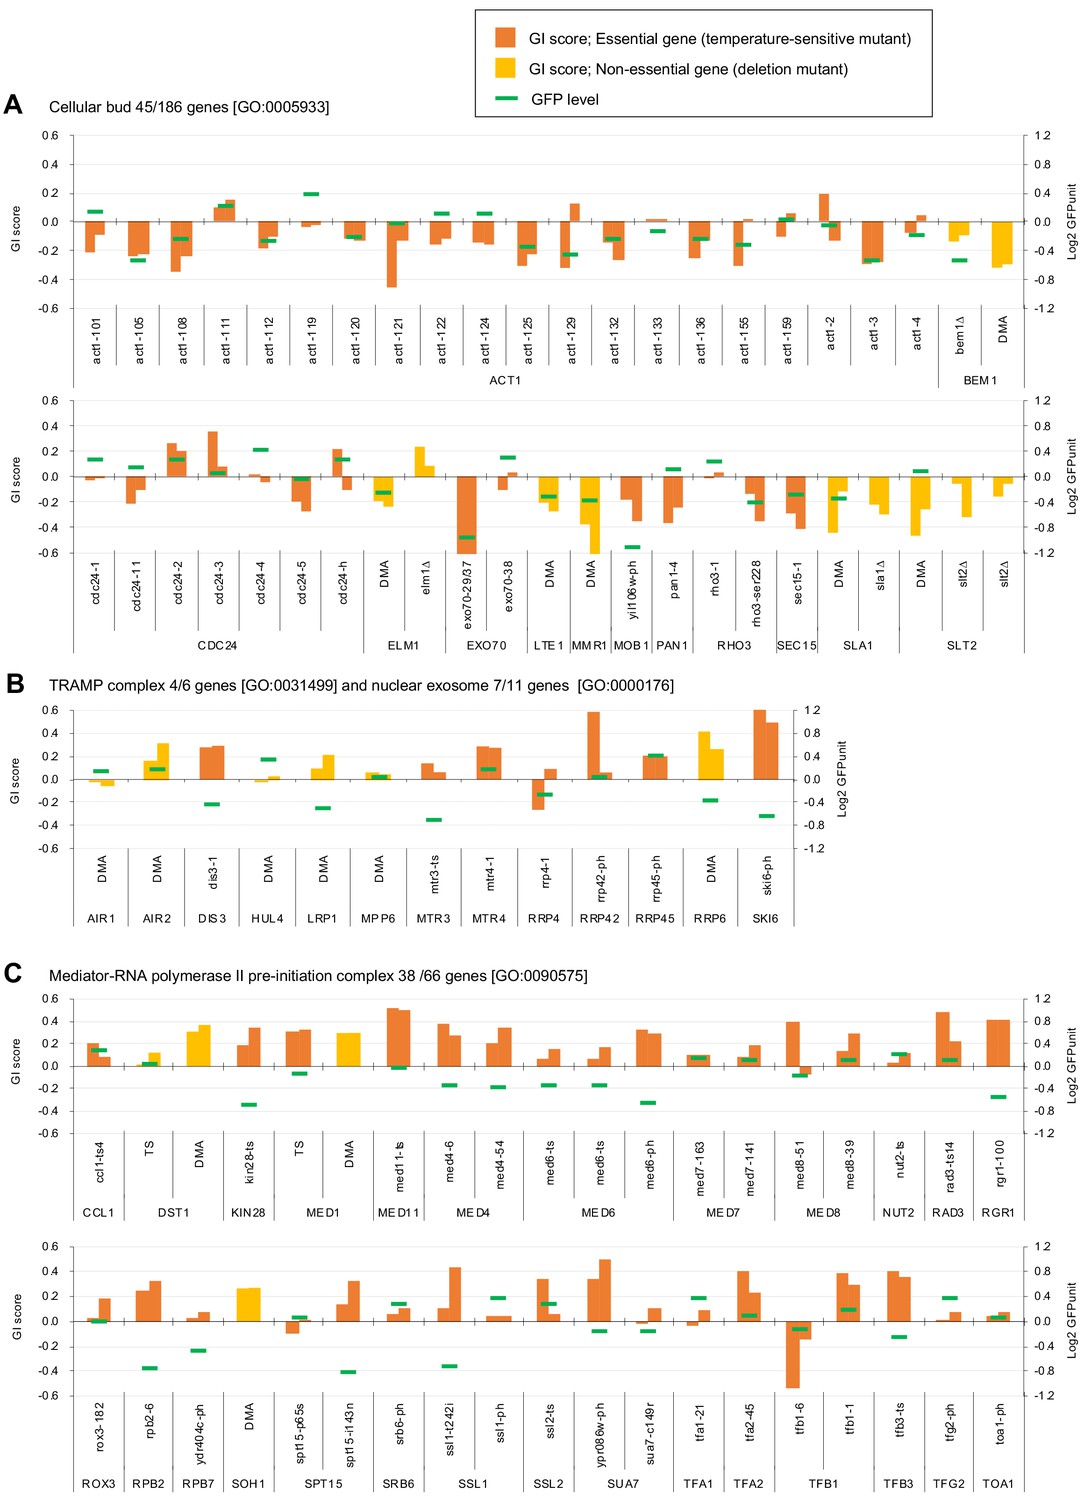
Independent GI scores ( ε) of genes enriched in GO categories in GFP_negative and GFP_positive genes.
(A) GI scores of mutants isolated as GFP_negative genes annotated with the GO term 'cellular bud [GO:0005933]'. (B) GI scores of mutants annotated with the GO terms ‘TRAMP complex [GO:0031499]’ and 'nuclear exosome [GO:0000176]'. (C) GI scores of mutants annotated with the GO term 'Mediator-RNA polymerase II preinitiation complex [GO:0090575]'. GI scores from experimental replicates under –Leu/Ura conditions are shown. Temperature-sensitive mutant of essential genes and deletion mutant of non-essential gene are shown in different colors. GFP levels for each strain are also shown.
Figure 4 with 3 supplements

Experimental scheme of GFP expression measurements of mutants.
(A) Each mutant from a deletion mutant array (DMA) and a temperature-sensitive mutant array (TSA) was combined with GFP overproduction (GFP-op) with background E2-Crimson expression, using a synthetic genetic array (SGA) method. The median GFP fluorescence (F488) and E2-Crimson fluorescence (F532) of each colony were measured, and the GFP expression level (GFPunit) of each mutant was calculated by dividing F488 by F532 to normalize colony size. (B) Further classification and interpretation of mutant strains exhibiting positive/negative genetic interactions using GFP levels. A more detailed explanation is shown in Figure 4—figure supplement 1. (C) GFPunits of GFP-op_negative mutants. Mutants with lower and higher GFPunits than the average are designated as GFP_L and GFP_H mutants, respectively. Representative GO terms enriched in GFP_L mutants in GFP-op_negative mutants are shown. (D) GFPunits of GFP-op_positive mutants. Representative GO terms enriched in GFP_L mutants and GFP_H mutants in GFP-op_positive mutants are shown. The full list of enriched genes is in Supplementary file 2A.
-
Figure 4—source data 1
Raw data of GFP expression analysis under GFP-op, tGFP-op, and NES-tGFP-op; associated with Figure 4—figure supplement 2A; Figure 4—figure supplement 2B; Figure 4C; Figure 4D; Figure 5—figure supplement 2; Figure 5E; Figure 6A.
- https://cdn.elifesciences.org/articles/54080/elife-54080-fig4-data1-v2.xlsx
Figure 4—figure supplement 1
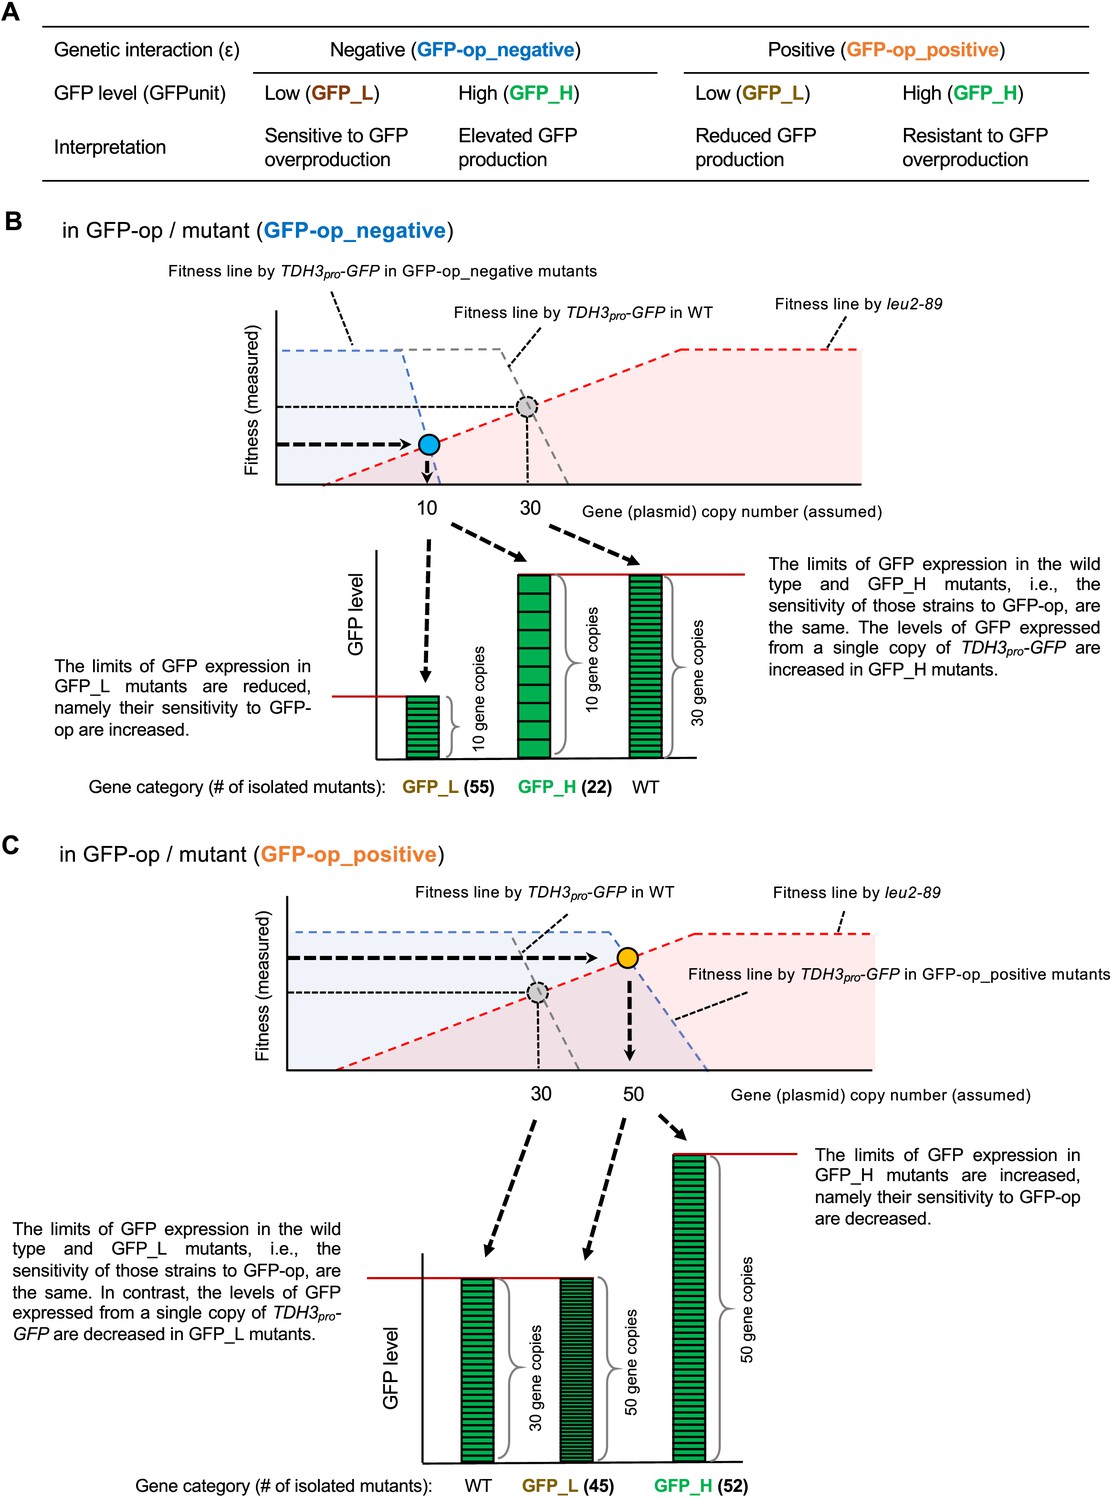
Isolation of mutants using GFP expression levels and a detailed explanation of the background principles.
(A) Background mechanisms that can be interpreted by separating the mutants using GFP expression levels (B) Isolation of GFP-op_negative mutants using GFP expression levels and its background principles. As shown in Figure 1—figure supplement 1C, the fitness line made by TDH3pro-GFP is shifted to the left in a GFP-op_negative mutant. In such a mutant, the elevated copy number of TDH3pro-GFP has a stronger negative effect than in the wild strain. There are two main reasons for this negative effect: one is because the mutant increases the amount of GFP synthesized from one copy of TDH3pro-GFP, and the other is because the mutant is sensitive to GFP overexpression. Suppose that in a certain GFP-op_negative mutant, the copy number of the plasmid is reduced to 10 due to a shift of the TDH3pro-GFP fitness line to the left. This is only a prediction from the reduced fitness, as we did not actually measure the copy number of the plasmid in each strain in this study. If the expression of GFP in the cells is lower than in the wild strain (i.e. GFP_L), then we can assume that the strain is sensitive to GFP overexpression and that the reduced fitness (and copy number) is due to the strain's sensitivity to GFP overexpression. Analysis of GFP-op yielded 55 such strains, which contained significantly more genes related to ‘cellular bud’ (Figure 4C). On the other hand, if the expression level of GFP is similar to or higher than that of the wild type (i.e. GFP_H), then the sensitivity to GFP overexpression is the same in these strains as in the wild type, but the amount of GFP synthesized from one copy of the TDH3pro-GFP gene is increased in these strains. Analysis of GFP-op has yielded 22 such strains (Figure 4C), but the biological functions enriched in those genes have not been identified. (C) Isolation of GFP-op_positive mutants using GFP expression levels and its background principles. As shown in Figure 1—figure supplement 1C, the fitness line made by TDH3pro-GFP is shifted to the right in a GFP-op_positive mutant. In such a mutant, the adverse effect of elevated TDH3pro-GFP copy number is weaker than in the wild type. There are two main reasons for this positive effect: one is because the mutant reduces the amount of GFP synthesized from one copy of TDH3pro-GFP, and the other is because the mutant is resistant to the excess of GFP. Suppose that in a certain GFP-op_negative mutant strain, the copy number of the plasmid is increased to 50 due to a shift of the TDH3pro-GFP fitness line to the right. This is only a prediction from the increase in fitness, as we did not actually measure the copy number of the plasmid in each strain in this study. At this time, if the expression of GFP is equal to or lower than that of the wild strain (i.e. GFP_L), we can assume that the response of the strain to GFP overexpression is the same as that of the wild strain, but the amount of GFP synthesized from one copy of the TDH3pro-GFP gene is reduced. Analysis of GFP-op yielded 45 such strains, which contained significantly more genes related to basic transcription (Figure 4D). Mutations in these genes would weaken the transcription of GFP from TDH3pro-GFP. On the other hand, if the expression of GFP is higher than in the wild type (i.e., GFP_H), we can assume that the strain is resistant to GFP overexpression. Experiments with GFP-op yielded 52 such strains (Figure 4D), and three mutants of components of the DASH complex have this property.
Figure 4—figure supplement 2
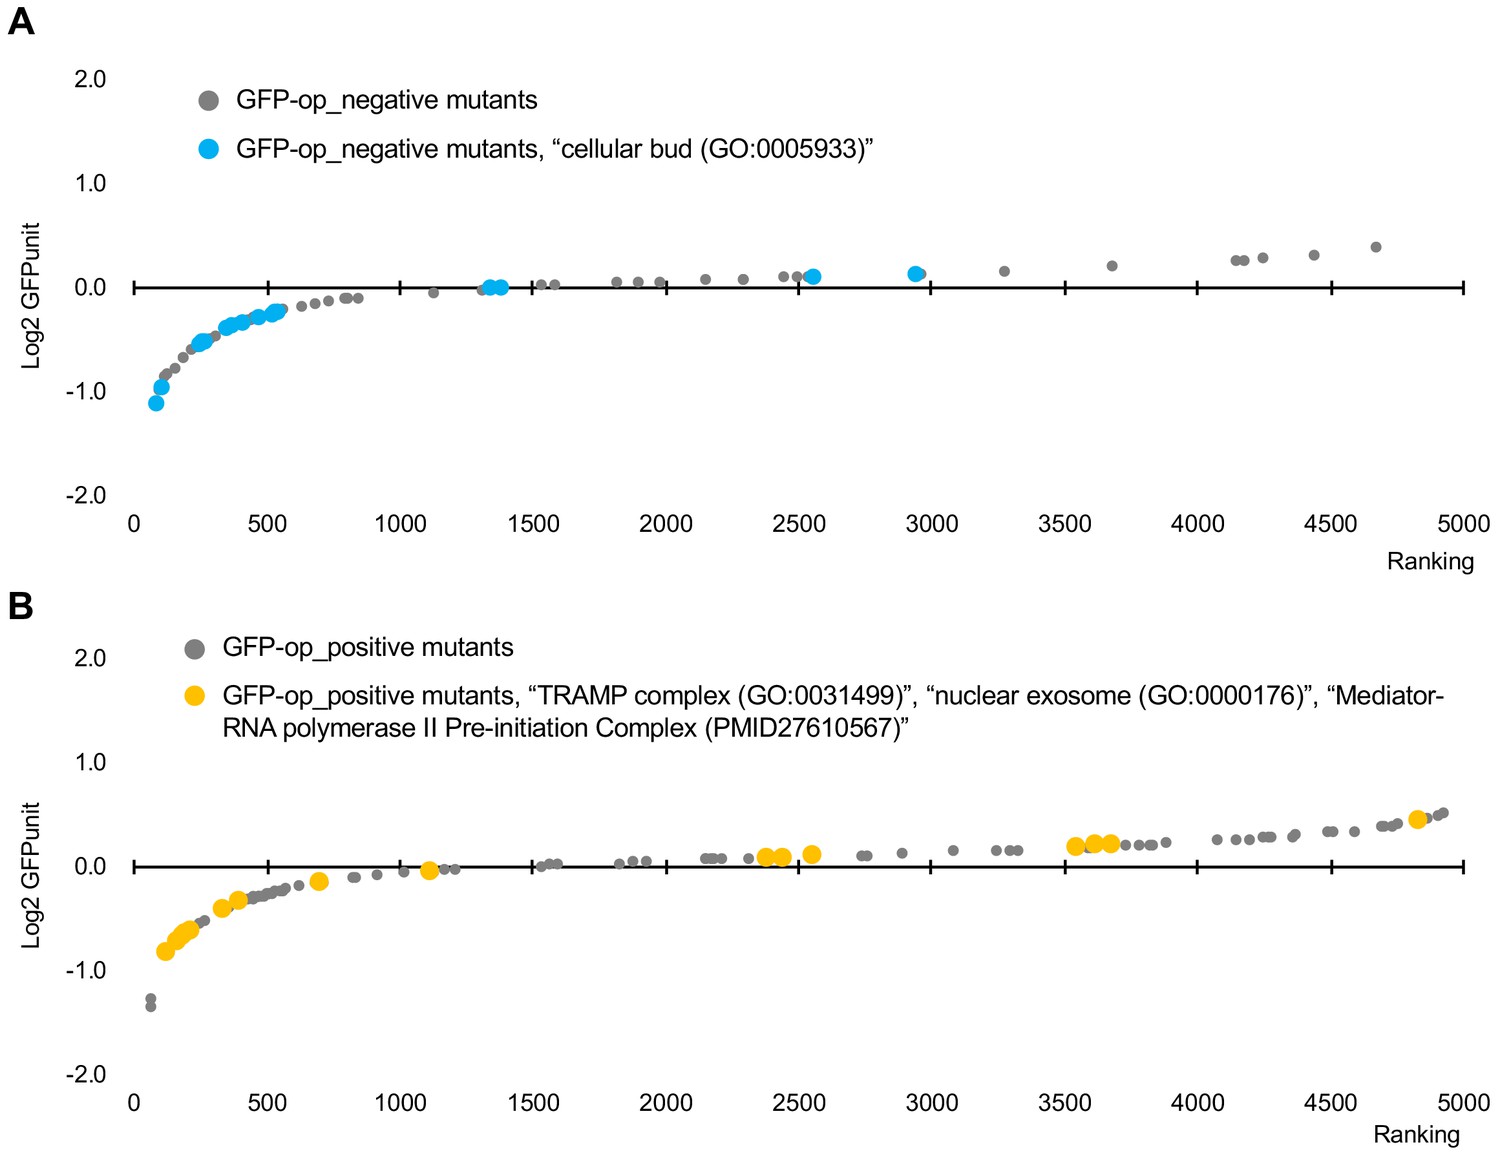
Distribution of GFPunits of mutants in specific GOs among mutants with GI with GFP-op.
(A) GFPunits of mutants in annotated to the GO term ‘cellular bud (GO:0005933)’ among GFP-op_negative mutants. (B) GFPunits of mutants annotated to the GO terms 'TRAMP complex (GO:0031499)', 'nuclear exosome (GO:0000176)', and ‘mediator-RNA polymerase II preinitiation complex (PMID27610567)’ among GFP-op_positive mutants.
Figure 4—figure supplement 3
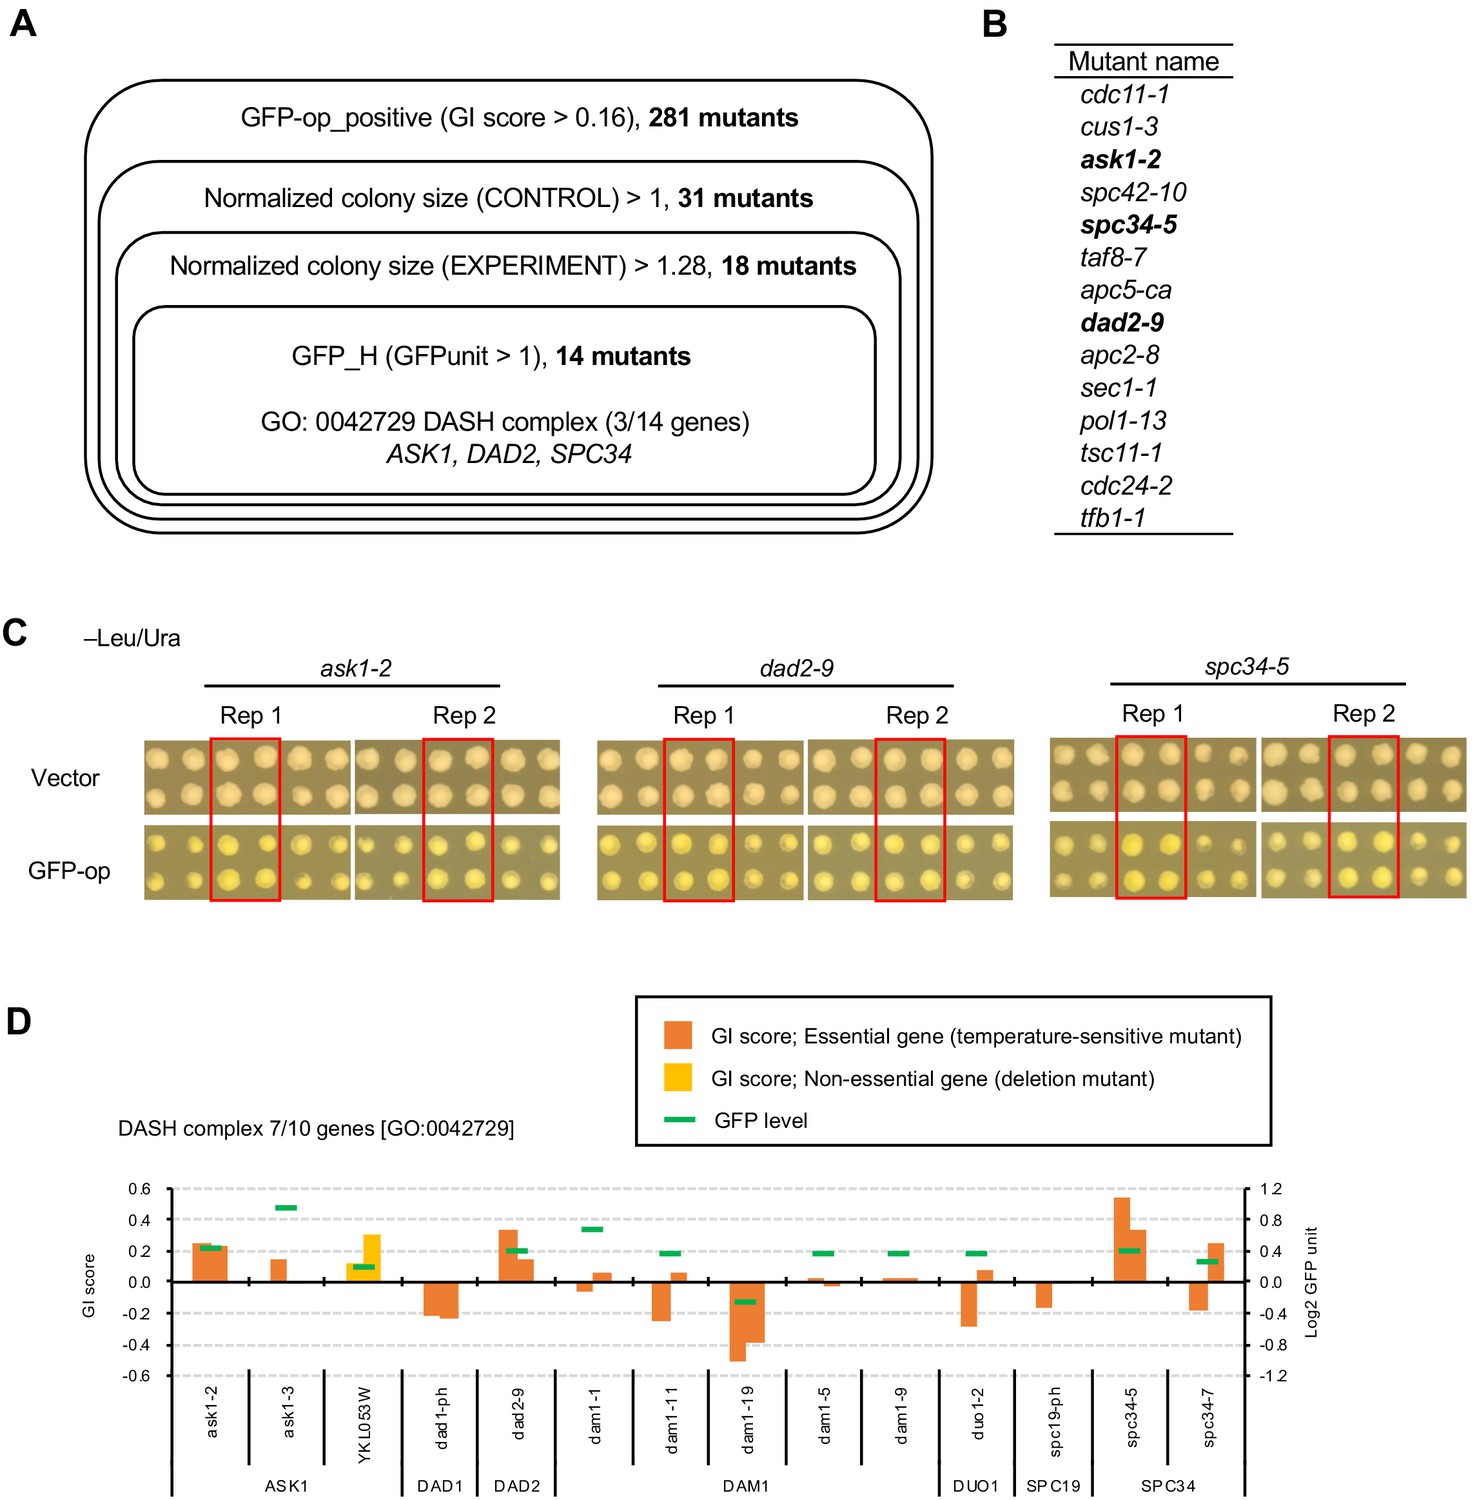
Mutants of the DASH complex obtained as GFPop_positive increase the expression of GFP.
(A) Obtaining mutants in which GFP overexpression pontentially enhances the growth advantage generated by the mutation. The genes in each shown category were isolated, and finally 14 mutants were isolated. The criteria for this isolation were: positive interaction with GFP-op (GFPop_positive), colony size of the mutants in the vector control was greater than the median of all other colonies (Normalized colony size (CONTROL) > 1), colony size of the mutants in GFP-op was greater than the median of all colonies from the vector control (Normalized colony size (EXPERIMENT) >1.28), and the expression of GFP was higher than the median of all other colonies (GFPunit >1). The threshold for mutant colony size was set as a larger colony size than the vector control when corrected for the expected growth inhibition caused by GFP-op at 0.78 (calculated from Figure 1D). Enrichment analysis of the 14 genes revealed significantly more components of the DASH complex [GO: 0042729]. The full list of enriched genes is in Supplementary file 3. (B) List of 14 mutants isolated. These were all temperature-sensitive mutations. The mutants of components of the DASH complex are shown in bold letters. (C) Colony size (raw data) of thress DASH complex mutants obtained from the analysis in A. Images of the Rep1 and Rep2 colonies in –Leu/Ura for each mutant are shown, along with images of the surrounding colonies. The red-squared area is the colonies of the corresponding mutant. (D) Genetic interaction scores and GFP expression levels of mutants in the DASH complex. Of the 10 genes in the DASH complex [GO:0042729], seven were analyzed in this study. YKL053W is encoded in the reverse strand of ASK1, and the deletion results in a partial deletion of ASK1. GI scores from experimental replicates under –Leu/Ura conditions are shown. Temperature-sensitive mutant of essential genes and deletion mutant of non-essential gene are shown in different colors. GFP levels for each strain are also shown.
Figure 5 with 2 supplements
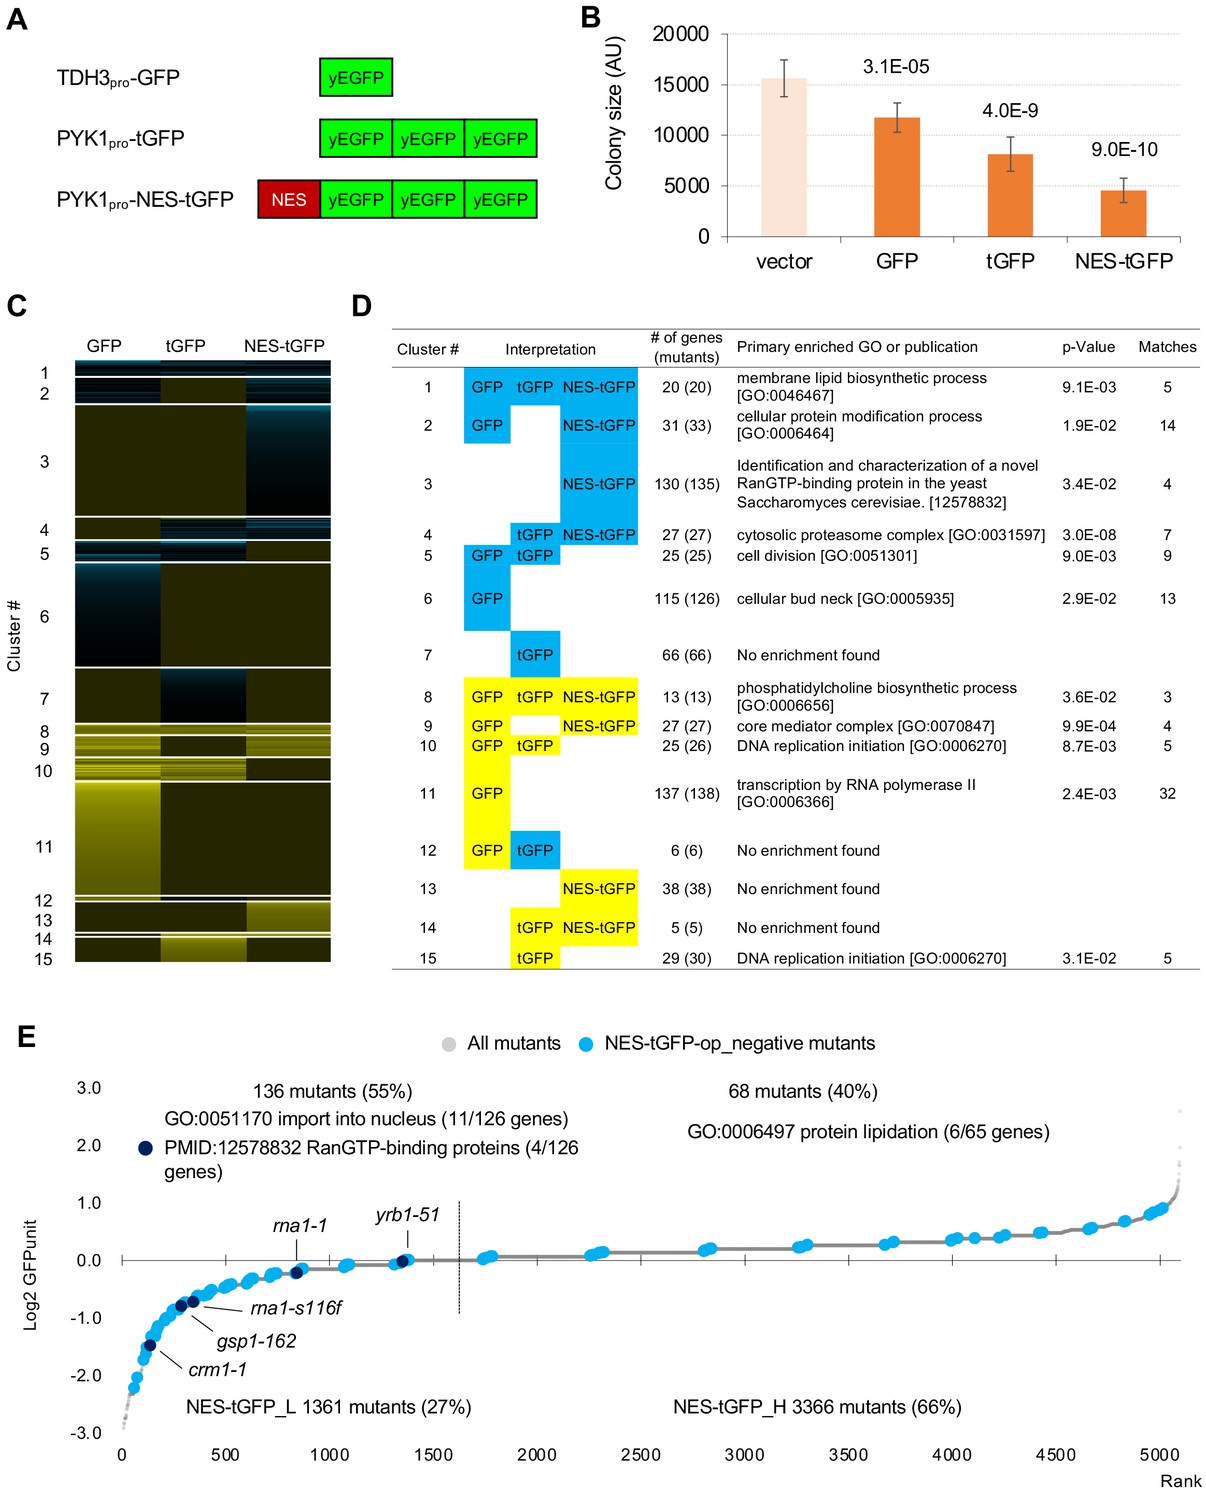
GFP-op harbor GIs with distinct sets of genes from those with tGFP-op and NES-tGFP-op.
(A) Structures and promoters used to overexpress GFP, tGFP, and NES-tGFP. Nucleotide sequences of the three GFPs in tGFP (and NES-tGFP) are different, other to avoid recombination. (B) Colony size of query strains with the vector control and overproduction plasmids. The size of colonies of each strain grown on –Leu/Ura agar medium was measured (n > 6). The Y7092 strain was used as the host. The average, standard deviation (error bar), and p-value of Student’s t-test are shown. (C and D) Clustering analysis of the mutants having GIs with GFP-op, tGFP-op, and NES-tGFP-op (C), and its characterization (D). Total 714 mutants (695 genes) with upper and lower threshold of ε 0.16 and –0.12 harboring GIs with either GFP-op, tGFP-op or NES-tGFP-op under –Leu/Ura conditions were used (Figure 5—source data 1). (E) GFPunits of NES-tGFP-op_negative mutants. Mutants with lower and higher GFPunits than the average are designated as NES-tGFP_L and NES-tGFP_H mutants, respectively. Representative GO terms enriched in GFP_L mutants in GFP-op_negative mutants are shown. Nuclear transport mutants obtained in Cluster 3 in D are also shown on the graph. The full list of enriched genes is in Supplementary file 2B.
-
Figure 5—source data 1
Isolated mutants with GFP, tGFP, and NES-tGFP SGA analysis, and the result of clustering analysis; associated with Figure 5C and D.
- https://cdn.elifesciences.org/articles/54080/elife-54080-fig5-data1-v2.xlsx
Figure 5—figure supplement 1
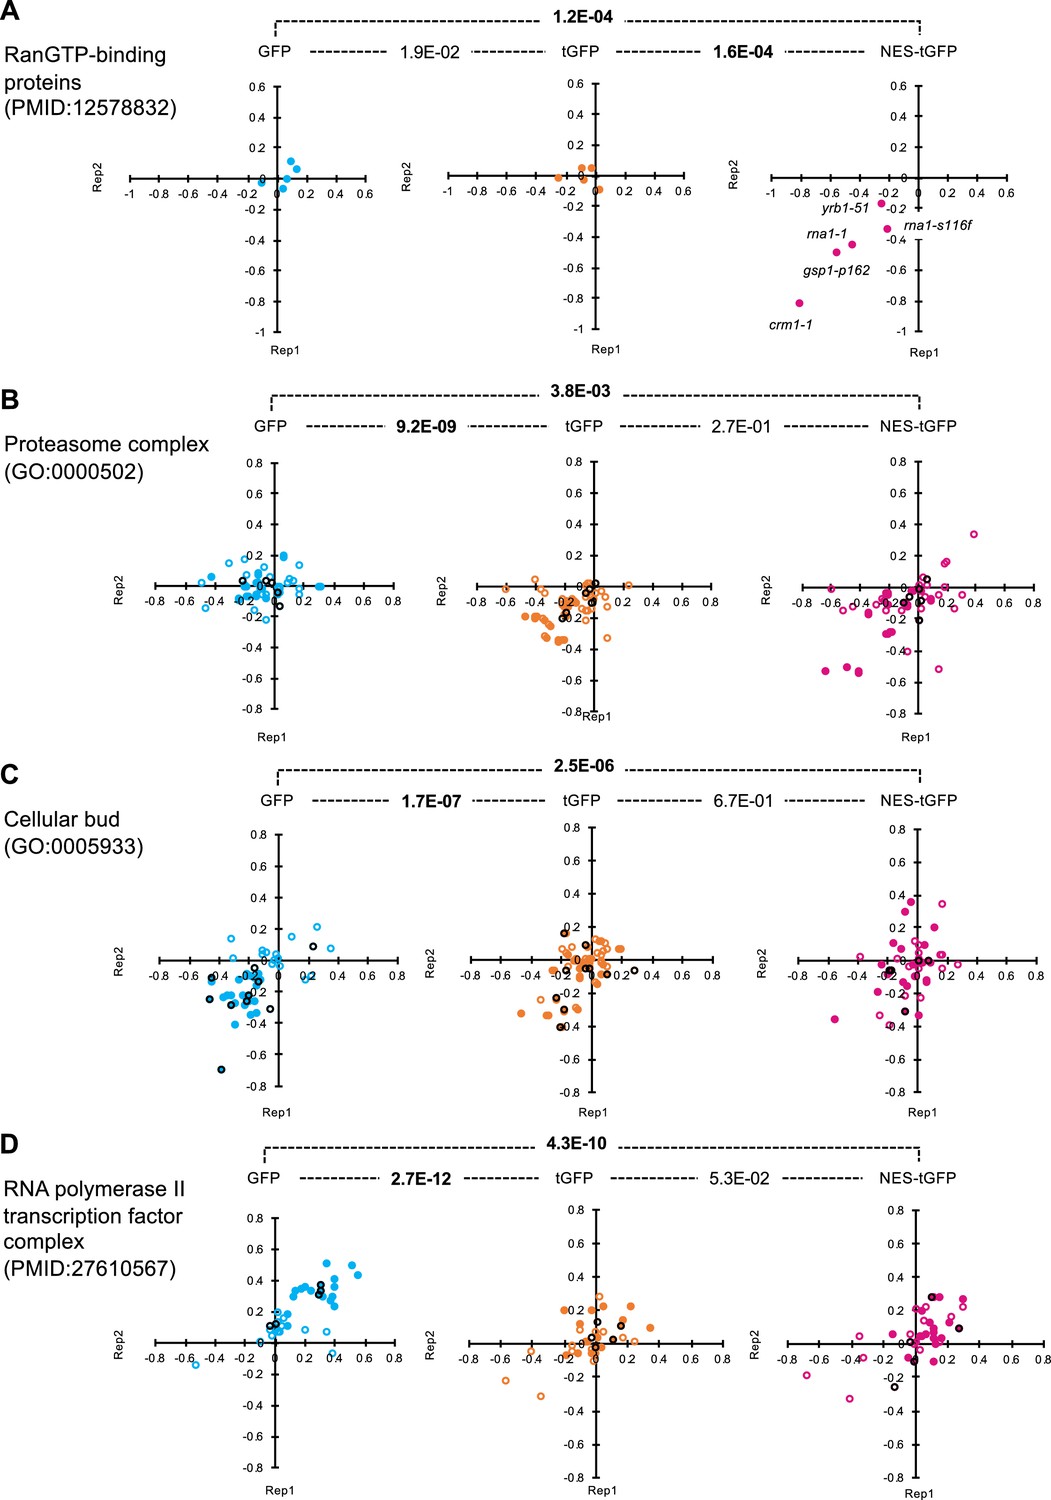
Distributions of GI scores of mutants in specific publications and GO.
GI scores of mutants in the indicated publications (A and D) and GO terms (B and C) from the duplicated experiments on GFP-op, tGFP-op, and NES-tGFP are shown as scatter plots. All circles represent the analyzed mutants in the indicated categories, and the filled circles represent those with GI scores below or above the thresholds in any of the three experiments. Black circles indicate deletion mutans of non-essential genes, and other-colored circles indicate temperature-sensitive mutans of essential genes. The p-values of pair-wise t-test between experiments are shown. Bold letters indicate significant p-values (p<0.001).
-
Figure 5—figure supplement 1—source data 1
Raw data of tGFP-op SGA analysis; associated with Figure 5—figure supplement 1A–D.
- https://cdn.elifesciences.org/articles/54080/elife-54080-fig5-figsupp1-data1-v2.xlsx
-
Figure 5—figure supplement 1—source data 2
Raw data of NES-tGFP-op SGA analysis; associated with Figure 5—figure supplement 1A–D.
- https://cdn.elifesciences.org/articles/54080/elife-54080-fig5-figsupp1-data2-v2.xlsx
Figure 5—figure supplement 2
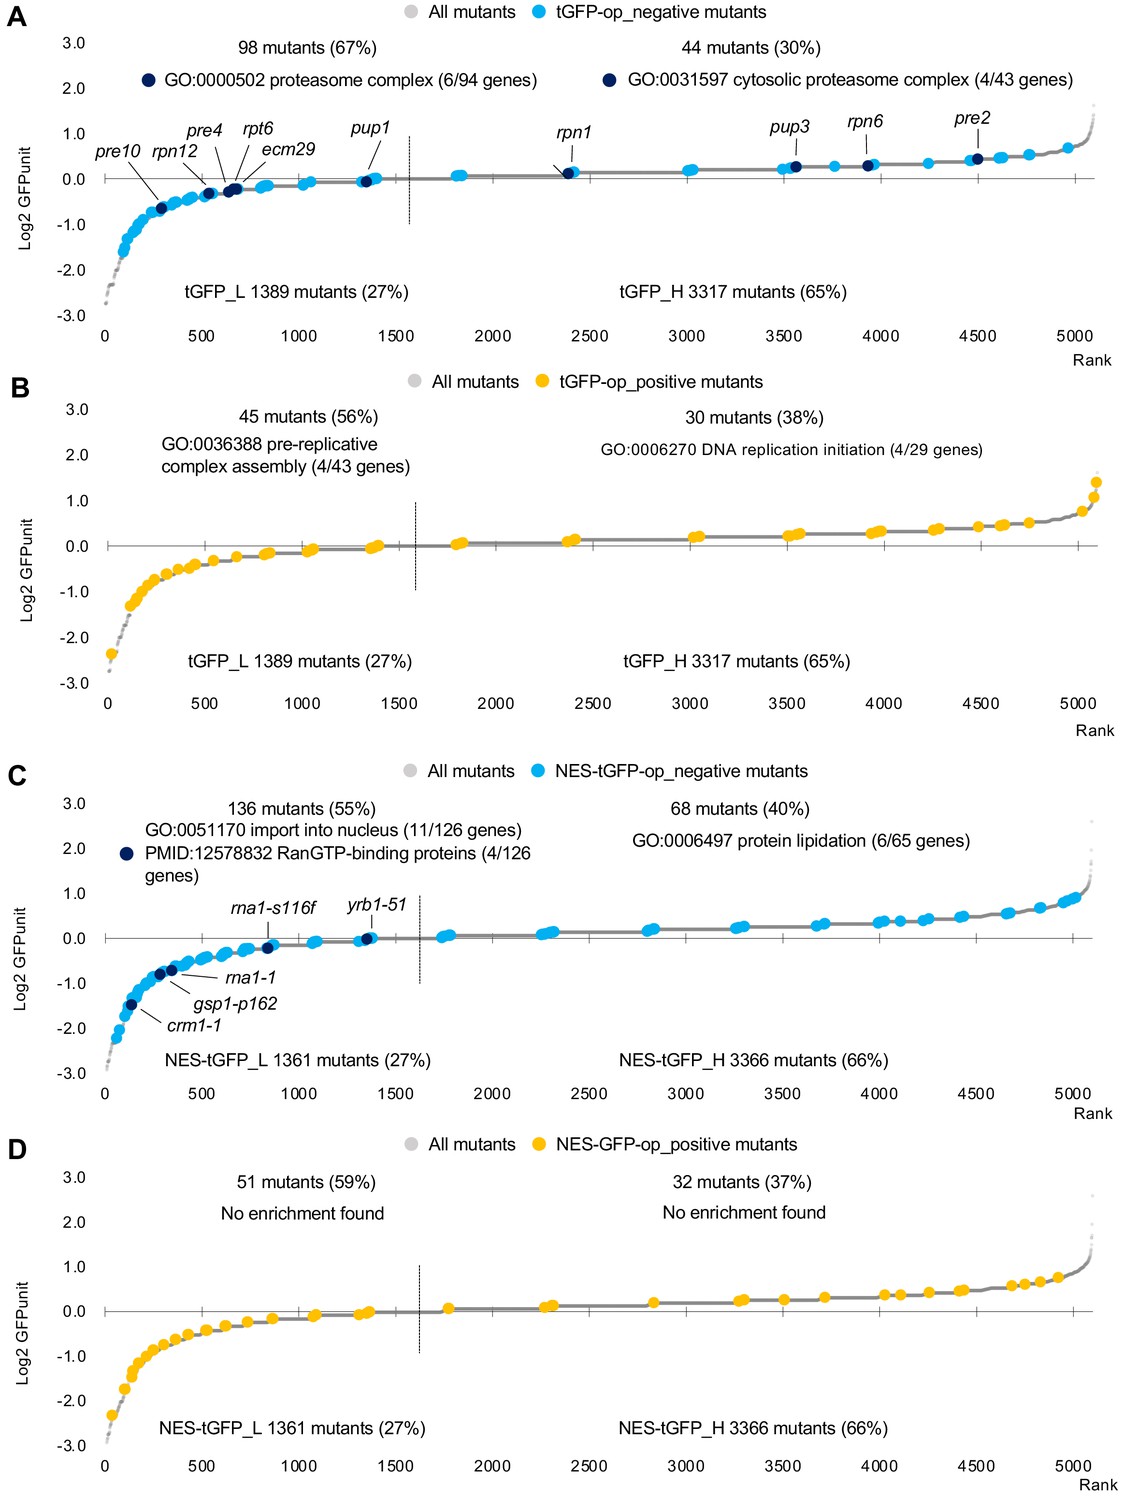
GFPunits of mutants overproducing tGFP and NES-tGFP.
(A) GFPunits of tGFP-op_negative mutants. Proteasome mutants (excluding allele names) are also shown on the graph. (B) GFPunits of tGFP-op_positive mutants. Mutants with lower and higher GFPunits than the average are designated as tGFP_L and tGFP_H mutants, respectively. Representative GO terms enriched in tGFP_L and tGFP_H mutants are shown. The full list of enriched genes is in Supplementary file 2C. (C) GFPunits of NES-tGFP-op_negative mutants. Nuclear transport mutants obtained in Cluster 3 in D are also shown on the graph. (D) GFPunits of NES-tGFP-op_positive mutants. Mutants with lower and higher GFPunits than the average are designated as NES-tGFP_L and NES-tGFP_H mutants, respectively. Representative GO terms enriched in NES-tGFP_L amd NES-tGFP_H mutants are shown. The full list of enriched genes is in Supplementary file 2B.
Figure 6 with 1 supplement
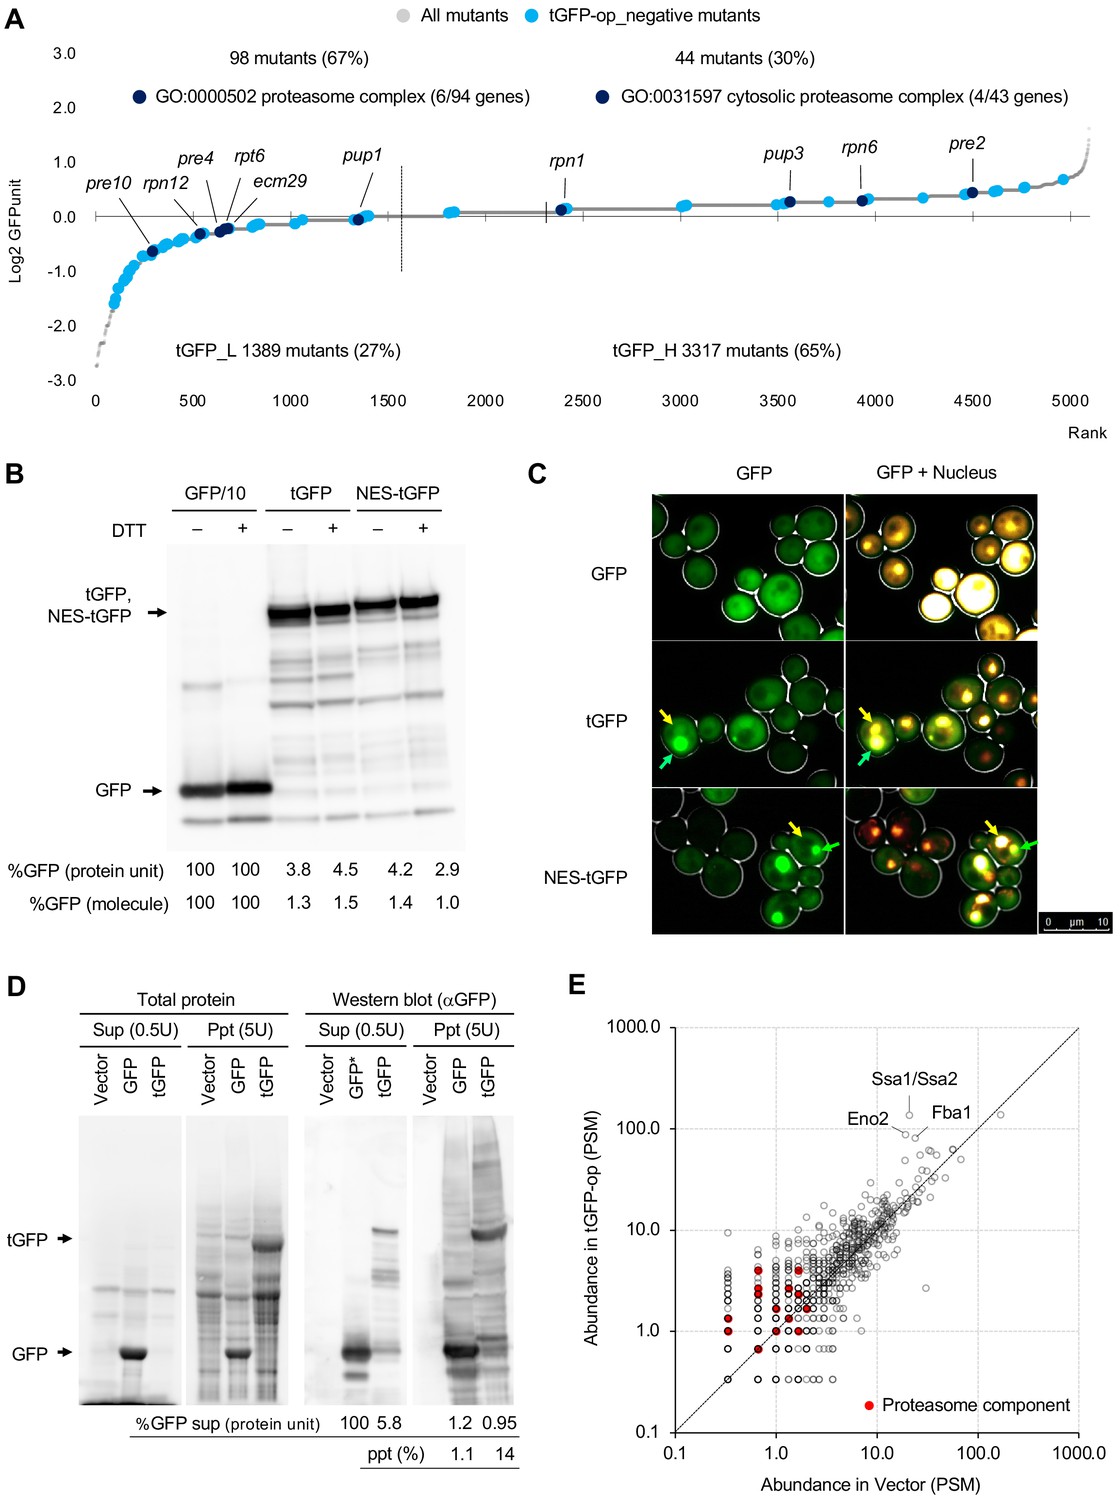
Overexpression of triple GFP causes the formation of intracellular condensates, which in turn may overload the proteasome.
(A) GFPunits of tGFP-op_negative mutants. Mutants with lower and higher GFPunits than the average are designated as tGFP_L and tGFP_H mutants, respectively. Representative GO terms enriched in GFP_L mutants in GFP-op_negative mutants are shown. Proteasome mutants (excluding allele names) are also shown on the graph. The full list of enriched genes is in Supplementary file 2C. (B) Quantification of expression limits of GFP, tGFP, and NES-tGFP. Western blot analysis of total protein from GFP-op (1/10 diluted), tGFP-op, and NES-tGFP cells cultured in SC–Ura medium. Relative GFP levels (protein units) were calculated by measuring the intensities of bands corresponding to the molecular weight of each protein (arrowheads). Note that molar concentration GFP should be divided by three in the case of tGFP and NES-tGFP because they have three times more epitopes for the antibody than GFP. (C) Microscope images of cells overexpressing GFP, tGFP, and NES-tGFP. The nucleus was observed using Hoechst 33342 staining. Representative cells with intracellular condensates are indicated by green arrowheads (condensates with GFP fluorescence) and yellow arrowheads (nucleus). (D) Analysis of GFP and tGFP aggregation. Extracts of yeast grown in SC–Leu/Ura medium were centrifuged, fractionated into supernatant (Sup) and precipitate (Ppt), and separated by SDS-PAGE. Electrophoretic images of all proteins and western blots with anti-GFP antibodies are shown. The molecular weights corresponding to GFP and tGFP are indicated by arrows. The amounts of GFP and tGFP detected in the supernatant and precipitation are shown with GFP in the supernatant as 100. The percentages of precipitation to the total are also shown. (E) Detection of proteins in precipitation fractions. Proteins in the precipitated fractions of the vector control and tGFP-op cells were detected by LC-MS/MS and their amounts were compared by peptide-spectrum match (PSM). Three proteins that were particularly abundant in the precipitation fractions of tGFP-op cells were indicated on the plot. The components of the proteasome (Ppn, Prt, and Pre proteins) are shown by red circles. The average values of three LC-MS/MS measurements are shown. The raw data are shown in Figure 6—source data 1.
-
Figure 6—source data 1
Raw data of the LC-MS/MS analysis of proteins in the precipitation fractions of the vector control and tGFP-op cells; associated with Figure 6E.
- https://cdn.elifesciences.org/articles/54080/elife-54080-fig6-data1-v2.xlsx
Figure 6—figure supplement 1

Growth inhibition by tGFP-op, and biochemical analysis of overexpressed tGFP.
(A) Maximum growth rates of cells harboring overproduction plasmids. The average, standard deviation, and p-value of Student’s t-test for the growth rates of cells with the vector and overproduction plasmids from four independent experiments are shown. Cells were grown in synthetic complete (SC) –Ura medium. (B) Fluorescence microscopy images of supernatants (Sup) and precipitated (Ppt) fractions from GFP and tGFP-overexpressing cell lysate. Microscopic images were acquired at the same magnification and exposure time. The images are superimposed on the bright field and fluorescent images. (C) Analysis of GFP and tGFP ubiquitination. Extracts of yeast grown in SC–Leu/Ura medium were centrifuged, fractionated into supernatant (Sup) and precipitate (Ppt), and separated by SDS-PAGE. Western blots with anti-ubiquitin antibodies are shown. The molecular weights corresponding to GFP and tGFP are indicated by arrows.
Figure 7 with 1 supplement

Morphological analysis of the cells overexpressing gratuitous proteins, and models explaining the consequence of overexpression.
(A–D) Morphological parameters significantly different all in the cells overexpressing GFPy66g, Gpm1, and Gpm1-m cells over the cells with the vector control. *: FDR = 0.01 by Wald test. To overexpress GFPy66g, Gpm1, and Gpm1-m, pTOW40836-TDH3pro-GFPy66g, pTOW40836-TDH3pro-Gpm1, and pTOW40836-TDH3pro-Gpm1-m were used. (E) Interpretation of the morphology of GFP-op cells according to the morphological parameters significantly different from the vector control. (F) Dissection of the consequence of protein overproduction by the expression limits. Only otherwise harmless protein could cause the protein burden, which is associated with the perturbation of actin function. (G) A ‘barrel model’ to explain the relationship between the capacity of intracellular processes and the limits of protein synthesis. An explanation of this model is described in Discussion.
-
Figure 7—source data 1
Whole dataset of morphological phenotyping of overexpressing strains; associated with Figure 7A–D.
- https://cdn.elifesciences.org/articles/54080/elife-54080-fig7-data1-v2.xlsx
Figure 7—figure supplement 1
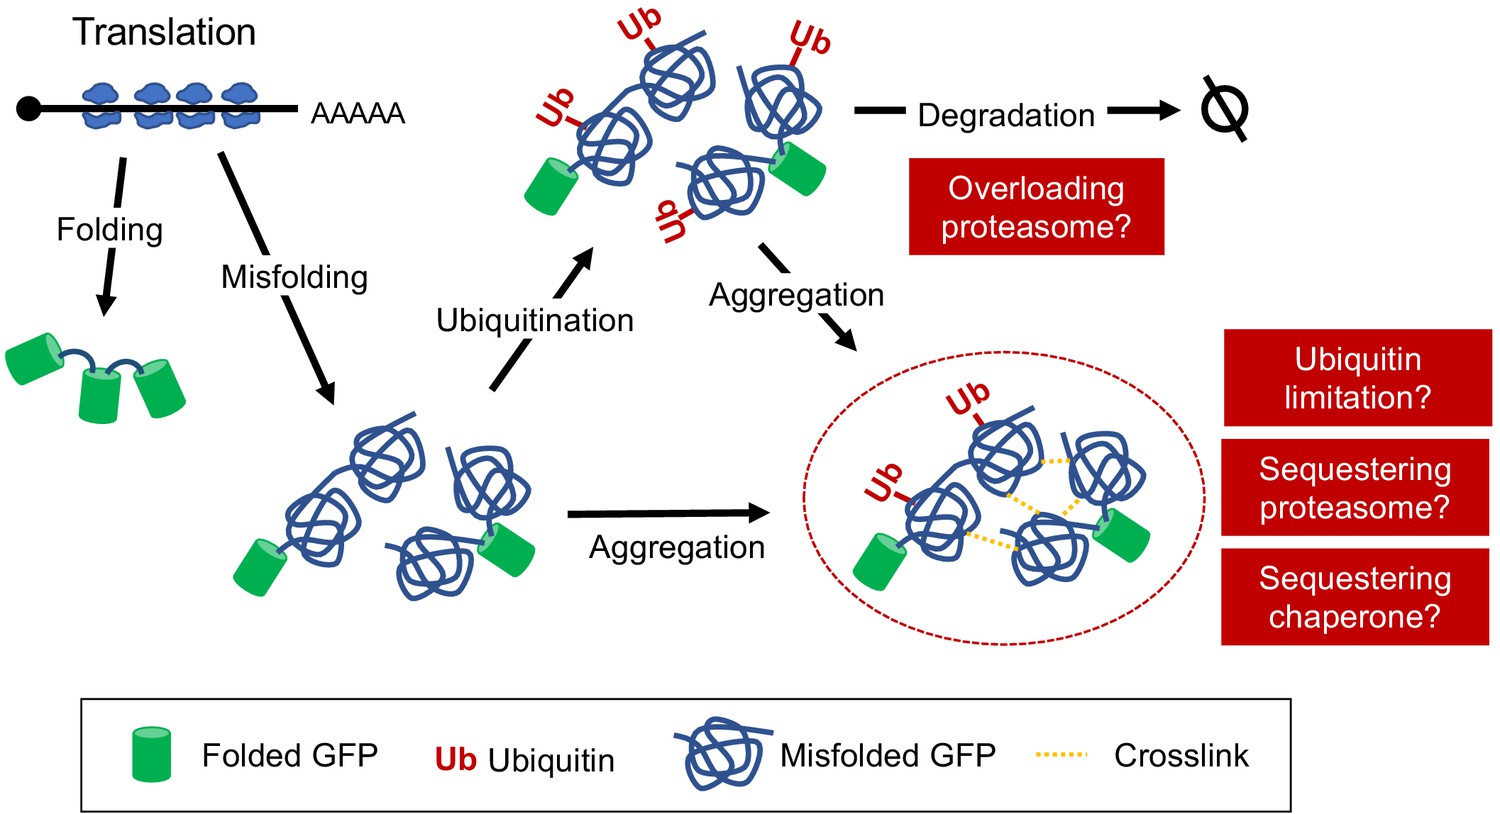
A hypothetical model of the effects caused by tGFP-op.
Detailed description of the model is provided in Discussion.
Additional files
-
Supplementary file 1
Enrichment analysis of genes isolated in GFPop SGA analysis; associated with Figure 2D.
- https://cdn.elifesciences.org/articles/54080/elife-54080-supp1-v2.xlsx
-
Supplementary file 2
Enrichment analysis of genes isolated by GFP expression level; associated with Figure 4—figure supplement 2A; Figure 4—figure supplement 2B; Figure 4C; Figure 4D; Figure 5—figure supplement 2; Figure 5E; Figure 6—figure supplement 1.A.
- https://cdn.elifesciences.org/articles/54080/elife-54080-supp2-v2.xlsx
-
Supplementary file 3
Enrichment analysis of genes isolated as 14 mutants in Figure 4—figure supplement 3A.
- https://cdn.elifesciences.org/articles/54080/elife-54080-supp3-v2.xlsx
-
Supplementary file 4
Enrichment analysis of genes in each cluster in Figure 5C and D.
- https://cdn.elifesciences.org/articles/54080/elife-54080-supp4-v2.xlsx
-
Transparent reporting form
- https://cdn.elifesciences.org/articles/54080/elife-54080-transrepform-v2.docx
Download links
A two-part list of links to download the article, or parts of the article, in various formats.
Downloads (link to download the article as PDF)
Open citations (links to open the citations from this article in various online reference manager services)
Cite this article (links to download the citations from this article in formats compatible with various reference manager tools)
Genetic profiling of protein burden and nuclear export overload
eLife 9:e54080.
https://doi.org/10.7554/eLife.54080


