Bmal1 integrates mitochondrial metabolism and macrophage activation
- Department of Molecular Metabolism, Division of Biological Sciences, Harvard TH Chan School of Public Health, United States
- School of Pharmacy, Tongji Medical College, Huazhong University of Science and Technology, China
- Institute of Molecular Biology, Academia Sinica, China
Figures
Figure 1 with 1 supplement

Macrophage Bmal1 is induced by M1 activation.
(A–C) Bmal1 protein levels (top) and relative gene expression determined by qPCR (bottom) in bone-marrow-derived macrophages (BMDM) during a 24-hr time course of M1 activation (10 ng/ml Ifn-γ overnight priming + 10 ng/ml LPS) (A), treatment with LPS alone (100 ng/ml) (B), or acute LPS treatment for 1 hr (100 ng/mL) (C). For M1- and LPS-only treatments, LPS was spiked in at time zero without medium change. For acute LPS treatment, cells were grown with LPS for one hour followed by culture in DMEM, 2% FBS without LPS (time zero indicates medium change). N = 3 biological replicates were used for qPCR. (D) Relative expression of circadian clock and inflammatory transcriptional regulators in M1-activated macrophages, as determined by qPCR. N = 3 biological replicates, statistical analysis performed using two-way ANOVA for WT vs M-BKO across the time course. Data are presented as mean ± S.E.M. *, p<0.05. Experiments were repeated at least twice.
Figure 1—figure supplement 1
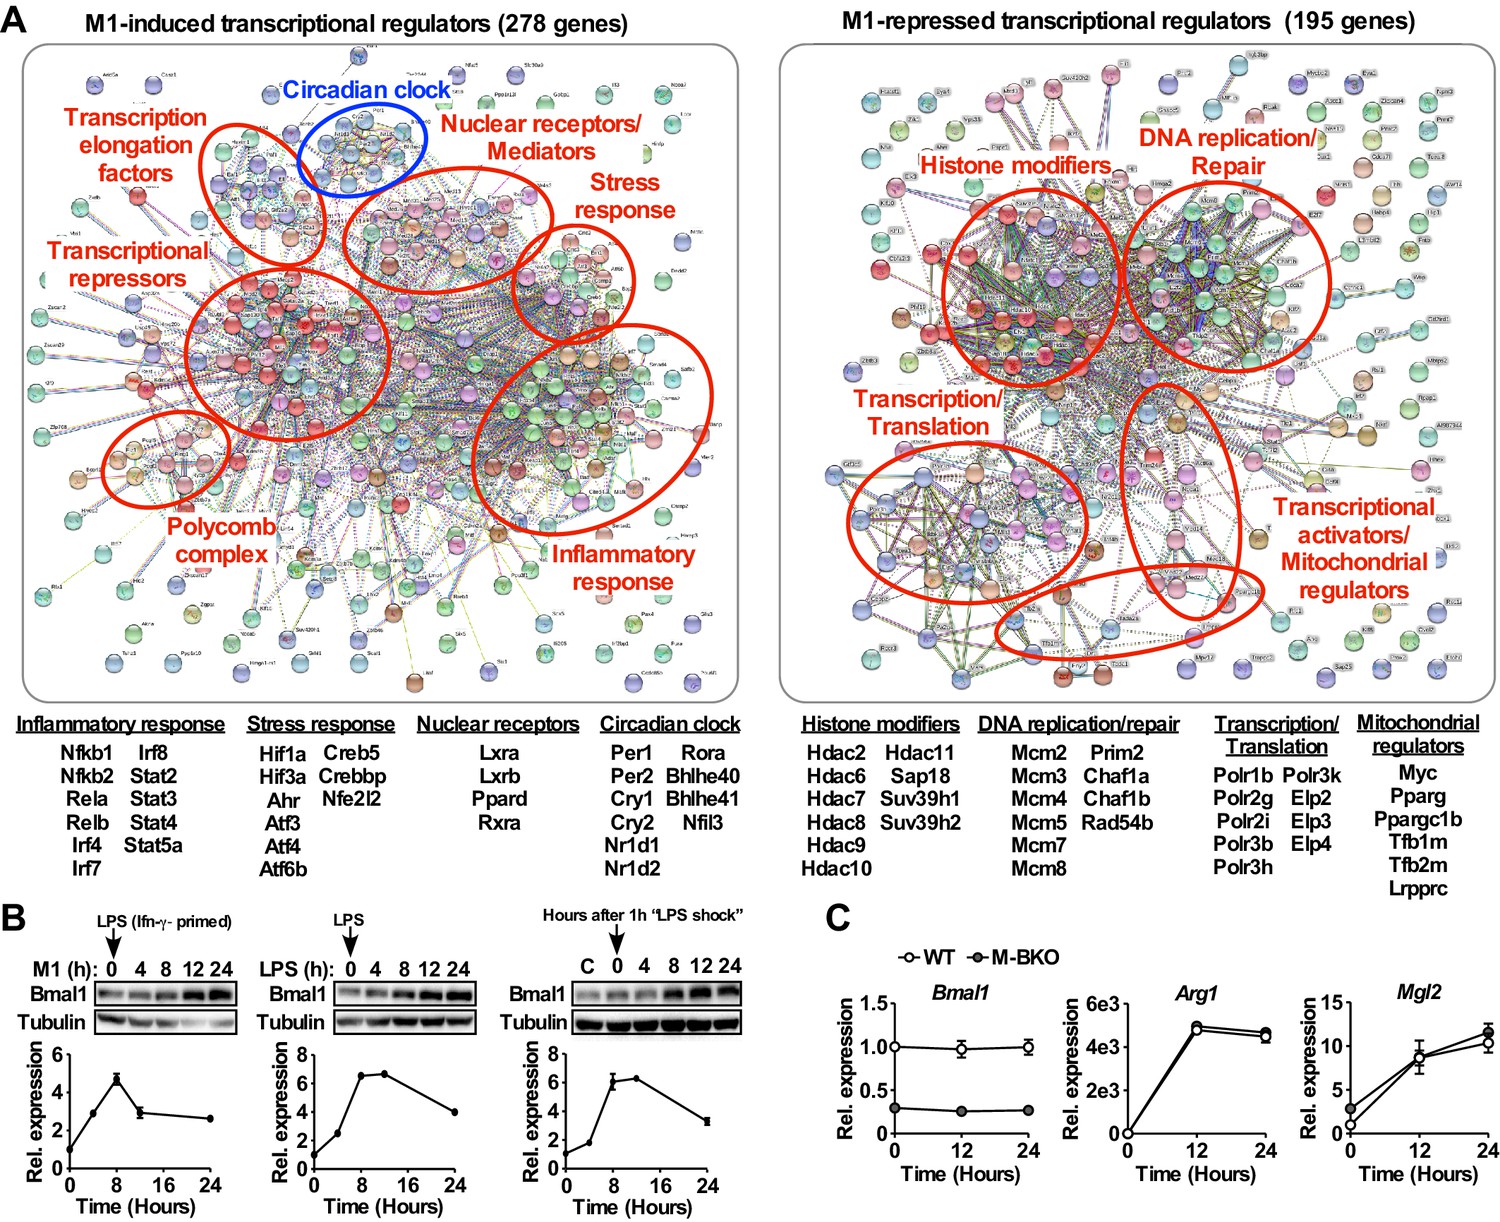
The circadian clock is a transcriptional module that is induced by M1 activation.
(A) Annotated protein–protein interaction maps generated by STRING of transcriptional regulators that were significantly induced (left) or repressed (right) in WT macrophages by 8 hours M1 activation (Ifn-γ priming followed by stimulation with 10 ng/mL LPS) compared to time-matched controls (Ifn-γ priming without LPS), determined by RNA-seq (p<0.05, FDR <0.05, |F.C.|>1.5). N = 3 biological replicates. F.C., fold change. See Table 1 for the complete gene list. (B) Bmal1 protein levels (top panels) and relative gene expression determined by qPCR (bottom panels) in mouse embryonic fibroblasts during a 24-hr time course of M1 activation (10 ng/ml Ifn-γ overnight priming + 10 ng/ml LPS, left panels), treatment with LPS only (100 ng/ml, middle panels), or 1 hr acute LPS treatment (100 ng/mL, right panels). For M1- and LPS-only treatments, LPS was spiked in at time zero without medium change. For acute LPS treatment, cells were grown with LPS for one hour followed by culture in DMEM, 2% FBS without LPS (time zero indicates medium change). N = 3 biological replicates for qPCR. (C) Gene expression during a 24-hr time course of Il-4 treatment in WT and M-BKO macrophages determined by qPCR. N = 3 biological replicates. Data are presented as mean ± S.E.M. *, p<0.05. Cell culture experiments were repeated at least twice.
Figure 2 with 1 supplement

Bmal1 is required to maintain mitochondrial metabolism.
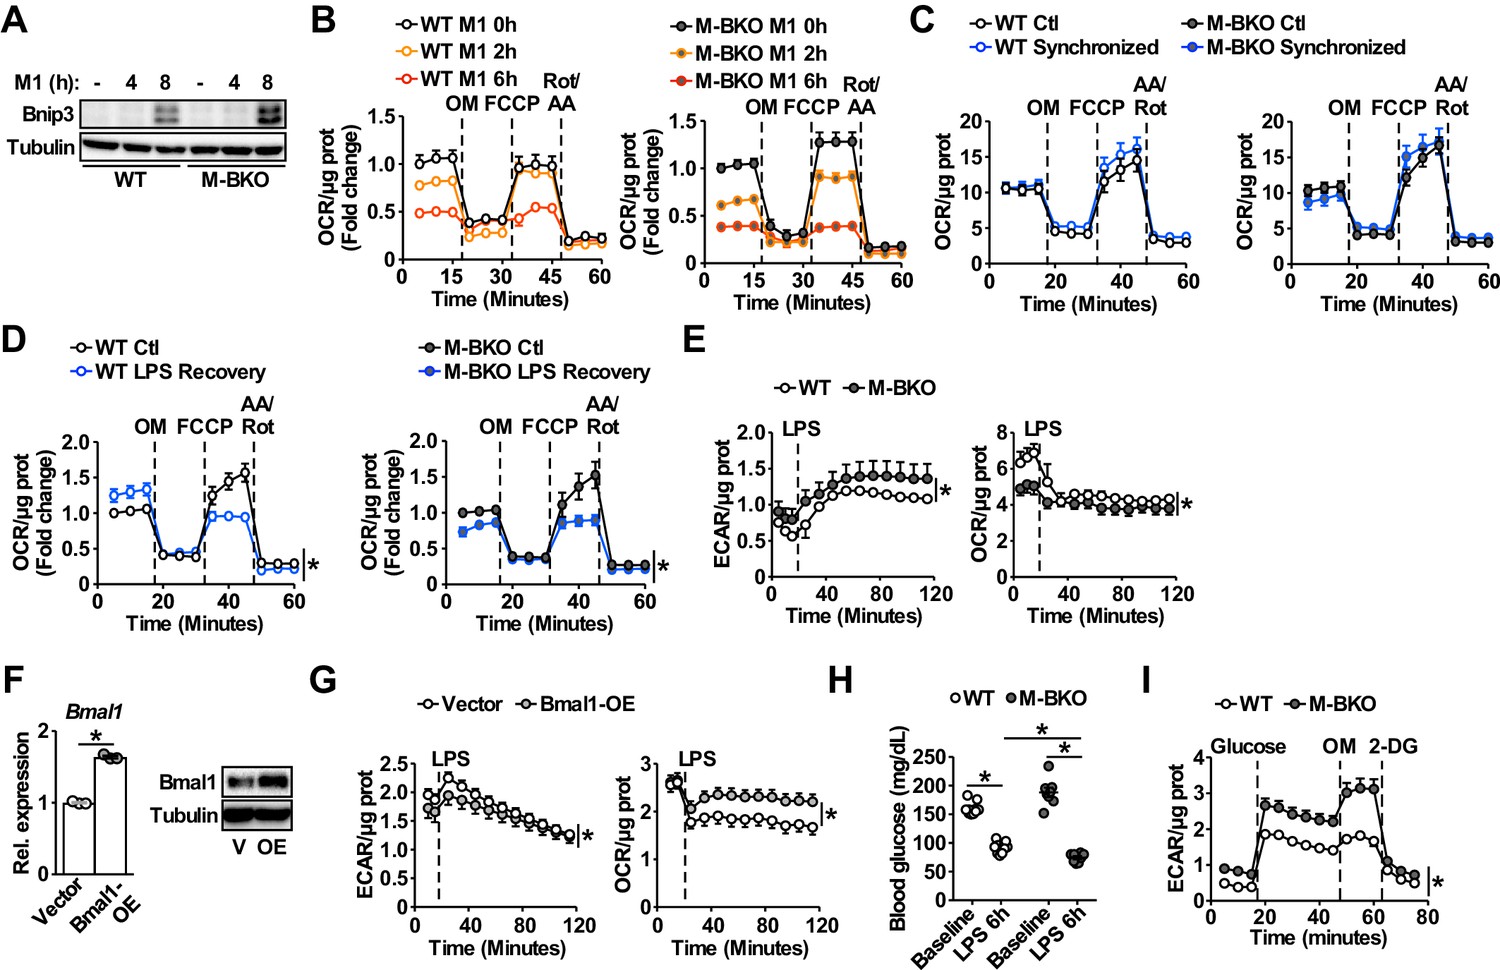
(A) Assessment of mitochondrial mass in macrophages throughout a time course of M1 activation using Mitotracker Green (mean fluorescence intensity, MFI) determined by flow cytometry. N = 3 biological replicates, statistical analysis was performed using two-way ANOVA for WT vs M-BKO across the time course. (B) Basal oxygen consumption rate (OCR) in Ifn-γ-primed macrophages pretreated without or with LPS (10 ng/mL) for 2 or 6 hr before the assay. See Figure 2—figure supplement 1B for the full assay results. The assay medium contained minimal DMEM with 5 mM glucose and 1 mM sodium pyruvate, pH 7.4. N = 5 biological replicates, statistical analysis was performed using two-way ANOVA for WT vs M-BKO across the time course. (C) Activities of ETC complexes in isolated mitochondria from WT and M-BKO macrophages after 6 hours M1 stimulation. N = 3 biological replicates, statistical analysis was performed using Student’s T test. (D) Extracellular flux analysis in Ifn-γ-primed macrophages measuring the changes in extracellular acidification rate (ECAR, left panel) and oxygen consumption rate (OCR, right panel) following LPS injection (100 ng/mL). The assay medium contained 5 mM glucose and 1 mM pyruvate in minimal DMEM with 2% dialyzed FBS, pH 7.4. N = 5 biological replicates, statistical analysis was performed using two-way ANOVA for WT vs M-BKO across the time course. (E) Glycolytic stress test in Ifn-γ-primed macrophages measuring ECAR following glucose (25 mM) injection, with or without LPS (100 ng/mL). Maximal glycolytic rate was determined by injection of oligomycin (OM, 2 μM), and glycolysis-dependent ECAR was determined by injection of 2-deoxyglucose (2-DG, 50 mM). The assay medium contained minimal DMEM with 2% dialyzed FBS, pH 7.4. N = 5 biological replicates, statistical analysis was performed using two-way ANOVA for WT vs M-BKO across the time course. Data are presented as mean ± S.E.M. *, p<0.05. Experiments were repeated at least twice.
Figure 2—figure supplement 1
Effects of Bmal1 gene deletion and overexpression on glycolytic versus oxidative metabolism.
(A) Immunoblot of the mitophagy regulator Bnip3 in M1-activated WT and M-BKO BMDMs. (B) Mitostress test measuring oxygen consumption rate (OCR) in Ifn-γ-primed macrophages pretreated without or with LPS (10 ng/mL) for 2 or 6 hr before the assay. Following three measurements of basal respiration, sequential injections of oligomycin (OM, 2 μM), carbonyl cyanide-4-phenylhydrazone (FCCP, 0.5, μM) and rotenone and antimycin A (rot/AA, 1 μM) were carried out to determine uncoupled respiration, spare respiratory capacity, and non-mitochondrial respiration, respectively. The assay medium contained minimal DMEM with 5 mM glucose and 1 mM sodium pyruvate, pH 7.4. N = 5 biological replicates. (C) Mitostress test measuring OCR in macrophages without (control, Ctl) or with serum shock resulting from treatment with 50% FBS for 2 hr to synchronize the circadian clock (Synchronized). Cells were recovered in fresh growth medium containing 10% FBS and the assay was performed 16 hr after the serum shock treatment. N = 5 biological replicates. (D) Mitostress test measuring OCR in macrophages without or with acute LPS treatment. Cells were cultured in growth medium with 2% FBS without (Ctl) or with 100 ng/mL LPS for 2 hr (LPS recovery), followed by recovery in fresh growth medium with 2% FBS for 24 hr prior to the assay. N = 5 biological replicates, statistical analysis was performed using two-way ANOVA for Ctl vs LPS recovery across the time course. (E) Extracellular flux analysis of thioglycollate-elicited peritoneal macrophages measuring the changes in ECAR (left panel) and OCR (right panel) following LPS injection (final concentration 1 μg/mL). The assay medium contained 5 mM glucose and 1 mM pyruvate in minimal DMEM with 2% dialyzed FBS, pH 7.4. N = 5 biological replicates, statistical analysis was performed using two-way ANOVA for WT vs M-BKO across the time course. (F) Bmal1 mRNA expression determined by qPCR (left) and protein levels (right) in RAW264.7 macrophage stable lines. Bmal1-OE, Bmal1 overexpressing stable line. Cells that were transduced with empty vector were used as the control. N = 3 biological replicates for qPCR, statistical analysis was performed using Student’s T test. V, vector control; OE, Bmal1 overexpression. (G) Measurement of the changes in ECAR (left) and OCR (right) in Ifn-γ-primed RAW264.7 stable lines after injection with LPS (final concentration 100 ng/mL). The assay medium contained 25 mM glucose and 1 mM pyruvate in minimal DMEM with 2% dialyzed FBS, pH 7.4. N = 5 biological replicates, statistical analysis was performed using two-way ANOVA for control vs Bmal1 OE across the time course. (H) Blood glucose levels in 4-month-old WT and M-BKO male mice before and 6 hr after i.p. injection with 10 μg LPS per g body weight. N = 10 mice, statistical analysis was performed using Student’s T test. (I) Glycolytic stress test in splenic macrophages isolated from mice in panel (D) that were sacrificed 6 hr after LPS injection. ECAR was measured before and after injection with glucose (25 mM). Maximal glycolytic rate was determined by injection of oligomycin (OM, 2 μM). Glycolysis-dependent ECAR was determined by injection of 2-deoxyglucose (2-DG, 50 mM). The assay medium contained minimal DMEM, pH 7.4. N = 10 biological replicates, statistical analysis was performed using two-way ANOVA for WT vs M-BKO across the time course. Data are presented as mean ± S.E.M. *, p<0.05. Experiments were repeated at least twice.
Figure 3

Bmal1 deletion induces a metabolic shift for glycolytic and amino-acid metabolism.
(A) Summary of steady-state metabolomics data for differentially regulated metabolites from WT and M-BKO macrophages throughout a 12-hour M1 activation time course. Data are presented as heat maps (normalized to WT control for each metabolite, each panel is the average of four biological replicates). Statistical analysis was performed using two-way ANOVA for WT vs M-BKO across the time course. (B) Box plots of the relative abundances of select metabolites in panel (A). (C, D) Uptake of [3H]−2-deoxyglucose (C) and lactate secretion (D) in control or M1-activated macrophages. N = 3 biological replicates, statistical analysis was performed using Student’s T test. Cell culture assays were repeated at least twice.
-
Figure 3—source data 1
Metabolomics data for M1-activated WT and M-BKO macrophages.
- https://cdn.elifesciences.org/articles/54090/elife-54090-fig3-data1-v2.xlsx
Figure 4 with 1 supplement
Bmal1 loss-of-function increases oxidative stress and Hif-1α protein accumulation.
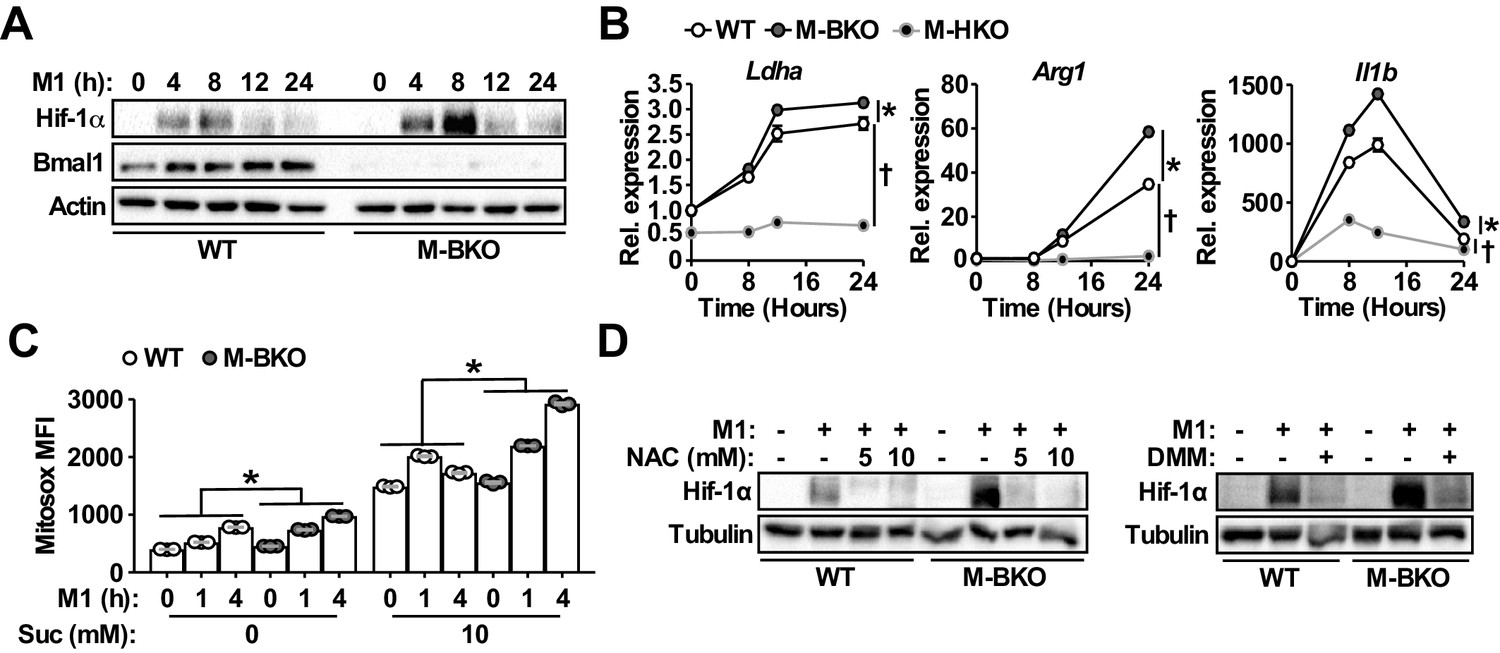
(A) Immunoblots of Hif-1α and Bmal1 protein levels in WT and M-BKO macrophages during a 24-hr time course of M1 activation. (B) Relative expression of Hif-1α target genes in WT, M-BKO and M-HKO macrophages determined by qPCR. N = 3 biological replicates, statistical analysis was performed using two-way ANOVA for WT vs M-BKO or WT vs M-HKO across the time course. (C) Measurement of mROS using MitoSox Red (mean fluorescence intensity, MFI) in mitochondria isolated from control or M1-activated macrophages. Succinate (Suc, 10 mM) was included during MitoSox Red staining where indicated. N = 3 biological replicates, statistical analysis was performed using two-way ANOVA for WT vs M-BKO across the time course. (D) Hif-1α protein levels in control or 8-hr M1-activated macrophages co-treated with or without N-acetylcysteine (NAC) or 10 mM dimethylmalonate (DMM). Data are presented as mean ± S.E.M. *, p<0.05 for WT vs M-BKO and p<0.05 for WT vs M-HKO. Experiments were repeated at least twice.
Figure 4—figure supplement 1
Increased oxidative stress and Hif-1α activity in M1 activated M-BKO macrophages.
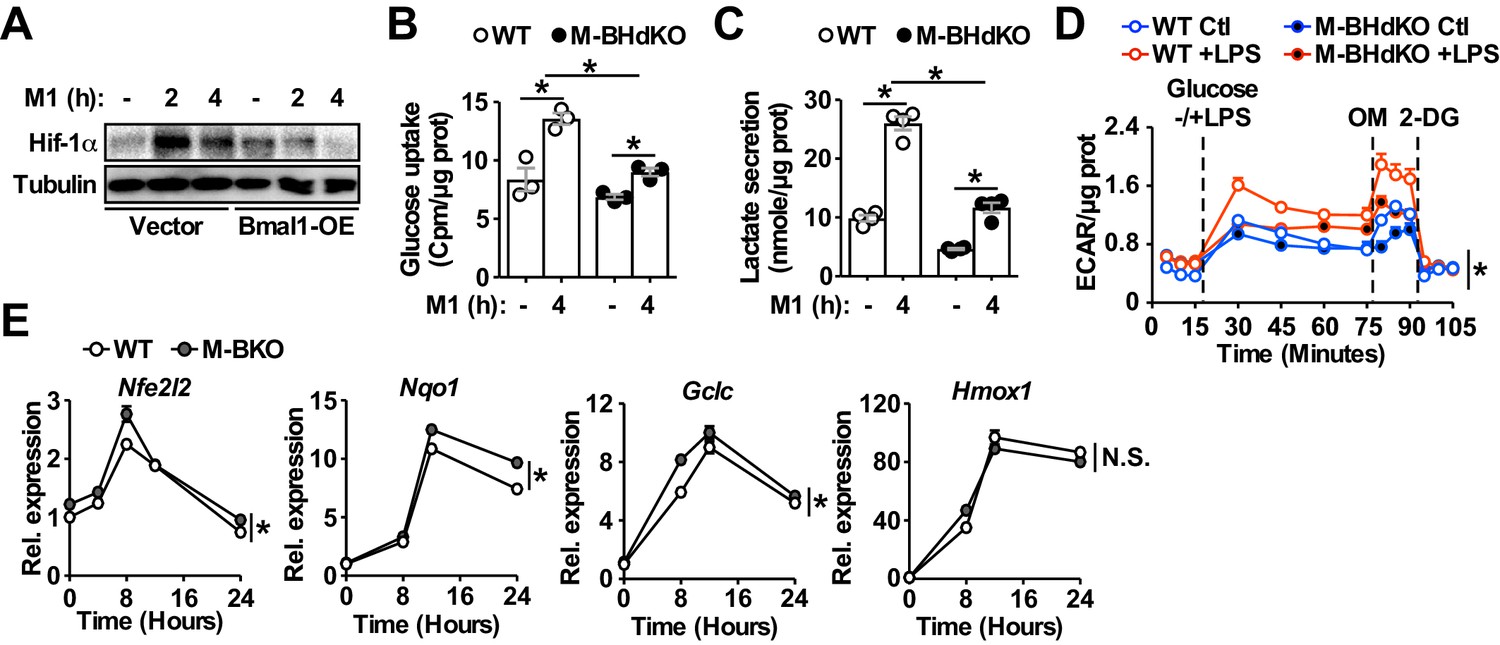
(A) Hif-1α protein levels in M1-activated (primed with 10 ng/mL Ifn-γ and stimulated with 50 ng/mL LPS) control and Bmal1-OE RAW264.7 stable lines. (B, C) Uptake of [3H]−2-deoxyglucose and lactate secretion in control or M1-activated macrophages. N = 3 biological replicates, statistical analysis was performed using Student’s T test. M-BHdko: myeloid-specific Bmal1 and Hif1a double knockout. (D) Glycolytic stress test in Ifn-γ-primed macrophages measuring ECAR following glucose (25 mM) injection without or with LPS (100 ng/mL). Maximal glycolytic rate was determined by injection of oligomycin (OM, 2 μM), and glycolysis-dependent ECAR was determined by injection of 2-deoxyglucose (2-DG, 50 mM). The assay medium contained minimal DMEM with 2% dialyzed FBS, pH 7.4. N = 5 biological replicates. The difference between LPS-treated WT and M-BHdKO macrophages was determined by two-way ANOVA across the time course. (E) Expression of Nrf2 target genes determined by qPCR throughout a 24-hr time course following M1 stimulation. N = 3 biological replicates, statistical analysis was performed using two-way ANOVA for WT vs M-BKO across the time course. Data are presented as mean ± S.E.M. *, p<0.05. Experiments were repeated at least twice.
Figure 5 with 1 supplement
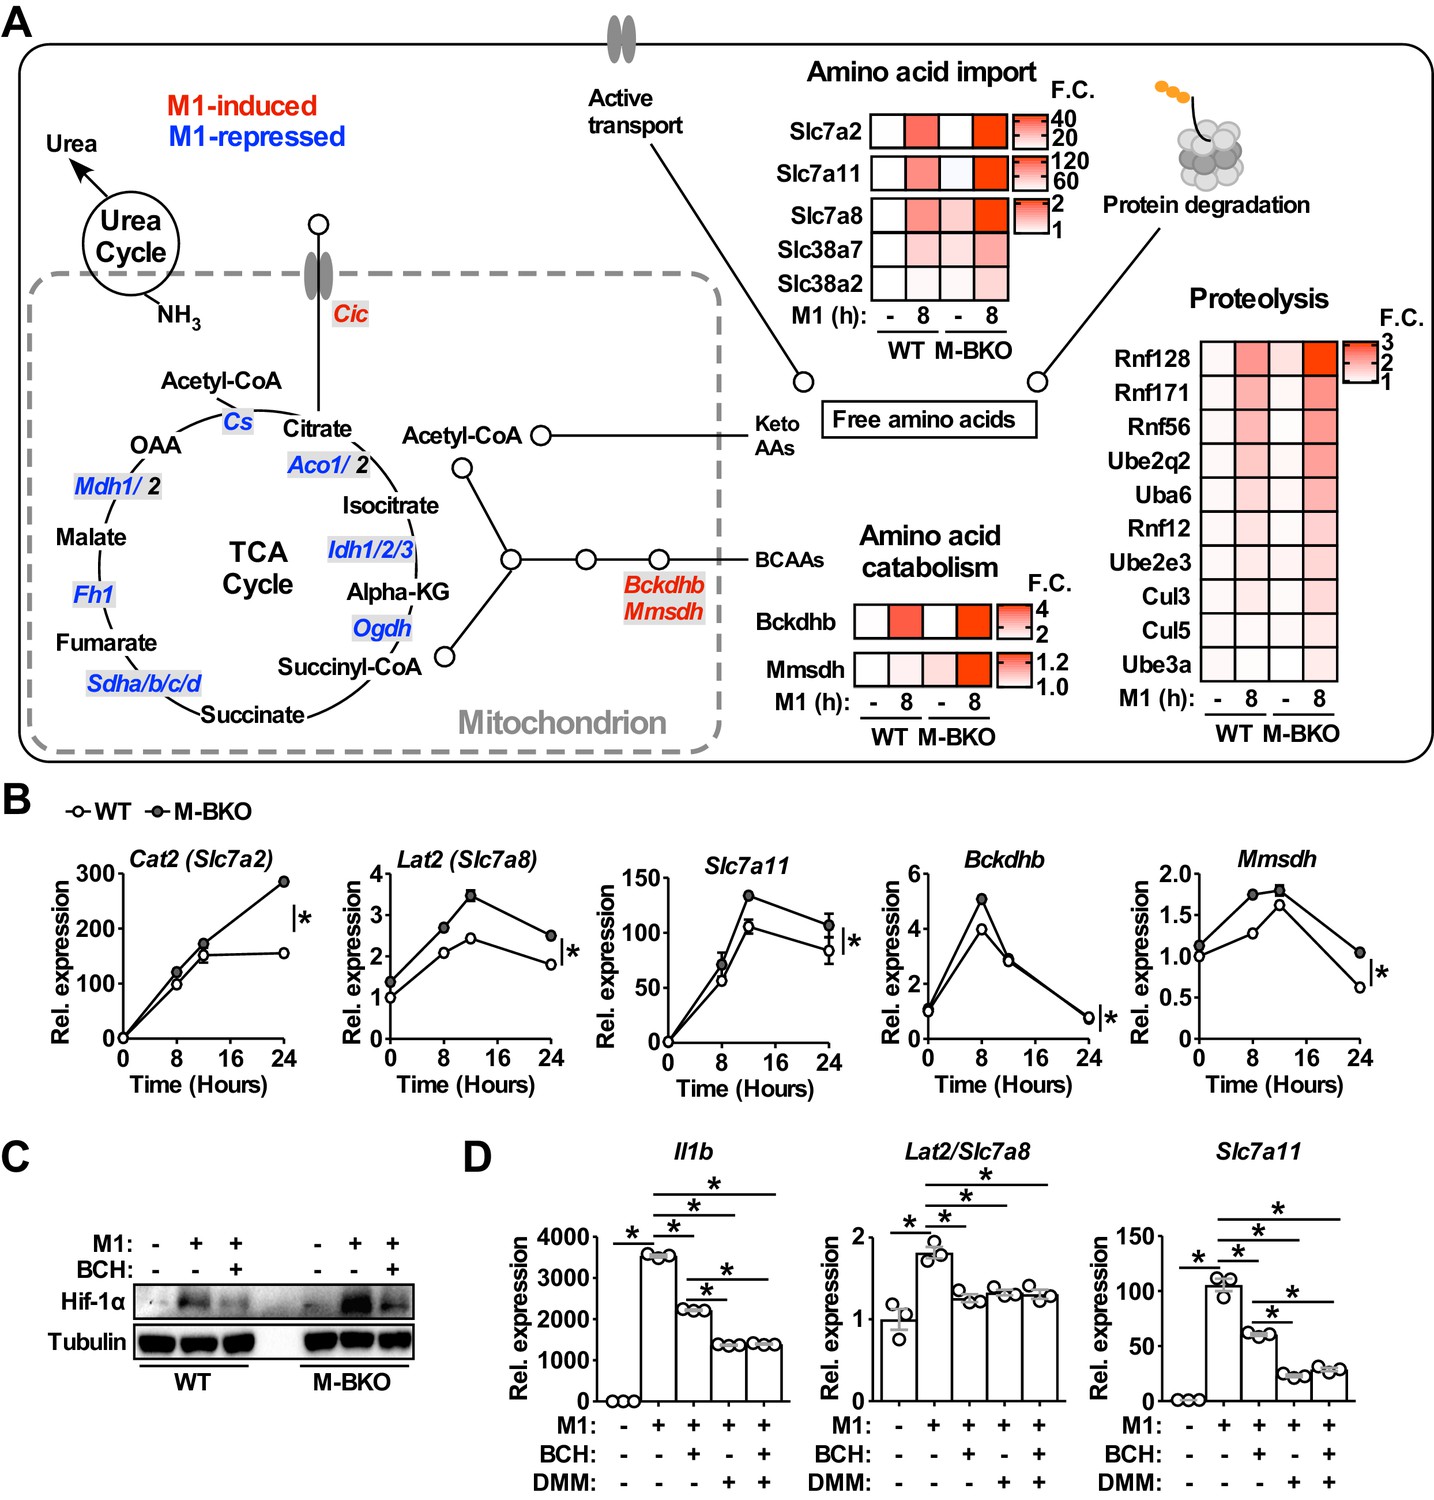
Genes involved in amino-acid uptake and catabolism are upregulated in M-BKO macrophages.
(A) Schematic representation of M1-regulated genes involved in amino-acid and TCA metabolism determined by RNA-seq. Genes in blue are downregulated whereas genes in red are upregulated by 8 hours M1 activation in both WT and M-BKO macrophages. Genes that are differentially regulated in these two genotypes are displayed in heat maps on the right. F.C., fold change. N = 3 biological replicates. BCAAs, branch chain amino acids; Keto AAs, ketogenic amino acids; Cic, mitochondrial citrate carrier. (B) Relative expression of differentially regulated genes identified by RNA-seq and validated by qPCR in a 24-hr time course of M1 activation. N = 3 biological replicates, statistical analysis was performed using two-way ANOVA for WT vs M-BKO across the time course. (C) Hif-1α protein levels in control or 6-hr M1-activated macrophages with or without co-treatment of the neutral amino-acid transport inhibitor 2-amino-2-norbornanecarboxylic acid (BCH, 10 mM). (D) Gene expression in control or 6-hr M1-activated macrophages with or without co-treatment of 10 mM BCH and/or the complex II inhibitor dimethyl malonate (DMM, 10 mM) determined by qPCR. N = 3 biological replicates, statistical analysis was performed using Student’s T test. Data are presented as mean ± S.E.M. *, p<0.05. Cell culture experiments were repeated at least twice.
-
Figure 5—source data 1
Functional annotation clustering genes commonly and differentially regulated between WT and M-BKO BMDMs by 8 h M1 activation.
- https://cdn.elifesciences.org/articles/54090/elife-54090-fig5-data1-v2.xlsx
Figure 5—figure supplement 1
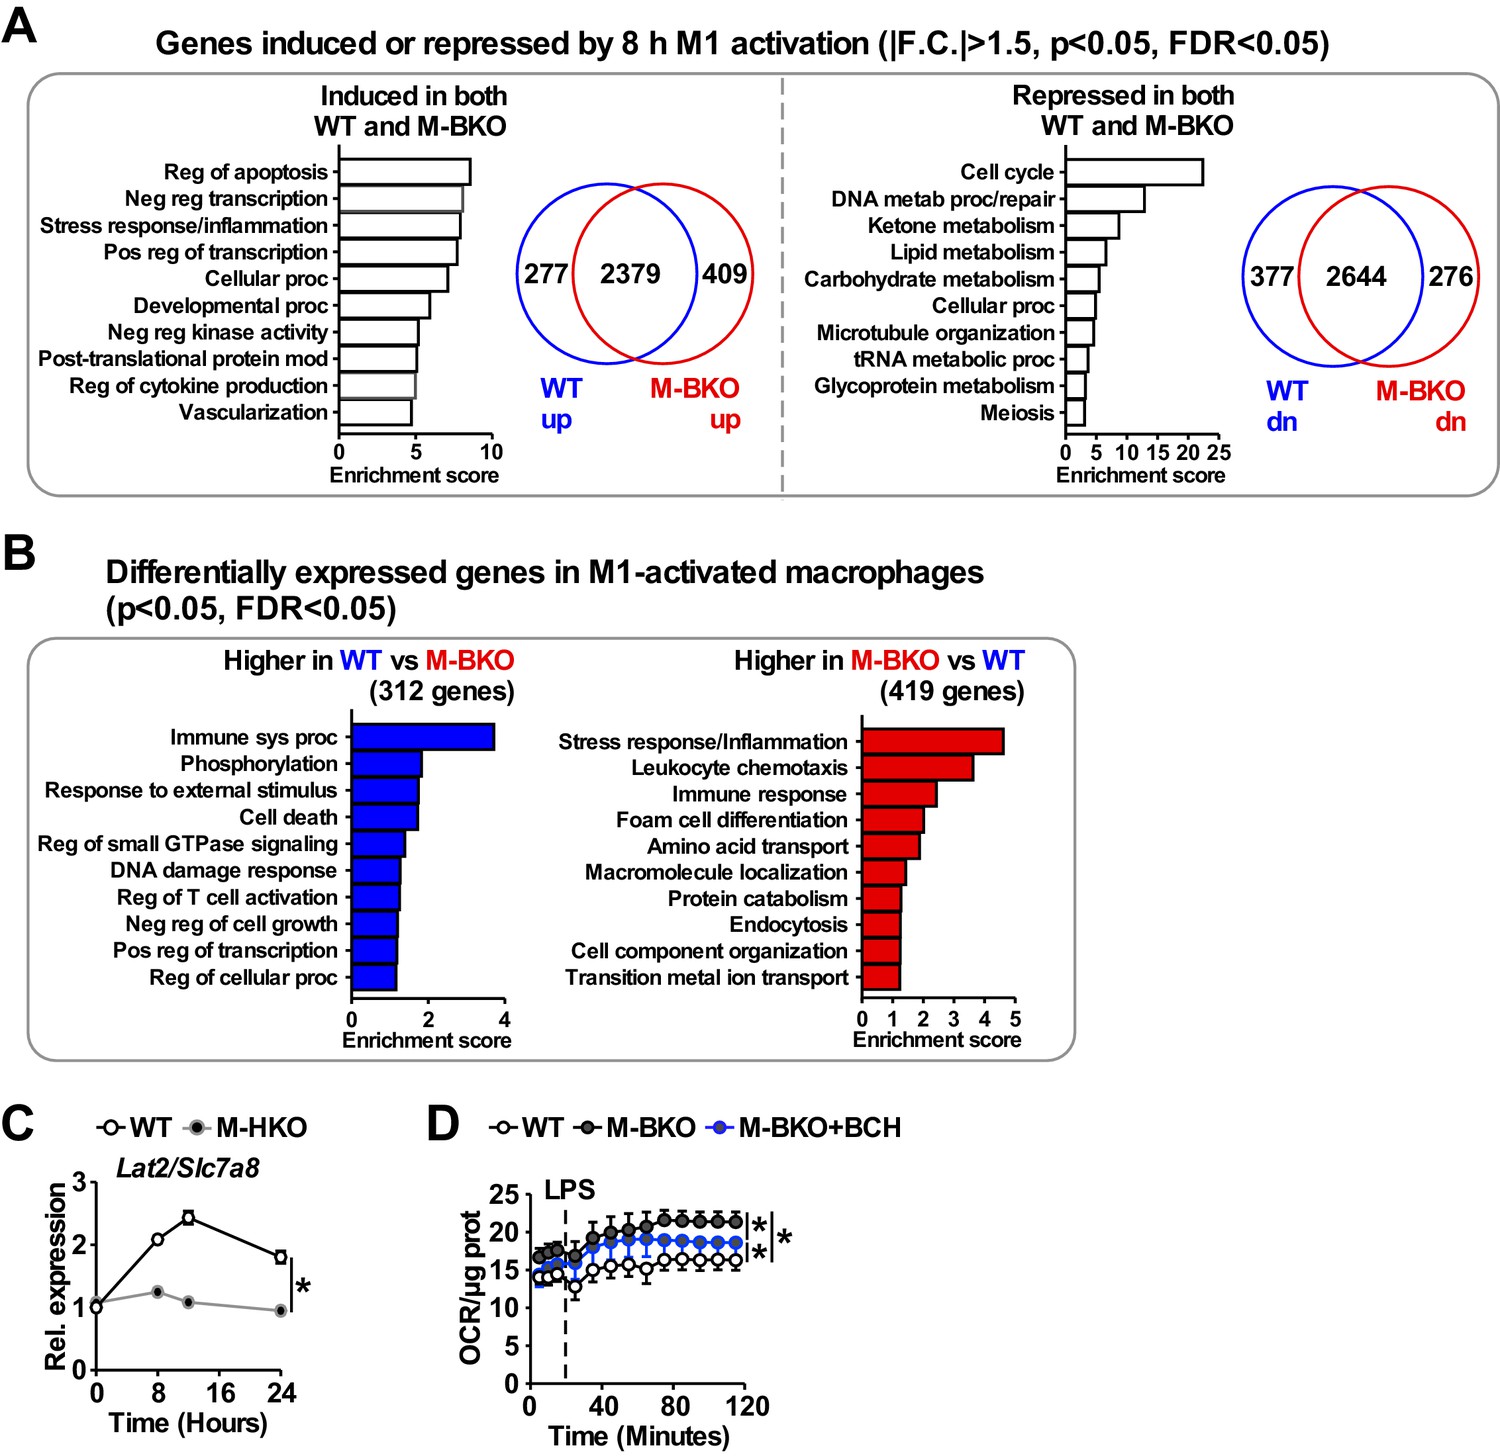
Transcriptome analysis of genes that are regulated by M1 stimulation in WT and M-BKO macrophages.
(A) Functional annotation clustering by biological process and Venn diagram of genes identified by RNA-seq that are mutually induced (2379 genes, left) or suppressed (2644 genes, right) by 8-h M1 activation in WT and M-BKO macrophages. N = 3 biological replicates. F.C., fold change. (B) Enriched biological processes associated with genes that are differentially expressed in M1-activated WT and M-BKO macrophages. (C) Relative expression of the neutral amino-acid transporter Slc7a8 (Lat2) in WT and myeloid Hif1a knockout (M-HKO) macrophages as determined by qPCR. WT samples were from Figure 5B. N = 3 biological replicates, statistical analysis was performed using two-way ANOVA for WT vs M-HKO across the time course. (D) Determination of glutamine utilization by extracellular flux analysis. OCR was measured before and after LPS injection (final concentration 1 μg/mL), and the assay medium contained 5 mM glutamine in minimal DMEM with 2% dialyzed FBS, pH 7.4. N = 5 biological replicates, statistical analysis was performed using two-way ANOVA for WT vs M-BKO and for WT or M-BKO vs M-BKO cells co-treated with the neutral amino-acid transport inhibitor 2-amino-2-norbornanecarboxylic acid (BCH, 10 mM) across the time course. Data are presented as mean ± S.E.M. *, p<0.05. Cell culture experiments were repeated at least twice.
Figure 6 with 1 supplement

Bmal1 regulates tumor-associated macrophage polarization.
(A) Bmal1 gene expression (left panel) and protein levels (right panel) in WT macrophages treated with control medium or increasing doses of B16-F10 tumor-conditioned medium (T-CM, diluted 1:3 or 1:1 with control medium) for 8 hr. N = 3 biological replicates for qPCR, statistical analysis was performed using Student’s T test. (B) Measurement of mROS using MitoSox Red (mean fluorescent intensity, MFI) in mitochondria from macrophages treated with control medium or T-CM diluted 1:1 with control medium for 1 hr. N = 3 biological replicates, statistical analysis was performed using Student’s T test. (C) Hif-1α protein levels in WT and M-BKO macrophages treated with control medium, T-CM diluted 1:1 with control medium, or undiluted T-CM for 4 hr. (D) Glycolytic stress test in macrophages pretreated with control medium or T-CM diluted 1:1 with control medium for 4 hr. N = 5 biological replicates. Statistical analysis was performed using two-way ANOVA comparing T-CM-treated M-BKO with WT cells across the time course. (E) Relative expression of genes involved in amino-acid metabolism and oxidative stress response in macrophages treated with control medium or T-CM diluted 1:3 with control medium for 8 hr, as determined by qPCR. N = 3 biological replicates, statistical analysis was performed using Student’s T test. (F) Tumor volume in male (left) and female (right) WT and M-BKO mice. 300,000 B16-F10 cells were injected subcutaneously into the right flank. N = 18 (male) and 8 (female) mice, statistical analysis was performed using two-way ANOVA for WT vs M-BKO mice across the time course. (G) Gene expression for F4/80+ cells isolated from B16-F10 tumors or spleens of female mice 14 days after injection. Tissues from six mice per genotype were pooled into three groups for leukocyte isolation. Statistical analysis was performed using Student’s T test. Data are presented as mean ± S.E.M. *, p<0.05. Experiments were repeated at least twice.
Figure 6—figure supplement 1
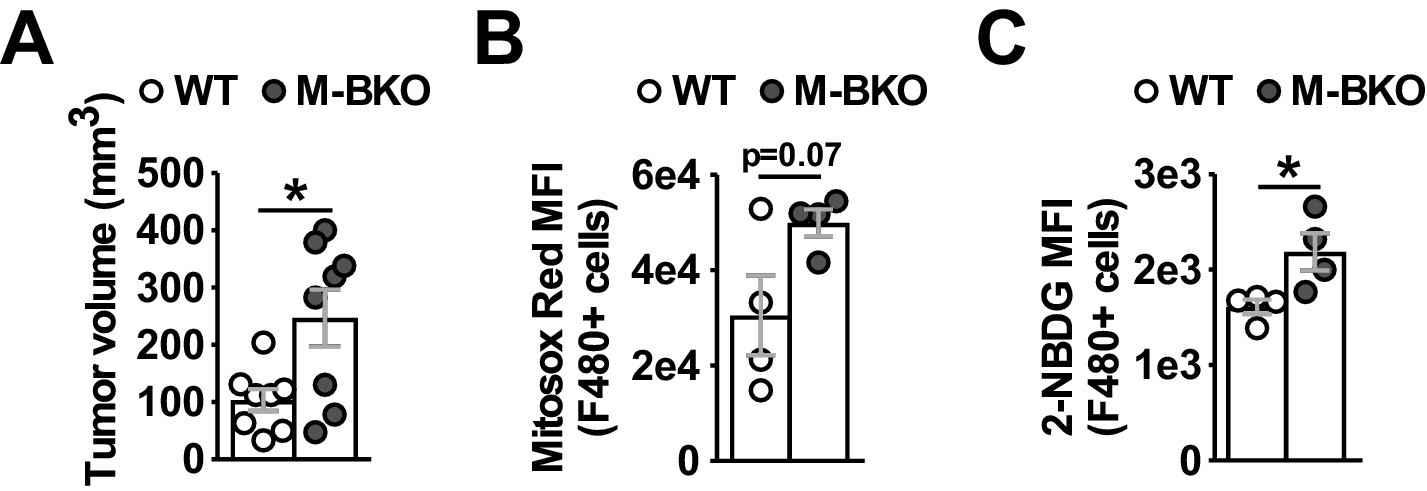
Increased mROS levels and glucose uptake in M-BKO TAMs.
(A) Tumor volumes of B16-F10 subcutaneous allografts in 3-month-old female WT and M-BKO mice 14 days after tumor cell injection. Each mouse was injected with 500,000 B16-F10 cells in the right and left flanks, and tumors from each mouse were pooled for immune cell isolation and flow cytometry. N = 4 mice, with two tumors per mouse. (B, C) mROS production and glucose uptake by tumor-associated CD45+F4/80+ cells determined by flow cytometry (mean fluorescent intensities) of Mitosox Red and 2-NBDG staining, respectively. N = 4. Statistical analysis was performed using Student’s T test. Data are presented as mean ± S.E.M. *, p<0.05.
Figure 7 with 1 supplement
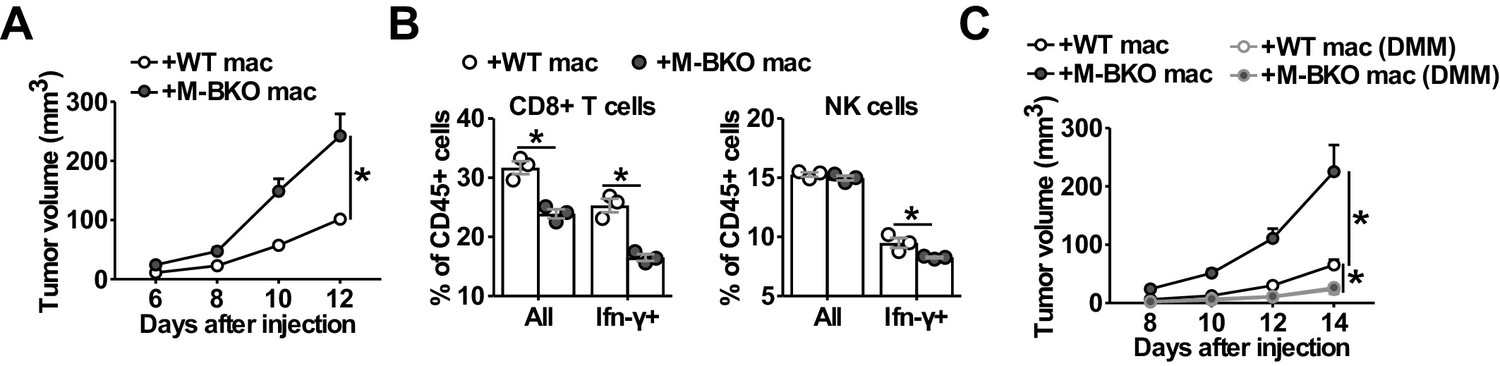
Macrophage Bmal1 modulates the antitumor activity.
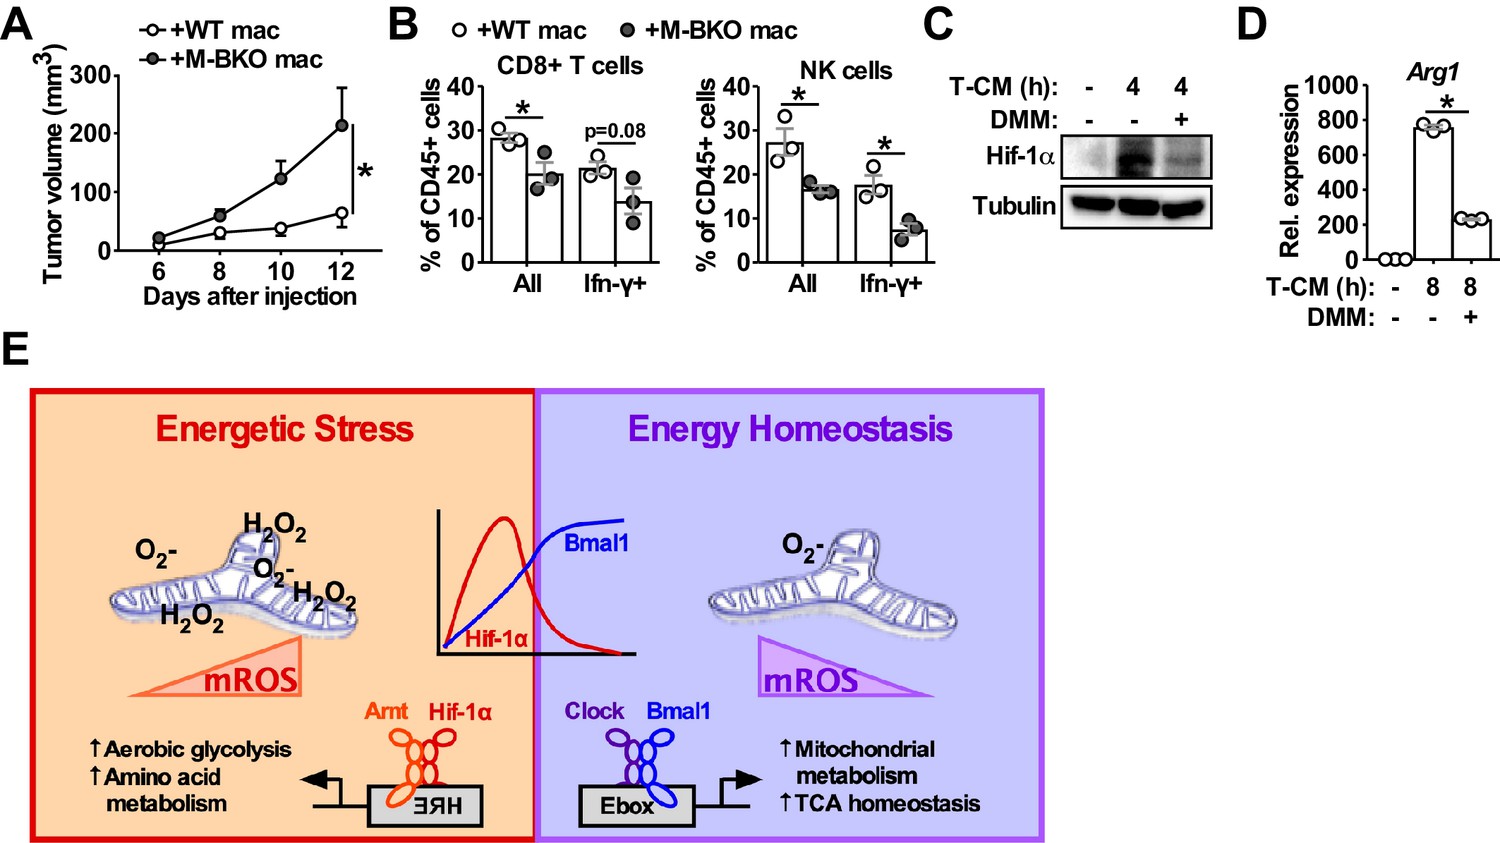
(A) Tumor volume in WT male mice co-injected with 500,000 B16-F10 cells and either 500,000 WT or M-BKO macrophages as indicated. N = 22 mice, statistical analysis was performed using two-way ANOVA to compare WT vs M-BKO macrophage co-injection across the time course. (B) Flow cytometric analysis of tumor-infiltrating CD8+ T cells (CD45+CD3+CD8a+ cells, left panel) and NK cells (CD45+CD3–NK1.1+ cells, right panel) stimulated ex vivo with phorbol 12-myristate 13-acetate and ionomycin for Ifn-γ co-staining. Tumors represented in panel (A) were pooled into three groups prior to isolation of infiltrating leukocytes for flow cytometry. Statistical analysis was performed using Student’s T test. (C) Tumor volume in WT male mice co-injected with 500,000 B16-F10 cells and either 500,000 WT or M-BKO macrophages, supplemented without or with dimethylmalonate (DMM, approximately 150 mg/kg body weight per day in mouse diet). N = 8 mice, statistical analysis was performed using two-way ANOVA to compare WT vs M-BKO macrophage co-injection on control diet, or to compare WT macrophage co-injection on the control diet vs WT or M-BKO macrophage co-injection on the DMM-supplemented diet across the time course. Data are presented as mean ± S.E.M. *, p<0.05. Experiments were repeated at least twice.
Figure 7—figure supplement 1
Macrophage Bmal1 regulates tumor growth in a cell-autonomous manner.
(A) Tumor volume in M-BKO male mice co-injected with 500,000 B16-F10 cells and either 500,000 WT or M-BKO macrophages as indicated. N = 6 mice, statistical analysis was performed using two-way ANOVA to compare WT vs M-BKO macrophage co-injection across the time course. (B) Flow cytometric analyses of tumor-infiltrating CD8+ T cells (CD45+CD3+CD8a+ cells, left panel) and NK cells (CD45+CD3–NK1.1+ cells, right panel) stimulated ex vivo with phorbol 12-myristate 13-acetate and ionomycin for Ifn-γ co-staining. Tumors that are represented in panel (A) were pooled into three groups prior to isolation of infiltrating leukocytes for flow cytometric analyses. Statistical analysis was performed using Student’s T test. Data are presented as mean ± S.E.M. *, p<0.05. (C) Hif-1α protein levels in WT macrophages treated with (from left to right) control medium or B16-F10 tumor-conditioned medium (T–CM) diluted 1:1 with control medium without or with co-treatment with 10 mM dimethyl malonate (DMM) for 4 hr. (D) Arg1 gene expression in WT macrophages treated as in panel (C) for 8 hr. N = 3 biological replicates. Statistical analysis was performed using Student’s T test. Experiments were repeated at least twice. (E) Schematic showing the working model for Bmal1–Hif-1α crosstalk in the regulation of macrophage bioenergetics and effector functions. Both M1 and tumor-associated macrophages share similar energetically stressed states. Bmal1 preserves mitochondrial oxidative metabolism while reducing oxidative stress to modulate Hif-1α activity and support proper effector functions. Deletion of Bmal1 in the macrophage leads to reliance on glycolytic metabolism and alternative fuel utilization, notably amino-acid metabolism, which further promotes mROS production and Hif-1α protein stabilization. Increased amino-acid utilization by M-BKO macrophages may lead to depletion of amino acids that are critical for lymphocyte activation and cytotoxic function, thereby suppressing anti-tumor immunity in the tumor microenvironment.
Author response image 1

Tables
Table 1
Transcriptional regulators that are differentially regulated in M1-activated macrophages.
Genes encoding transcriptional regulators that were significantly induced or repressed by 8h M1 stimulation (p<0.05, false discovery rate [FDR] <0.05, |F.C.| >1.5) in WT bone-marrow-derived macrophages (BMDM) were identified by gene ontology analysis using the DAVID platform. F.C., fold change. Differentially regulated genes that matched the Transcription GO term in the Biological Processes GO database (accession GO:0006350) were used to generate a protein–protein interaction map using String (Figure 1—figure supplement 1). Uncharacterized zinc-finger proteins (ZFPs) were omitted from analyses by String.
| Induced (278 genes) | |||||||
|---|---|---|---|---|---|---|---|
| ADAR | CRY1 | GTF2A1 | KDM4B | MNT | PPP1R10 | Snapc1 | Zkscan17 |
| AFF1 | CRY2 | GTF2E2 | KDM5B | MXD1 | PPP1R13L | SNAPC2 | ZMIZ1 |
| AFF4 | CSRNP1 | GTF2F1 | KDM5C | MXI1 | PTOV1 | SOX5 | ZSCAN2 |
| AHR | CSRNP2 | HBP1 | KEAP1 | MYB | PTRF | SPEN | ZSCAN29 |
| AKNA | DAXX | HDAC1 | KLF11 | NAB2 | PURA | SPIC | ZXDB |
| ANP32A | DDIT3 | HES1 | KLF16 | NACC1 | RBPJ | SREBF1 | |
| ARHGAP22 | DDX54 | HES7 | KLF4 | NCOA5 | RCOR2 | SRF | |
| ARID3A | DEDD2 | HEXIM1 | KLF7 | NCOA7 | REL | ST18 | |
| ARID5A | DNMT3A | HIC1 | KLF9 | NCOR2 | RELA | STAT2 | |
| ARNT2 | DPF1 | HIC2 | LCOR | NFAT5 | RELB | STAT3 | |
| ASF1A | DRAP1 | HIF1A | LCORL | NFE2L2 | REST | STAT4 | |
| ATF3 | E2F5 | HIF3A | LHX2 | NFIL3 | RFX1 | STAT5A | |
| ATF4 | E4F1 | HINFP | LIN54 | NFKB1 | RING1 | TAF1C | |
| ATF6B | EAF1 | HIVEP1 | LITAF | NFKB2 | RNF2 | TAF7 | |
| ATXN7L3 | EDF1 | HIVEP2 | LMO4 | NFKBIZ | RORA | TAL1 | |
| BANP | EGR2 | HIVEP3 | MAF | NOTCH1 | RREB1 | TBL1X | |
| BATF | EID3 | HLX | MAFF | NPTXR | RSLCAN18 | TCEB2 | |
| BCL3 | EIF2C1 | HMG20B | MAFG | NR1D1 | RUNX2 | TCF4 | |
| BCL6 | ELK1 | HMGA1 | MAFK | NR1D2 | RUNX3 | TGIF1 | |
| BCORL1 | ELL | HMGA1-RS1 | MAML1 | NR1H2 | RUVBL2 | THAP7 | |
| BHLHE40 | ELL2 | HMGN5 | MAX | NR1H3 | RXRA | TLE2 | |
| BHLHE41 | ELL3 | HOPX | MBD2 | NR2F6 | RYBP | TLE3 | |
| BRWD1 | EPAS1 | HSF4 | MDFIC | NR4A1 | SAFB2 | TRERF1 | |
| BTG2 | ERF | IFI205 | MECP2 | NR4A2 | SAP130 | TRIB3 | |
| CAMTA2 | ERN1 | IFT57 | MED13 | NR4A3 | SAP30 | TRRAP | |
| CASZ1 | ESRRA | ILF3 | MED13L | PAF1 | SBNO2 | TSC22D4 | |
| CBX4 | ETS1 | ING2 | MED15 | PAX4 | SCAF1 | TSHZ1 | |
| CCDC85B | ETV3 | IRF2BP1 | MED25 | PCGF3 | SEC14L2 | USP49 | |
| CDKN2A | FIZ1 | IRF4 | MED26 | PCGF5 | SERTAD1 | VPS72 | |
| CEBPB | FLII | IRF7 | MED28 | PER1 | SETD8 | WHSC1L1 | |
| CEBPD | FOXP1 | IRF8 | MED31 | PER2 | SFPI1 | ZBTB17 | |
| CITED4 | FOXP4 | JARID2 | MEF2D | PHF1 | SIN3B | ZBTB24 | |
| CREB5 | GATA2 | JDP2 | MIER2 | PHF12 | SIX1 | ZBTB46 | |
| CREBBP | GATAD2A | JMJD6 | MIER3 | PIAS4 | SIX5 | ZBTB7A | |
| CREBL2 | GATAD2B | JUN | MITF | PML | SLC30A9 | ZBTB7B | |
| CREBZF | GFI1 | JUNB | MIXL1 | POU2F2 | SMAD3 | ZEB1 | |
| CREM | GLIS3 | JUND | MKL1 | POU3F1 | SMAD4 | ZFHX4 | |
| CRTC2 | GPBP1 | KDM3A | MLL1 | POU6F1 | SMAD7 | ZGPAT | |
| CRTC3 | GRHL1 | KDM4A | MNDA | PPARD | SMYD1 | ZHX2 | |
| Repressed (195 genes) | |||||||
| ACTL6A | ELK3 | IRF2 | NAA15 | SAP18 | |||
| AHRR | ELP2 | ITGB3BP | NCOA1 | SAP25 | |||
| AI987944 | ELP3 | KDM2B | NCOA3 | SETD7 | |||
| ANG | ELP4 | KLF10 | NFATC1 | SETDB1 | |||
| ASCC1 | ENY2 | KLF13 | NFATC2 | SNAPC5 | |||
| ASF1B | ERCC8 | KLF2 | NFIA | SP3 | |||
| ATAD2 | ESR1 | KLF8 | NKRF | SSBP2 | |||
| AW146154 | ETOHI1 | L3MBTL2 | NPAT | SSRP1 | |||
| BCL9L | ETV1 | LBH | NPM3 | STAT1 | |||
| CBFA2T3 | EYA1 | LRPPRC | NR2C1 | SUV39H1 | |||
| CBX3 | EYA4 | LYL1 | NRIP1 | SUV39H2 | |||
| CBX6 | EZH2 | MAFB | OVOL2 | SUV420H2 | |||
| CBX8 | FLI1 | MARS | PA2G4 | TADA1 | |||
| CCNH | FNTB | MBTPS2 | PHF19 | TADA2A | |||
| CDCA7 | FOXM1 | MCM2 | PHTF2 | TAF4B | |||
| CDCA7L | GTF2H2 | MCM3 | PNRC2 | TAF9B | |||
| CEBPA | GTF2I | MCM4 | POLR1B | TBX6 | |||
| CEBPG | GTF2IRD1 | MCM5 | POLR2G | TCEA3 | |||
| CEBPZ | GTF3A | MCM6 | POLR2I | TCEAL8 | |||
| CHAF1A | GTF3C5 | MCM7 | POLR3B | TCF7L2 | |||
| CHAF1B | HABP4 | MCM8 | POLR3H | TFB1M | |||
| CHD9 | HDAC10 | MCTS1 | POLR3K | TFB2M | |||
| CHURC1 | HDAC11 | MED14 | PPARG | TFDP2 | |||
| CIITA | HDAC2 | MED18 | PPARGC1B | THOC1 | |||
| CIR1 | HDAC6 | MED22 | PRIM1 | TLE1 | |||
| CREB3 | HDAC7 | MED27 | PRIM2 | TRAPPC2 | |||
| CREB3L1 | HDAC8 | MEF2A | PRMT7 | TRIM24 | |||
| CREB3L2 | HDAC9 | MEF2C | PROX2 | TWISTNB | |||
| CTNND1 | HELLS | MEIS1 | PSPC1 | TXNIP | |||
| CUX1 | HHEX | MLF1IP | RAD54B | UHRF1 | |||
| DDI2 | HIP1 | MLL3 | RB1 | USF1 | |||
| DNMT1 | HIRA | MLLT3 | RBAK | VGLL4 | |||
| DR1 | HMBOX1 | MNAT1 | RCBTB1 | VPS36 | |||
| E2F1 | HMGA2 | MPV17 | RCOR3 | WTIP | |||
| E2F2 | HOXA1 | MXD3 | RERE | ZBTB3 | |||
| E2F6 | HTATSF1 | MXD4 | RFC1 | ZBTB8A | |||
| E2F7 | IKBKAP | MYBL2 | RPAP1 | ZHX1 | |||
| E2F8 | IKZF2 | MYC | RSC1A1 | ZIK1 | |||
| EGR3 | IL16 | MYCBP2 | RSL1 | ZKSCAN4 | |||
Key resources table
| Reagent type (species) or resource | Designation | Source or reference | Identifiers | Additional information |
|---|---|---|---|---|
| Strain, strain background (Mus musculus) | B6.129S4(CG)-Arntltm1Weit/J | The Jackson Laboratory | JAX: 007668 | Carry loxp sites flanking exon 8 of the Bmal1 gene |
| Strain, strain background (Mus musculus) | B6.129-Hif1atm3Rsjo/J | The Jackson Laboratory | JAX: 007561 | Carry loxp sites flanking exon 2 of the Hif1a gene |
| Strain, strain background (Mus musculus) | B6.129P2-Lyz2tm1(cre)lfo/J | The Jackson Laboratory | JAX: 004781 | Myeloid-specific Cre recombinase expression |
| Antibody | Mouse monoclonal anti-Bmal1 (clone B-1) | Santa Cruz Biotechnology | Cat# sc365645; RRID:AB_10841724 | WB (1:1000) |
| Antibody | Rabbit polyclonal anti-Hif-1α | Novus Biologicals | Cat# NB100-449; RRID:AB_10001045 | WB (1:1000) |
| Antibody | Rabbit monoclonal anti-Bnip3 (clone EPR4034) | Abcam | Cat# ab109362; RRID:AB_10864714 | WB (1:1000) |
| Antibody | Rabbit polyclonal anti-β-tubulin | Cell Signaling Technology | Cat# 2146; RRID:AB_2210545 | WB (1:1000) |
| Antibody | Rabbit monoclonal anti-β-Actin (clone 13E5) | Cell Signaling Technology | Cat# 4970; RRID:AB_2223172 | WB (1:1000) |
| Antibody | Rat monoclonal anti-CD45 (clone 30-F11), PerCP/Cy5.5-conjugated | Biolegend | Cat# 103132; RRID:AB_893340 | Flow cytometry (1 μL per test) |
| Antibody | Armenian hamster monoclonal anti-CD3ε (clone 145–2 C11), PE/Cy7-conjugated | Biolegend | Cat# 100320; RRID:AB_312685 | Flow cytometry (2.5 μL per test) |
| Antibody | Rat monoclonal anti-CD8a (clone 53–6.7), Alexa Fluor 700-conjugated | Biolegend | Cat# 100730; RRID:AB_493703 | Flow cytometry (0.5 μL per test) |
| Antibody | Mouse monoclonal anti-NK1.1 (clone PK136), APC-conjugated | Biolegend | Cat# 108710 | Flow cytometry (5 μL per test) |
| Antibody | Rat monoclonal anti-F4/80 (clone BM8), Alexa Fluor 488-conjugated | Biolegend | Cat# 123120; RRID:AB_893479 | Flow cytometry (5 μL per test) |
| Antibody | Rat monoclonal anti-F4/80 (clone BM8), APC-conjugated | Biolegend | Cat# 123115; RRID:AB_893493 | Flow cytometry (2.5 μL per test) |
| Antibody | Rat monoclonal anti-Ifn-γ (clone XMG1.2), PE-conjugated | ThermoFisher Scientific | Cat# 12-7311-81, RRID:AB_466192 | Flow cytometry (1 μL per test) |
| Peptide, recombinant protein | Recombinant murine interferon-γ | Peprotech | Cat# 315–05 | Used 10 ng/mL final concentration |
| Peptide, recombinant protein | Recombinant murine interleukin-4 | Peprotech | Cat# 214–14 | Used 10 ng/mL final concentration |
| Sequence-based reagent | 36b4_F | This paper | qPCR primer | AGATGCAGCAGATCCGCAT |
| Sequence-based reagent | 36b4_R | This paper | qPCR primer | GTTCTTGCCCATCAGCACC |
| Sequence-based reagent | Arg1_F | This paper | qPCR primer | CGTAGACCCTGGGGAACACTAT |
| Sequence-based reagent | Arg1_R | This paper | qPCR primer | TCCATCACCTTGCCAATCCC |
| Sequence-based reagent | Bckdhb_F | This paper | qPCR primer | TGGGGCTCTCTACCATTCTCA |
| Sequence-based reagent | Bckdhb_R | This paper | qPCR primer | GGGGTATTACCACCTTGATCCC |
| Sequence-based reagent | Bmal1_F | This paper | qPCR primer | AGGATCAAGAATGCAAGGGAGG |
| Sequence-based reagent | Bmal1_R | This paper | qPCR primer | TGAAACTGTTCATTTTGTCCCGA |
| Sequence-based reagent | cMyc_F | This paper | qPCR primer | CAGCGACTCTGAAGAAGAGCA |
| Sequence-based reagent | cMyc_R | This paper | qPCR primer | GACCTCTTGGCAGGGGTTTG |
| Sequence-based reagent | Cry1_F | This paper | qPCR primer | CACTGGTTCCGAAAGGGACTC |
| Sequence-based reagent | Cry1_R | This paper | qPCR primer | CTGAAGCAAAAATCGCCACCT |
| Sequence-based reagent | Gclc_F | This paper | qPCR primer | CATCCTCCAGTTCCTGCACA |
| Sequence-based reagent | Gclc_R | This paper | qPCR primer | ATGTACTCCACCTCGTCACC |
| Sequence-based reagent | Hif1a_F | This paper | qPCR primer | GAACGAGAAGAAAAATAGGATGAGT |
| Sequence-based reagent | Hif1a_R | This paper | qPCR primer | ACTCTTTGCTTCGCCGAGAT |
| Sequence-based reagent | Hmox1_F | This paper | qPCR primer | CAGAGCCGTCTCGAGCATAG |
| Sequence-based reagent | Hmox1_R | This paper | qPCR primer | CAAATCCTGGGGCATGCTGT |
| Sequence-based reagent | Il1b_F | This paper | qPCR primer | AGCTTCAGGCAGGCAGTATC |
| Sequence-based reagent | Il1b_R | This paper | qPCR primer | AAGGTCCACGGGAAAGACAC |
| Sequence-based reagent | Ldha_F | This paper | qPCR primer | GCGTCTCCCTGAAGTCTCTT |
| Sequence-based reagent | Ldha_R | This paper | qPCR primer | GCCCAGGATGTGTAACCTTT |
| Sequence-based reagent | Mgl2_F | This paper | qPCR primer | ccttgcgtttgtcaaaacatgac |
| Sequence-based reagent | Mgl2_R | This paper | qPCR primer | ctgaggcttatggaactgaggc |
| Sequence-based reagent | Mmsdh_F | This paper | qPCR primer | GAGGCCTTCAGGTGGTTGAG |
| Sequence-based reagent | Mmsdh_R | This paper | qPCR primer | GATAGATGGCATGGTCTCTCCC |
| Sequence-based reagent | Nfe2l2_F | This paper | qPCR primer | GGTTGCCCACATTCCCAAAC |
| Sequence-based reagent | Nfe2l2_R | This paper | qPCR primer | GCAAGCGACTCATGGTCATC |
| Sequence-based reagent | Nfkb1_F | This paper | qPCR primer | CCTGCTTCTGGAGGGTGATG |
| Sequence-based reagent | Nfkb1_R | This paper | qPCR primer | GCCGCTATATGCAGAGGTGT |
| Sequence-based reagent | Nqo1_F | This paper | qPCR primer | TCTCTGGCCGATTCAGAGTG |
| Sequence-based reagent | Nqo1_R | This paper | qPCR primer | TGCTGTAAACCAGTTGAGGTTC |
| Sequence-based reagent | Nr1d2_F | This paper | qPCR primer | TCATGAGGATGAACAGGAACCG |
| Sequence-based reagent | Nr1d2_R | This paper | qPCR primer | CGGCCAAATCGAACAGCATC |
| Sequence-based reagent | Ppard_F | This paper | qPCR primer | CAGCCTCAACATGGAATGTC |
| Sequence-based reagent | Ppard_R | This paper | qPCR primer | TCCGATCGCACTTCTCATAC |
| Sequence-based reagent | Pparg_F | This paper | qPCR primer | CAGGAGCCTGTGAGACCAAC |
| Sequence-based reagent | Pparg_R | This paper | qPCR primer | ACCGCTTCTTTCAAATCTTGTCTG |
| Sequence-based reagent | Slc7a2_F | This paper | qPCR primer | CCCGGGATGGCTTACTGTTT |
| Sequence-based reagent | Slc7a2_R | This paper | qPCR primer | AGGCCATCACAGCAGAAATGA |
| Sequence-based reagent | Slc7a8_F | This paper | qPCR primer | GAACCACCCGGGTTCTGAC |
| Sequence-based reagent | Slc7a8_R | This paper | qPCR primer | TGATGTTCCCTACAATGATACCACA |
| Sequence-based reagent | Slc7a11_F | This paper | qPCR primer | ATCTCCCCCAAGGGCATACT |
| Sequence-based reagent | Slc7a11_R | This paper | qPCR primer | GCATAGGACAGGGCTCCAAA |
| Sequence-based reagent | Stat3_F | This paper | qPCR primer | TGGCAGTTCTCGTCCAC |
| Sequence-based reagent | Stat3_R | This paper | qPCR primer | CCAGCCATGTTTTCTTTGC |
| Sequence-based reagent | Bmal1_F | This paper | Cloning primers | GGCGAATTCGCGGACCAGAGAATGGAC |
| Sequence-based reagent | Bmal1_R | This paper | Cloning primers | GGGCTCGAGCTACAGCGGCCATGGCAA |
| Cell line (Mus musculus) | RAW264.7 macrophages | ATCC | qPCR primer | TIB-71 |
| Cell line (Mus musculus) | B16-F10 melanoma cells | ATCC | qPCR primer | CRL-6475 |
| Recombinant DNA reagent | pBABE-puro retroviral expression vector (plasmid) | Addgene | Plasmid #1764 | |
| Recombinant DNA reagent | pBABE-Bmal1 (plasmid) | This study | For stable overexpression of mouse Bmal1 | |
| Chemical compound, drug | Lipopolysaccharides from Escherichia coli K-235 | Sigma-Aldrich | Cat# L2143 | Final concentration used varied as indicated |
| Chemical compound, drug | Dimethyl malonate | Sigma-Aldrich | Cat# 136441; CAS: 108-59-8 | Used 10 mM final concentration |
| Chemical compound, drug | Sodium succinate dibasic | Sigma-Aldrich | Cat# 14160; CAS: 150-90-3 | Used 10 mM final concentration |
| Chemical compound, drug | N-acetyl-L-cysteine | Sigma-Aldrich | Cat# A9165; CAS: 616-91-1 | Final concentration used varied as indicated. |
| Chemical compound, drug | 2-deoxy-D-glucose | Sigma-Aldrich | Cat# D8375; CAS: 154-17-6 | Used 50 mM final concentration |
| Chemical compound, drug | Quant-iT ribogreen RNA reagent | ThermoFisher Scientific | Cat# R11491 | |
| Chemical compound, drug | Mitotracker green FM | ThermoFisher Scientific | Cat# M7514 CAS: 201860-17-5 | Used 100 nM final concentration |
| Chemical compound, drug | Mitosox red superoxide indicator | ThermoFisher Scientific | Cat# M36008 | Used 5 μM final concentration |
| Chemical compound, drug | 2-NBDG | ThermoFisher Scientific | Cat# N13195 | Used 10 μM final concentration |
| Chemical compound, drug | Fixable viability dye eFluor 455uv | ThermoFisher Scientific | Cat# 65-868-14 | Flow cytometry (0.5 μL per test) |
| Chemical compound, drug | Fixable viability dye eFluor 506 | ThermoFisher Scientific | Cat# 65-0866-14 | Flow cytometry (0.5 μL per test) |
| Chemical compound, drug | Oligomycin | Abcam | Cat# ab141829; CAS: 1404-19-9 | Used 2 μM final concentration |
| Chemical compound, drug | Rotenone | Abcam | Cat# ab143145 CAS: 83-79-4 | Used 1 μM final concentration |
| Chemical compound, drug | Antimycin A | Sigma-Aldrich | Cat# A8674; CAS: 1397-94-0 | Used 1 μM final concentration |
| Chemical compound, drug | Carbonyl cyanide-4-(trifluoromethoxy)phenylhydrazone (FCCP) | Santa Cruz Biotechnology | Cat# sc203578 CAS: 370-86-5 | Used 0.5 μM final concentration |
| Chemical compound, drug | Phorbol 12-myristate 13-acetate (PMA) | Sigma-Aldrich | Cat# P8139; CAS: 16561-29-8 | Used 20 ng/mL final concentration |
| Chemical compound, drug | Ionomycin calcium salt from Streptomyces conglobatus | Sigma-Aldrich | Cat# I0634; CAS: 56092-82-1 | Used 1 μg/mL final concentration |
| Chemical compound, drug | Brefeldin A | Cell Signaling Technology | Cat# 9972S; CAS: 20350-15-6 | Used 10 μg/mL final concentration |
| Chemical compound, drug | BCA protein assay kit | ThermoFisher Scientific | Cat# 23227 | |
| Chemical compound, drug | Seahorse XF24 FluxPak | Agilent | Cat# 102070–00 | |
| Chemical compound, drug | Foxp3/Transcription factor staining buffer set | ThermoFisher Scientific | Cat# 00-5523-00 | |
| Chemical compound, drug | TruSeq stranded mRNA library prep kit | Illumina | Cat# RS-122–2101 | |
| Chemical compound, drug | Dynabeads sheep anti-rat IgG | ThermoFisher Scientific | Cat # 11035 | |
| Software, algorithm | STRING | von Mering, 2004 | https://string-db.org/ | |
| Software, algorithm | DAVID | Huang et al., 2009 | https://david-d.ncifcrf.gov/ | |
| Other | Thioglycollate medium | Sigma-Aldrich | Cat# T9032 | |
| Other | Bovine serum albumin, fatty acid free | Gemini Bio-Products | Cat# 700–107P | |
| Other | Collagen I protein, rat tail | ThermoFisher Scientific | Cat# A1048301 | |
| Other | Collagenase type IV | ThermoFisher Scientific | Cat# 17104019 | |
| Other | Recombinant DNase I, RNase-free | Affymetrix | Cat# 78411 |
Additional files
Download links
A two-part list of links to download the article, or parts of the article, in various formats.
Downloads (link to download the article as PDF)
Open citations (links to open the citations from this article in various online reference manager services)
Cite this article (links to download the citations from this article in formats compatible with various reference manager tools)
Bmal1 integrates mitochondrial metabolism and macrophage activation
eLife 9:e54090.
https://doi.org/10.7554/eLife.54090


