Evolution of multifunctionality through a pleiotropic substitution in the innate immune protein S100A9
- Department of Chemistry and Biochemistry, University of Oregon, United States
- Institute of Molecular Biology, University of Oregon, United States
- Oregon Health & Science University, United States
Figures
Figure 1 with 5 supplements
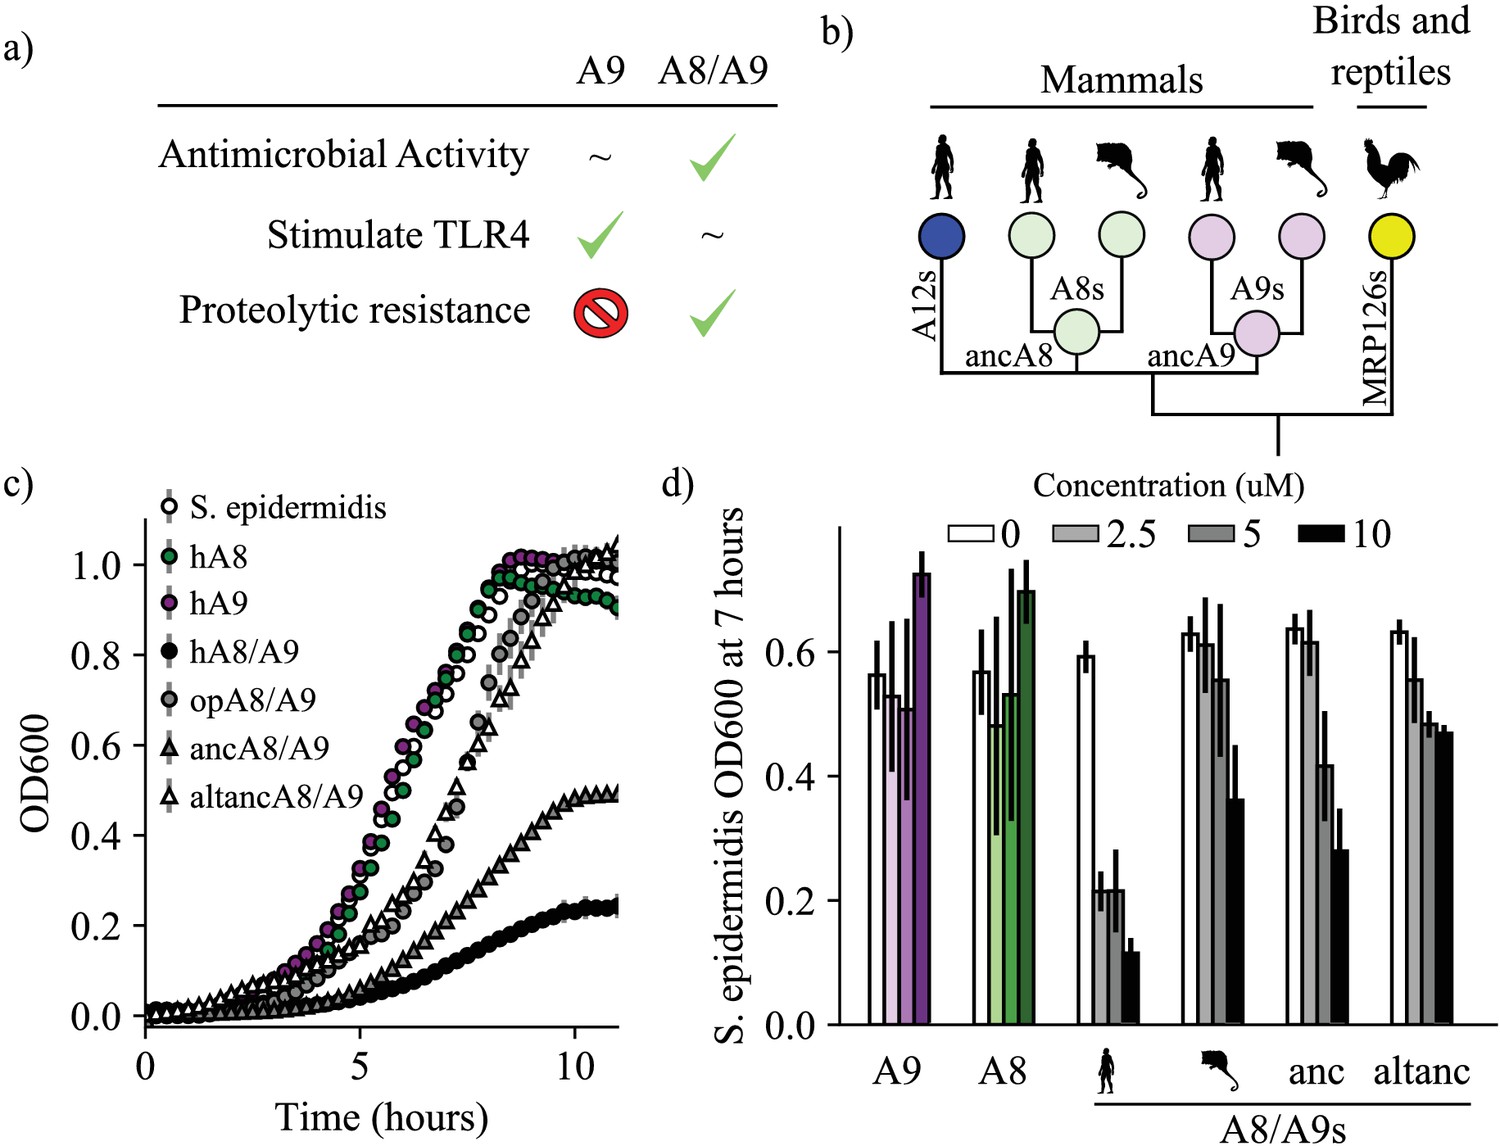
A9s evolved to form the antimicrobial A8/A9 complex early in mammals.
(a) Table of A9 and A8/A9 properties. ‘~” represents weak or ambiguously characterized function, check marks and red ‘X’ represent confirmed property (check) or lack thereof (‘x’). (b) Schematic of previously published S100 protein tree. Colored nodes represent single protein sequences. Species cartoons shown are human, opossum, and chicken. Ancestrally reconstructed protein nodes are labeled. Branch lengths not to scale. (c) Representative growth curves for Staphylococcus epidermidis in the presence or absence of 10 μM S100 proteins. Each point represents optical density at 600 nm. S. epidermidis growth alone and in the presence of modern proteins are shown as circles, growth in the presence of ancestrally reconstructed proteins shown as triangles. Error bars are standard deviation of three technical replicates. (d) Percent of untreated S. epidermidis growth at 12 hr with S100 protein treatments. Data are average of three biological replicates. Error bars are standard error of the mean. Species cartoon labels are the same as in (b).
-
Figure 1—source data 1
Antimicrobial activity of S100 proteins.
- https://cdn.elifesciences.org/articles/54100/elife-54100-fig1-data1-v2.xlsx
Figure 1—figure supplement 1
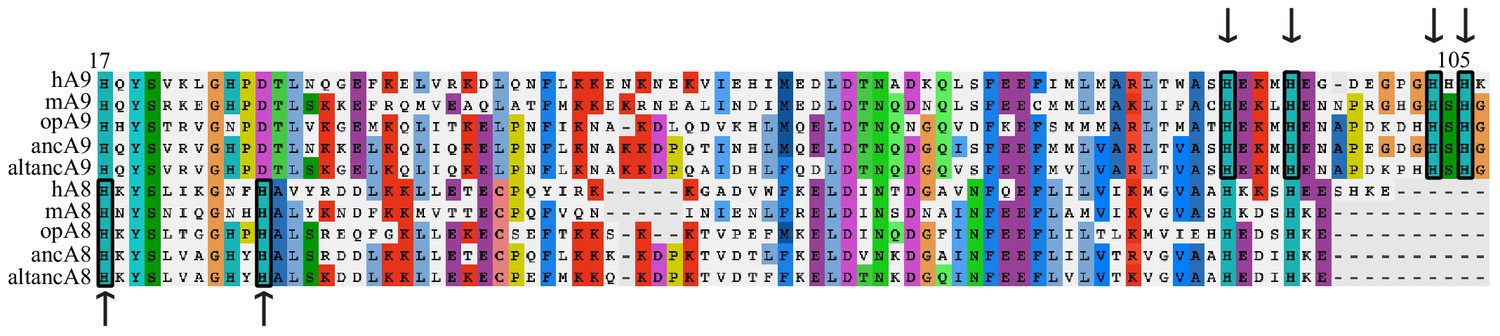
The residues composing the A8/A9 hexastidine site are conserved across mammalian and ancestrally reconstructed A8s and A9s.
Human (h), mouse (m), opossum (op), maximum likelihood therian mammalian ancestors (anc), and AltAll ancestors (altanc) shown. Alignment truncated to show conservation of key hexahistidine site metal- binding residues (boxed + arrows). A8s conserve two (positions 17 and 27 in human A8), while A9s conserve four (positions 91, 95, 103, and 105 of human A9). Consensus residues for alignment are highlighted.
Figure 1—figure supplement 2
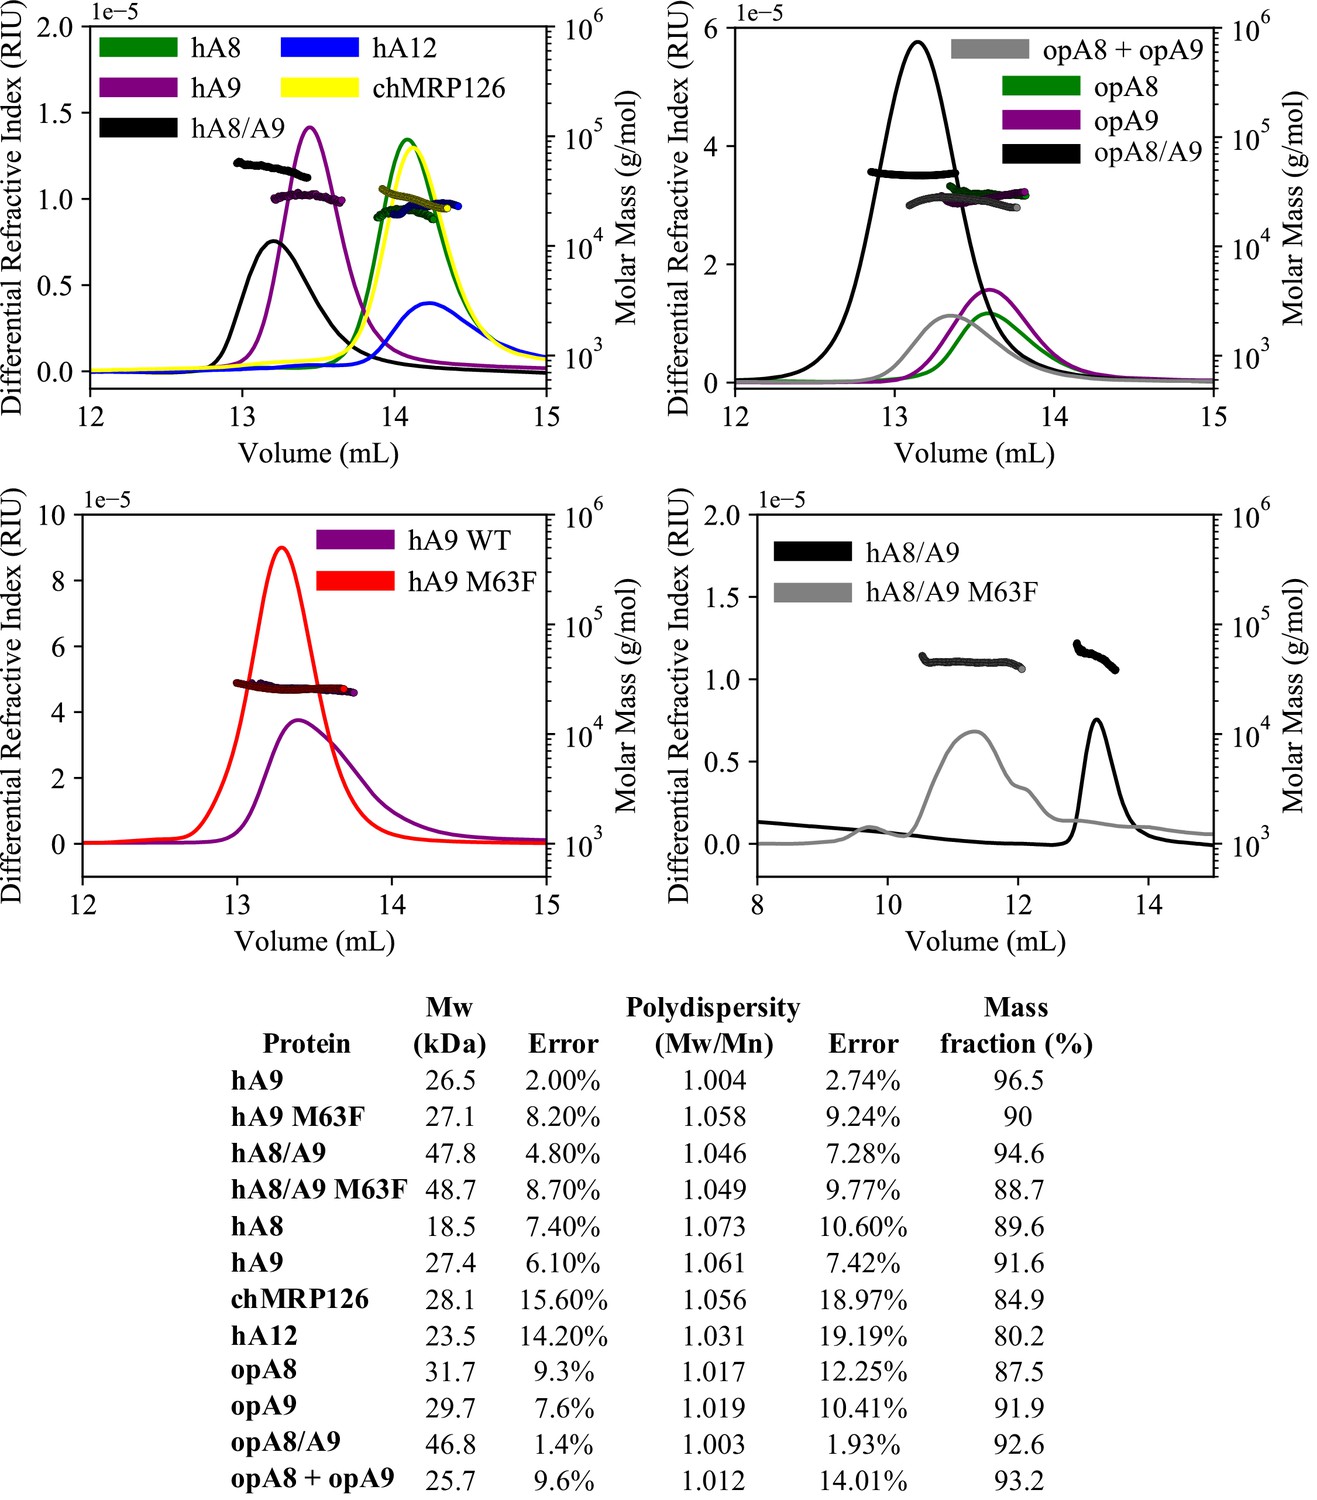
Analysis of protein oligomeric state using SECMALS.
Differential refractive index (left y-axis, lines) and calculated molecular weights from light scattering detectors (right y-axis, points) for modern S100 proteins used in this study. h = human, op = opossum, ch = chicken species. Opossum A8 + A9 sample is an equimolar mixture of opossum A8 and A9 homodimers. Table below shows summary data calculated using Wyatt Astra software.
Figure 1—figure supplement 3

Bacterial growth in the presence of S100 proteins.
Representative S. epidermidis growth curves in the presence of (a) human A9, (b) human A9 M63F, (c) human A8/A9, (d) human A8/A9 M63F, (e) opossum A8/A9 (cysteine-free), (f) opossum A8/A9 (containing cysteines), (g) ancA8/A9, and h) altancA8/A9. Error bars are the standard deviation for three technical replicates, points show one representative biological replicate for each protein at four different concentrations.
Figure 1—figure supplement 4
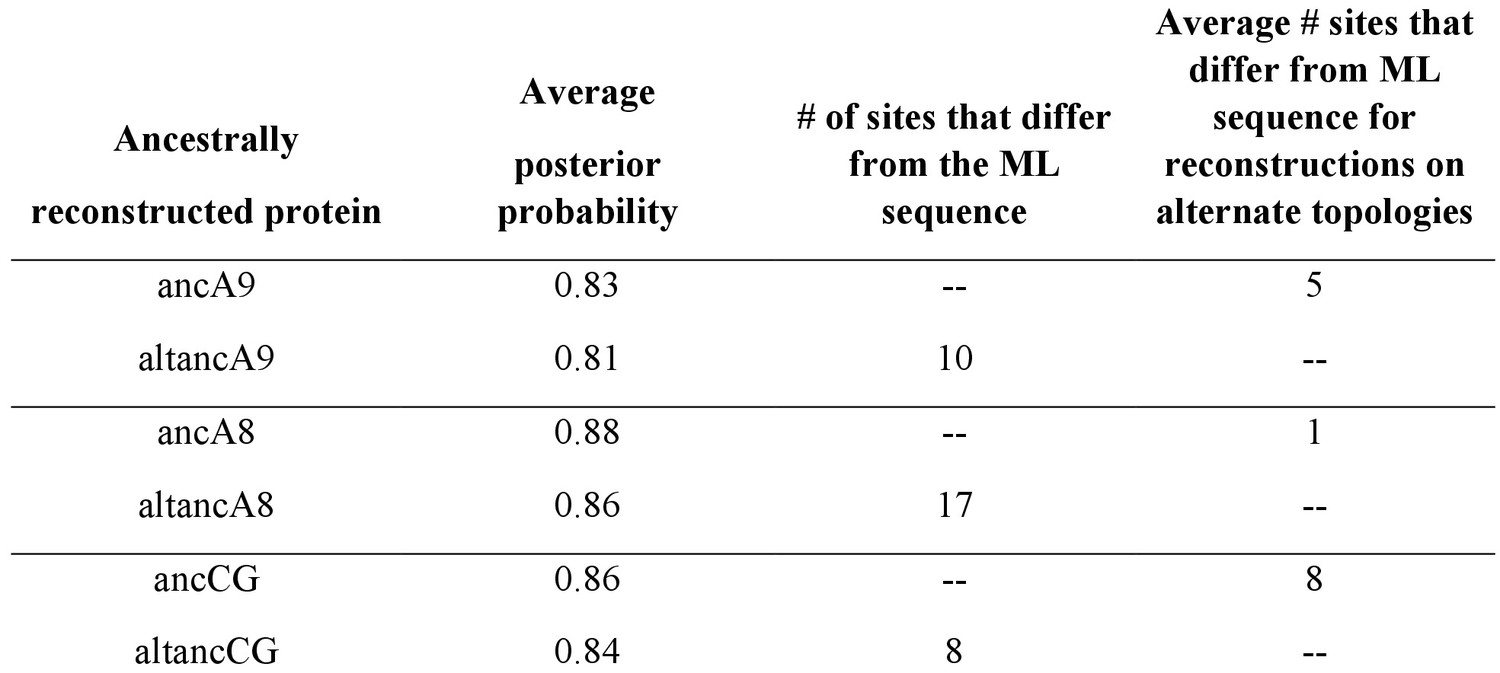
Statistics for ancestrally reconstructed proteins.
Figure 1—figure supplement 5
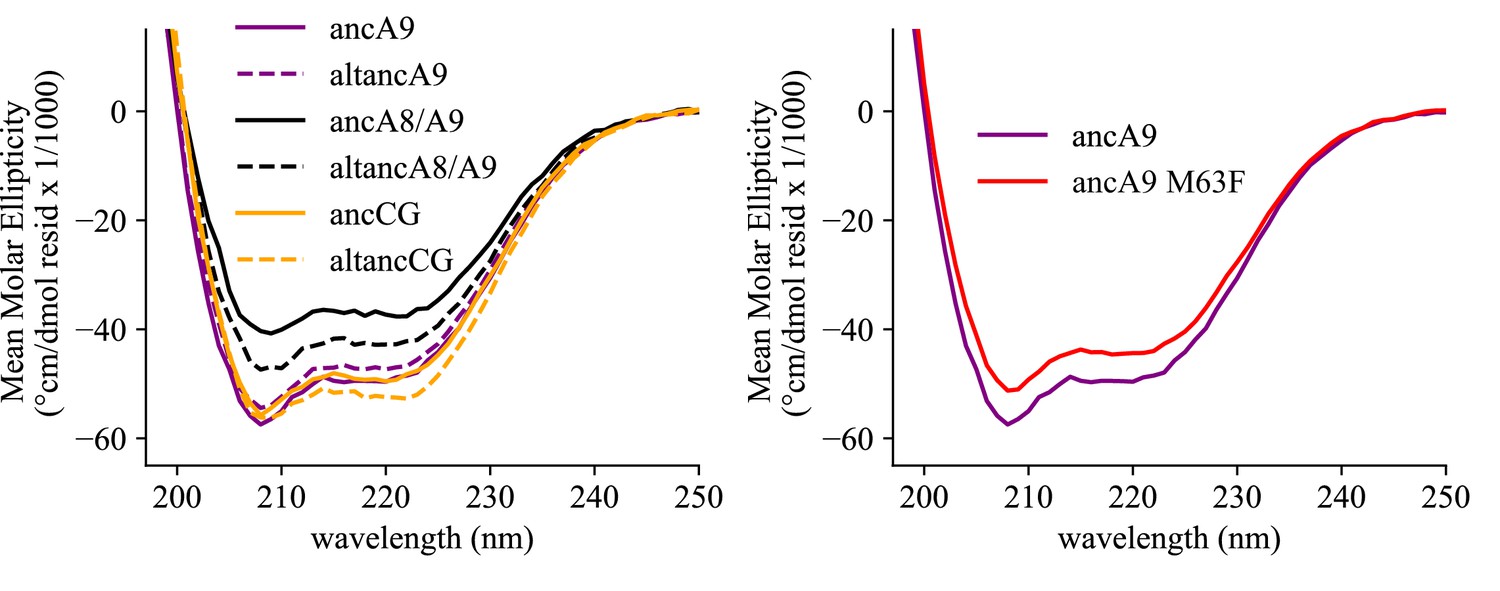
Secondary structure characterization of ancestrally reconstructed S100s by CD spectroscopy.
Data shown are the average of 3 scans. Solid lines are maximum likelihood ancestral proteins, dotted lines are alt-all ancestors (colored the same as matching maximum likelihood ancestor for comparison).
Figure 2 with 3 supplements
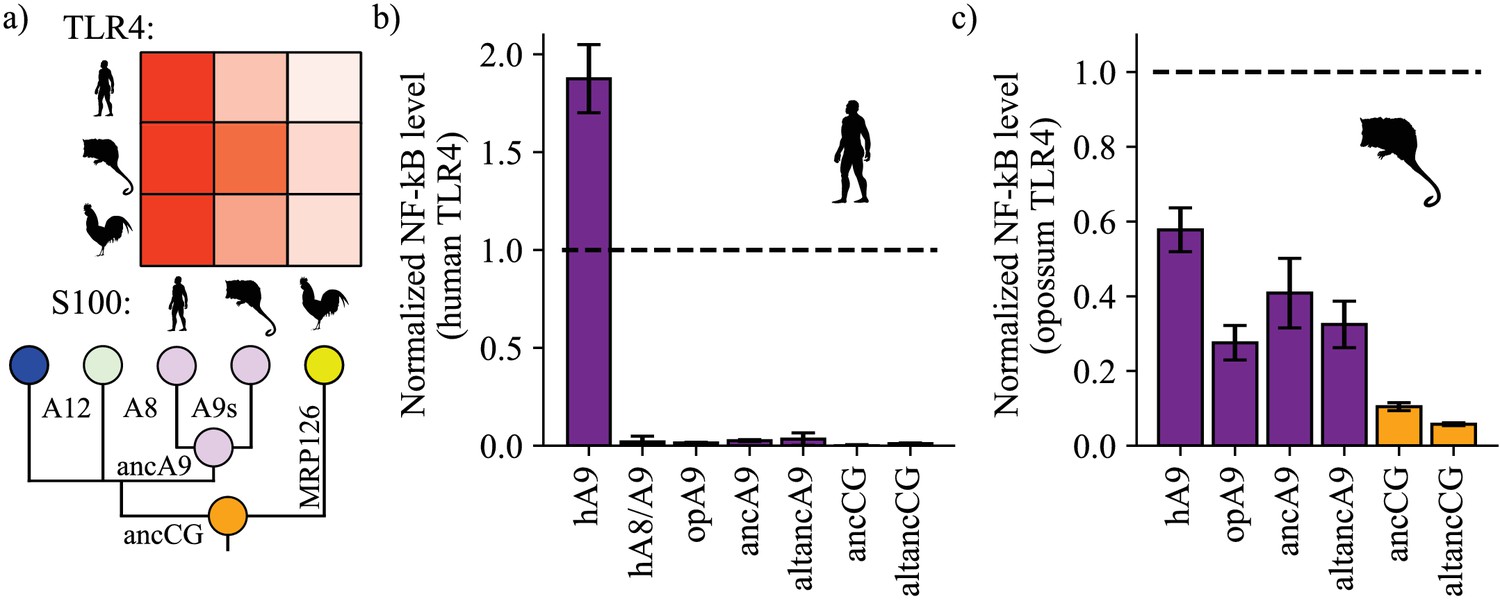
A9s gained proinflammatory activity from a weakly proinflammatory ancestor.
(a) Schematic of previously measured proinflammatory activity of S100s against various TLR4s. Species labels on x and y-axes of heatmap are the same as Figure 1. Heatmap coloring is scaled to match 2 μM S100 activity levels measured in supplementary figure S2 of Loes et al. (2018). (b) and (c) NF-κB production of human and opossum TLR4 in response to treatment with modern and ancestral S100 proteins. Bars represent average of >3 biological replicates, error bars are standard error of the mean. All values are background-subtracted and normalized to LPS positive control (see methods).
-
Figure 2—source data 1
Human TLR4 activation data.
- https://cdn.elifesciences.org/articles/54100/elife-54100-fig2-data1-v2.xlsx
-
Figure 2—source data 2
Opossum TLR4 activation data.
- https://cdn.elifesciences.org/articles/54100/elife-54100-fig2-data2-v2.xlsx
Figure 2—figure supplement 1

Analysis of S100 protein LPS contamination.
Top panel: Activity of LPS (0.2 ng/µl) against human (left) and opossum TLR4 (right) is inhibited by the addition of Polymyxin B (PB, 0.2 µg/µl). Middle and bottom panels: S100 activation of human (middle) and opossum (bottom) TLR4 with no PB, 0.2 µg/µl PB (+) and 0.25 µg/µl PB (++). No-PB data were not collected for hA9, opA9, and opA9 M60F against opossum TLR4 (bottom panel). Data were background-subtracted using the LPS + PB control and normalized to LPS activity against either human or opossum TLR4. Error bars are standard deviation.
Figure 2—figure supplement 2
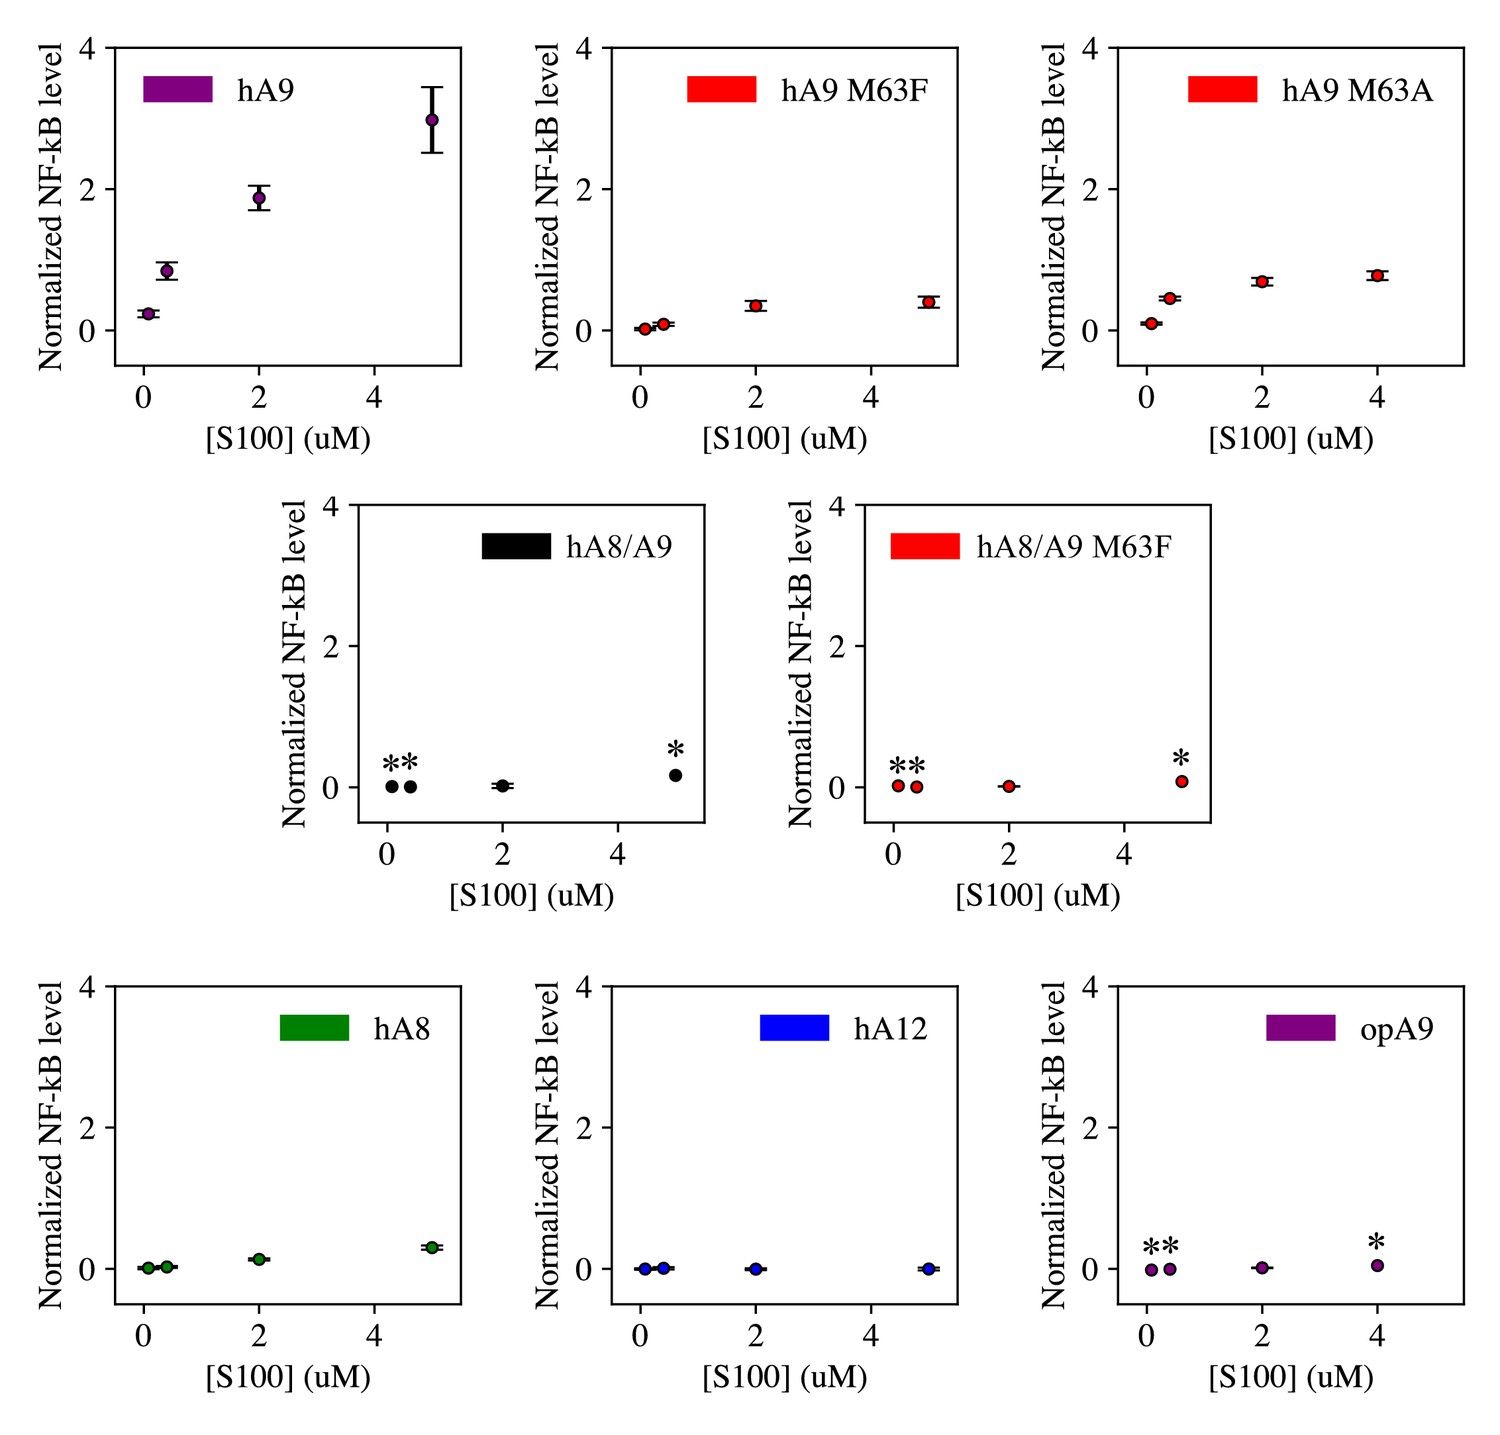
Dose curves for S100 activation of human TLR4.
Points are the average of >3 biological replicates each consisting of 3 technical triplicates, error bars are standard error of the mean. An asterisk (*) indicates a concentration at which a single biological replicate was measured. Data were background-subtracted using the LPS + PB control and normalized to LPS activity against human TLR4.
Figure 2—figure supplement 3
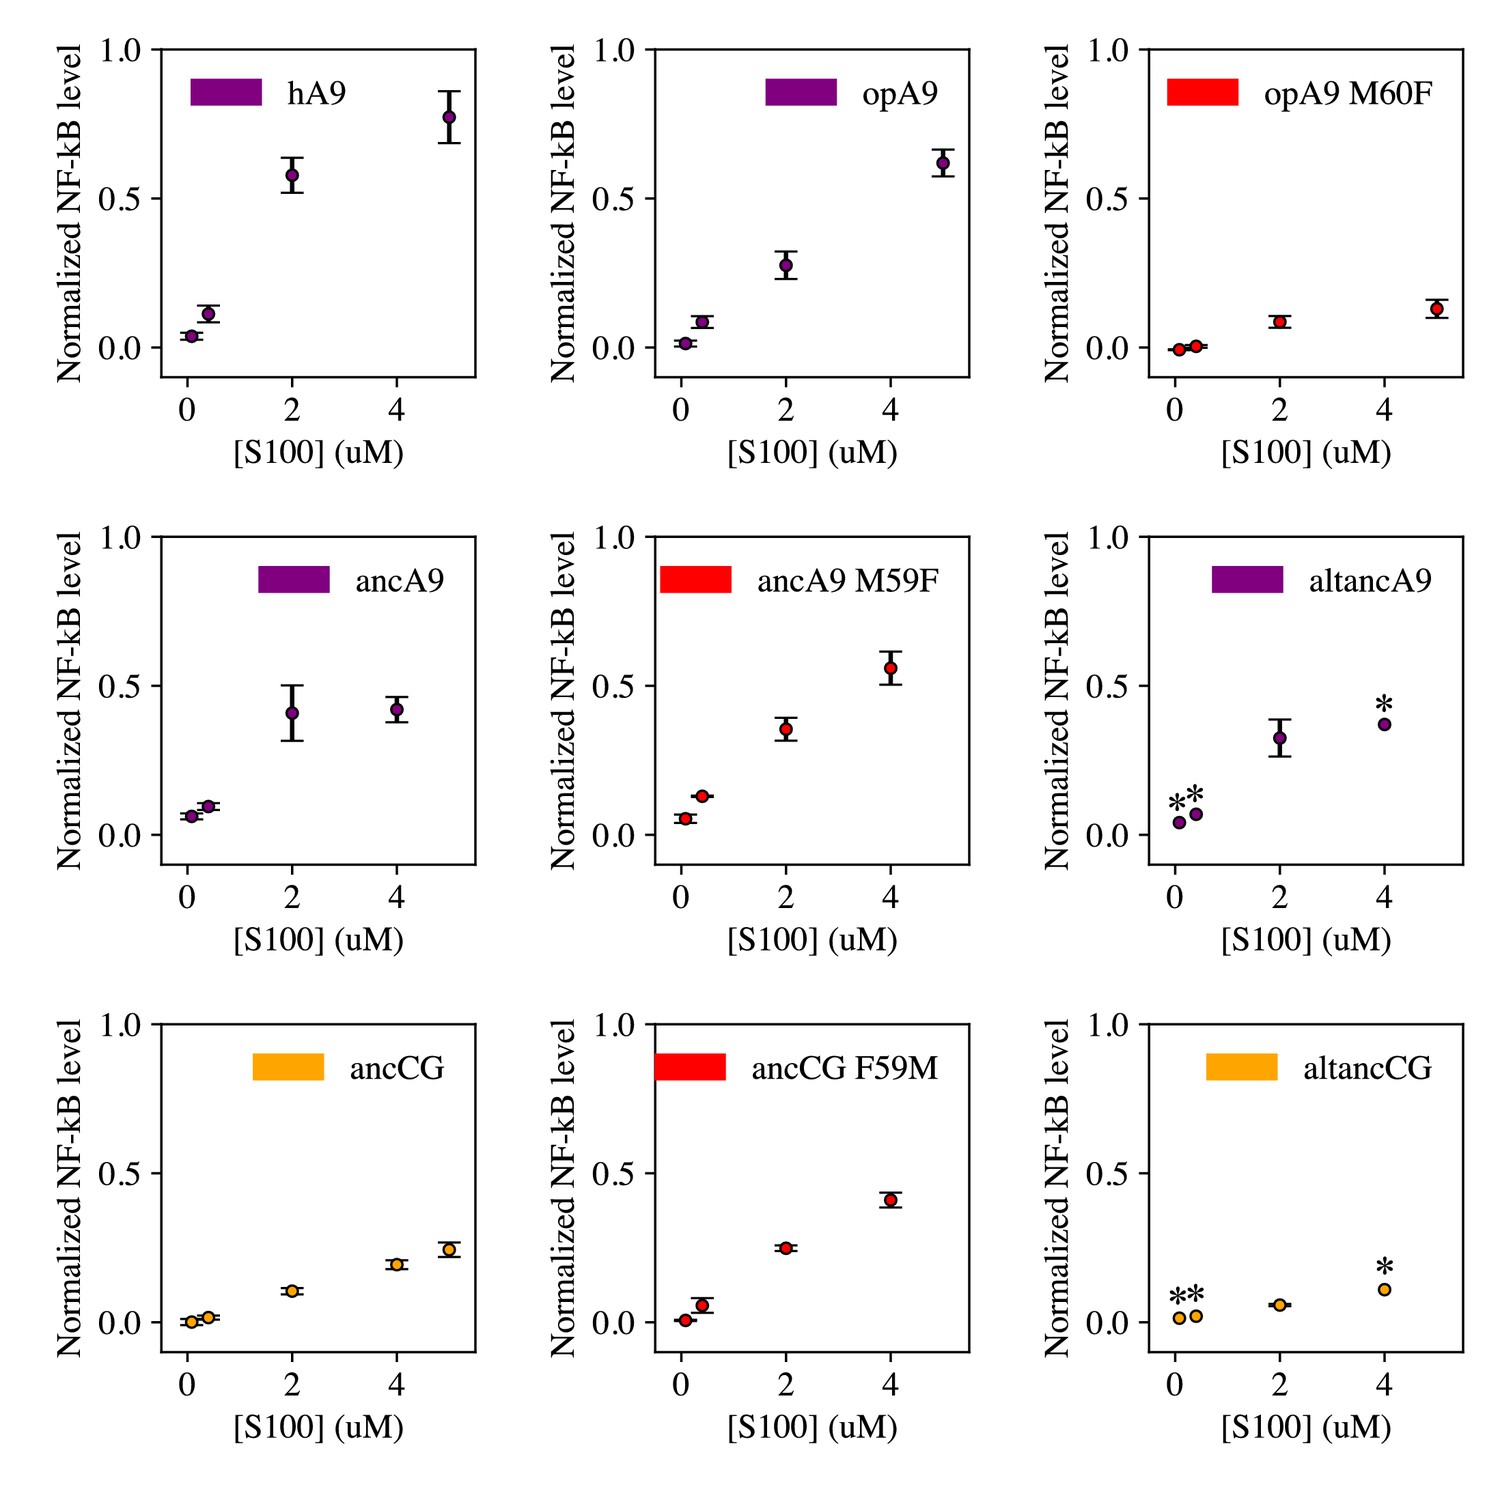
Dose curves for S100 activation of opossum TLR4.
Points are the average of >3 biological replicates each consisting of 3 technical triplicates, error bars are standard error of the mean. An asterisk (*) indicates a concentration at which a single biological replicate was measured. Data were background-subtracted using the LPS + PB control and normalized to LPS activity against opossum TLR4.
Figure 3 with 4 supplements
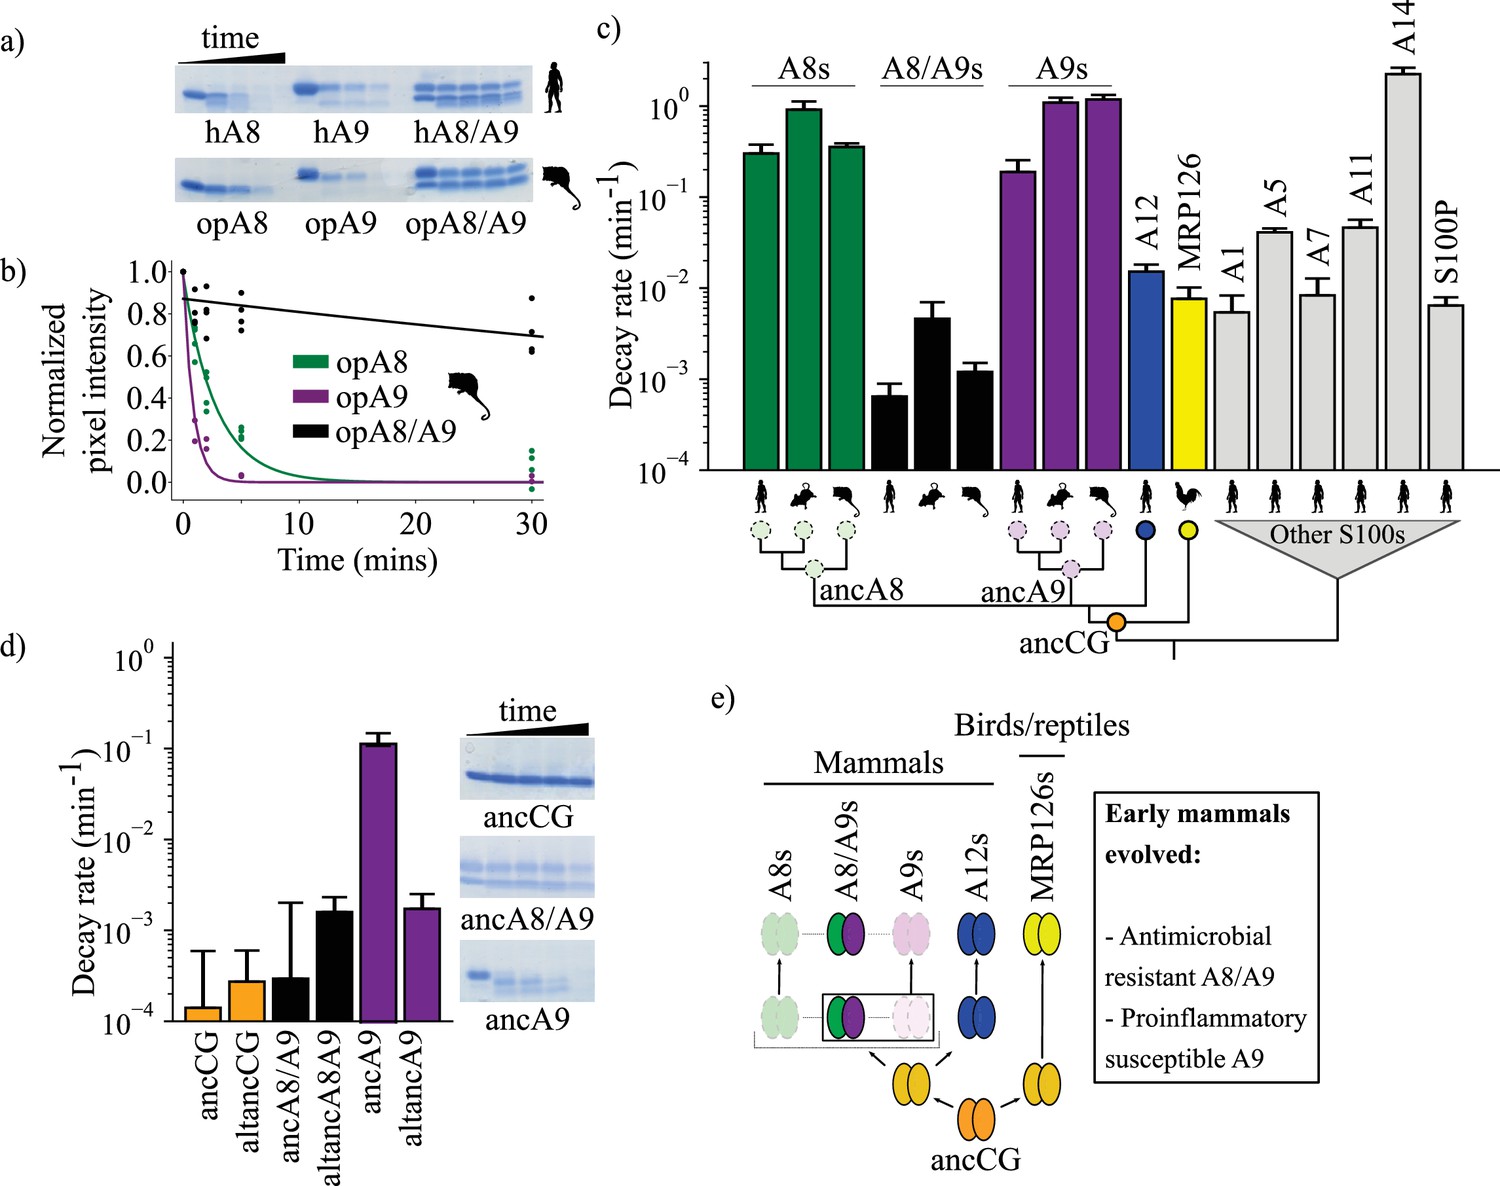
A9s lost proteolytic resistance from a proteolytically resistant amniote ancestor.
(a) In vitro proteolytic resistance assay showing SDS-PAGE gel of S100 protein degradation via proteinase K over time. Gels were quantified using densitometry and normalized to the undigested protein band intensity. (b) A single exponential decay model was globally fit to the data to quantify decay rates. Points are biological replicates, lines are model fit to data. (c) S100 protein proteolysis rates mapped onto schematized S100 phylogeny. X-axis cartoon labels same as in Figure 1. Circles indicate proteolytic susceptibility (faded/dashed) and resistance (solid), with predicted resistance shown for ancA8, ancA9, and ancCG nodes. (d) Decay rates for ancestrally reconstructed proteins, with gels shown on the right. For panels (c) and (d), error bars are the square root of the diagonalized covariance matrix from the fit and the y-axis is in log scale. (e) Summary model for proposed evolution of A9 and A8/A9 innate immune properties. Box around A8/A9 and A9 indicate location in tree (ancestor of therian mammals) where immune functions evolved.
-
Figure 3—source data 1
Proteolytic susceptibility data.
- https://cdn.elifesciences.org/articles/54100/elife-54100-fig3-data1-v2.xlsx
Figure 3—figure supplement 1
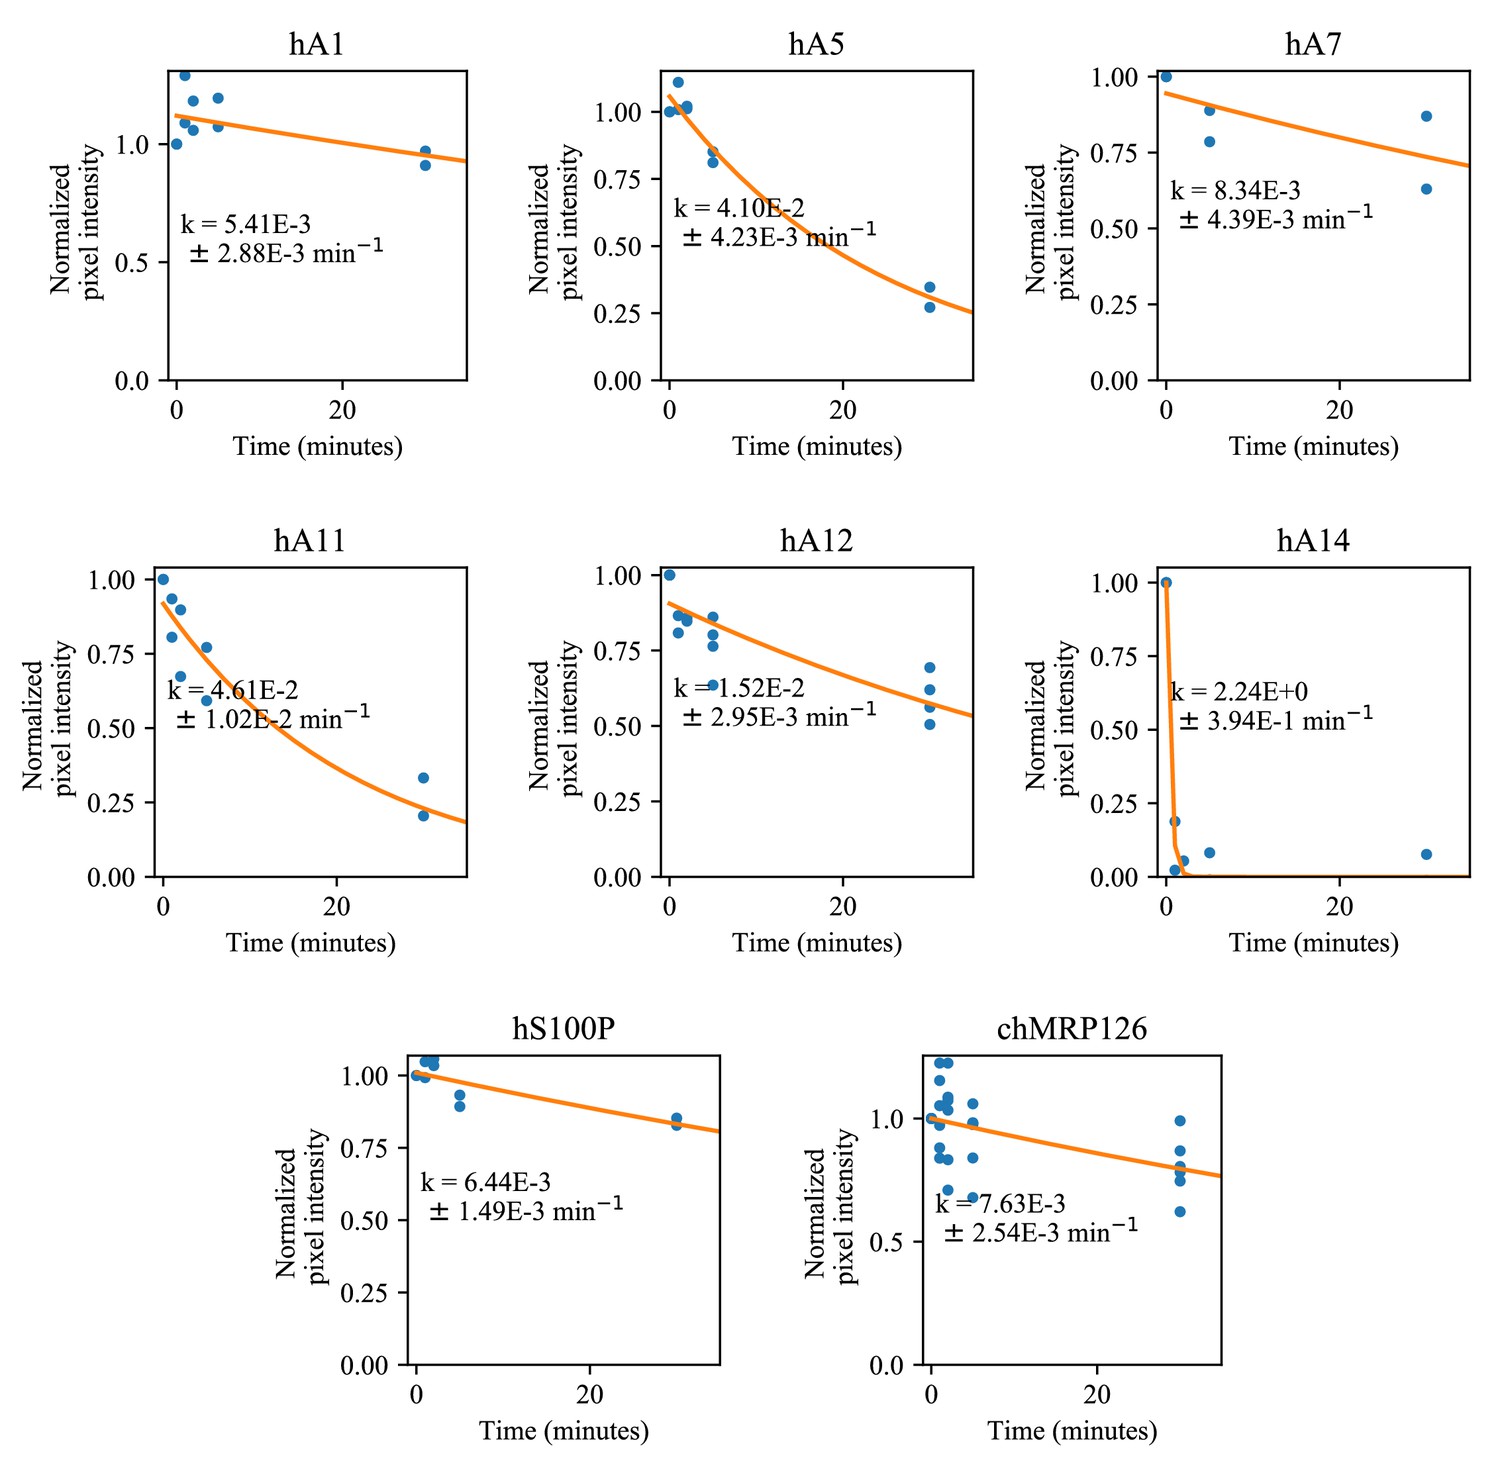
Survey of proteolytic susceptibility across modern S100 proteins.
Blue dots are biological replicates, orange line is a single exponential decay fit (see methods). Protein is listed at the top. Pixel intensity was quantified by densitometry from SDS-PAGE gels.
Figure 3—figure supplement 2
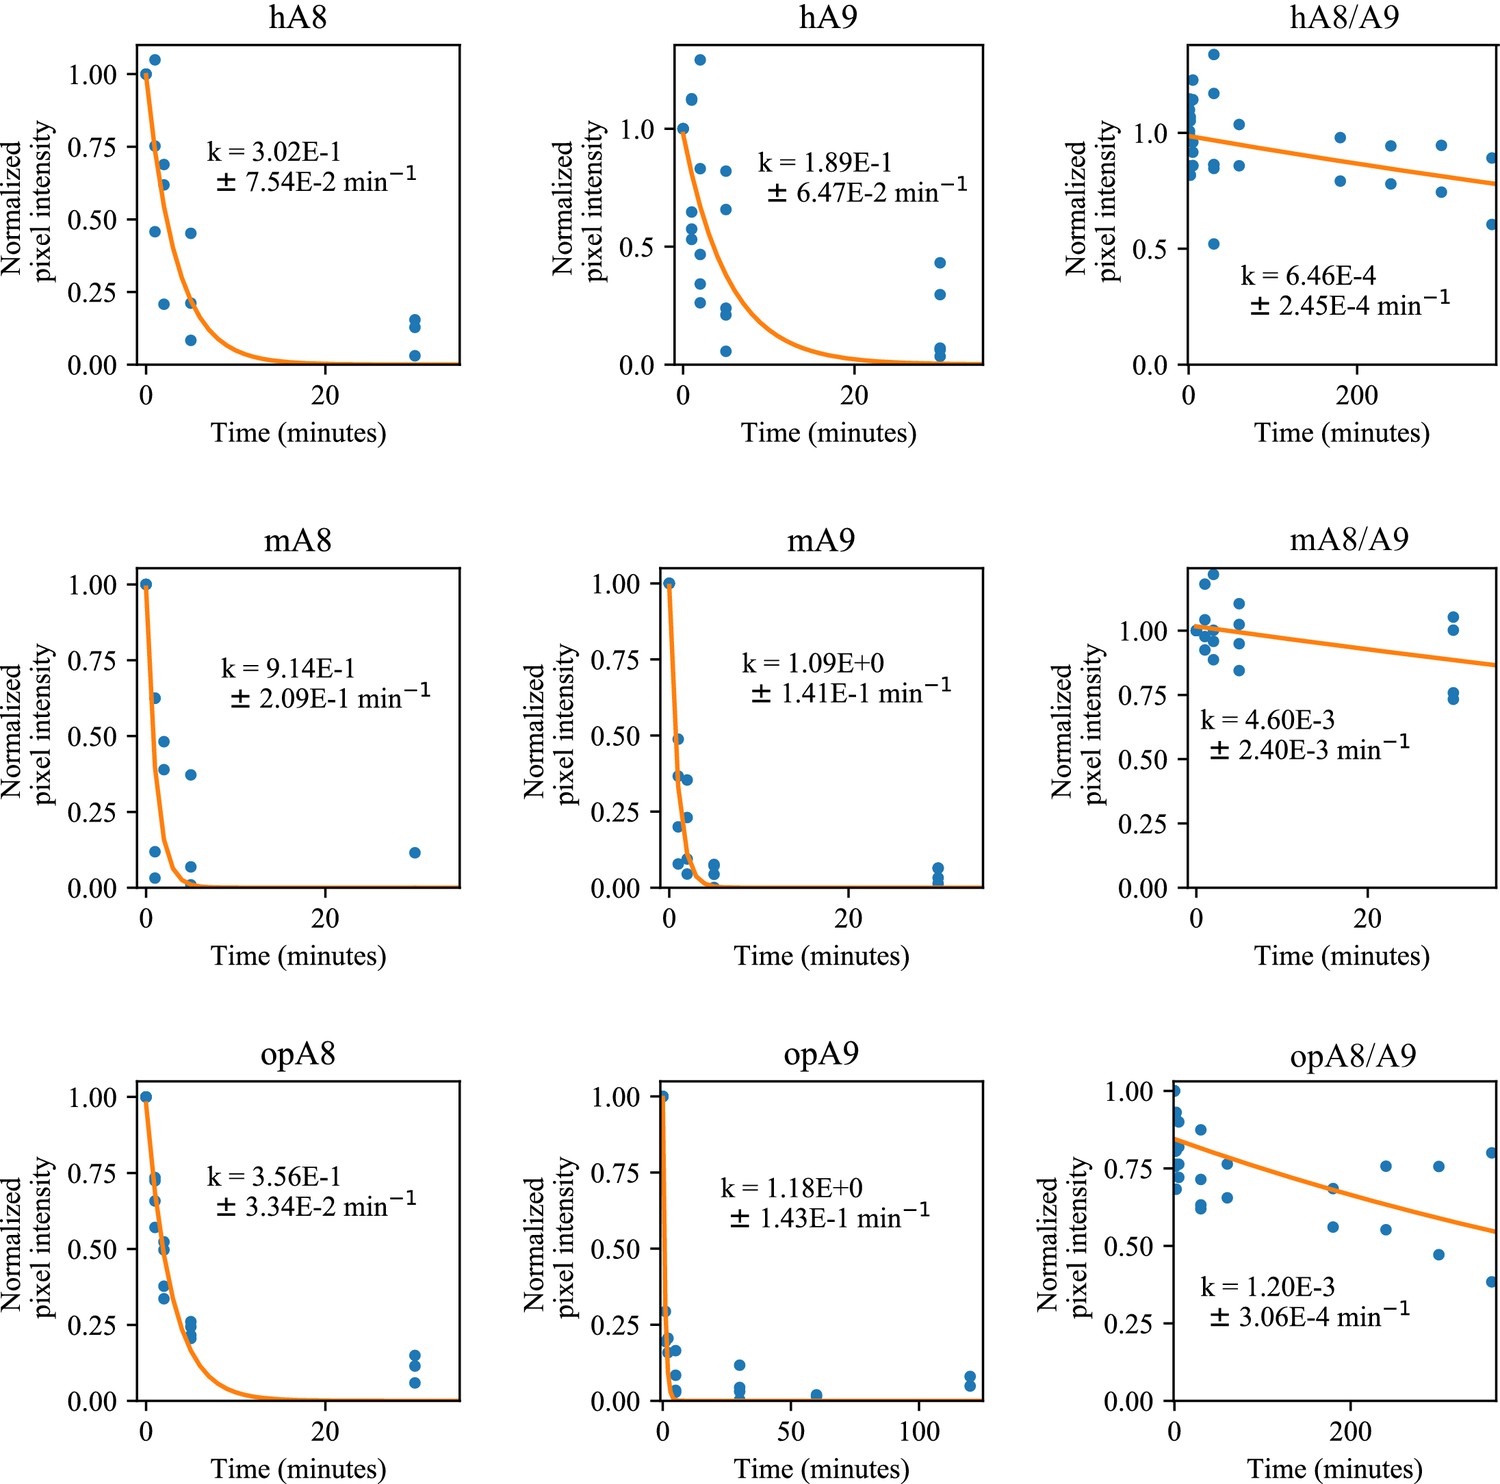
Comparison of proteolytic susceptibility for A8s, A9s, and A8/A9 complexes across mammals.
Blue dots are biological replicates, orange line is a single exponential decay fit (see methods). Protein is listed at the top. Pixel intensity was quantified by densitometry from SDS-PAGE gels. Longer time points were collected for proteins with slower degradation rates (see x-axis).
Figure 3—figure supplement 3
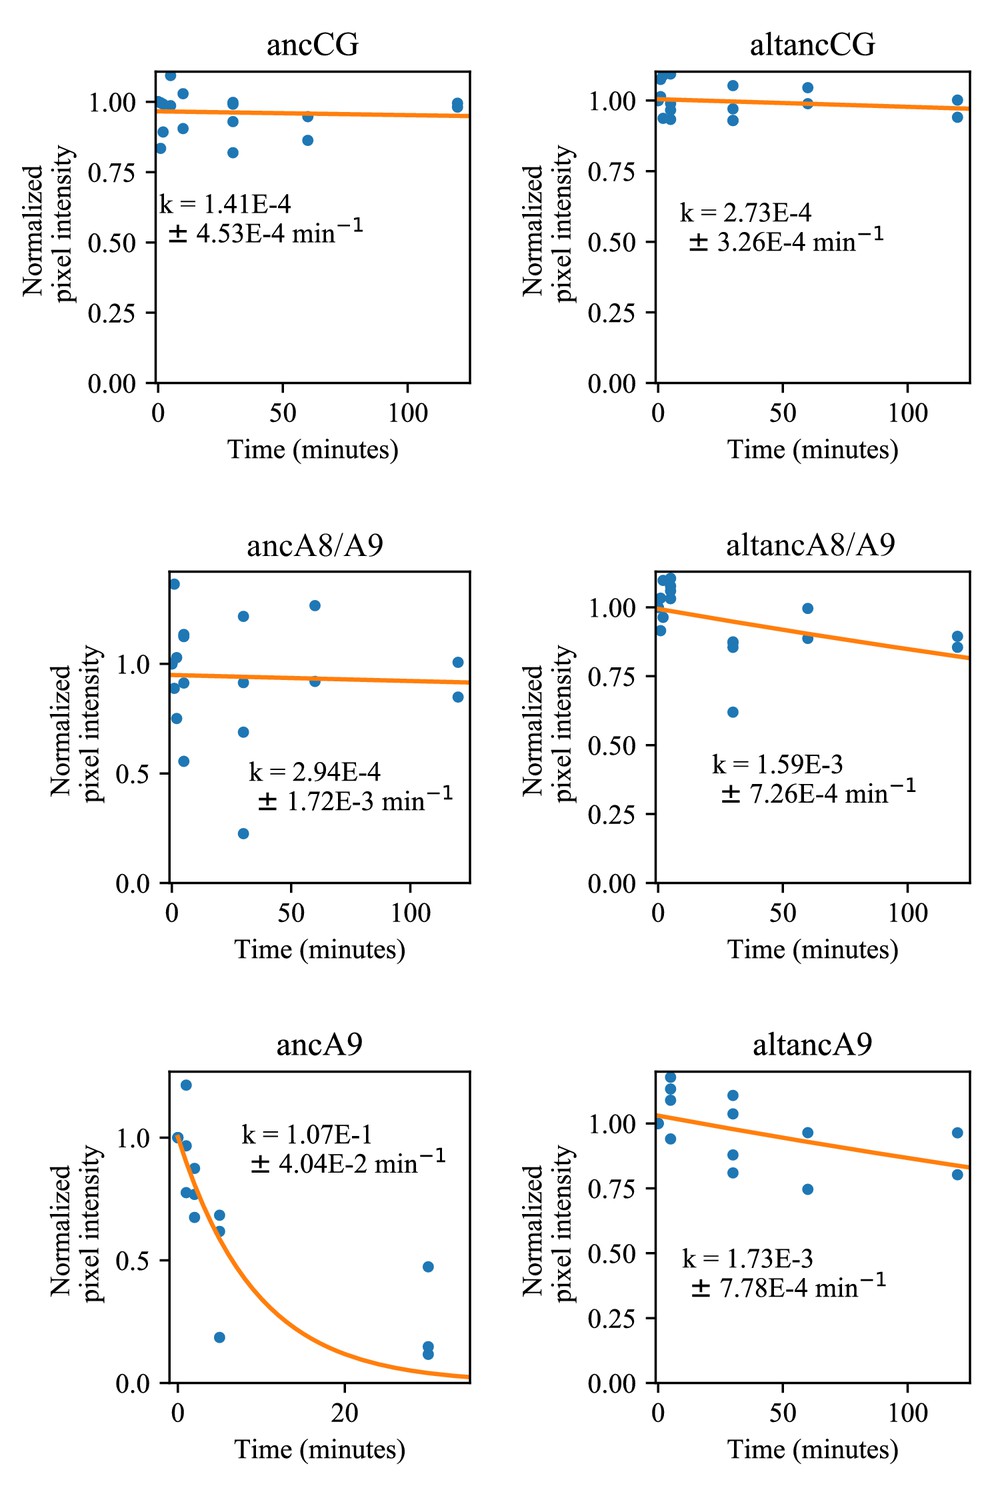
Comparison of proteolytic susceptibility for ancestrally reconstructed S100s.
Blue dots are biological replicates, orange line is a single exponential decay fit (see methods). Protein is listed at the top. Pixel intensity was quantified by densitometry from SDS-PAGE gels. Longer time points were collected for proteins with slower degradation rates (see x-axis).
Figure 3—figure supplement 4
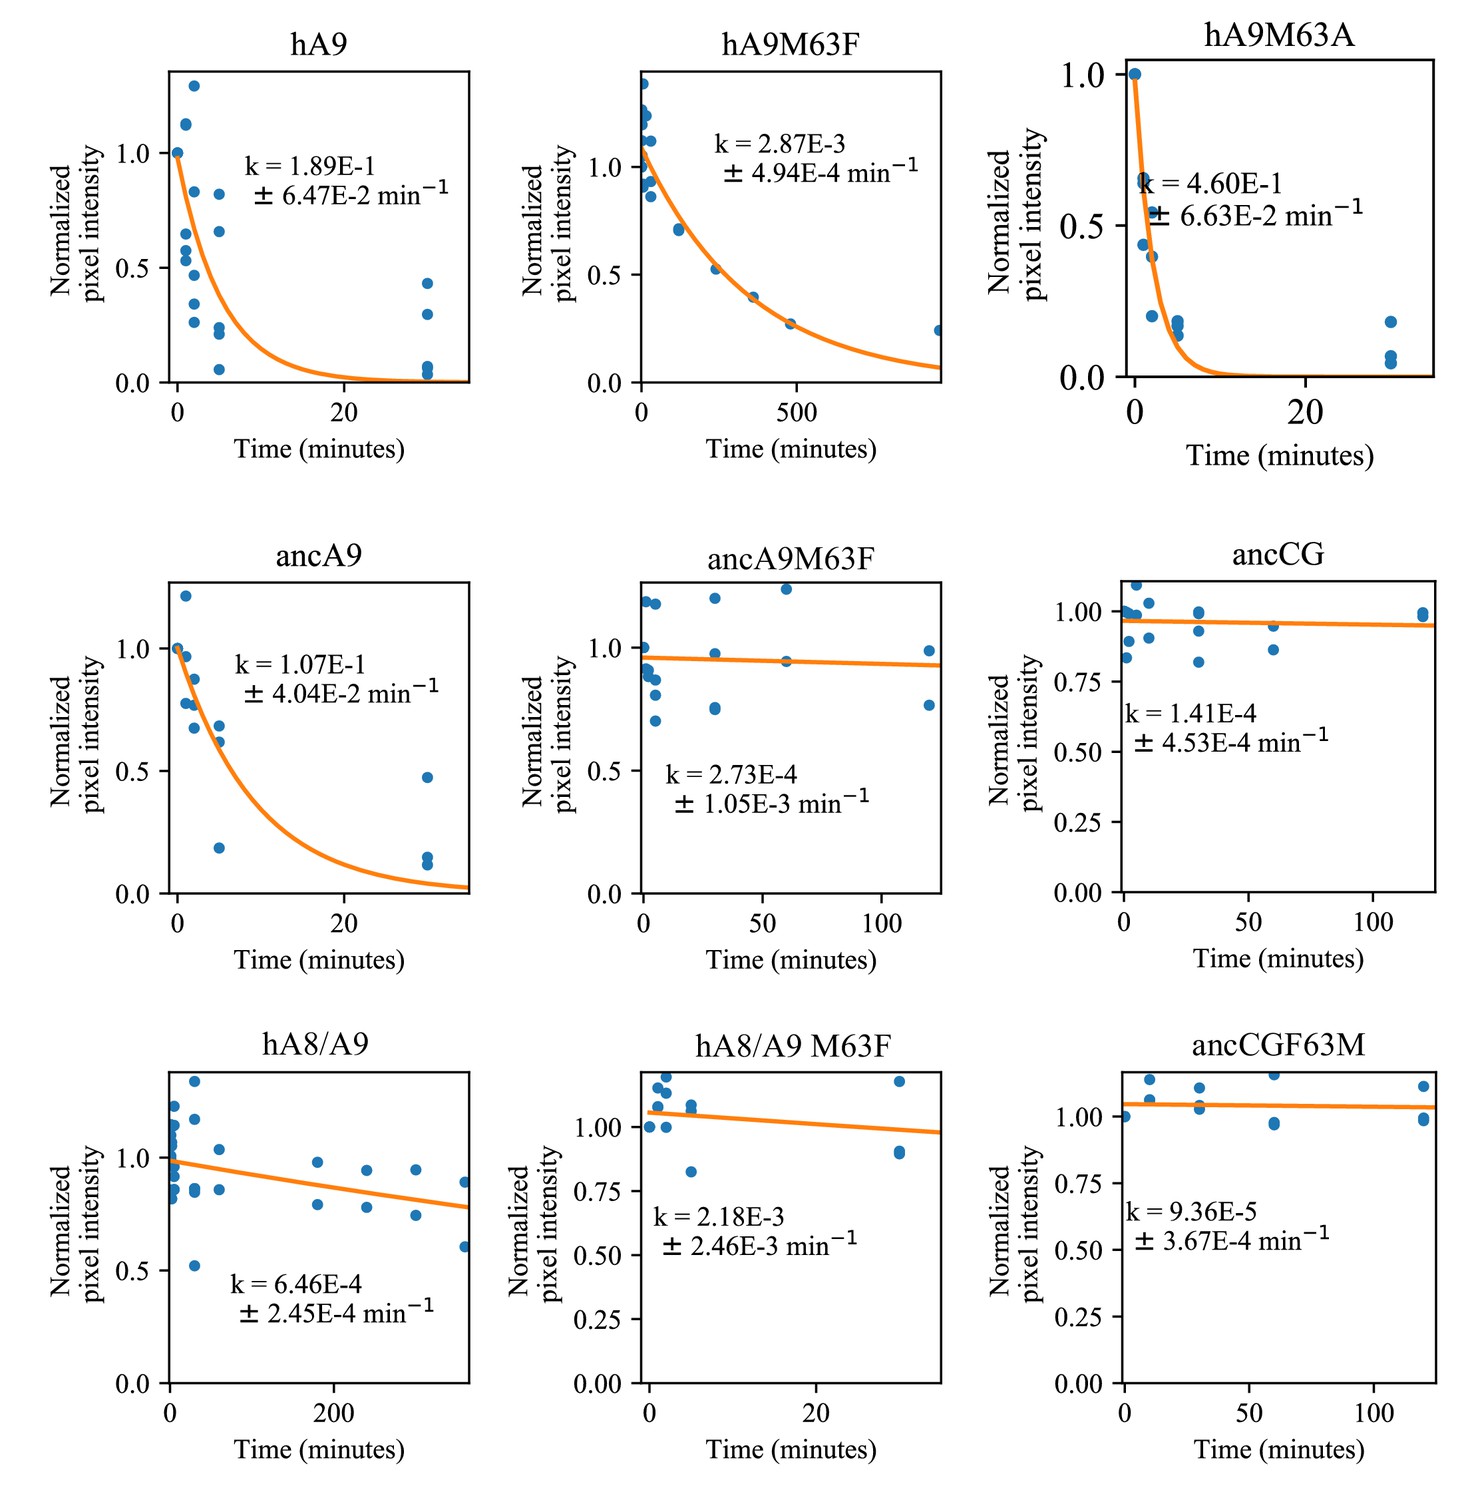
Comparison of proteolytic S100 protein mutants at position 63.
Blue dots are biological replicates, orange line is a single exponential decay fit (see methods). Protein is listed at the top. Pixel intensity was quantified by densitometry from SDS-PAGE gels. Longer time points were collected for proteins with slower degradation rates (see x-axis).
Figure 4 with 2 supplements
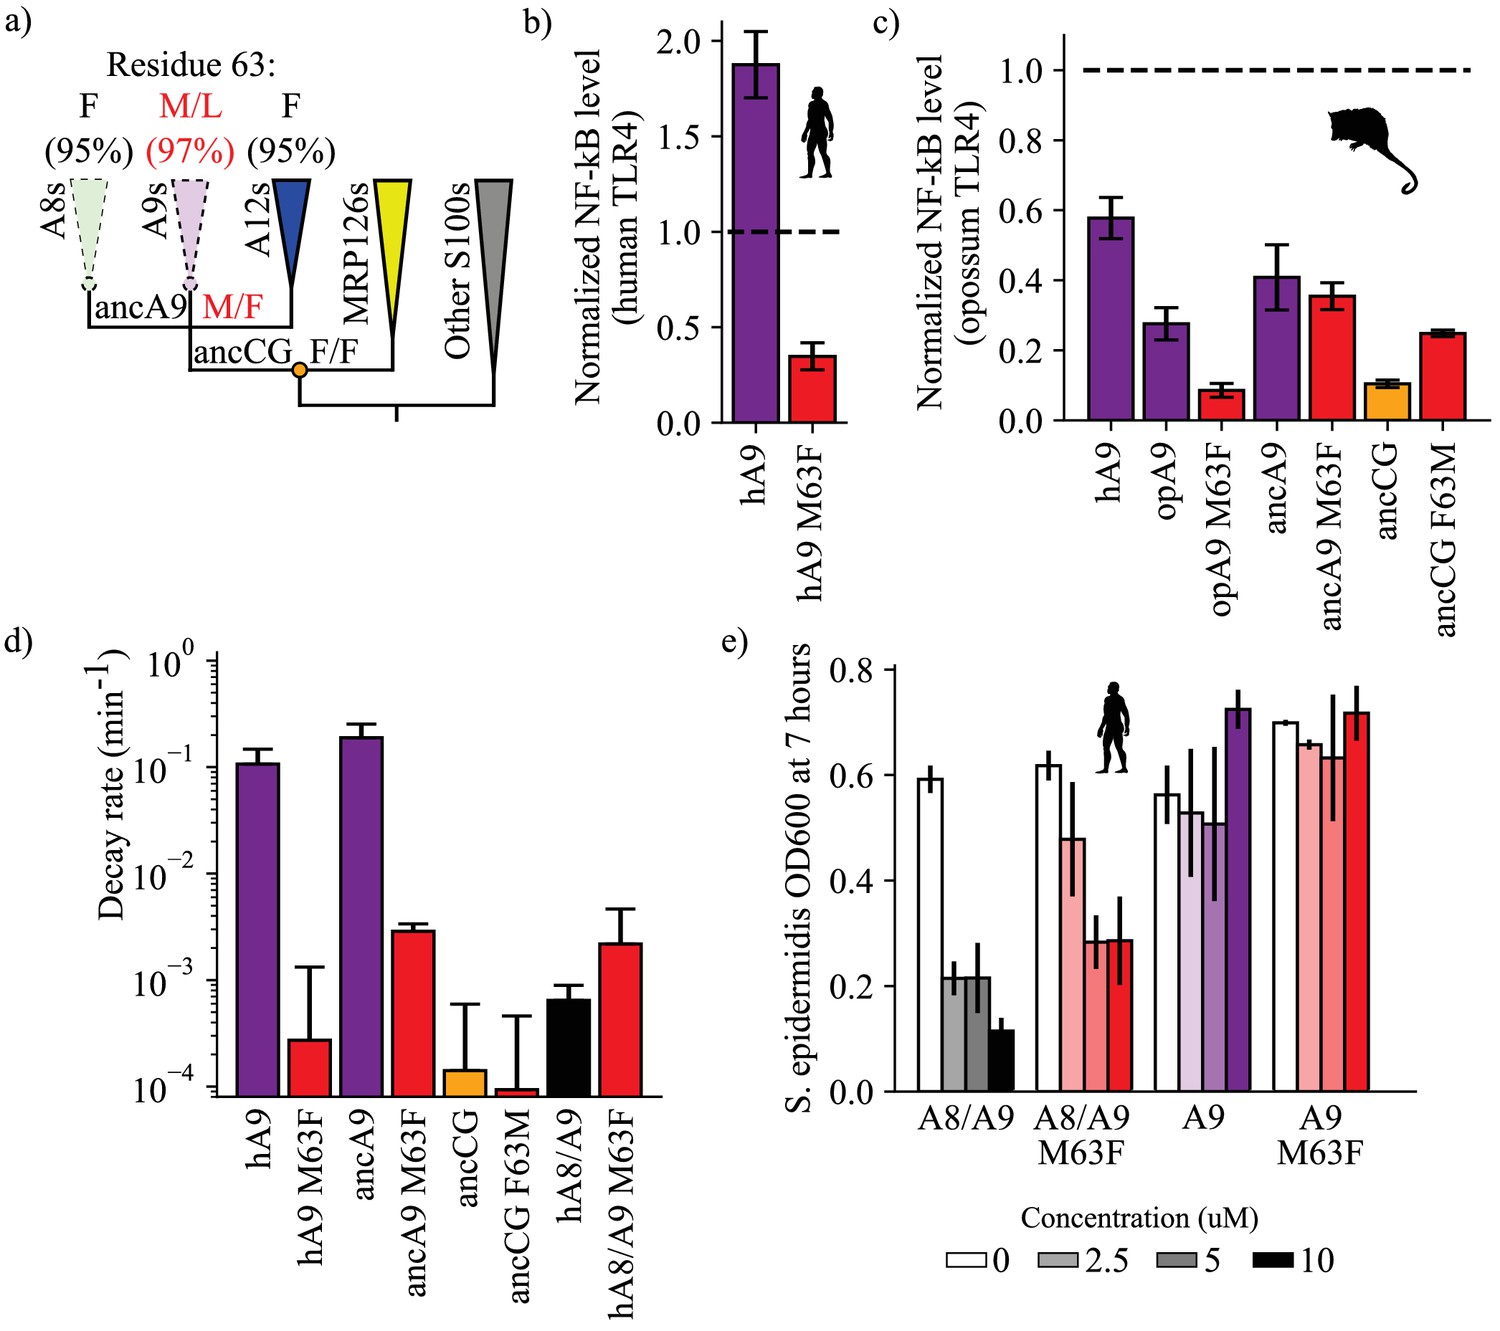
A single historical substitution affects A9 proinflammatory activity and proteolytic resistance without affecting A8/A9 proteolytic resistance or antimicrobial activity.
(a) Schematic S100 phylogenetic tree with the amino acid state of position 63 shown at key nodes. Wedges represent clades, colored as in Figure 1. Lines indicate proteolytic susceptibility (faded/dashed) and resistance (solid). Circles indicate characterized ancestors. Amino acid labels represent maximum likelihood state/alternate amino acid state for position 63 at ancestral nodes, while labels at clade tips represent percent conservation across modern S100 protein sequences. (b–c) NF-κB production of S100 point mutants at position 63 against human (b) and opossum (c) TLR4. (d) Proteolysis rates for S100 point mutants at position 63 (human A9 numbering). Error bars and y-axis are the same as in Figure 1. (e) Antimicrobial activity of hA9 and hA8/A9 with and without M63F mutation against S. epidermidis. Axes and error bars same as in Figure 1d.
-
Figure 4—source data 1
Human TLR4 activation data with point mutants.
- https://cdn.elifesciences.org/articles/54100/elife-54100-fig4-data1-v2.xlsx
-
Figure 4—source data 2
Proteolytic susceptibility data with point mutants.
- https://cdn.elifesciences.org/articles/54100/elife-54100-fig4-data2-v2.xlsx
-
Figure 4—source data 3
Antimicrobial activity data.
- https://cdn.elifesciences.org/articles/54100/elife-54100-fig4-data3-v2.xlsx
-
Figure 4—source data 4
Opossum TLR4 activation data with point mutants.
- https://cdn.elifesciences.org/articles/54100/elife-54100-fig4-data4-v2.xlsx
Figure 4—figure supplement 1
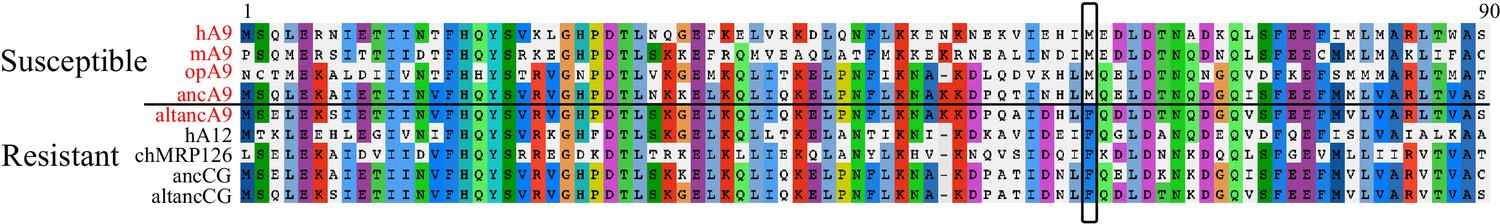
Changes at position 63 correlate with A9 proinflammatory activity and proteolytic resistance.
S100 protein sequences are grouped into proteolytically susceptible (top) or resistant and potently proinflammatory (red text) or not (black text). Only the first 90 residues out of 114 total were examined as the disordered A9 tail (residues ~ 93–114) are highly variable and the tail is dispensable for A9 proinflammatory activity. Residues are colored when found to be the consensus residue for a column.
Figure 4—figure supplement 2
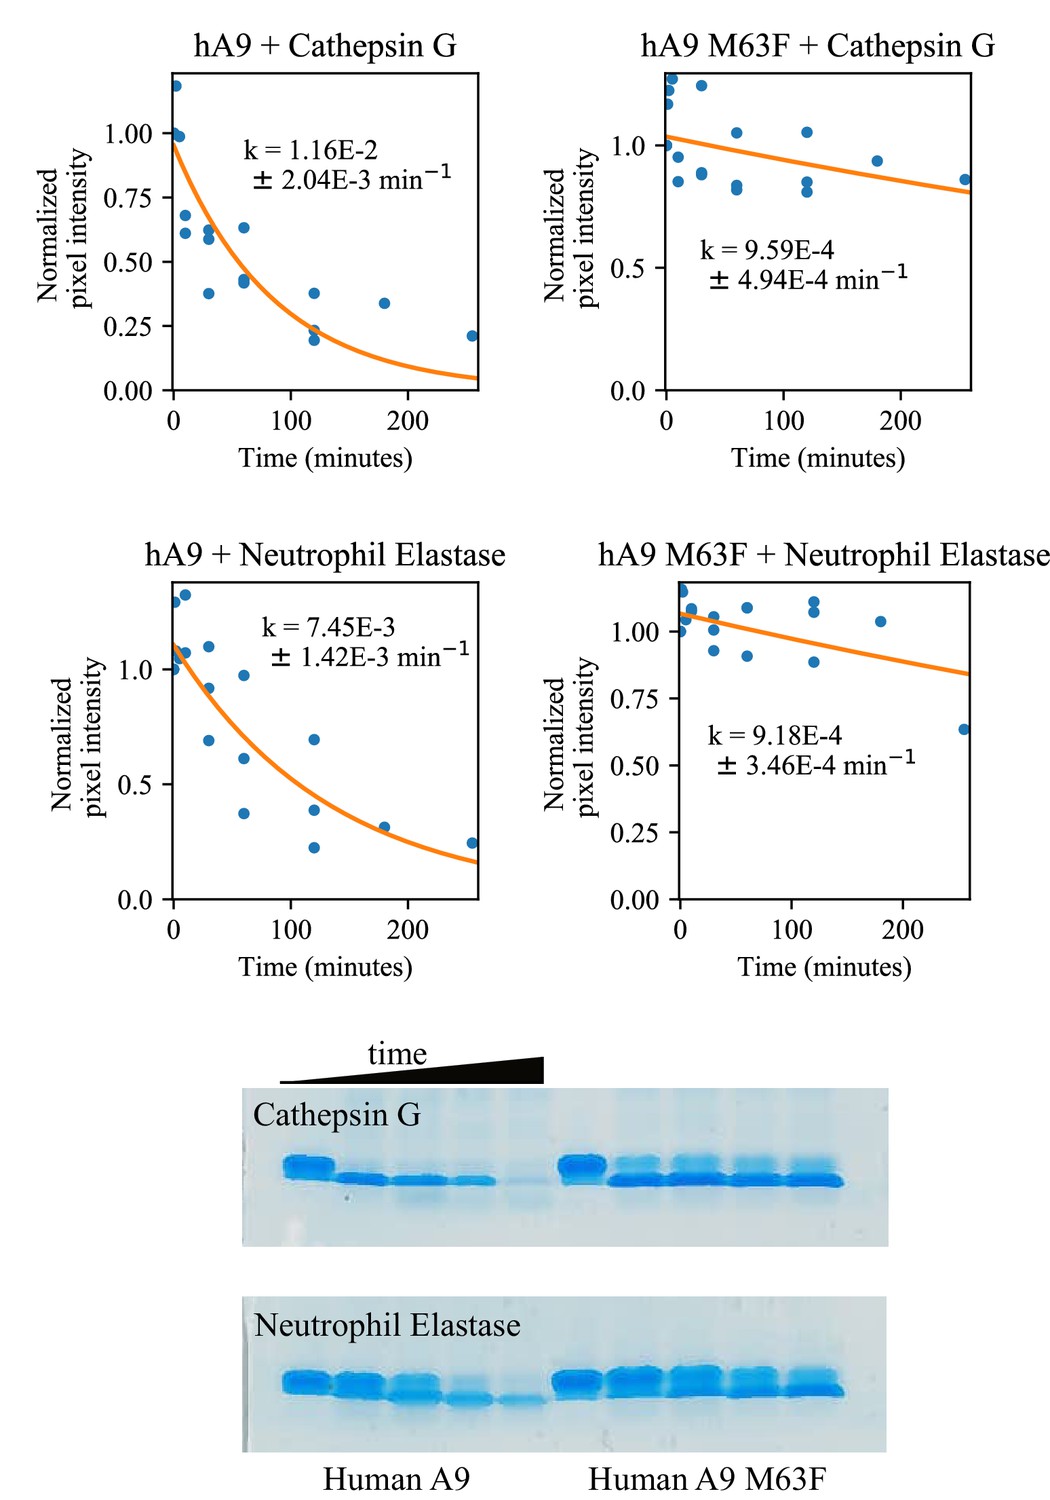
Comparison of human A9 and human A9 M63F proteolytic resistance against human proteases.
Blue dots are biological replicates, orange line is a single exponential decay fit (see methods). Protein is listed at the top of each graph. Pixel intensity was quantified by densitometry from SDS-PAGE gels. Longer time points were collected for proteins with slower degradation rates (see x-axis). Representative SDS-PAGE gels are shown for 0–120 min digestion with each protease.
Figure 5 with 2 supplements
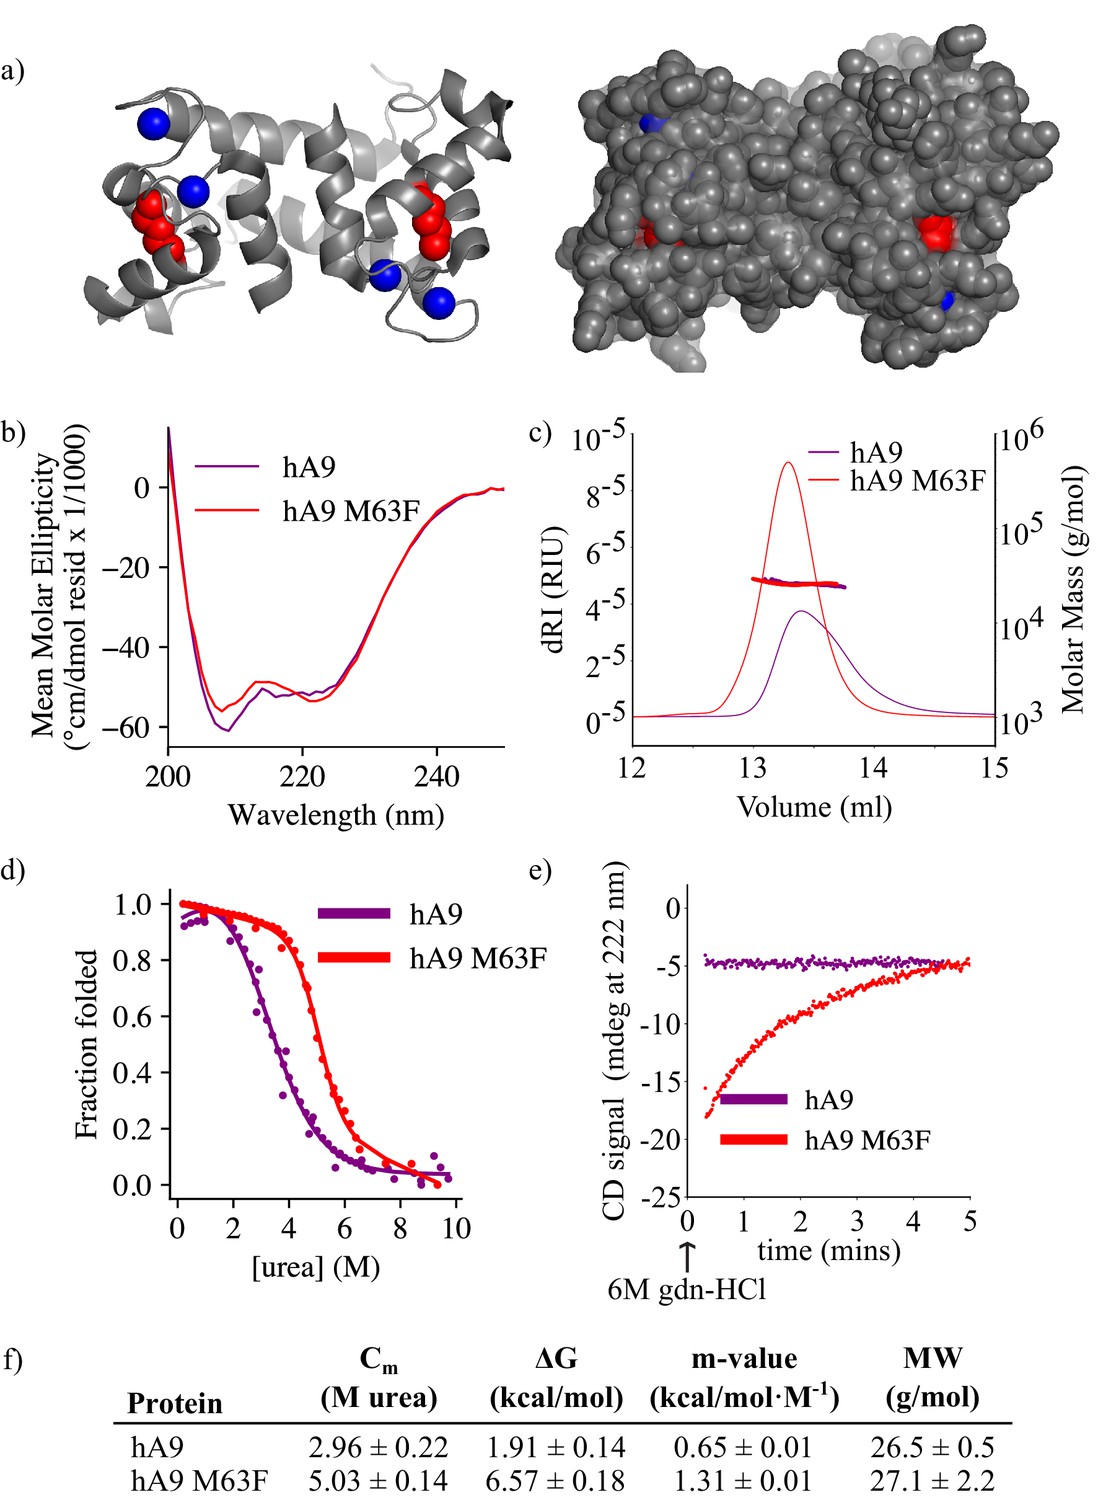
M63F increases human A9 apparent stability by decreasing its unfolding rate.
(a) Crystal structure of hA9 (PDB entry 1irj) (Itou et al., 2002). Cartoon depiction left, surface view right. Calcium ions are blue spheres. M63 is highlighted in red – two total for homodimeric A9. (b) Far-UV circular dichroism (CD) spectroscopy scans of hA9 and hA9 M63F. Data represent average of 3 scans. (c) SEC MALS analysis of hA9 and hA9 M63F oligomeric state. Solid lines are refractive index (left y-axis), points and molecular weights in table below represent molar mass calculated from light scattering detectors using ASTRA software (right y-axis - see methods). (d) Equilibrium chemical denaturation (urea) of 5 µM hA9 and hA9 M63F monitored by CD at 222 nm. Solid lines represent two-state unfolding model fit to data. (e) Kinetics of hA9 and hA9 M63F unfolding via chemical denaturation (guanidinium hydrochloride). Graph depicts one representative unfolding experiment. (f) Thermodynamic parameters estimated from (d) and molecular weights estimated from (c). Errors are standard deviations calculated from fit (see methods).
-
Figure 5—source data 1
CD spectroscopy data.
- https://cdn.elifesciences.org/articles/54100/elife-54100-fig5-data1-v2.xlsx
-
Figure 5—source data 2
CD unfolding kinetics data.
- https://cdn.elifesciences.org/articles/54100/elife-54100-fig5-data2-v2.xlsx
-
Figure 5—source data 3
Chemical denaturation data by CD.
- https://cdn.elifesciences.org/articles/54100/elife-54100-fig5-data3-v2.xlsx
Figure 5—figure supplement 1
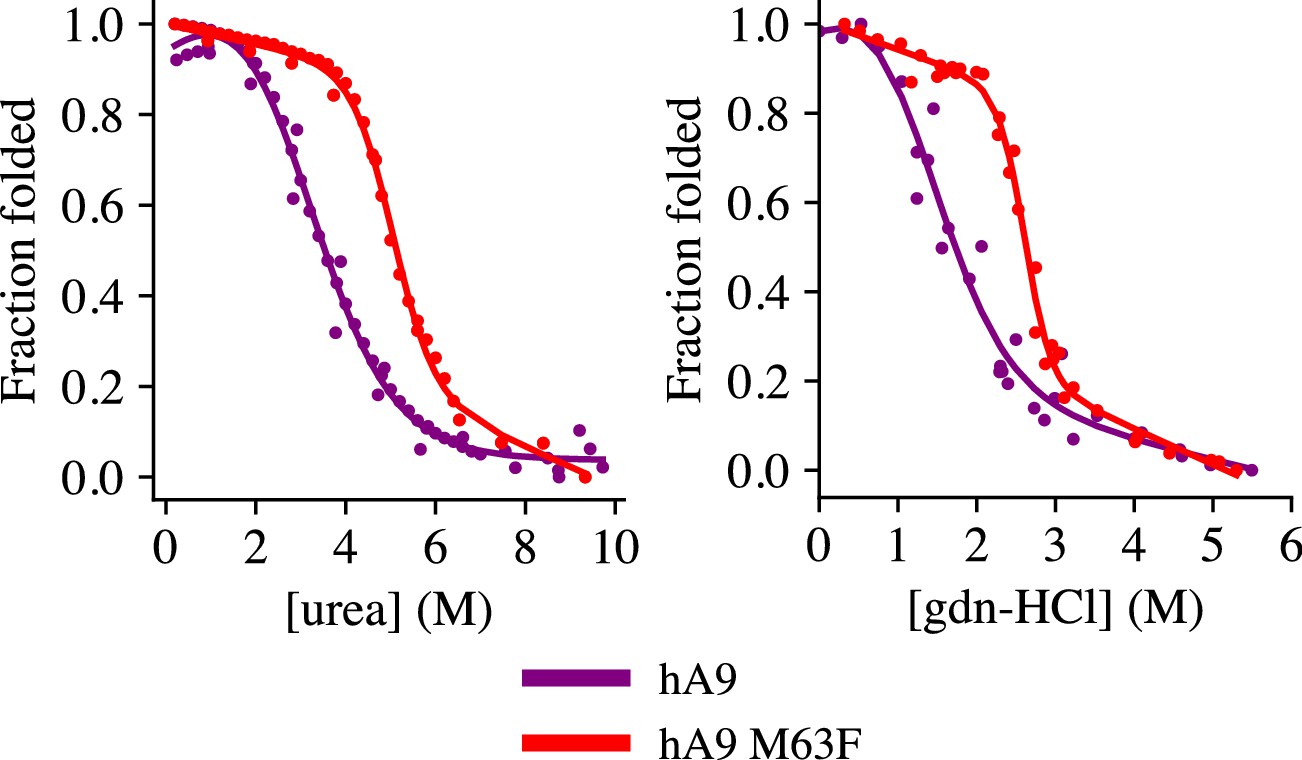
Chemical denaturation of hA9 and hA9 M63F.
Chemical denaturation experiments using urea (left) and guanidinium hydrochloride (right). Graphs represent >3 replicates. Human A9 is shown in purple, A9 M63F in red. An apparent two-state unfolding model was fit to the data to estimate thermodynamic parameters, shown as a solid line.
Figure 5—figure supplement 2
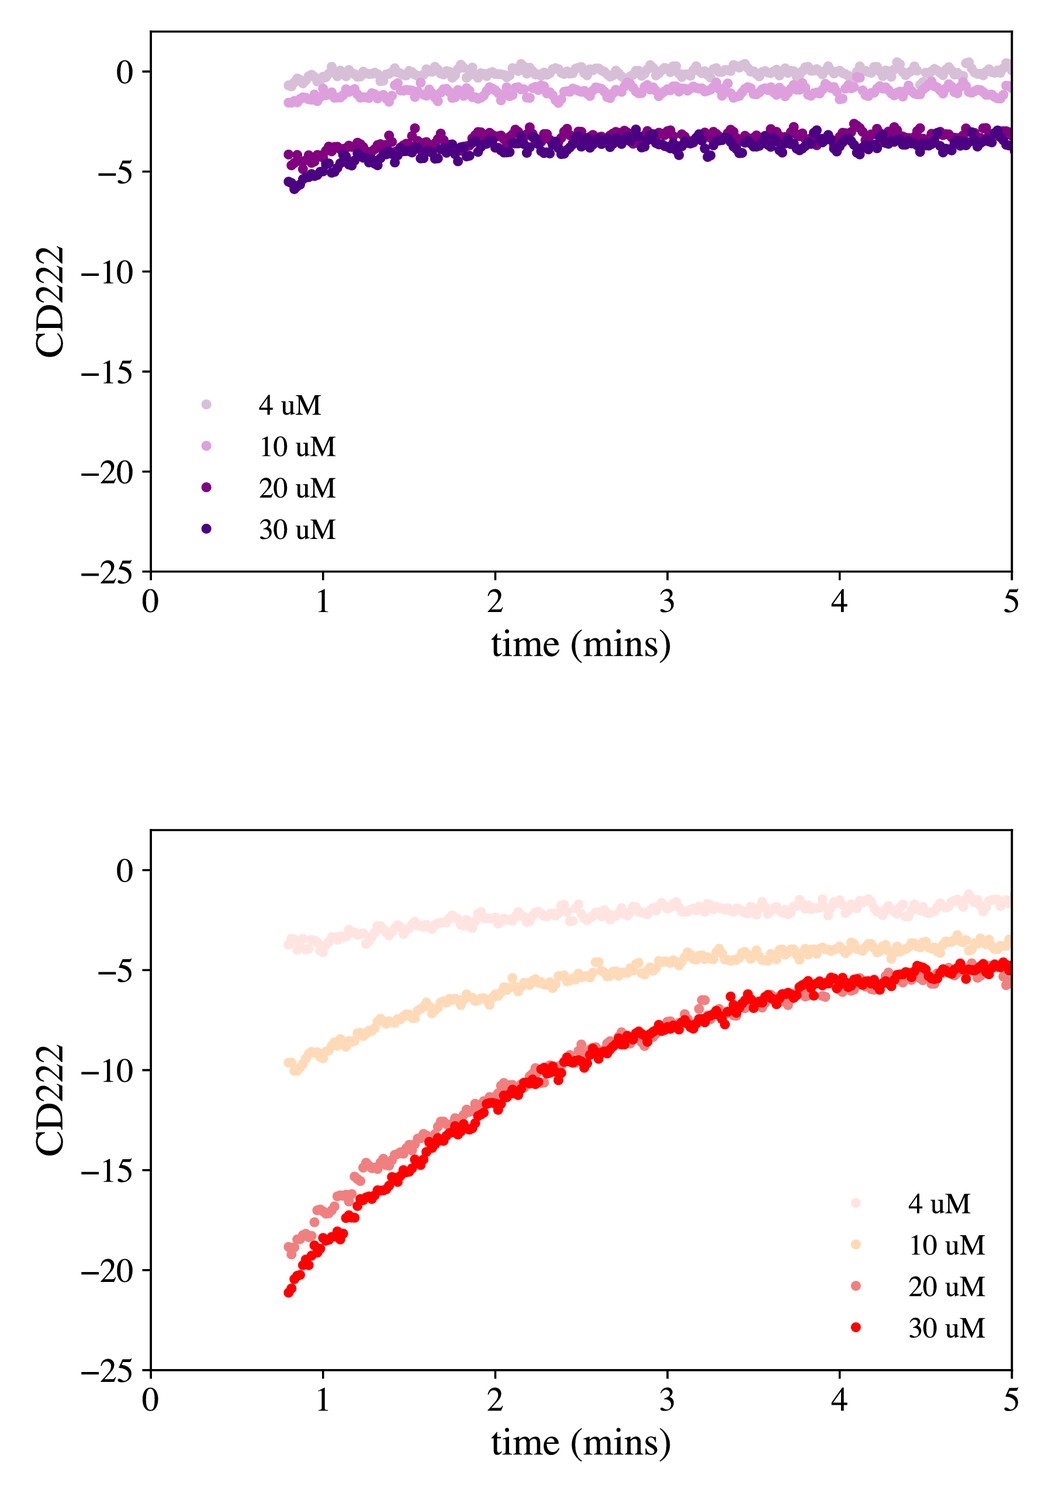
Unfolding kinetics of hA9 and hA9 M63F.
Time course measurement of hA9 (top) and hA9 M63F (bottom) unfolding upon addition of 6M gdn-HCl. Each curve is a single replicate at one concentration, monitoring CD signal at 222 nm (y-axis).
Figure 6

Proteolysis is not required for A9 activation of TLR4.
(a) Proteolytic decay rates for human point mutants at position 63. Error bars and axes are the same as in Figure 3. (b) NF-κB production of human TLR4 in response to treatment with hA9, hA9 M63F, and hA9 M63A. Error bars the same as in Figure 2. (c) Western blot of hA9 and position 63 point mutants before and after proinflammatory activity assay. Left bands represent 10 and 15 kDa ladder. (d) NF-κB production of human TLR4 in response to hA9 and hA9 M63F pre-proteolyzed with proteinase K for increasing amounts of time. Points are biological replicates and are the average of three technical replicates. Western blots below depict the amount of full-length A9 remaining over time. Left blot shows antibody sensitivity to A9, right shows digestion time course samples. Ladder and antibody same as in (c).
-
Figure 6—source data 1
Proteolytic degradation data with hA9 M63A data included.
- https://cdn.elifesciences.org/articles/54100/elife-54100-fig6-data1-v2.xlsx
-
Figure 6—source data 2
TLR4 activation data with M63A included.
- https://cdn.elifesciences.org/articles/54100/elife-54100-fig6-data2-v2.xlsx
Tables
Key resources table
| Reagent type (species) or resource | Designation | Source or reference | Identifiers | Additional information |
|---|---|---|---|---|
| Software, algorithm | PAML4 | Yang, 2007 | For ancestral sequence reconstruction | |
| Software, algorithm | PhyML | Guindon et al., 2010 | Published tree details in Loes et al., 2018 | |
| Recombinant DNA reagent | pETDuet-1 (plasmid) | Millipore | 71146–3 | For S100 protein recombinant expression |
| Recombinant DNA reagent | pET His6 MBP TEV LIC (plasmid) | Addgene | 29656 | For S100 protein recombinant expression |
| Strain, strain background (Escherichia coli) | XL10-Gold Ultracompetent Cells | Agilent Technologies | 200315 | For plasmid storage/propagation |
| Strain, strain background (Escherichia coli) | Rosetta(DE3)pLysS Competent Cells | Millipore | 70956–3 | For recombinant protein expression |
| Commercial assay, kit | QuickChange Lightning Kit | Agilent Technologies | 210519 | For mutagenesis |
| Peptide, recombinant protein | Proteinase K from Tritirachium album | Sigma Aldrich | P2308 | |
| Peptide, recombinant protein | Cathepsin G from human neutrophils | Athens research | 16-14-030107 | |
| Peptide, recombinant protein | Neutrophil elastase from human neutrophils | Millipore Sigma | 324681 | |
| Software, algorithm | Gelquant | This paper | Python-based scripts for gel densitometry analysis | |
| Cell line (Homo sapiens) | HEK293T/17 | ATCC CRL-11268 | For transient transfections | |
| Transfected construct (human) | Human TLR4 | Addgene | #13086 | |
| Transfected construct (human) | Human CD14 | Addgene | #13654 | |
| Transfected construct (human) | ELAM-Luc | Addgene | #13029 | |
| Transfected construct (human) | Human MD2 | DNASU repository | HsCD00439889 | |
| Transfected construct (human) | Opossum TLR4 | Genscript | Loes et al., 2018 (UniProt #F6Y6W8) | In pcDNA3.1(+) backbone |
| Transfected construct (human) | Opossum MD2 | Genscript | Loes et al., 2018 (UniProt #F6QBE6) | In pcDNA3.1(+) backbone |
| Transfected construct (human) | Opossum CD14 | Genscript | Loes et al., 2018 (NCB Accession #XP_007473804.1) | In pcDNA3.1(+) backbone |
| Biological sample (Escherichia coli) | K-12 LPS | Invivogen | tlrl-eklps | |
| Commercial assay, kit | Dual-Glo luciferase assay system | Promega | E2940 | |
| Chemical compound, drug | Polymyxin B | Sigma Aldrich | P4932-1MU | |
| Peptide, recombinant protein | Agarose-immobilized proteinase K | Sigma Aldrich | P9290-10UN | |
| Antibody (mouse monoclonal) | Anti-S100A9 M13 Clone 1CD22 (monoclonal) | Abnova | H00006280-M13 | WB 1:1000 |
| Antibody (goat polyclonal) | IRDye Goat anti-mouse 800CW IgG (H+L) | Licor | 926–32210 | WB 1:10,000 |
Additional files
-
Supplementary file 1
Alignment of modern and ancestrally reconstructed S100 proteins used in this study.
- https://cdn.elifesciences.org/articles/54100/elife-54100-supp1-v2.docx
-
Supplementary file 2
Species-corrected tree used for ancestral sequence reconstruction.
- https://cdn.elifesciences.org/articles/54100/elife-54100-supp2-v2.docx
-
Transparent reporting form
- https://cdn.elifesciences.org/articles/54100/elife-54100-transrepform-v2.docx
Download links
A two-part list of links to download the article, or parts of the article, in various formats.
Downloads (link to download the article as PDF)
Open citations (links to open the citations from this article in various online reference manager services)
Cite this article (links to download the citations from this article in formats compatible with various reference manager tools)
Evolution of multifunctionality through a pleiotropic substitution in the innate immune protein S100A9
eLife 9:e54100.
https://doi.org/10.7554/eLife.54100


