Calcium-stimulated disassembly of focal adhesions mediated by an ORP3/IQSec1 complex
- Department of Cell Biology, University of Virginia Health System, United States
- Department of Molecular Biology, University of Texas Southwest Medical Center, United States
- Howard Hughes Medical Institute, United States
- Department of Chemical Engineering, University of Virginia, United States
- Department of Biochemistry and Molecular Biology, Virginia Commonwealth University, United States
Figures
Figure 1 with 1 supplement
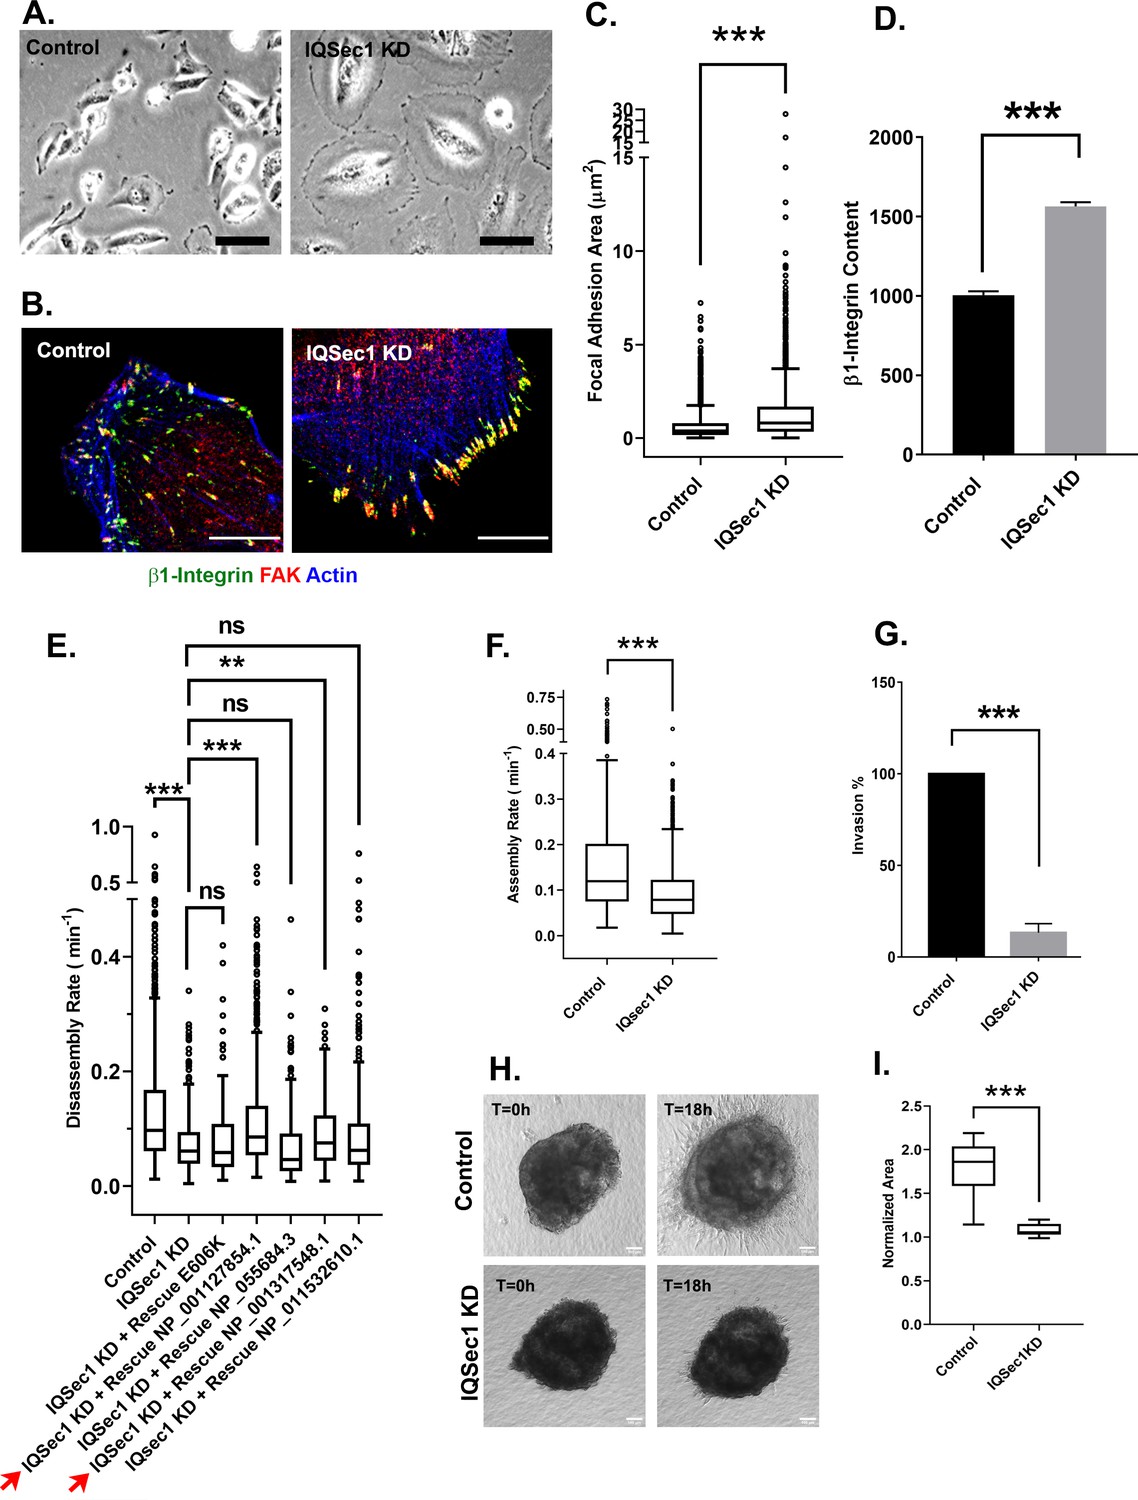
IQSec1 promotes focal adhesion disassembly in MDA-MB-231 cells.
(A) Bright field images of control and IQSec1 depleted cells, Bar = 20 µm. (B) Control and IQSec1 depleted cells, fixed and stained for β1-integrin (green), FAK (red) and actin (blue), Bar = 10 µm. (C) Quantitation of FA size from control and IQSec1-depleted cells. Cells were fixed and stained for vinculin as a marker for FAs; N for control = 2487 and for IQSec1 KD = 1805 FAs were measured. 30 cells were analyzed per group, compiled from three independent experiments. (D) Quantitation of β1-integrin fluorescence in FAs from control and IQSec1 depleted cells. N for control = 1938 control and for IQSec1 KD = 827 FAs. 5 cells were analyzed per group. (E) Rescue of IQSec1 depletion by IQSec1 variants. FA disassembly rates were measured in MDA-MB-231 cells expressing GFP-paxillin (See Videos 1 and 2). Cells were depleted of endogenous IQSec1 using a hairpin directed against a sequence shared by all isoforms, then transfected with constructs encoding each individual isoform, engineered to lack the shRNA target sequence. E606K is a catalytically inactive mutant of isoform C (NP_001127854.1). Both NP_001127854.1 and NP_001317548.1 (red arrows) increase FA turnover, although the rescue never reaches control levels. Both NP_055684.3 and NP_001317548.1 are similar to the catalytically inactive E606K mutant and do not rescue. N for control = 1280, IQSec1 KD = 1150, IQSec1 KD+ WT Rescue NP_001127854.1 = 817, IQSec1 KD+ Rescue E606K = 602, IQSec1 KD + Rescue NP_055684.3 = 336, IQSec1 KD + Rescue NP_001317548.1 = 447, IQSec1 KD + Rescue NP_001317548.1 = 561 FAs. Data were collected from 20 control and 20 IQSec1-KD cells and 12 cells per group for others. Data were compiled from three independent experiments. (F) FA assembly rates in cells expressing GFP-paxillin. N for control = 689 and for IQSec1 KD = 763 FAs. Data were collected from 12 cells per group spanning three independent experiments. (G) Migration of control or IQSec1-depleted cells through a matrigel plug. Migration was measured as described in Methods. Data were compiled from three independent experiments, each done in triplicate. (H) Migration of cells out of tumor spheroids embedded in collagen gels. Stills from time lapse movies of tumor spheroids cultured in 3D collagen gels, imaged for 18 hr. Bar = 100 µm. (I) Quantitation of cell migration out of spheroids after 18 hr. Measurement details are described in Methods. Data were collected from 12 spheroids from each group. ‘*’ indicates p<0.05, ‘**’ indicates p<0.001, and ‘***’ indicates p<0.0001. The same annotation is used in all following figures.
Figure 1—figure supplement 1
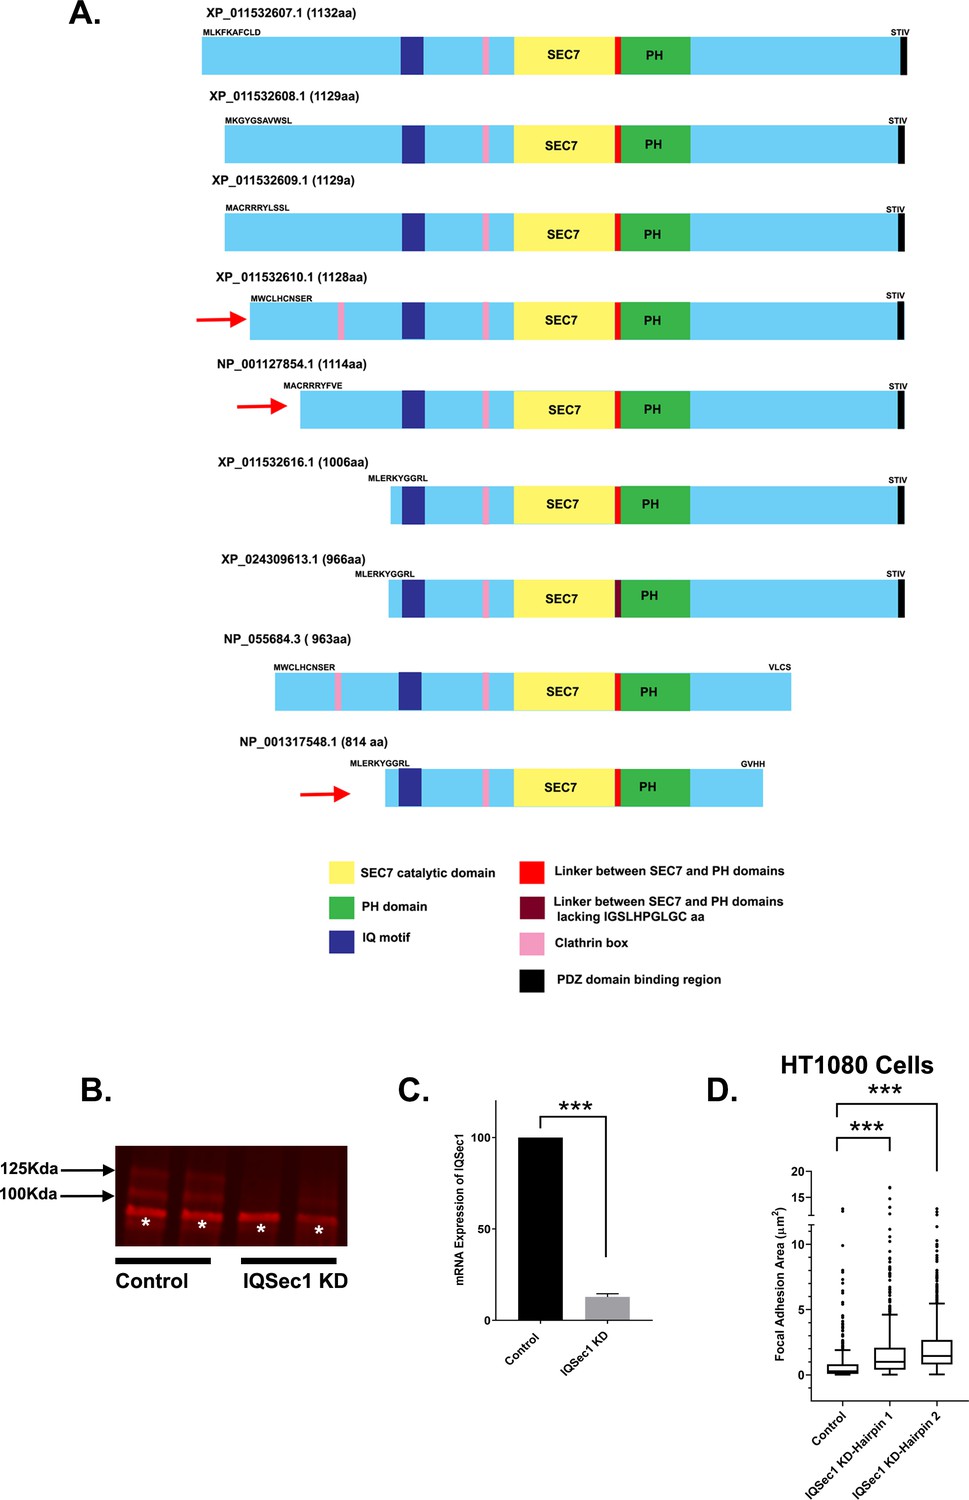
IQSec1 splice variants, expression in MDA-MB-231 cells and knockdown efficiency.
(A) Domain organization of IQSec1 splice variants. Red arrow indicates splice variants experimentally validated by RT-PCR analysis to be present in MDA-MB-231 cells. Note the approximate molecular weight of isoform A (NP_001127854.1) is 122 kDa, isoform X5 (XP_011532610.1) is 124 kDa and isoform C (NP_001317548) is 91 kDa. Note that the NCBI protein database also reports three variants XP_011532613.1, XP_011532614.1 and XP_011532615.1 which are identical in protein sequence to XP_011532616.1, and XP_024309614.1, which has an identical sequence to NP_001317548.1, shown in this figure. (B) Knockdown efficiency of IQSec1 isoforms. MDA-MB-231 cells were treated with shRNA targeting a region common to all splice variants of IQSec1. Endogenous IQSec1 was immunoprecipitated from cell lysates and immunoprecipitates were probed using the same antibody (see Methods). Note the loss of protein corresponding to approximate molecular weights of 125 and 100 kDa. The band marked as ‘*’ appears to be a non-specific product. (C) Quantitation of IQSec1 mRNA using real time qPCR. (D) Quantitation of FA size from control and IQSec1-depleted HT1080 cells, fixed and stained for vinculin as a marker for FAs. N for control = 733 FAs, IQSec1 KD hairpin1 = 816, IQSec1 KD-hairpin2 = 822. 10 cells were analyzed per group.
Figure 2 with 1 supplement
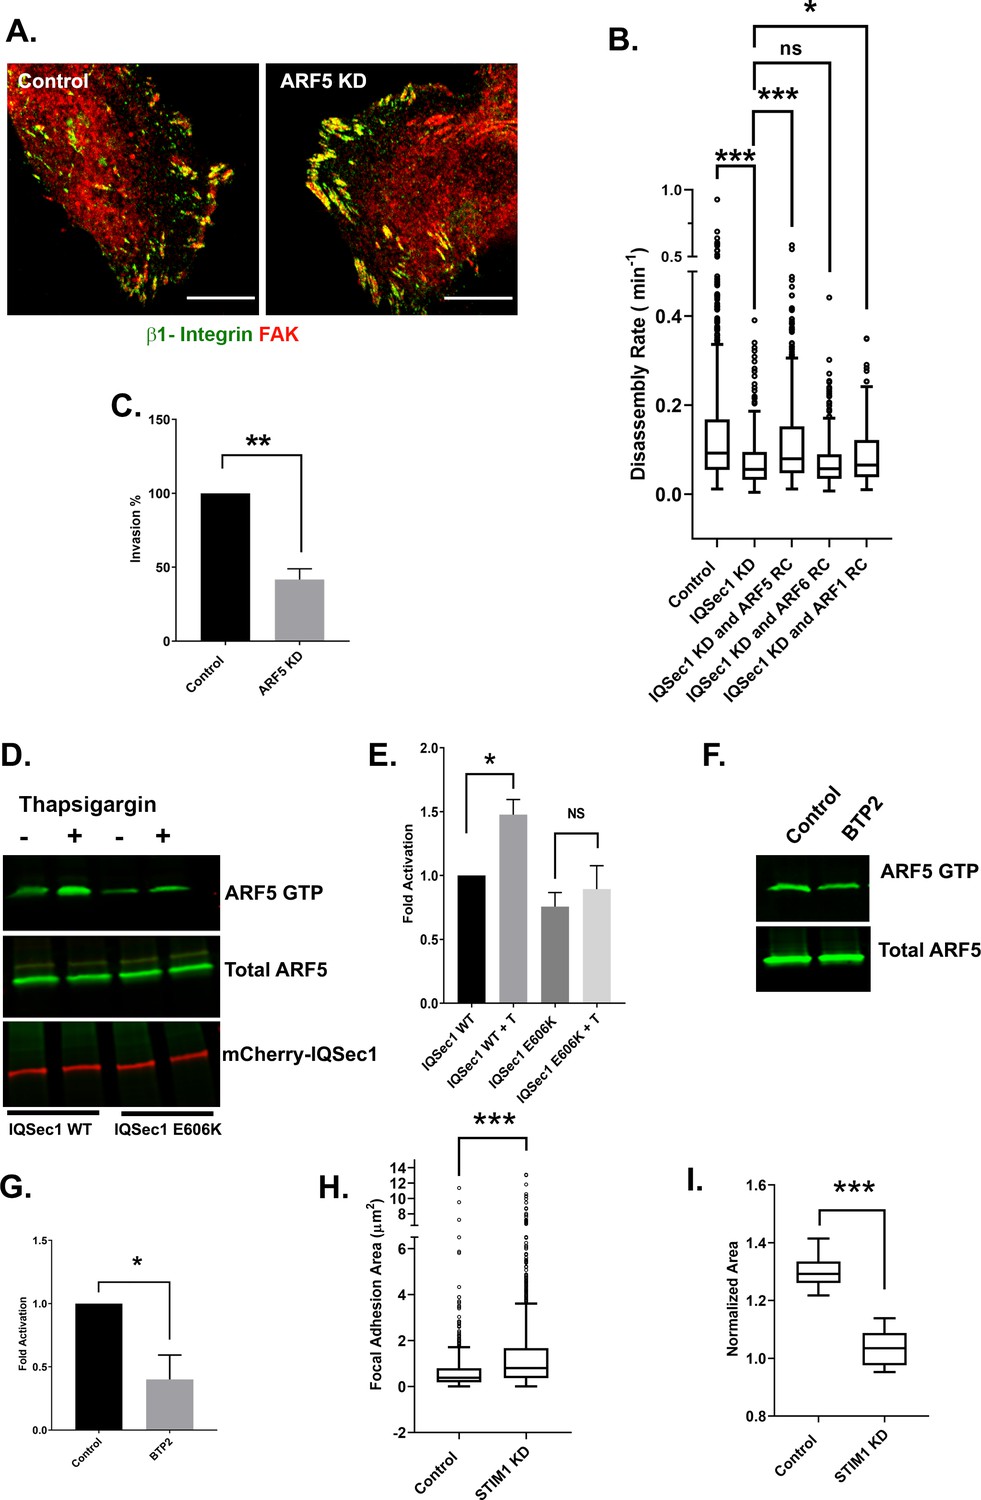
IQSec1 activates ARF5 to promote FA disassembly.
(A) Arf5 depletion leads to increased focal adhesion size. Control (left) and Arf5-depleted cells (right) were stained for endogenous β1-integrin (green) and FAK (red). Bar = 10 µm. (B) Expression of rapid cycling Arf5, but not Arf6 or Arf1, enhances adhesion turnover in IQSec1-depleted cells. IQSec1-depleted cells were co-transfected with plasmids encoding GFP-paxillin and rapid cycling (RC) mutants of Arf6, Arf5 or Arf1. N for control = 1203, IQSec1 KD = 670, IQSec1 KD + Arf5 RC = 1087, IQSec1 KD + Arf6 RC = 612, IQSec1 KD + Arf1 RC = 798 FAs. Data were collected from 15 cells per group, spanning three independent experiments. (C) Migration of control vs. Arf5-depleted cells through a Matrigel plug. Data were compiled from three independent experiments, each performed in triplicate. (D and E) Pulldown assay for Arf5 activity. HEK293 cells expressing Arf5-HA and either WT mCherry-IQSec1 or catalytically inactive mCherry-IQSec1E606K were cultured in serum and calcium free media for 3 hr, then stimulated with thapsigargin [T] (1 µM) in the presence of calcium (1 mM) for 30 min. Cells lysates were then incubated with GST-GGA3 beads to precipitate active, GTP-bound Arf5. (D) A representative blot showing enhanced activation of Arf5 by thapsigargin in the presence of IQSec1 WT, but not IQSec1E606K (E) Quantitation of results from three independent experiments shown in ‘D’. (F) Representative blot showing decreased Arf5 activity in cells treated with the Orai1 inhibitor BTP2 (25 µM). (G) Quantitation of results from three independent experiments shown in ‘F’. (H) Quantitation of FA size from control and STIM1 depleted cells. Cells were fixed and stained for endogenous vinculin. N for control = 848 and for STIM1 KD = 1603 FA. 30 cells were analyzed per group. (I) Quantitation of cell migration out of spheroids derived from control and STIM1 depleted MDA-MB-231 cells. Data were collected from eight spheroids for each group.
Figure 2—figure supplement 1
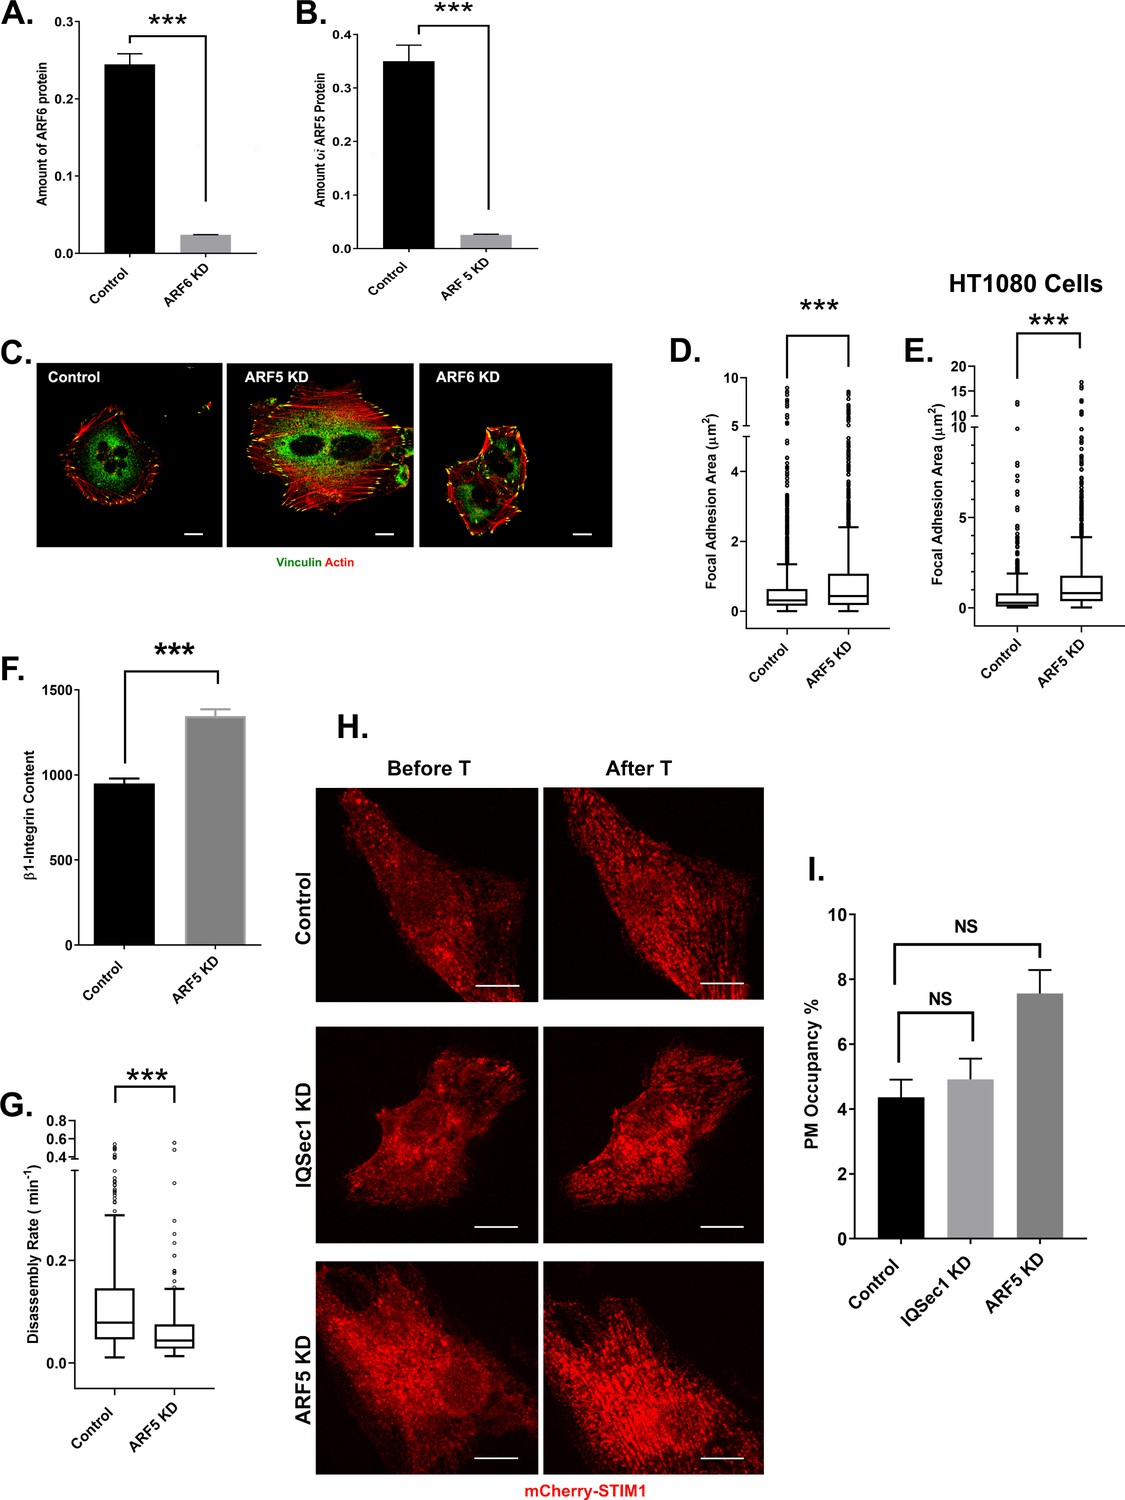
Knockdown of Arf5 but not Arf6 phenocopies IQSec1 depletion.
(A) Quantitation of endogenous Arf6 protein from MDA-MB-231 cells treated with shRNA targeting Arf6. (B) Quantitation of Arf5 knockdown. Due to the poor quality of antibodies, cells were transfected with GFP-Arf5 on the penultimate day of knockdown, lysed the following day and blotted using anti-GFP antibody. The amount of exogenously expressed Arf5 was quantitated. (C) Knockdown of Arf5, but not Arf6 enhances cell spreading. MDA-MB-231 cells were either mock treated, depleted of Arf5 or Arf6 and stained for vinculin and actin. Bar = 10 µm (D) Quantitation of FA size from MDA-MB-231 cells fixed and stained for vinculin as a marker for FA, N for control = 1786 and for Arf5 KD = 1484 from 37 cells. (E) Quantitation of FA size from HT1080 cells fixed and stained for vinculin. N for control = 733 and for Arf5 KD = 1101 from 10 cells (F) Quantitation of β1-integrin fluorescence in FA from control (586 FAs) and Arf5-depleted (511 FAs) cells. A total of 5 cells were analyzed per group. (G) Depletion of Arf5 slows adhesion disassembly. FA disassembly rates were measured in MDA-MB 231 cells expressing GFP-paxillin. N for control = 483 and Arf5 KD = 242 focal adhesions. 10 cells were analyzed per group. (H) Recruitment of STIM1 to ER/PM contacts requires neither IQSec1 nor Arf5. mCherry-STIM1 was expressed in control, IQSec1-depleted or Arf5-depleted cells. Cells were then imaged live before and after thapsigargin (1 µM) treatment for 10 min. Representative stills in (H) show a robust recruitment of STIM1 after thapsigargin (T) treatment (Bar = 10 µm), quantified in (I). Data in (H) represent the percentage of STIM1 puncta making contact with the PM after thapsigargin treatment, normalized to amount of pre-existing PM STIM1 before thapsigargin treatment. Data were collected from 15 cells per group.
Figure 3 with 1 supplement
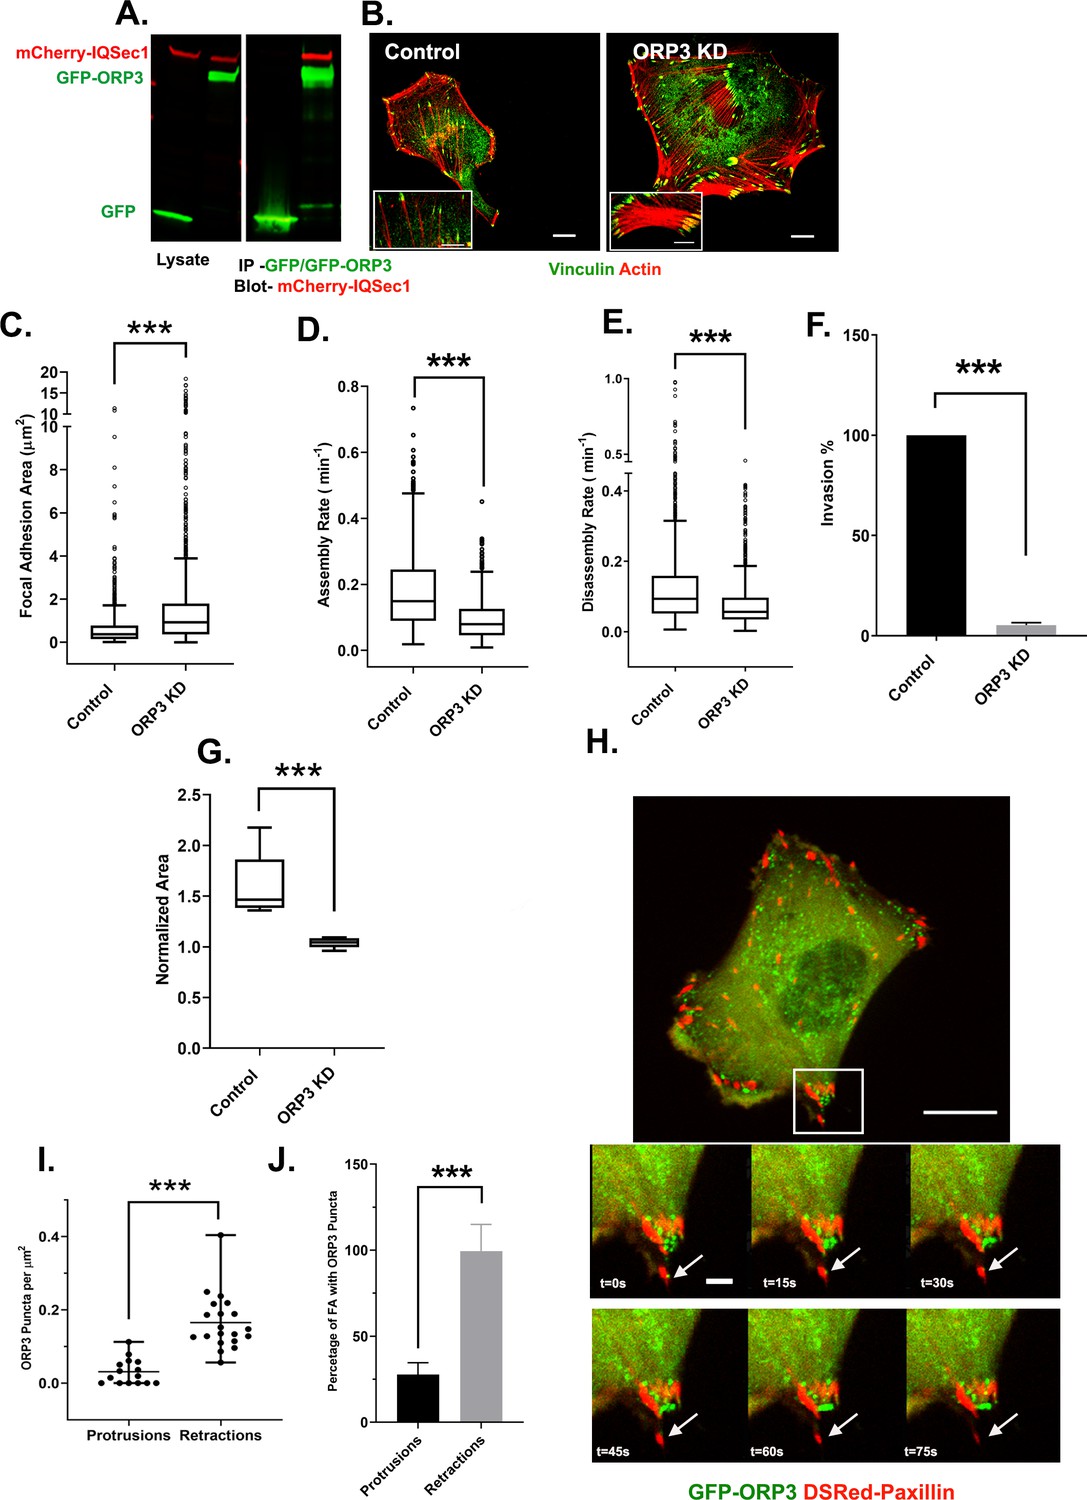
IQSec1 associates with ORP3 and ORP3 knockdown phenocopies IQSec1 knockdown.
(A) Lysates from cells co-expressing mCherry-IQSec1 and either unfused GFP or GFP-ORP3 (left) were immunoprecipitated with GFP-TRAP beads (Chromotek) and probed by western blotting for GFP and mCherry (right). (B) MDA-MB-231 cells were either mock-depleted or depleted of ORP3 then fixed and stained for endogenous vinculin (green) and actin (red), Bar = 10 µm. (C) Quantification of FA size from control or ORP3 depleted cells, using vinculin as a marker for FAs, N for control = 1385 and for ORP3 KD = 1396 focal adhesions. Data were collected from 30 cells for each condition, spanning three experiments. (D) FA assembly rates in cells expressing GFP-paxillin. N for control = 804 and for ORP3 KD = 709 FA. Data were collected from 15 cells per group spanning three independent experiments. (E) FA disassembly rates in cells expressing GFP-paxillin. N for control = 1301 and for ORP3 KD = 1504 FAs. Data were collected from 15 cells per group spanning three independent experiments (F) Knockdown of ORP3 inhibits migration through a Matrigel plug. Data were compiled from three independent experiments, each performed in triplicate. (G) Quantification of cell migration out of spheroids after 22 hr in 3D collagen gels. Data were collected from seven spheroids from each group. (H) Time series from Video 4, showing an MDA-MB-231 cell co-expressing GFP-ORP3 and DsRed-paxillin. Panels show clustering of ORP3 puncta adjacent to disassembling FAs. Arrows indicate a single ORP3 punctum in close apossition with a paxillin-labelled FA before it disassembles. Bar on whole cell = 10 µm and on time series panel = 1 µm. (I) Quantification of the number of ORP3 puncta in protrusions (15 areas) and retractions (19 areas) from a total of 13 cells analyzed, compiled from three independent experiments. Protrusions and retractions were identified as specified in Methods (J) Prevalence of FAs with adjacent ORP3 puncta in protrusions vs. retracting regions of migrating cells. Proximity of puncta to adhesions was measured as described in Methods. Data were collected from 352 FAs in protrusions and 300 FAs in retractions.
-
Figure 3—source data 1
Mass spectroscopy of IQSec1-interacting proteins- data underlying Figure 3A.
Please refer to Materials and methods for details.
- https://cdn.elifesciences.org/articles/54113/elife-54113-fig3-data1-v2.xlsx
Figure 3—figure supplement 1
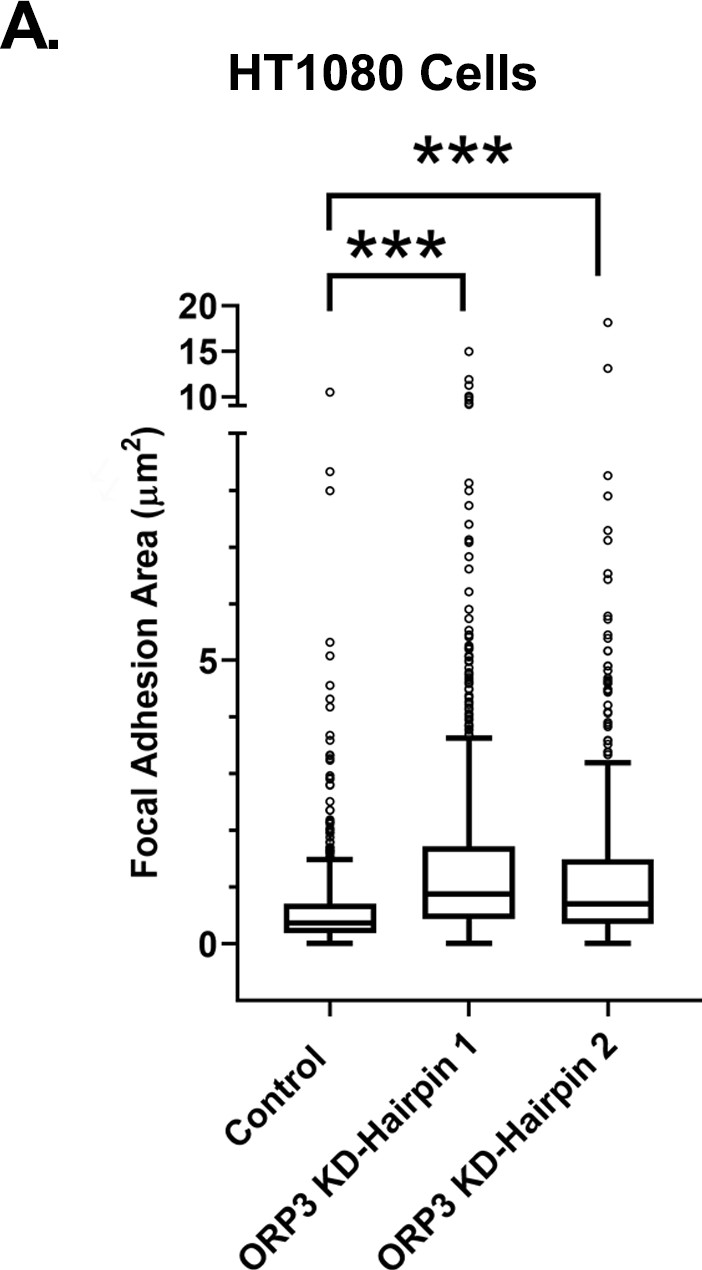
Knockdown of ORP3 also increases focal adhesion area in HT1080 cells.
(A) Quantitation of FA size from control or ORP3-depleted HT1080 cells, using vinculin as a marker for FA. N for control = 758, ORP3 KD hairpin1 = 853 ORP3 KD hairpin2 = 617 adhesions. Data were collected from 10 cells for each condition.
Figure 4 with 1 supplement

ORP3 is recruited to STIM1-positive ER/PM contacts in response to calcium influx.
(A) Still images from live cells (Video 5) co-expressing GFP-ORP3 and mCherry-STIM1, before and after thapsigargin (1 µM) treatment. Bar = 10 µm. Magnified view of the boxed area ia shown at right. Bar = 2.5 µm (B) Quantification of ORP3 colocalization with STIM1 in response to thapsigargin, added 2.5 mins after the start of the movie. Data were collected from 10 regions of interest from three independent experiments. (C) Time series showing an MDA-MB-231 cell expressing GFP-ORP3, imaged before and after thapsigargin (1 µM) treatment (arrow indicates time of addition) showing robust recruitment of ORP3 to the PM after treatment with thapsigargin. Bar = 5 µm. (D) Quantification of ORP3 fluorescence at the PM, after thapsigargin treatment. Data were collected from 10 regions of interest from three independent experiments. (E) Live cells expressing GFP-ORP3 were pre-treated with either DMSO or with BTP2 (25 µM) for 2 hr, then treated with thapsigargin (1 µM) for 5 min. Bar = 10 µm. (F) Quantification of GFP-ORP3 recruitment to the PM after thapsigargin treatment in the presence and absence of BTP2. PM occupancy was calculated as described in Methods. Data were collected from 15 cells per group spanning three experiments. (G) Recruitment of GFP-ORP3 to the PM after thapsigargin treatment in control vs. STIM1 depleted cells. Data were collected from 13 cells per group, spanning three experiments. (H) Interaction between IQSec1 and ORP3 is stimulated by SOCE and inhibited when calcium influx is blocked by BTP2. Note the shift in ORP3 mobility upon thapsigargin treatment. Data from three independent experiments were quantified and presented in (I).
Figure 4—figure supplement 1
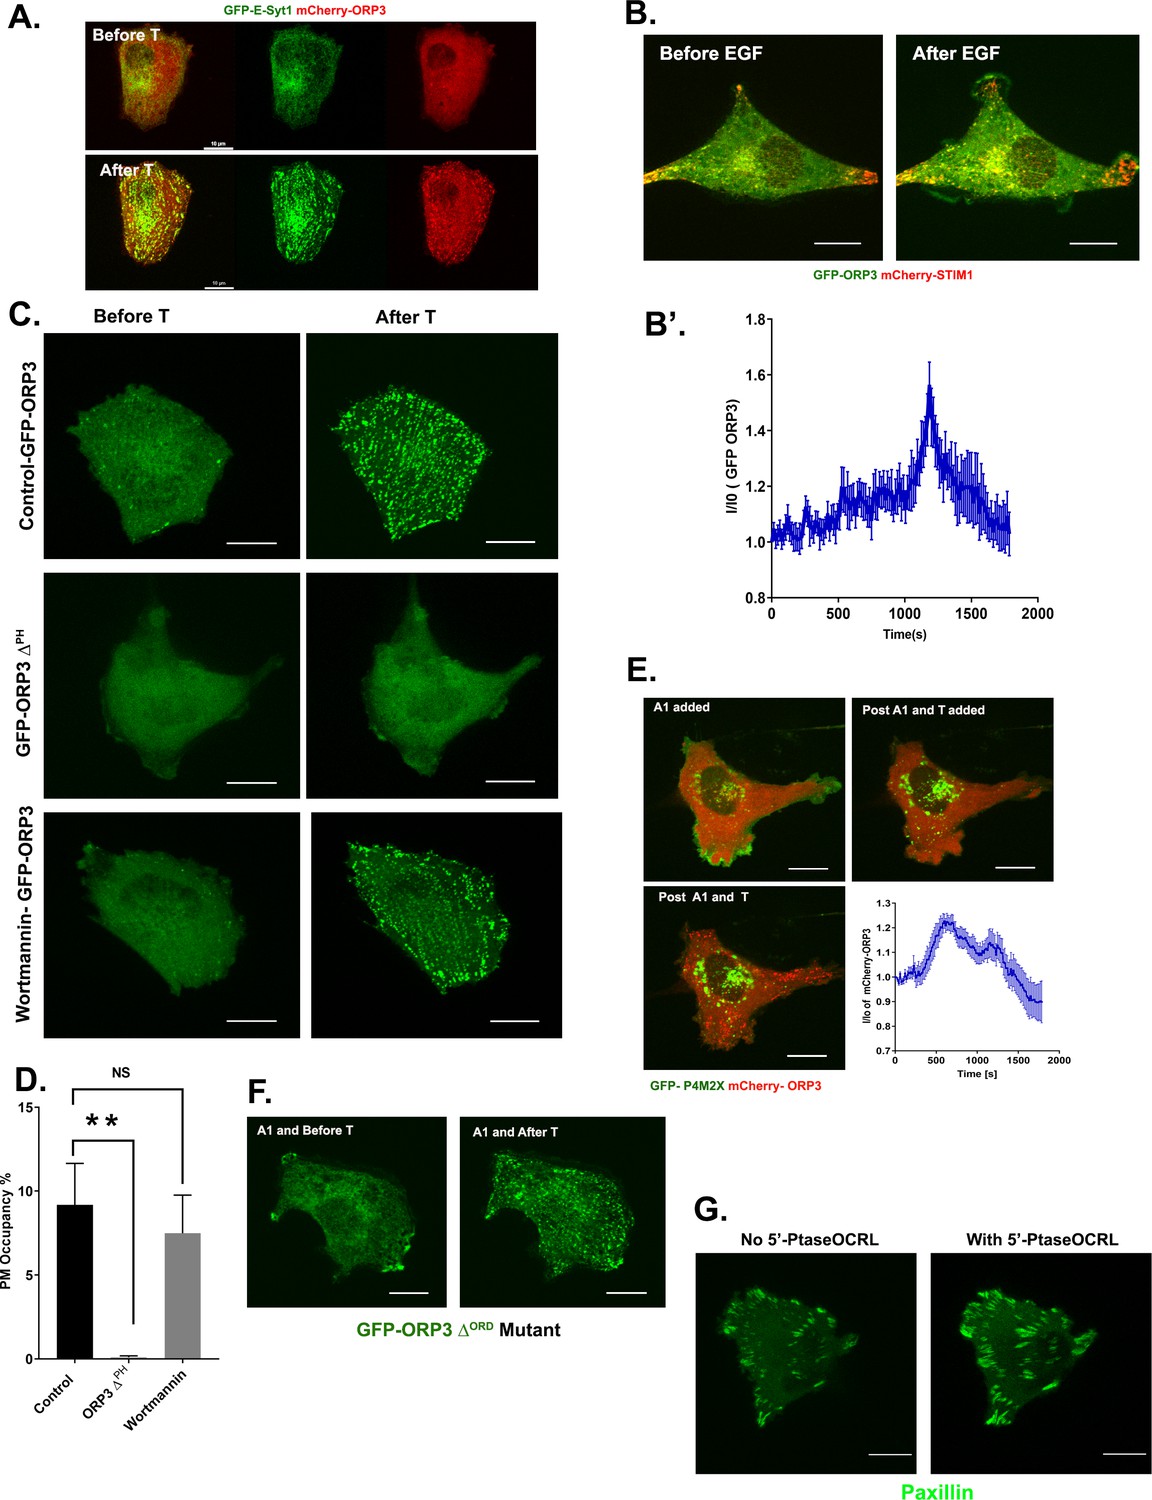
Recruitment of ORP3 to the plasma membrane.
(A) Esyt-1 and ORP3 are co-recruited in response to calcium influx. MDA-MB-231 cells expressing GFP-E-Syt1 and mCherry-ORP3 were treated with thapsigargin (1 µM) and imaged live for 10 min. Panels show stills before and after thapsigargin treatment. Bar = 10 µm. (B) EGF stimulation also promotes ORP3 recruitment to the PM. MDA-MB-231 cells expressing GFP-ORP3 and mCherry-STIM1 were treated with EGF (100 ng/ml) and imaged for 30 min. Panels show stills before and after EGF treatment. Bar = 10 µm (B’) Quantitation of ORP3 fluorescence at the PM, after EGF (100 ng/ml) treatment. Data were collected from 10 regions of interest from three independent experiments. (C) ORP3 recruitment to the PM requires the PH domain but not D3-phosphoinositides. Representative stills from movies of live cells expressing either GFP-ORP3 or GFP-ORP3ΔPH, as indicated. The third panel shows cells expressing WT GFP-ORP3 pretreated with wortmanin (100 nM). All three groups of cells were treated with thapsigargin (1 µM) and imaged live. Bar = 10 µm (D) Quantitation of percentage of PM area occupied by ORP3 puncta after thapsigargin treatment for experiments shown in panel C. Data were collected from 10 cells per group. (E) ORP3 recruitment to the PM is independent of PM PI4P. Live cells co-expressing the PI4P probe GFP-P4M2X and mCherry-ORP3 were pre-treated with the PI4KIIIα inhibitor GSK-A1 (30 nM). After the loss of GFP-P4M2X signal, cells were treated with thapsigargin and imaged for an additional 30 mins. The changes in ORP3 fluorescence at the PM were quantified. Data were collected from 20 regions of interest from three independent experiments. (F) The ORD domain is not required for PM recruitment of ORP3. MDA-MB-231 cells expressing GFP-ORP3ΔORD mutant were treated with GSK-A1 for 20 mins and then treated with thapsigargin. Representative images show cells before and after thapsigargin treatment. (G) Optogenetic depletion of PI(4,5)P2 leads to increased focal adhesion size. Representative images of a live cell expressing GFP-paxillin, mCherry-CRY2-5-PtaseOCRL and CINB-CAAX that was stimulated with blue light to deplete PI(4,5)P2.
Figure 5 with 1 supplement

ORP3 requires PI(4,5)P2 for recruitment to the PM, and acts upstream of IQSec1 to stimulate Arf5 activation.
(A) Live cells expressing GFP-ORP3, mCherry-CRY2-5-PtaseOCRL and CINB-CAAX (two components of the blue light system) were stimulated with blue light to deplete PI(4,5)P2 and then treated with PMA (2.5 µM) for 30 min. Images show individual cells before and after PMA treatment. Bar = 10 µm. (B) Fraction of PM area containing ORP3 puncta after optogenetic depletion of PI(4,5)P2 and treatment with PMA. Controls were transfected with unfused mCherry and exposed to blue light similarly to cells expressing mCherry-CRY2-5-PtaseOCRL. Data were collected from 12 cells per group, from three experiments. (C) Live cells expressing GFP-paxillin, mCherry-CRY2-5-PtaseOCRL and CINB-CAAX were stimulated with blue light to deplete PI(4,5)P2 and focal adhesion size was measured before and after PI(4,5)P2 depletion. Data were collected from 18 cells for each condition. See Figure 4—figure supplement 1G for representative images. (D) Control cells or cells depleted of either IQSec1 or Arf5 were transfected with GFP-ORP3, treated with thapsigargin (1 µM) and imaged live. Panels show cells before and after 5 mins of thapsigargin treatment. Bar = 10 µm. (E) Fraction of PM area containing GFP-ORP3 puncta after thapsigargin treatment corresponding to panel ‘D’. Data were collected from 13 cells per group, from three experiments. (F) Representative blot of active Arf5 in lysates prepared from ORP3 depleted cells. (G) Quantitation of Arf5 activity compiled from three independent experiments.
Figure 5—figure supplement 1
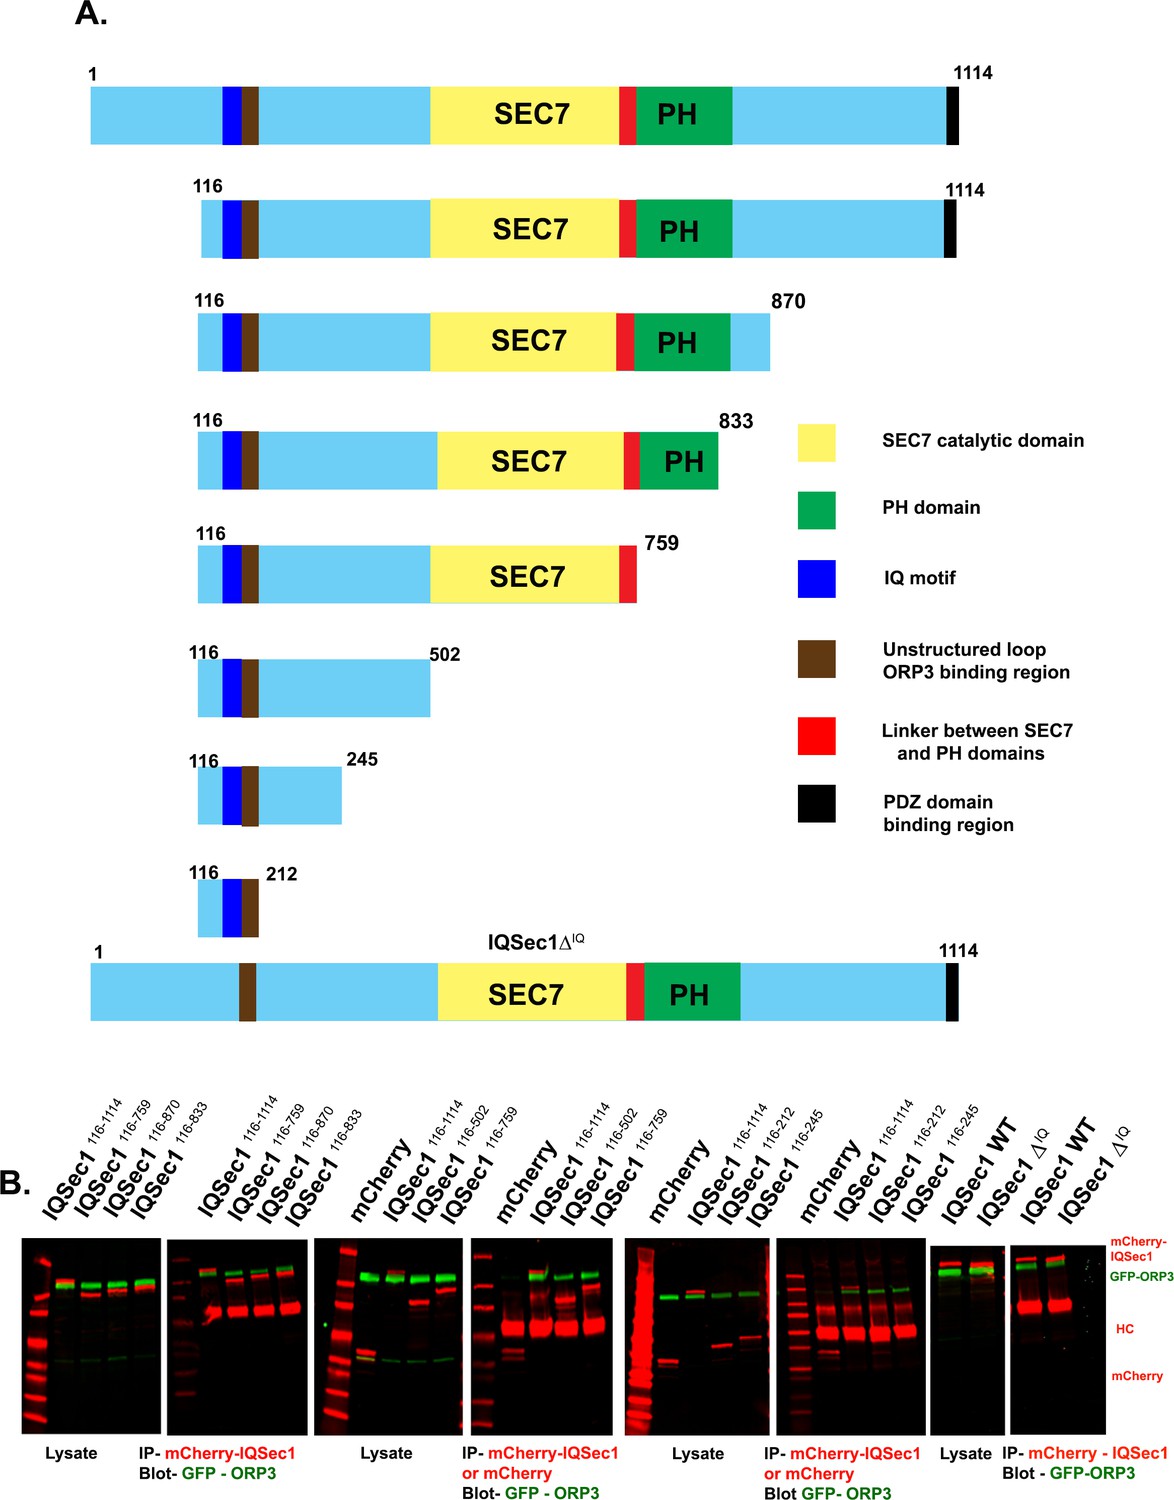
Mapping the binding site for ORP3 on IQSec1.
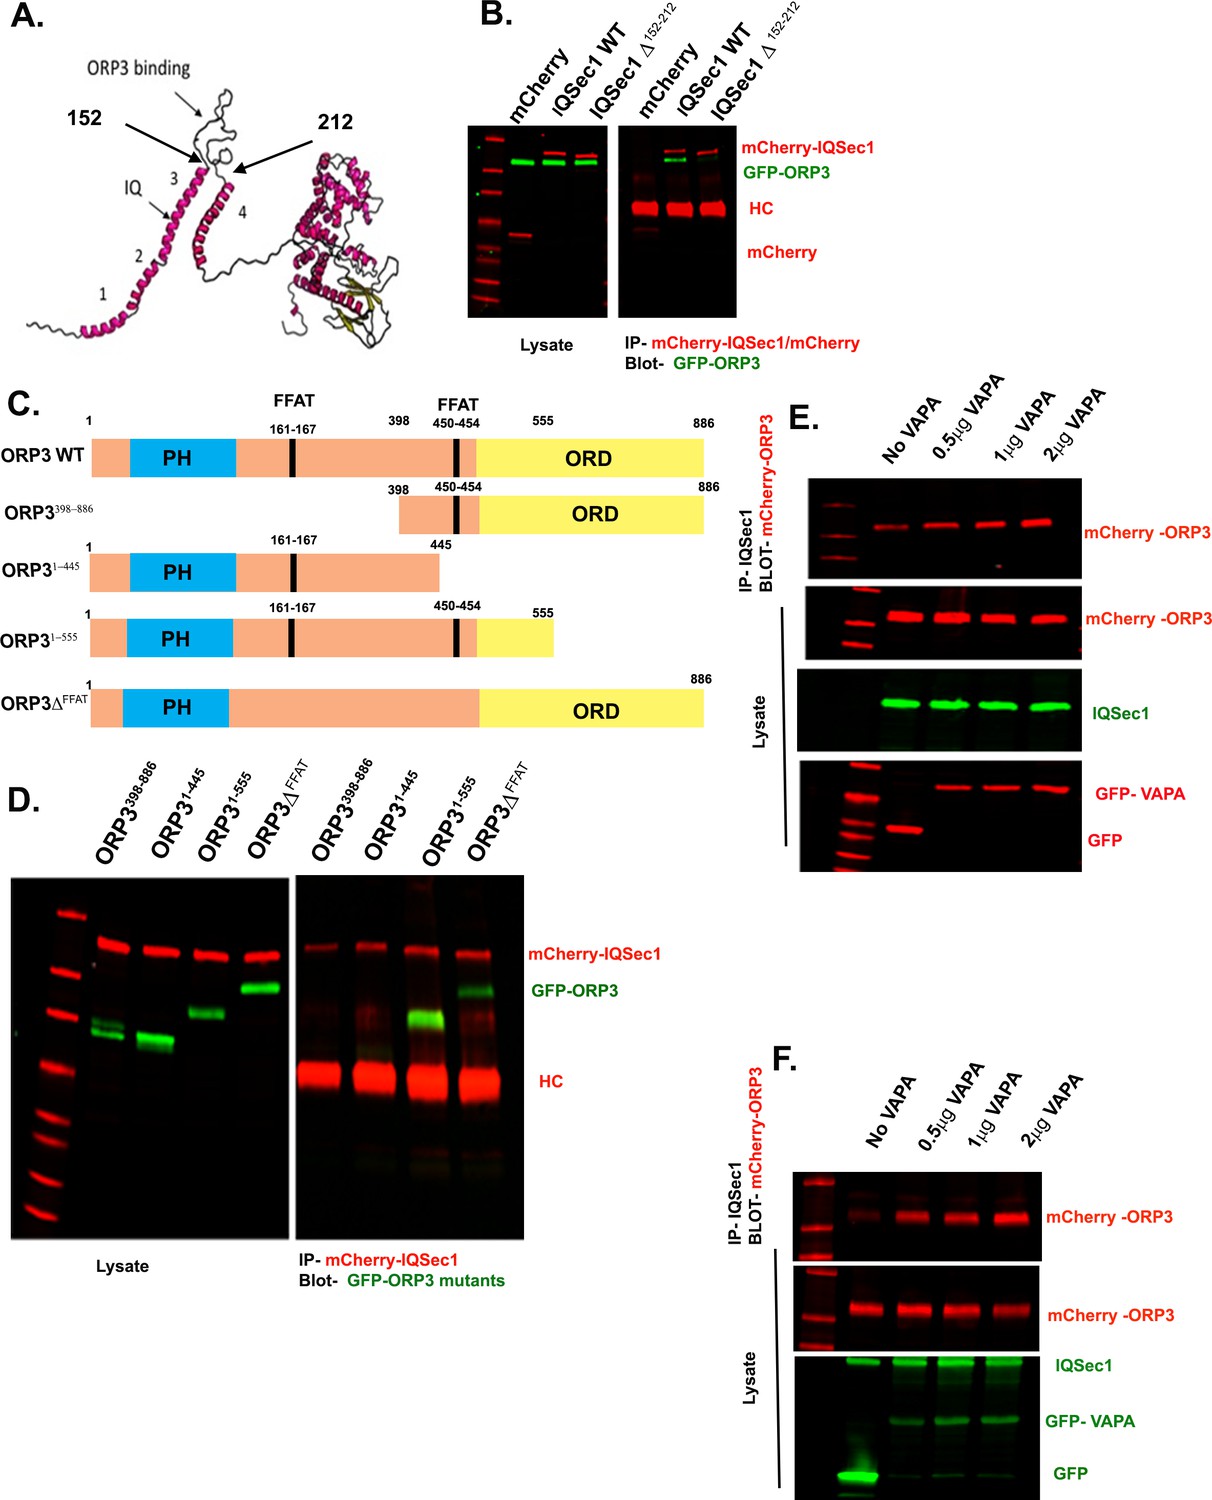
(A) Domain organization of truncation mutants of IQSec1. (B) Interaction of WT ORP3 with truncation mutants of IQSec1. Lysates of cells co-expressing WT GFP-ORP3 and various truncation mutants of mCherry-IQSec1 were immunoprecipitated with anti-mCherry antibody and probed for GFP-ORP3.
Figure 6 with 2 supplements
Phosphoregulation of ORP3 recruitment to the plasma membrane.
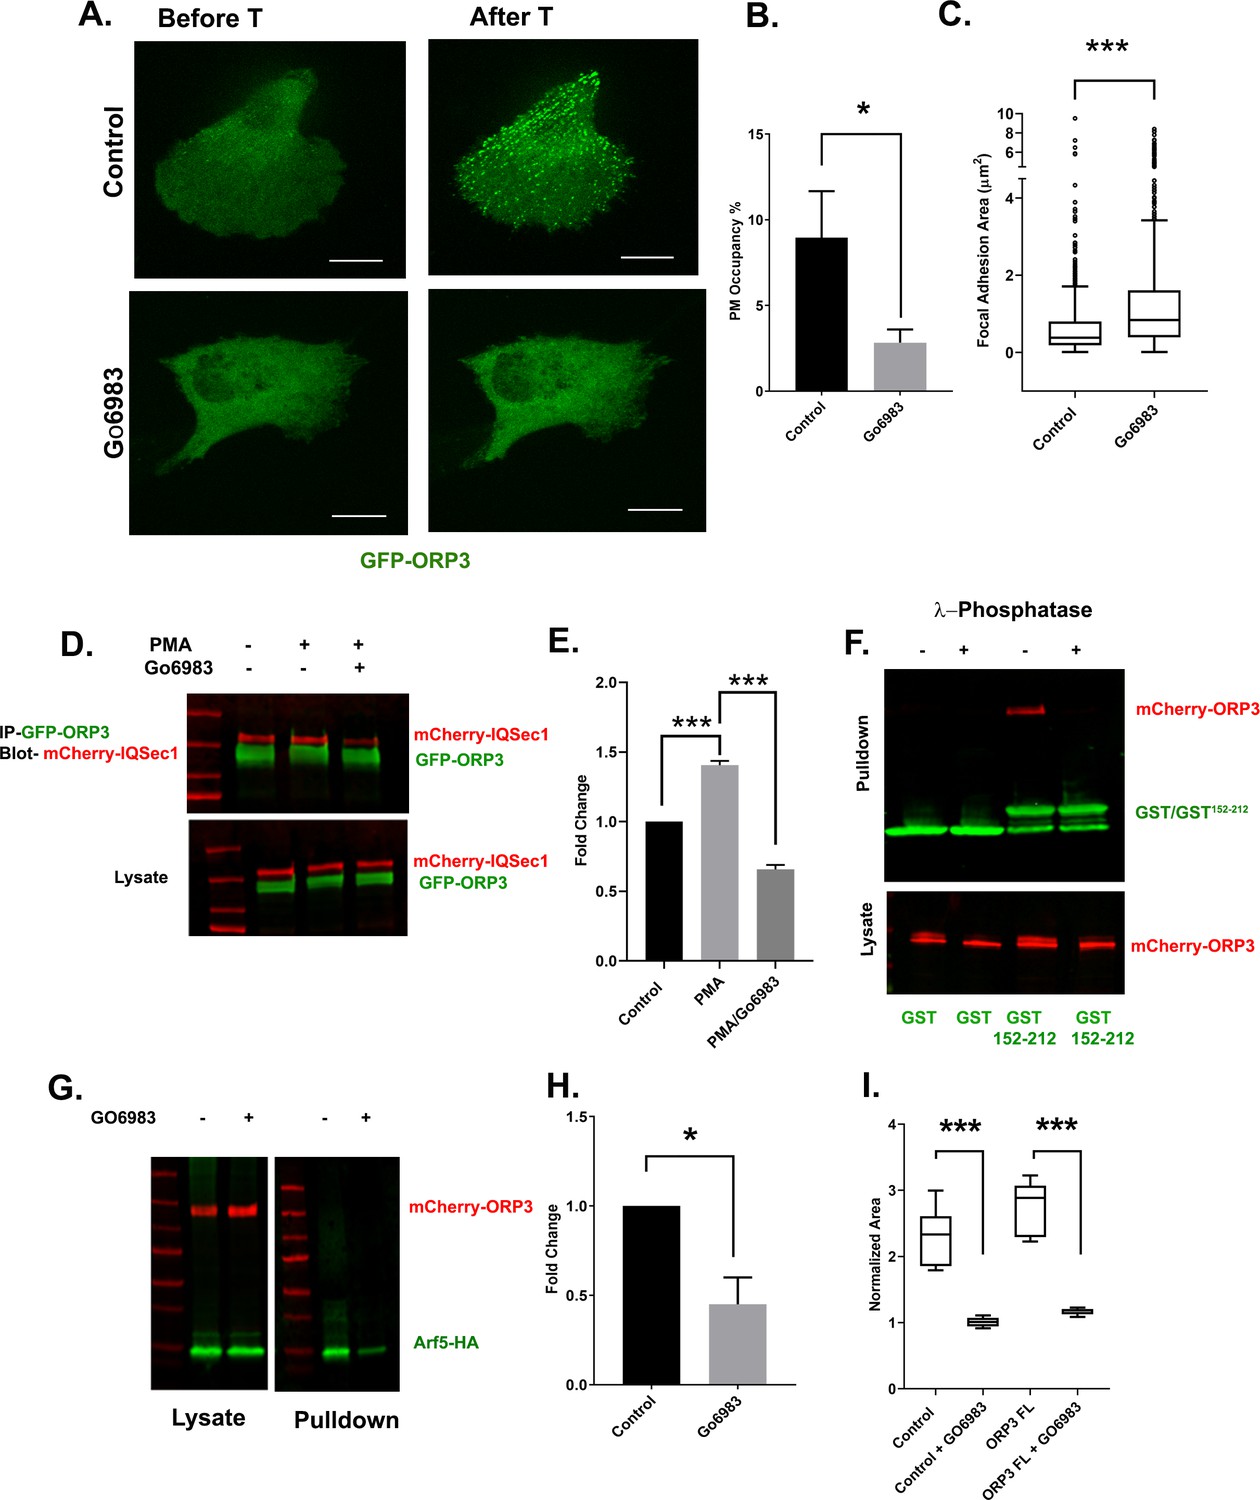
(A) MDA-MB-231 cells expressing GFP-ORP3 were mock treated with DMSO or with the pan-PKC inhibitor Gö6983 (20 µM) for 2 hr. Both groups of cells were then stimulated with thapsigargin (1 µM) and imaged live. Images show a representative cell after 5 min thapsigargin treatment. Bar = 10 µm. (B) Fraction of the PM area containing ORP3 puncta from control and Gö6983 treated cells after thapsigargin treatment. Data were collected from 15 cells per group, from three experiments. (C) Quantification of focal adhesion size in control and Gö6983 treated cells, stained for endogenous vinculin as a marker for FAs. N for control = 848 and for Gö6983 = 1293 FAs. Data were collected from 36 cells per group, spanning three experiments. See Figure 6—figure supplement 2 for representative images. (D) Cells co-expressing mCherry-IQSec1 and GFP-ORP3 were incubated with PMA in the presence or absence of Gö6983. ORP3 immunoprecipitates were then probed for IQSec1. Data from three independent experiments were quantified and presented in (E). (F) Lysates of cells expressing mCherry-ORP3 were incubated (or not) with λ-phosphatase to dephosphorylate ORP3, then precipitated with either GST alone or a GST fusion containing IQSec1 residues 152–212. This experiment was done twice and a similar trend was noted. For repeat see Figure S7B. (G) Arf5 activity was measured by pulldown in the presence and absence of the PKC inhibitor Gö6983. (H) Quantitation of Arf5 activity, corresponding to panel G. Data were compiled from three independent experiments. (I) Quantification of cell migration out of spheroids from parental MDA-MB-231 cells or cells stably expressing WT ORP3. One batch of spheroids from each group was left untreated, and a second batch was treated with Gö6983 after embedding in 3D collagen. Spheroids were imaged live in the continuous presence of the drug for 22 hr. Data were collected from seven spheroids from each group.
Figure 6—figure supplement 1
Mapping the interaction between ORP3 and IQSec1.
(A) Predictive model of IQSec1, generated using Raptor-X. SEC7-PH domain tandem (based on the existing crystal structure) is at the right, predicted N-terminal helices are numbered 1–4. Arrow indicates position of the IQ motif. The ORP3 binding loop is indicated by larger arrows. (B) Deletion of IQSec1 residues 152–212 abrogates binding to ORP3. Cells co-expressing GFP-ORP3 with either mCherry-WT IQSec1 or -IQSec1∆152-212 were lysed and immunoprecipitated with anti-mCherry antibody, then probed for GFP-ORP3. (C) Domain organization of ORP3 and ORP3 mutants; PH (blue) = PH domain, FFAT (black) = two phenylalanines in an acidic tract, ORD (yellow) = OSPB related domain. (D) Mutation of the ORP3 FFAT motifs attenuates binding to IQSec1. Lysates of cells co-expressing WT mCherry-IQSec1 and various mutants of GFP-ORP3 were immunoprecipitated with anti-mCherry and probed for GFP. HC = IgG heavy chain. (E and F) VAP-A binding enhances formation of an ORP3/VAP-A/IQSec1 complex. Two independent experiment from cells expressing equivalent amounts of ORP3 and IQSec1, transfected with increasing amounts of vector encoding VAP-A. Cells were then lysed, IQSec1 was immunoprecipitated and the blot probed for co-precipitating ORP3 (top panels).
Figure 6—figure supplement 2
Imaging of focal adhesions upon inhibition of PKC or PI4KIIIα.
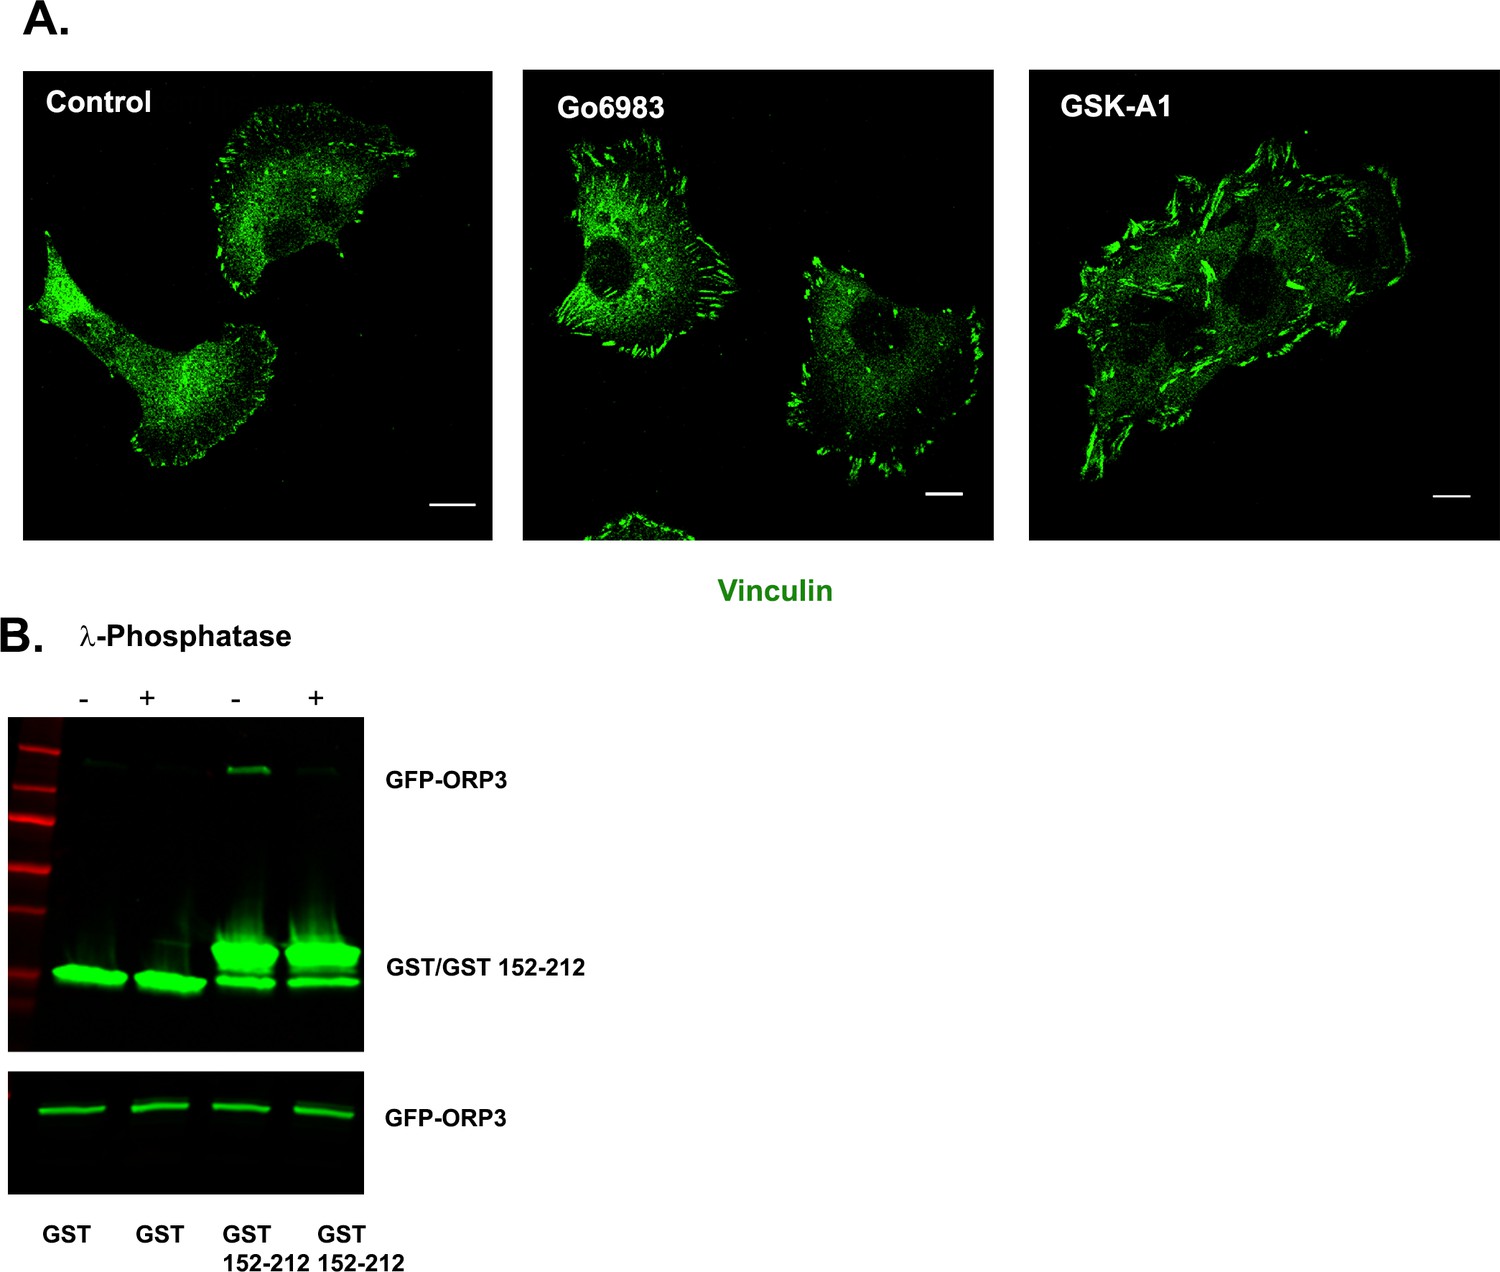
(A) Inhibition of either PKC or PI4KIIIa results in larger FAs. Representative images of MDA-MB-231 cells mock treated or treated with Gö6983 or GSK-A1, fixed and stained for endogenous vinculin. (B) Binding of ORP3 to IQSec1152-212 requires phosphorylation of ORP3. Lysates of cells expressing mCherry-ORP3 were incubated (or not) with λ-phosphatase to dephosphorylate ORP3, then precipitated with GST alone, or a GST fusion containing IQSec1 residues 152–212 (duplicate experiment, related to Figure 6F).
Figure 7 with 1 supplement
ORP3 extracts PI4P from the plasma membrane in exchange for PC.
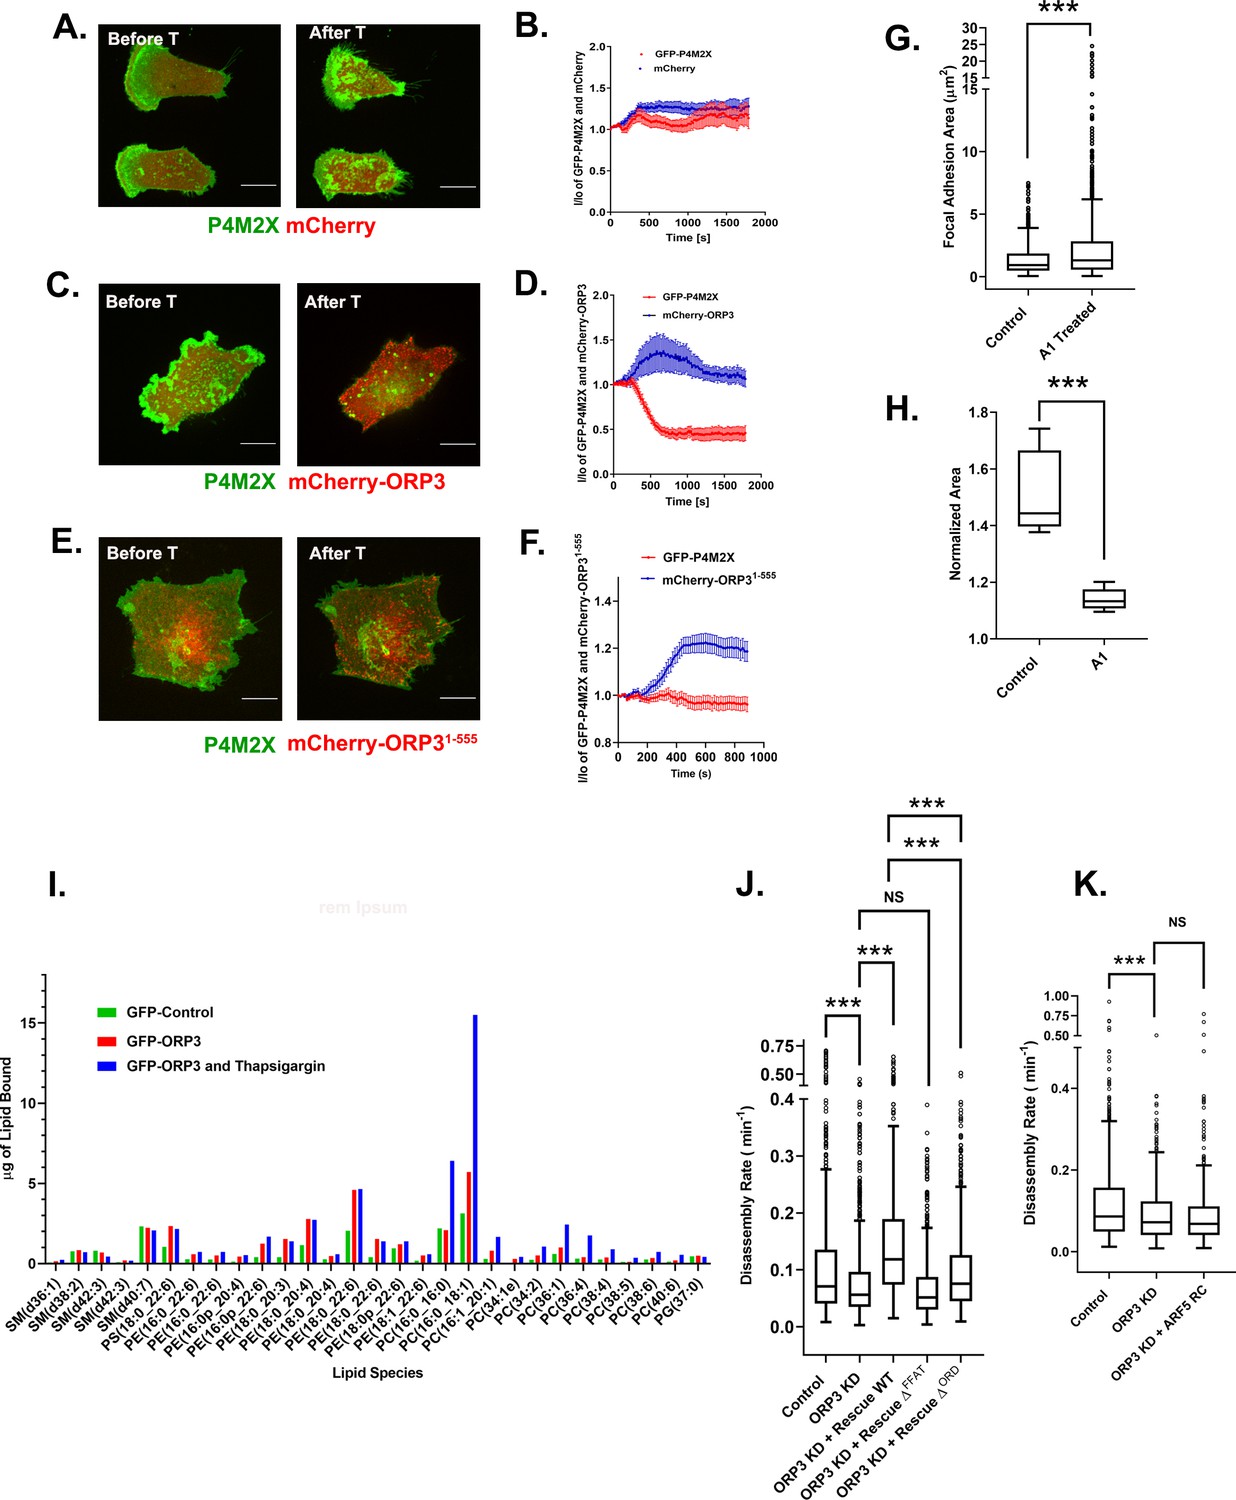
(A–F) MDA-MB-231 cells expressing the PI4P probe GFP-P4M2X and either mCherry alone (A) mCherry-ORP3 (C) or mCherry-ORP31-555 (E) were imaged live. Images show stills before (Frame 1) and after (Frame 75) treatment with thapsigargin (1 µM) for 30 mins. The changes in PM fluorescence for GFP-P4M2X (red) or mCherry (blue) were quantified and presented in (B), (D) and (F) respectively. Data were compiled from 20 regions of interest from three independent experiments. (G) Cells were treated with GSK-A1 to deplete PM PI4P and focal adhesion size was measured in control (695 FAs) and GSK-A1 treated cells (1019 FAs). Data were collected from 30 cells per group, spanning three experiments. For corresponding images refer to Figure S7A. (H) Quantification of cell migration out of spheroids from control and GSK-A1-treated cells after 22 hr in 3D collagen gels. Data were collected from six spheroids for each group. (I) Quantification of lipids precipitated with unfused GFP (green) or GFP-ORP3 before (red) and after (blue) thapsigargin treatment. (J) FA disassembly rates in cells expressing GFP-paxillin. ORP3 depleted cells were transfected with constructs encoding WT ORP3 or mutants lacking the FFAT motifs (∆FFAT) or the ORD domain (∆ORD). FA turnover was measured as described in Figure 1. N for control = 828, ORP3 KD = 1504, ORP3 KD+ Rescue WT = 677, ORP3 KD+ Rescue ∆FFAT = 792, ORP3 KD+ Rescue ∆ORD = 657 focal adhesions. Data were compiled from 15 cells per group spanning three independent experiments. Note that the disassembly rates for ORP3 KD+ Rescue WT are significantly higher than ORP3 KD and reach control level compared to WT ORP3 KD+ Rescue ∆ORD that significantly rescues over ORP3 KD but is not as efficient as WT ORP3. (K) FA disassembly rates were measured in ORP3 depleted cells expressing the rapid cycling T161A mutant of Arf5. N for control = 564, ORP3 KD = 551, ORP3 KD + ARF5 RC = 467. Data were compiled from 15 cells per group spanning three independent experiments.
-
Figure 7—source data 1
Mass spectroscopy of lipids bound to ORP3 – data underlying Figure 7I.
Cells expressing either unfused GFP or GFP-ORP3 were treated (or not) with thapsigargin as described in Methods. Samples were immunoprecipitated with anti-GFP antibody, bound lipids were extracted and analyzed by mass spectroscopy.
- https://cdn.elifesciences.org/articles/54113/elife-54113-fig7-data1-v2.xlsx
Figure 7—figure supplement 1
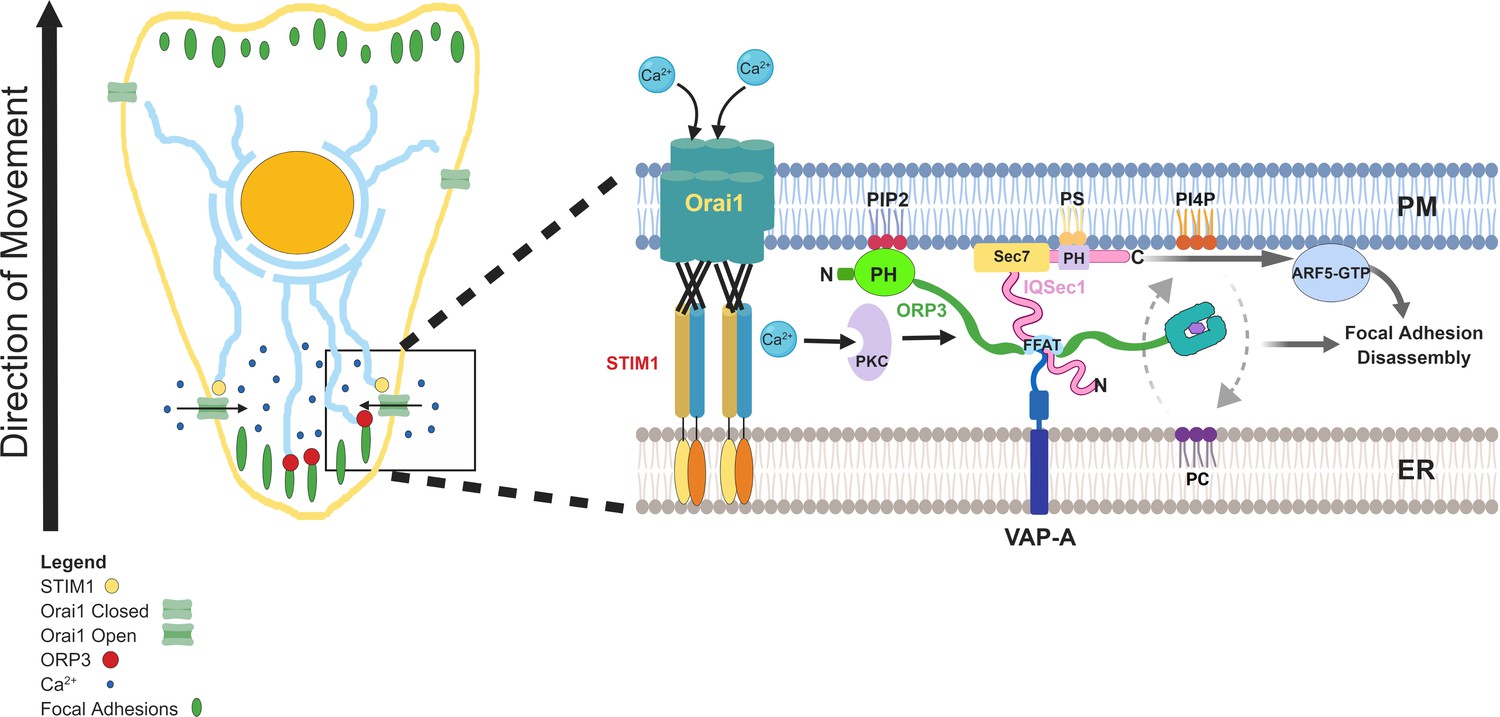
Model summarizing the finding of this study.
Calcium influx via STIM1/Orai1 channels adjacent to focal adhesions at the trailing edge stimulates PKC-dependent phosphorylation of ORP3, exposing its interaction sites. The PH domain binds PI(4,5)P2 at the PM, while the central FFAT motifs bind ER-anchored VAP-A (and/or VAP-B), bringing the two membranes into close proximity and allowing lipid exchange. PC is transferred to the PM in exchange for PI4P, which is transferred to the ER. ORP3 interaction with IQSec1 stimulates its catalytic activity, leading to increased Arf5 activation at the PM. The combined activities of ORP3 and IQSec1/Arf5 are essential for efficient focal adhesion turnover.
Author response image 1
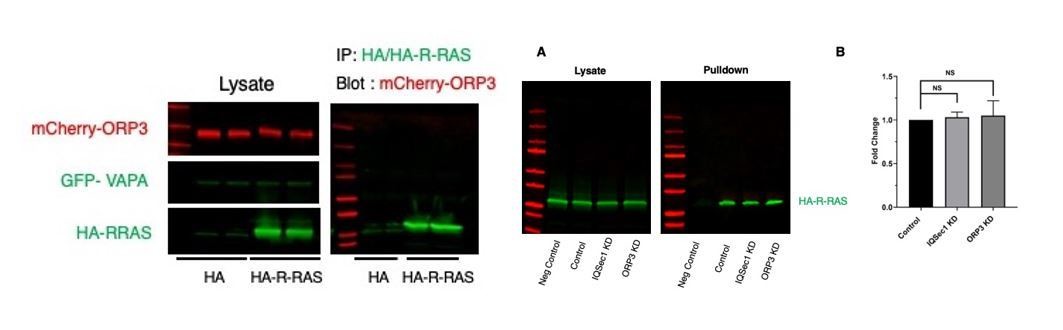
ORP3 fails to co-IP with HA-R-Ras (left), and depletion of neither ORP3 nor IQSec1 impacts R-Ras activity in a pulldown assay (A).
Quantitation in panel B is from 3 independent experiments.
Videos
Video 1
MDA-MB-231 cell expressing GFP-paxillin, imaged for 60 min at a rate of 1 frame every 15s.
Bar = 10 µm.
Video 2
MDA-MB-231 cell depleted of IQSec1 and expressing GFP-paxillin, imaged for 60 min at a rate of 1 frame every 15 s.
Bar = 10 µm.
Video 3
Movie showing GFP-STIM1 making contact with Ds-Red-paxillin-labelled focal adhesions.
Cell was imaged live for 30 min at a rate of 1 frame every 15 s. Bar = 2.5 µm.
Video 4
MDA-MB-231 cell expressing GFP-ORP3 and Ds-Red-Paxillin was imaged live for 30 min at a rate of 1 frame every 15 s.
Notice the accumulation of ORP3 puncta around FAs at retracting edges of the cell. Bar = 10 µm.
Video 5
MDA-MB-231 cell expressing GFP-ORP3 and mCherry-STIM1, imaged live for 30 min at a rate of 1 frame every 15 s.
Thapsigargin was added 2.5 min after the start of the movie. Note the co-recruitment of ORP3 and STIM1 to the PM after thapsigargin treatment. These changes have been quantified in Figure 4B. Bar = 10 µm.
Video 6
MDA-MB-231 cell expressing GFP-P4M2X (probe for phosphatidylinositol-4-phosphate/PI4P) and unfused mCherry was imaged live for 30 min at a rate of 1 frame every 15 s.
Thapsigargin was added 2.5 min after the start of the movie. Bar = 10 µm. Note that PM PI4P levels remain unchanged after addition of thapsigargin (quantified in Figure 7B).
Video 7
MDA-MB-231 cell expressing GFP-P4M2X and mCherry-ORP3 was imaged live for 30 min at a rate of 1 frame every 15 s.
Thapsigargin was added 2.5 min after the start of the movie. Notice the loss of GFP-P4M2X from the PM with the concomitant recruitment of mCherry-ORP3 (quantified in Figure 7D). The reduction in overall probe intensity is presumably due to transfer of PI4P to the ER, where it is dephosphorylated by Sac1. The probe is redistributed from the PM to what are presumably endosomes. Bar = 10 µm.
Tables
Key resources table
| Reagent type (species) or resource | Designation | Source or reference | Identifiers | Additional information |
|---|---|---|---|---|
| Cell line (H. sapiens) | MDA-MB-231 | ATCC | CRM-HTB-26 | Human breast cancer cell line |
| Cell line (H. sapiens) | HEK293 | ATCC | CRL-1573 | Human embryonic kidney cell line |
| Cell line (H. sapiens) | HT1080 | ATCC | CCL-121 | Human fibrosarcoma cell line |
| Transfected construct (H. sapiens) | FLAG-IQSec1 (NP_001127854.1) | Genscript, Piscataway, NJ | Plasmid to transiently express IQSec1 | |
| Transfected construct (H. sapiens) | mCherry-ORP3 | Vesa Olkonnen Lehto et al., 2005 | Plasmid to transiently express mCherry-ORP3 | |
| Transfected construct (H. sapiens) | Xpress tagged FFAT double mutant of ORP3 | Vesa Olkonnen Lehto et al., 2005 | Plasmid to transiently express ORP3∆FFAT | |
| Transfected construct (H. sapiens) | Xpress tagged PH domain mutant of ORP3 | Vesa Olkonnen Lehto et al., 2005 | Plasmid to transiently express ORP3∆PH | |
| Transfected construct (H. sapiens) | Xpress tagged ORP31-445 | Vesa Olkonnen Lehto et al., 2005 | Plasmid to transiently express ORP3 truncation mutant 1–445 | |
| Transfected construct (H. sapiens) | Xpress tagged ORP3398-886 | Vesa Olkonnen Lehto et al., 2005 | Plasmid to transiently express ORP3 truncation mutant 398–886 | |
| Transfected construct (H. sapiens) | Xpress tagged ORP31-555 | Vesa Olkonnen Lehto et al., 2005 | Plasmid to transiently express ORP3 truncation mutant 1–555 | |
| Transfected construct (H. sapiens) | GFP-Paxillin | Rick Horwitz (Allen Research Institute, Seattle, WA) | Plasmid to transiently express GFP-paxillin | |
| Transfected construct (H. sapiens) | DsRed-Paxillin | Rick Horwitz (Allen Research Institute, Seattle, WA) | Plasmid to transiently express DsRed-paxillin | |
| Transfected construct (H. sapiens) | mCherry-STIM1 and | Isabelle Derre (University of Virginia) | Plasmid to transiently express mCherry-STIM1 | |
| Transfected construct (H. sapiens) | YFP-VAP-A | Isabelle Derre (University of Virginia) | Plasmid to transiently express YFP-VAP-A | |
| Transfected construct (H. sapiens) | mCherry-CRY2-5-PtaseOCRL and | Olaf Idevall-Hagren (Uppsala University, Sweden) Idevall-Hagren et al., 2012 | Plasmid for optogenetic activation of OCRL | |
| Transfected construct (H. sapiens) | CINB-CAAX | Olaf Idevall-Hagren Idevall-Hagren et al., 2012 | Plasmid for optogenetic activation of OCRL | |
| Transfected construct (L. pneumophila) | GFP-P4M2X | Tamas Balla (NIH, Bethesda, Maryland) Hammond et al., 2014 | Biosensor for PI4P | |
| Transfected construct (H. sapiens) | GFP- E-Syt1 | Pietro De Camilli (Yale Univ. New Haven, CT) | Plasmid to transiently express GFP-E-Syt1 | |
| Transfected construct (H. sapiens) | GFP-PLCδ | David Castle (Univ. Virginia) | Biosensor for PI(4,5)P2 | |
| Antibody | mouse monoclonal antibody to HA (16B12) | Biolegend (San Diego, CA) | WB (1:1000) | |
| Antibody | rabbit polyclonal to GFP | ThermoFisher Scientific (Rockford, Il) | (A10262) | WB (1:2000) |
| Antibody | Mouse monoclonal anti-Xpress | ThermoFisher Scientific (Rockford, Il) | (R910-25) | WB (1:1000) |
| Antibody | Rabbit polyclonal antibody to mCherry | Biovision (San Francisco, CA) | (5993) | WB (1:1000) |
| Antibody | Mouse monoclonal antibody to tubulin | Sigma-Aldrich | (T9026) | WB(1:10,000) |
| Antibody | mouse monoclonal antibody to vinculin | Sigma-Aldrich | (V9131) | IIF (1:400) |
| Antibody | Mouse monoclonal antibody to human β1-integrin | BD Biosciences (Mississauga, ON, Canada) | (610467) | IIF (1:250) |
| Antibody | mouse antibody to GFP | Santa Cruz | (sc-9996) | WB (1:1000) |
| Antibody | mouse antibody to ORP3 | Santa Cruz | (sc-514097) | WB (1:1000) |
| Antibody | rabbit antibody to FAK | Santa Cruz | (sc-557) | IIF (1:100) |
| Antibody | Alexa Fluor 488 donkey anti-mouse secondary antibody | ThermoFisher Scientific (Rockford, Il) | (A10037) | IIF (1:500) |
| Antibody | Alexa Fluor 568 donkey anti-mouse secondary antibody | ThermoFisher Scientific (Rockford, Il) | (A21202) | IIF (1:500) |
| Antibody | Alexa Fluor 488 donkey anti-rabbit secondary antibody | ThermoFisher Scientific (Rockford, Il) | (A10042) | IIF (1:500) |
| Antibody | Alexa Fluor 568 donkey anti-rabbit secondary antibody | ThermoFisher Scientific (Rockford, Il) | (A21206) | IIF (1:500) |
| Antibody | IRDye 800CW Secondary Antibody | Li-COR | WB (1:10,000) | |
| Antibody | IRDye 650 Secondary Antibody | Li-COR | WB (1:10,000) | |
| Chemical compound, drug | Alexa Flour 647 phalloidin | ThermoFisher Scientific (Rockford, Il) | (A22287) | Dilution of 1:1000 |
| Chemical compound, drug | Thapsigargin | Tocris (Bristol, UK) | (1138) | 1 µM |
| Chemical compound, drug | Phorbol 12-myristate 13-acetate (PMA) | Tocris (Bristol, UK) | (1201/1) | 2.5 µM |
| Chemical compound, drug | YM 58483 (BTP2) | Tocris (Bristol, UK) | (3939/10) | 25 µM |
| Chemical compound, drug | Gö6983 | Abcam (Cambridge, UK) | (ab144414) | 20 µM |
| Commercial assay or kit | Odyssey PBS Blocking Buffer | Li-COR | For immunoblotting 1:1 diluted in PBST (0.1% tween-20) | |
| Commercial assay or kit | Q5 Site-Directed Mutagenesis Kit | NEB | ||
| Software, algorithm | NEBaseChanger | NEB | Software to design primers for site-directed mutagenesis | |
| Other | GFP-TRAP_A beads | Chromotek (Germany) | gta-10 | For precipitation of GFP-tagged proteins (25 µl of beads) |
| Other | Protein A Beads | (Cell Signalling, Danvers, MA) | (9863) | For immunoprecipitation (25 µl of bead) |
Additional files
Download links
A two-part list of links to download the article, or parts of the article, in various formats.
Downloads (link to download the article as PDF)
Open citations (links to open the citations from this article in various online reference manager services)
Cite this article (links to download the citations from this article in formats compatible with various reference manager tools)
Calcium-stimulated disassembly of focal adhesions mediated by an ORP3/IQSec1 complex
eLife 9:e54113.
https://doi.org/10.7554/eLife.54113


