The landscape of coadaptation in Vibrio parahaemolyticus
- State Key Laboratory of Pathogen and Biosecurity, Beijing Institute of Microbiology and Epidemiology, China
- Shenzhen Centre for Disease Control and Prevention, China
- School of Public Health, Shanghai Jiao Tong University School of Medicine, China
- Institute for Nutritional Sciences, Chinese Academy of Sciences, China
- The Center for Microbes, Development and Health, Key Laboratory of Molecular Virology and Immunology, Institut Pasteur of Shanghai, Chinese Academy of Sciences, China
Figures
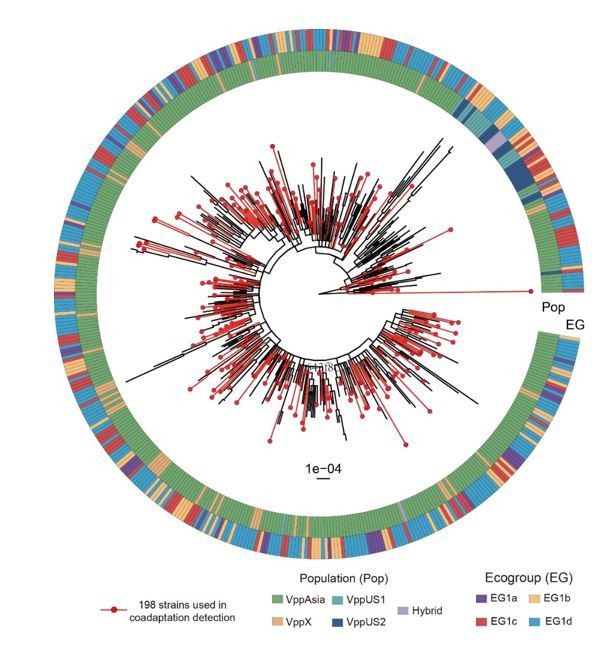
Figure 1 with 1 supplement

Neighbor-joining (NJ) trees and principle coordination analysis (PCoA) of 469 non-redundant dataset and 198 strain discovery dataset.
(a, c) NJ trees of strains from two datasets. Red branches indicate strains in the discovery dataset. The colored circles indicate populations (inner) and ecogroups (outer) according to the legend on the left. (b, d) PCoA analysis of strains from two datasets based on core SNPs and accessory genes. Colors of points indicate the populations and ecogroups according to the legend on the right. Two distinct genotype clusters separated by O-3 variants were highlighted with dashed ellipses.
Figure 1—figure supplement 1

fineSTRUCTURE showing no clonal frame in the discovery dataset of 198 VppAsia isolates.
Coancestry matrix of 201 strains, including the discovery dataset of 198 strains and three isolates respectively from VppX, VppUS1 and VppUS2. The color of each cell indicates the expected chunks numbers imported from a donor (column) to a recipient (row).
Figure 2
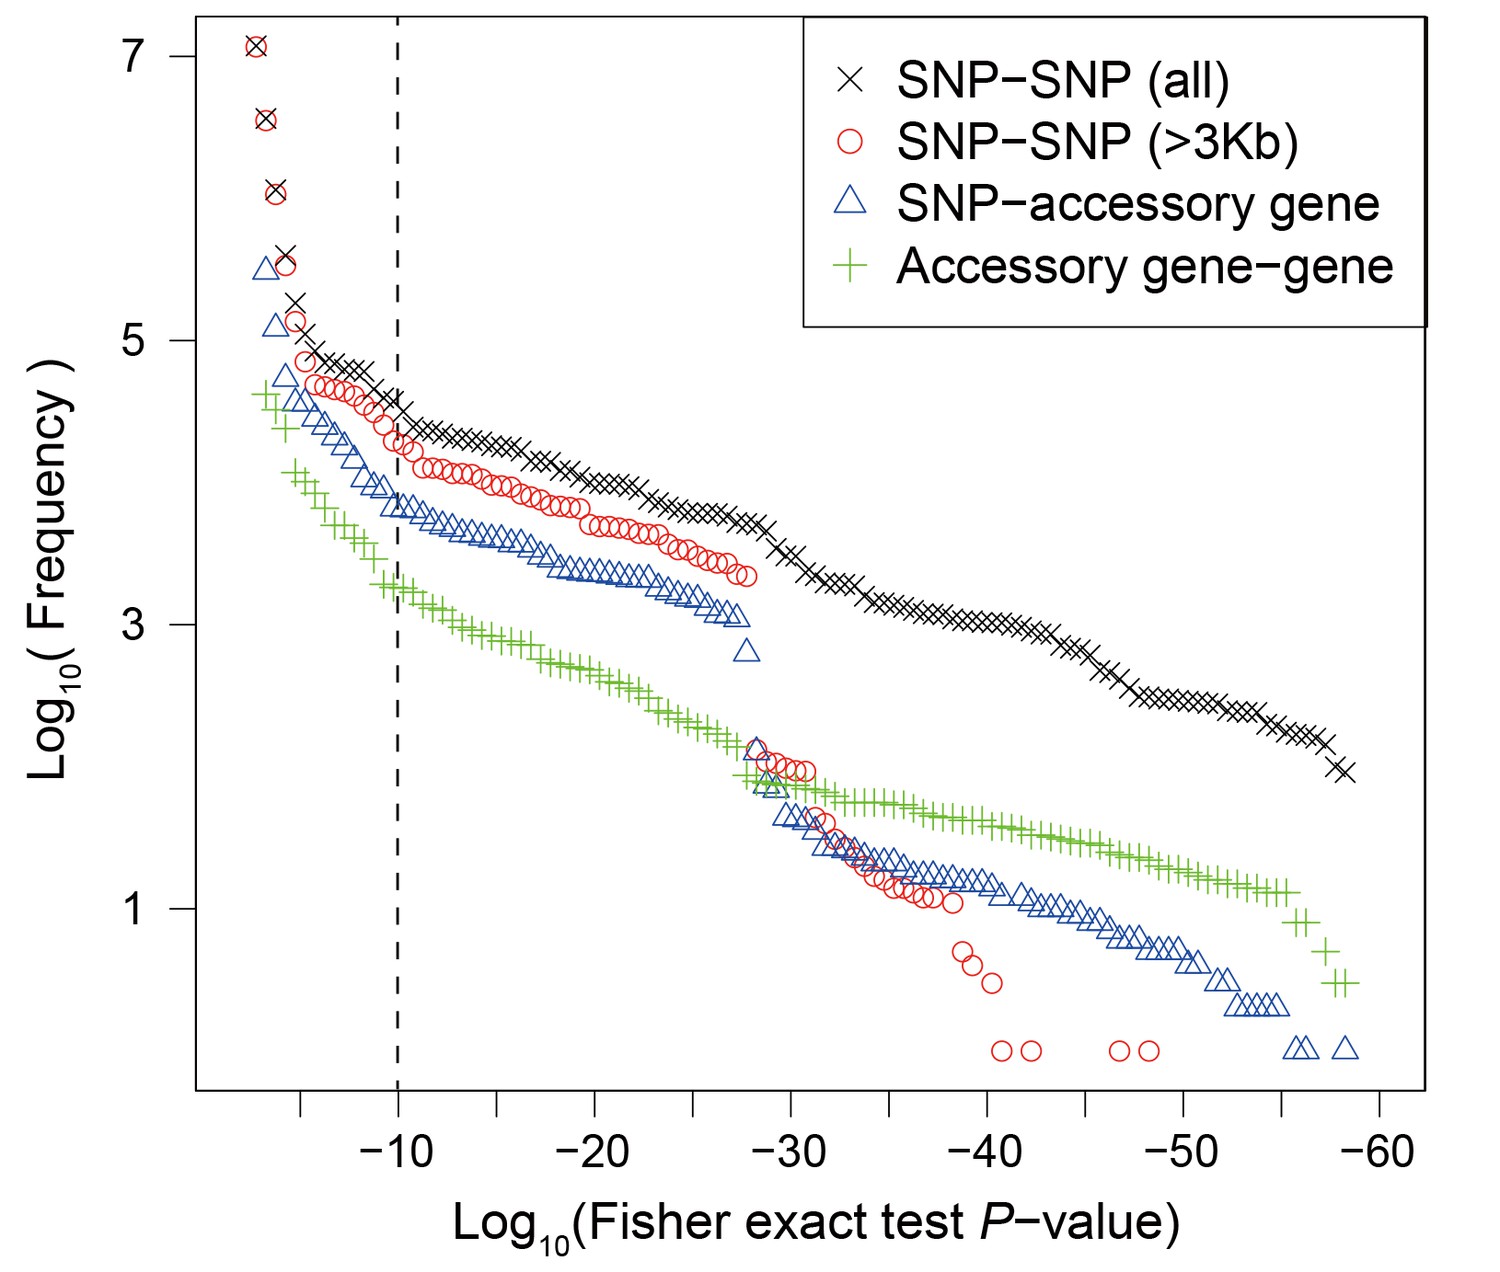
Frequency distribution of Fisher exact test P values between genetic variants.
Colors and shapes indicate the interactions between different types of variants. The vertical dotted line shows the threshold p=10−10.
Figure 3 with 3 supplements
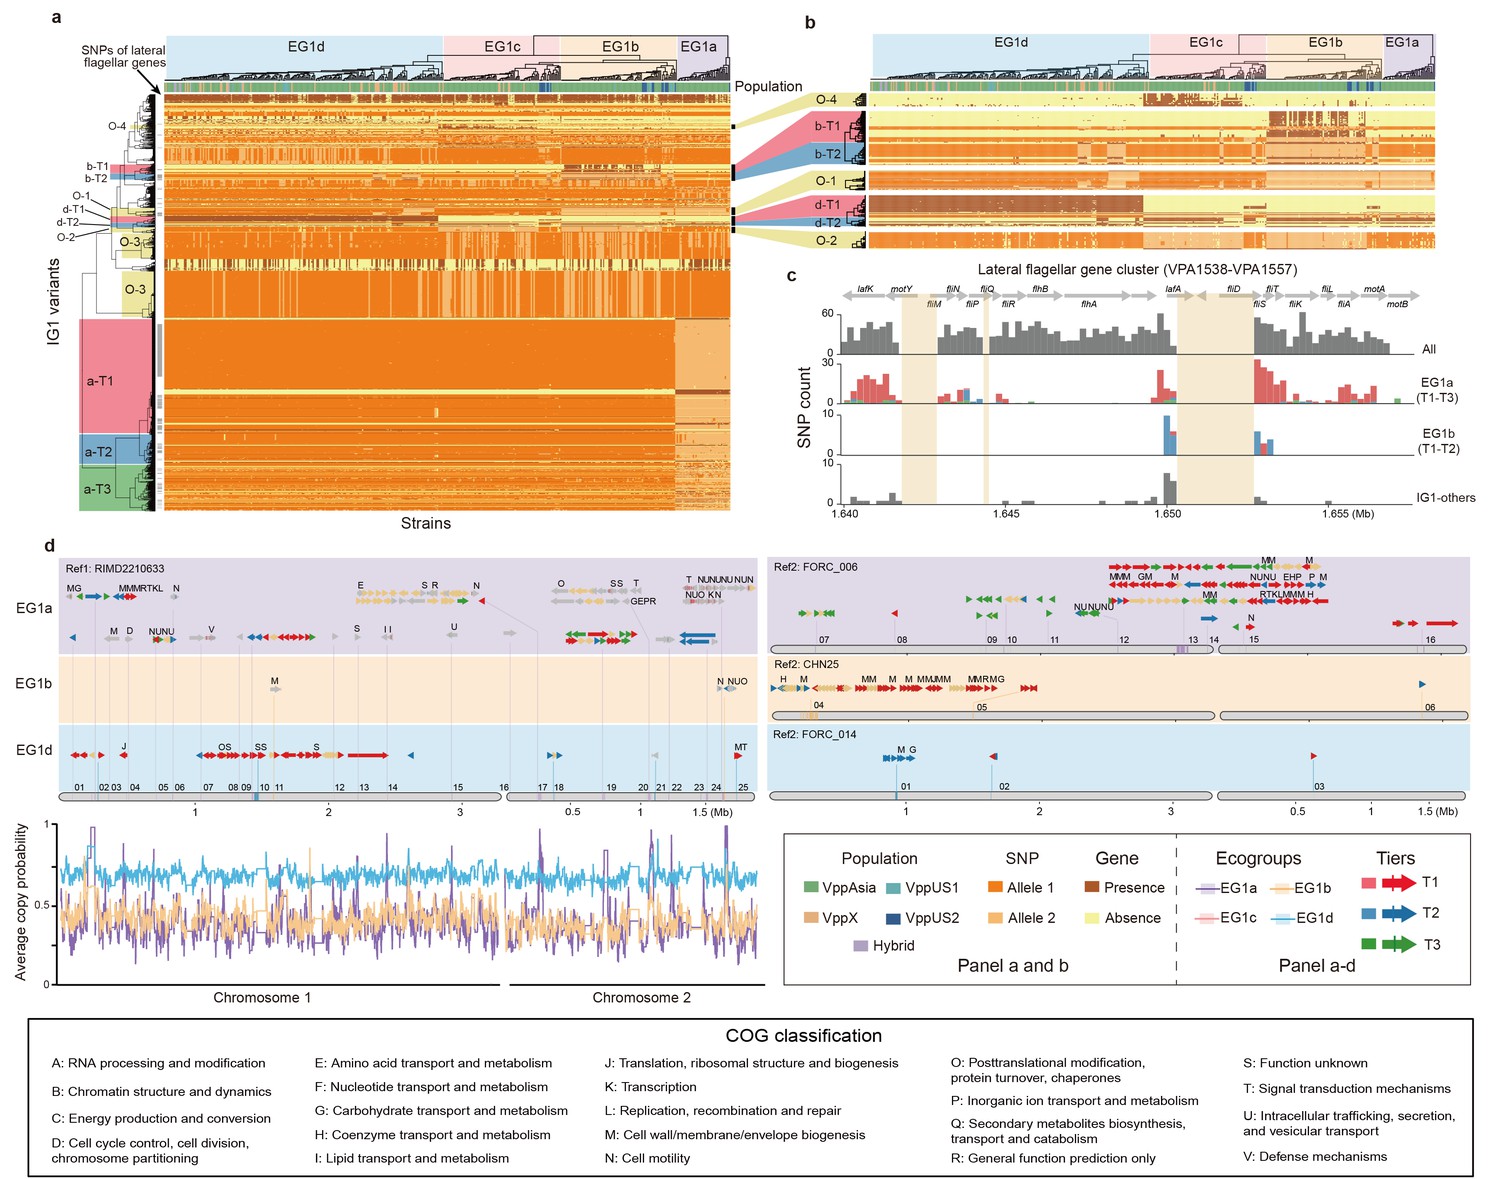
The largest interaction group (IG1) in V. parahaemolyticus.
(a, b) Hierarchical clustering of 469 non-redundant strains (columns) based on coadaptated loci (rows) of IG1. Colors of the heatmap indicate the status of genetic variants as shown in the legend (bottom right), background colors of the upper and left clustering tree separately indicate different ecogroups (EG) and tiers, respectively, matching the colors in panel b-d. Colored bars below the upper clustering tree indicate the populations of strains. SNPs of lateral flagellar genes were marked by grey bars on the left of the heatmap. Panel b is a zoom-in version of specific tiers in panel a. (c) The distribution of coadaptation SNPs in the lateral flagellar gene cluster region (VPA1538-1557). The top indicates the gene organization of lateral flagellar gene cluster. Light orange rectangles indicate regions in the accessory genome. The histograms indicate the distribution of SNPs along the gene cluster, with colors of bars indicating coadaptation tiers. (d) Coadaptation blocks of IG1, shown in their genomic locations. Four different reference genomes were used, as indicated on the top of each panel, since no single genome contains all of the accessory genome variants. Grey horizontal arrows indicate core genes. Accessory genes are colored according to their tier or are tan if they do not belong to one. Vertical colored bars within grey arrows indicate core-SNPs in IG1, with colors indicating different coadaptation tiers. COG classification labels are shown above the genes. The numerical labels above reference genomes indicate the identity of the coadaptation genome blocks, corresponding to the information in Supplementary file 1. Colors of bottom left curves indicate the average copying probability (probability of genetic variants inherited from the same ecogroup) of different EGs calculated using chromosome painting.
Figure 3—figure supplement 1
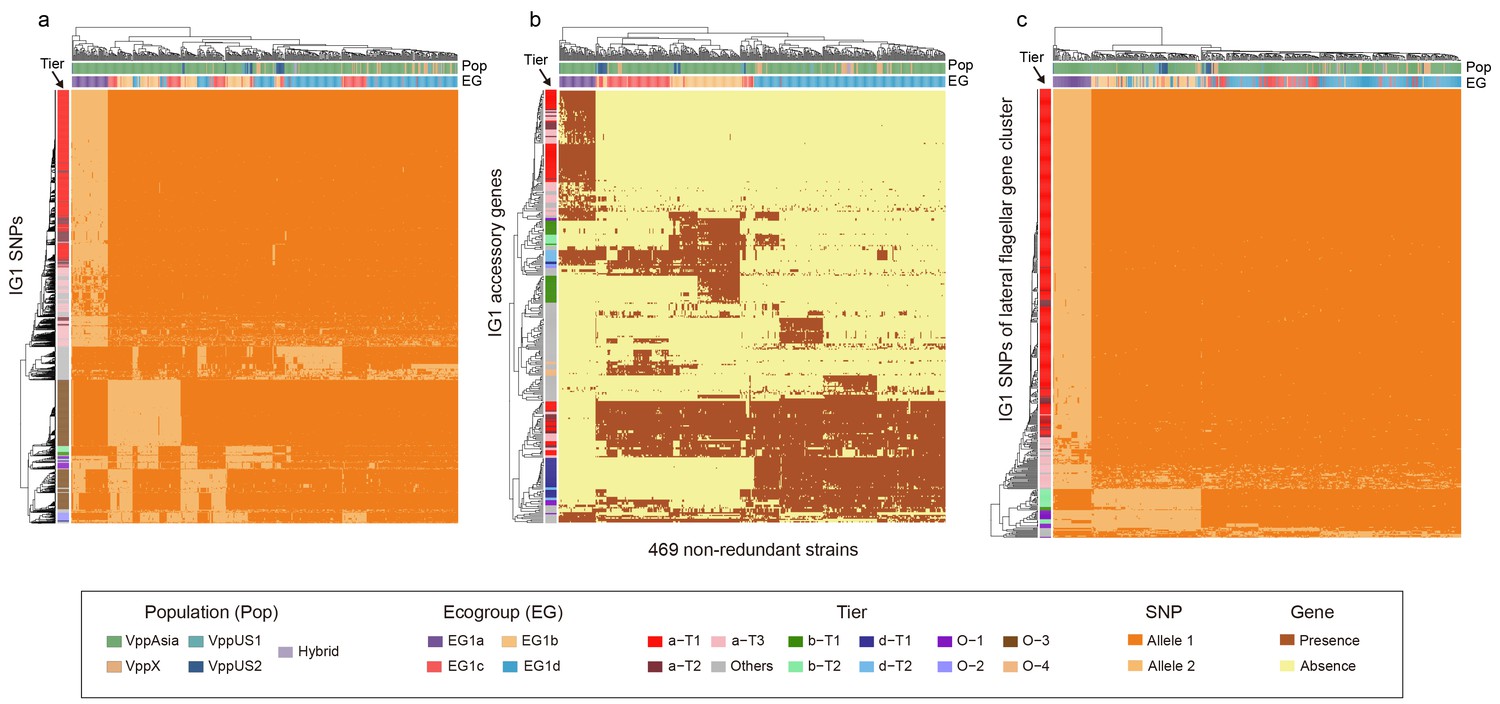
Hierarchical clustering of 469 non-redundant strains (columns) based on different subsets of IG1 variants (rows).
(a) Core SNPs. (b) Accessory genes. (c) SNPs of lateral flagellar gene cluster. Colors of the heatmap indicate the status of genetic variants, colored bars below the upper clustering tree indicate the populations and ecogroups of strains, and colored bars on the left indicate different coadaptation ties as shown in the legend (bottom).
Figure 3—figure supplement 2
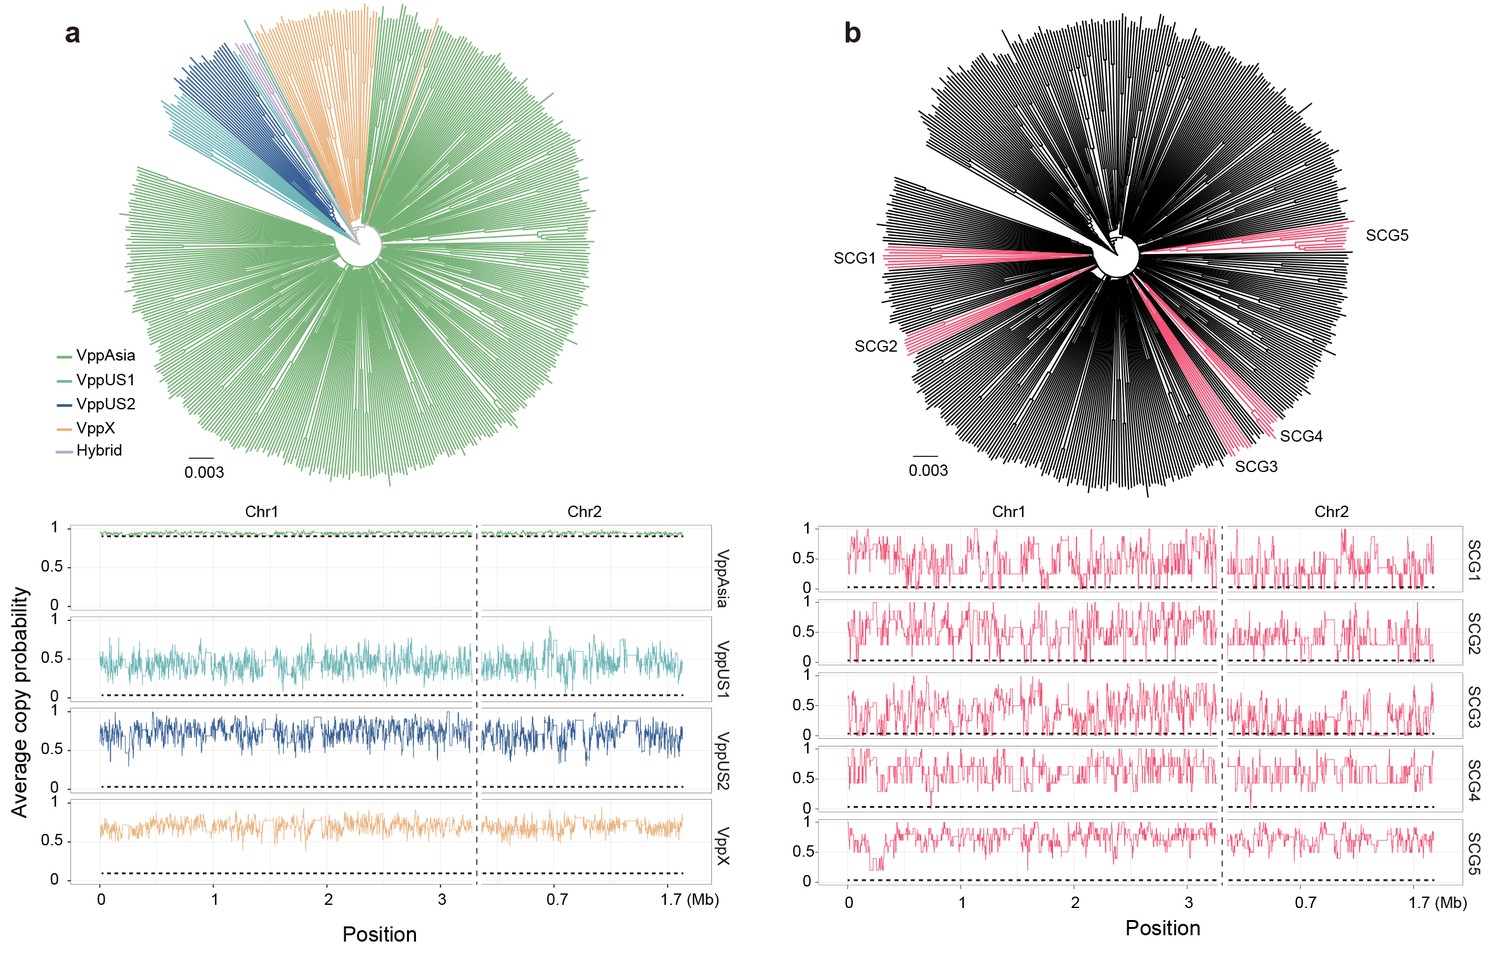
Neighbor-joining trees (top) and average copy probability value distributions (bottom) of geographical populations (a) and semi-clonal group (SCG) strains (b) of V. parahaemolyticus.
Branch colors of the trees indicate populations (a) and SCGs (b), respectively. Horizontal dotted line indicates the expected average copy probability value. Different chromosomes are separated by a vertical dotted line.
Figure 3—figure supplement 3

NJ tree of lateral flagellar gene cluster region (VPA1538-1557) in Vibrio genus.
Three randomly selected strains of EG1a and NonEG1a are used and marked in blue and red, respectively.
Figure 4
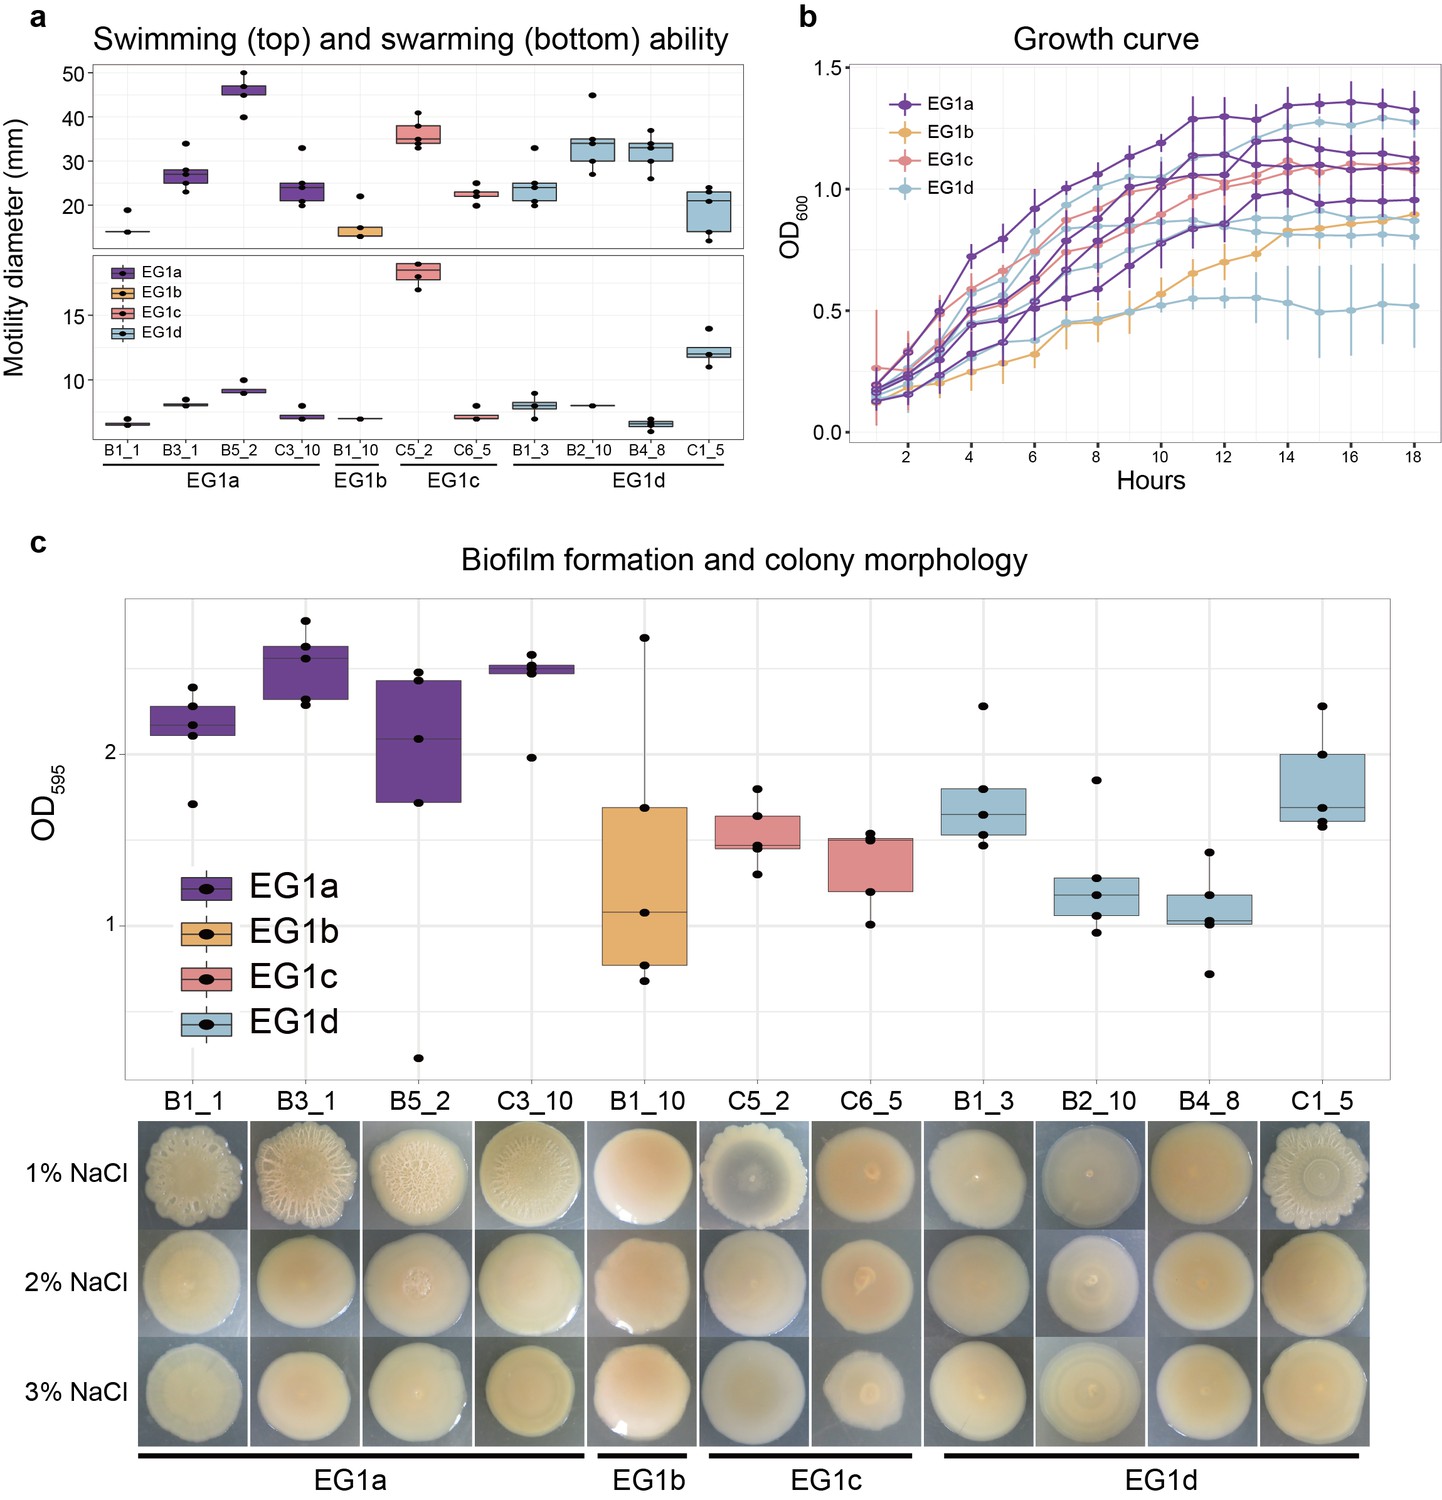
Phenotypes of strains from different EGs.
(a) Swimming (top) and swarming (bottom) ability of strains in different ecogroups. Motility diameters in swimming and swarming plate were used to measure the motility ability. (b) Growth curve of strains in different ecogroups. The average optical density at 600 nm (OD600) of five replicates were used to generate the curve, vertical lines indicate the standard deviation. (c) Biofilm formation (top) and colony morphology (bottom). OD595 values were used to measure the biofilm formation ability. Colony morphologies of strains at different salinities were shown on the bottom. In panel a-c, five replicates were performed for each strain, and colors indicate different ecogroups.
Figure 5 with 1 supplement
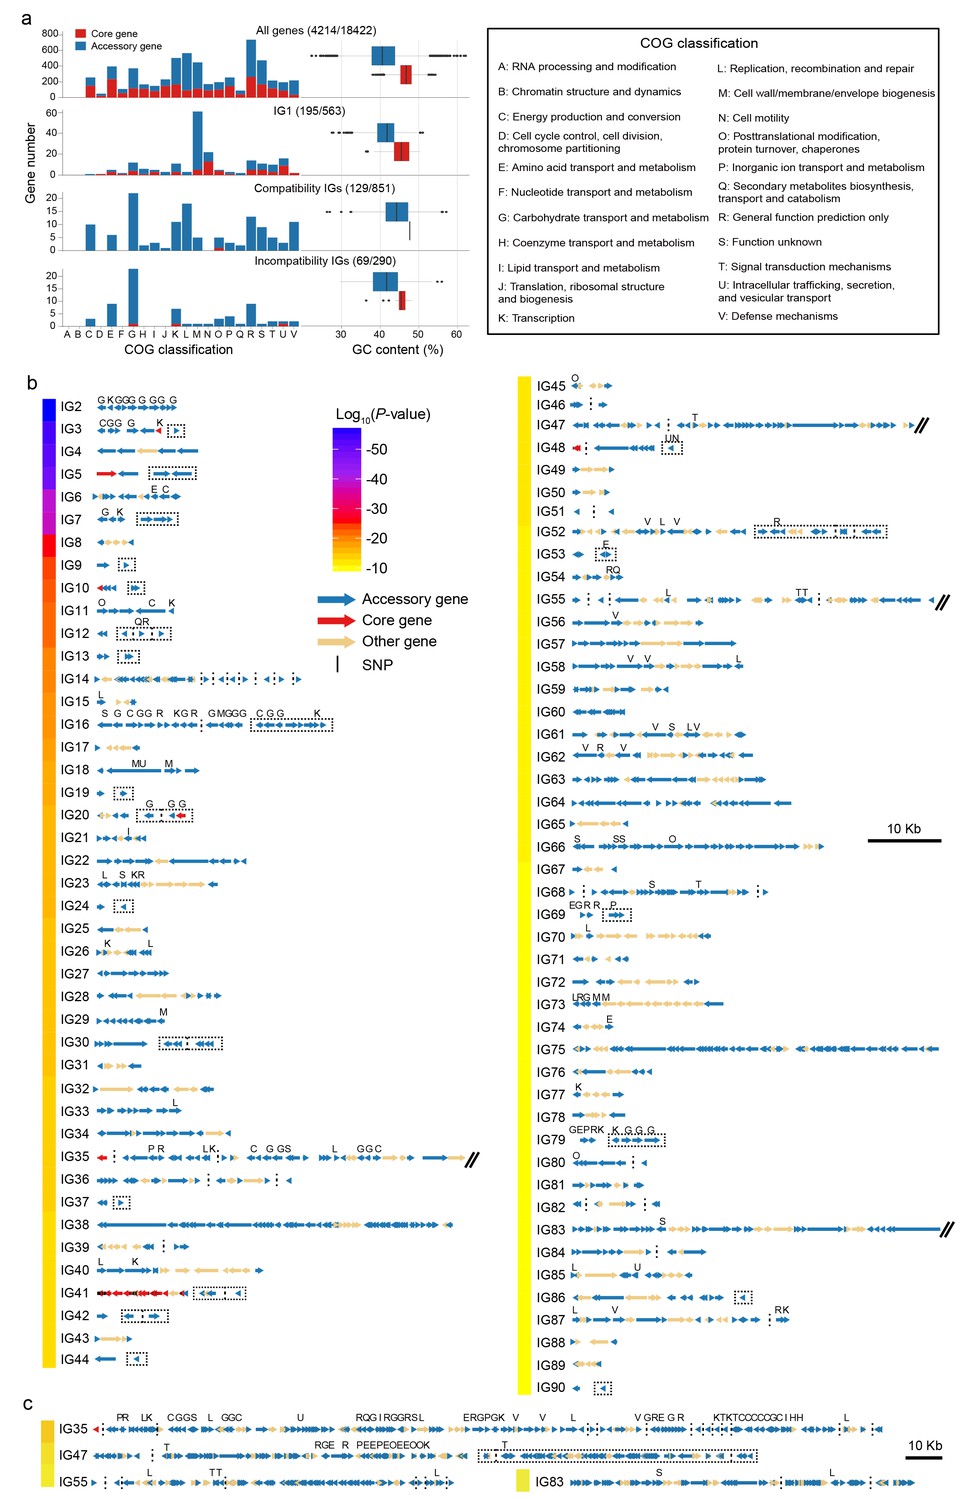
Characteristics of detected interaction groups.
(a) COG classification and GC content of all analyzed genes (top panel) and of different types of coadaptated genes (lower panels). Red for core genes and blue for accessory genes. The first number in brackets is the number of genes with COG annotation and the second is the total number of genes in the category. (b) Gene maps of different IGs. The colors of the bar on the left indicates average linkage strength of the loci in each IG. Arrows indicate genes. Acessory genes are shown in blue and genes with no coadaptation signal are shown in orange. Red genes indicated core genes containing coadapted SNPs which are indicated with black vertical lines. Vertical dotted lines were used to split compatible genes with physical distance larger than 3 kb, or genes located in different contigs, chromosomes and strains. Dotted rectangles indicate incompatible genes. IGs with genome block length larger than 60 kb are broken by double slash and shown in (c) after zooming out. COG classification labels are shown above the genes.
Figure 5—figure supplement 1

Clustering of 469 strains based on variations of IG2-90.
Hierarchical clustering of strains (column) based on coadaptation loci (row) of all IGs, except for IG1, 2, 3, 14, and 42 that had been showed in figures of the main text. Colors of the heatmap indicate the status of genetic variants, colored bars below the upper clustering tree indicate the populations of strains as shown in the legend.
Figure 6
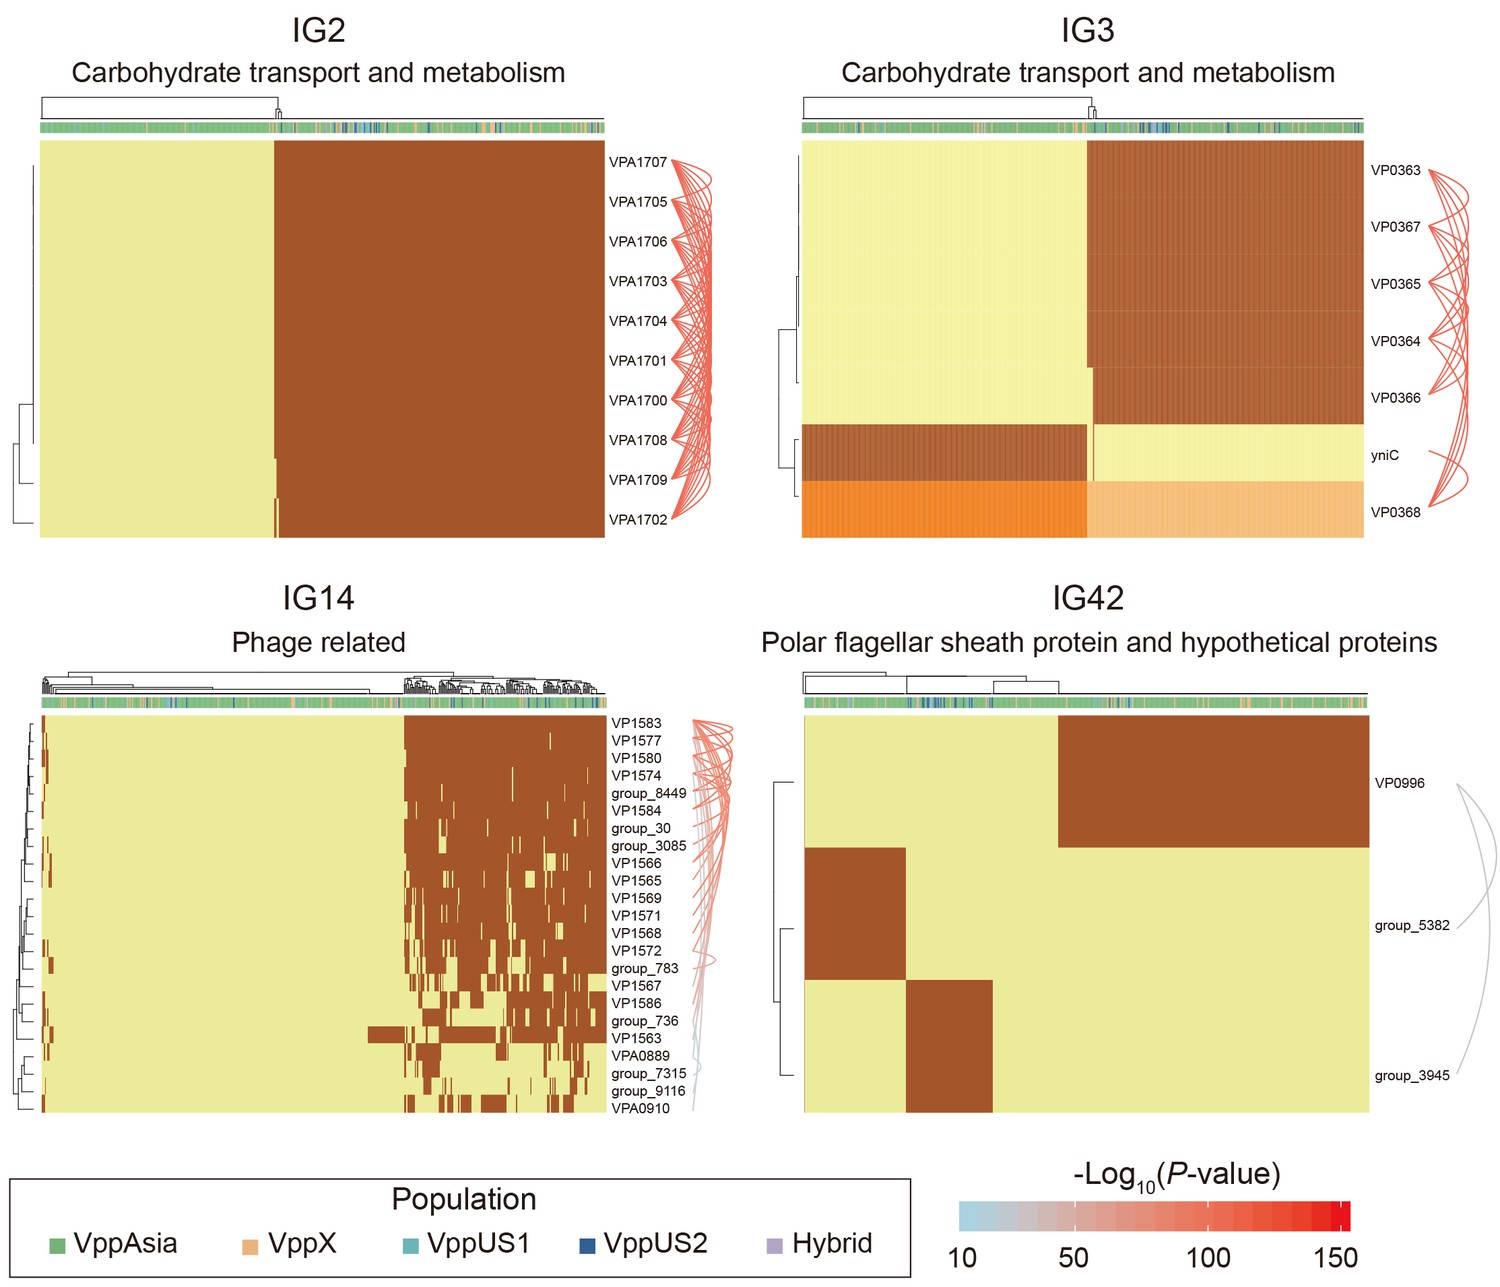
Four representative interaction groups.
Hierarchical clustering of 469 non-redundant strains (columns) based on coadaptation loci (rows) of 4 representative IGs. Colors of the heatmap indicate the status of genetic variants, with light orange/orange for two alleles of a SNP, light yellow/brown for absence and presence of the accessory genes. Bar colors below the upper tree indicate the populations of strains according to the legend. A summary of the function of the involved genes is shown on the top of each heatmap. Arcs on the right indicate the causal links after ARACNE filtering, colors and the width of the arcs scale with the P values.
Figure 7 with 1 supplement
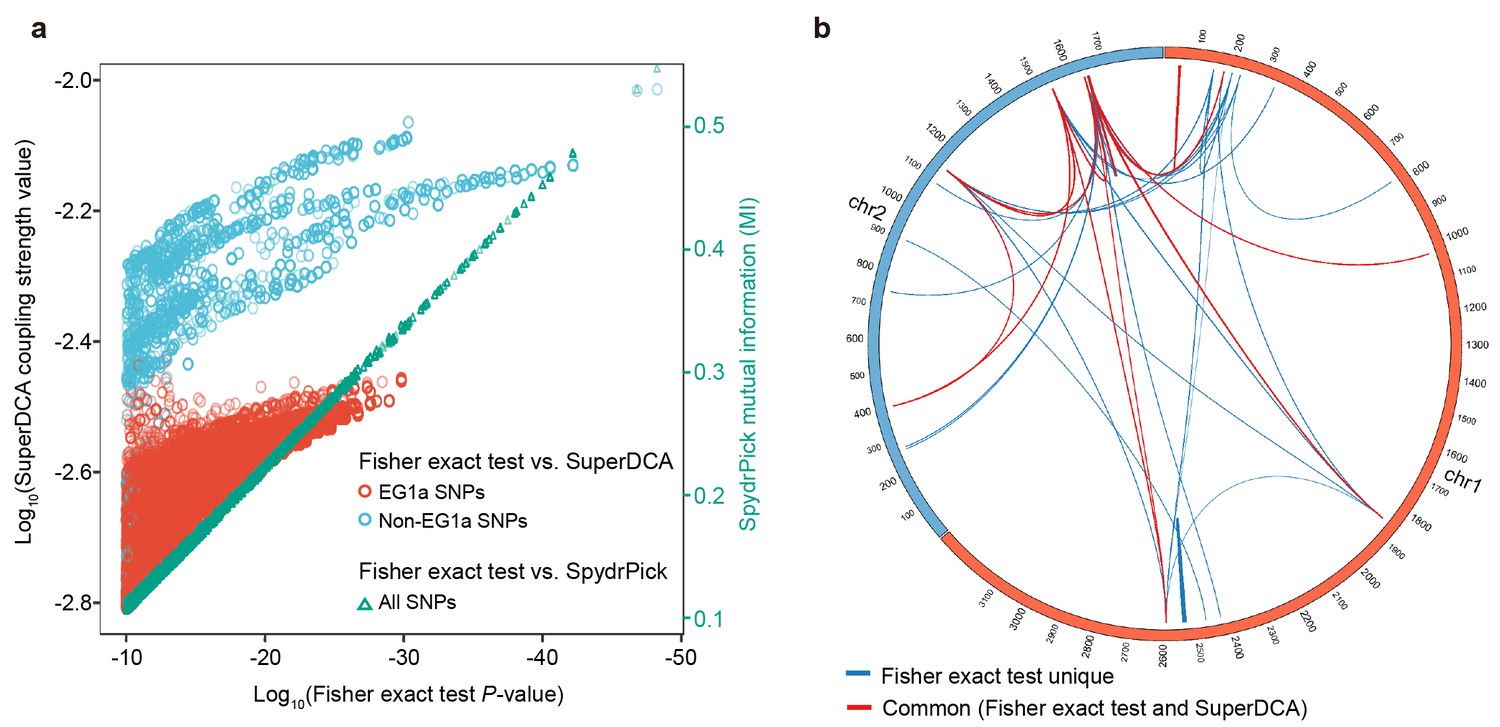
Comparison with other epistasis detection methods.
(a) Correlation between Fisher exact test P value and SuperDCA coupling strength (red and blue for ecogroup 1a (EG1a) and non-EG1a SNPs, respectively), and between Fisher exact test P value and SpydrPick mutual information (green). (b) Overlap of strong linked SNP sites detected by Fisher exact test (p<10−10, excluding EG1a SNPs) and SuperDCA (coupling strength >10-2.2). Red for interacted SNP pairs detected by both methods, blue for SNP pairs detected only by Fisher exact test.
Figure 7—figure supplement 1

EG1a interactions that only detected by Fisher exact test.
Figure 8
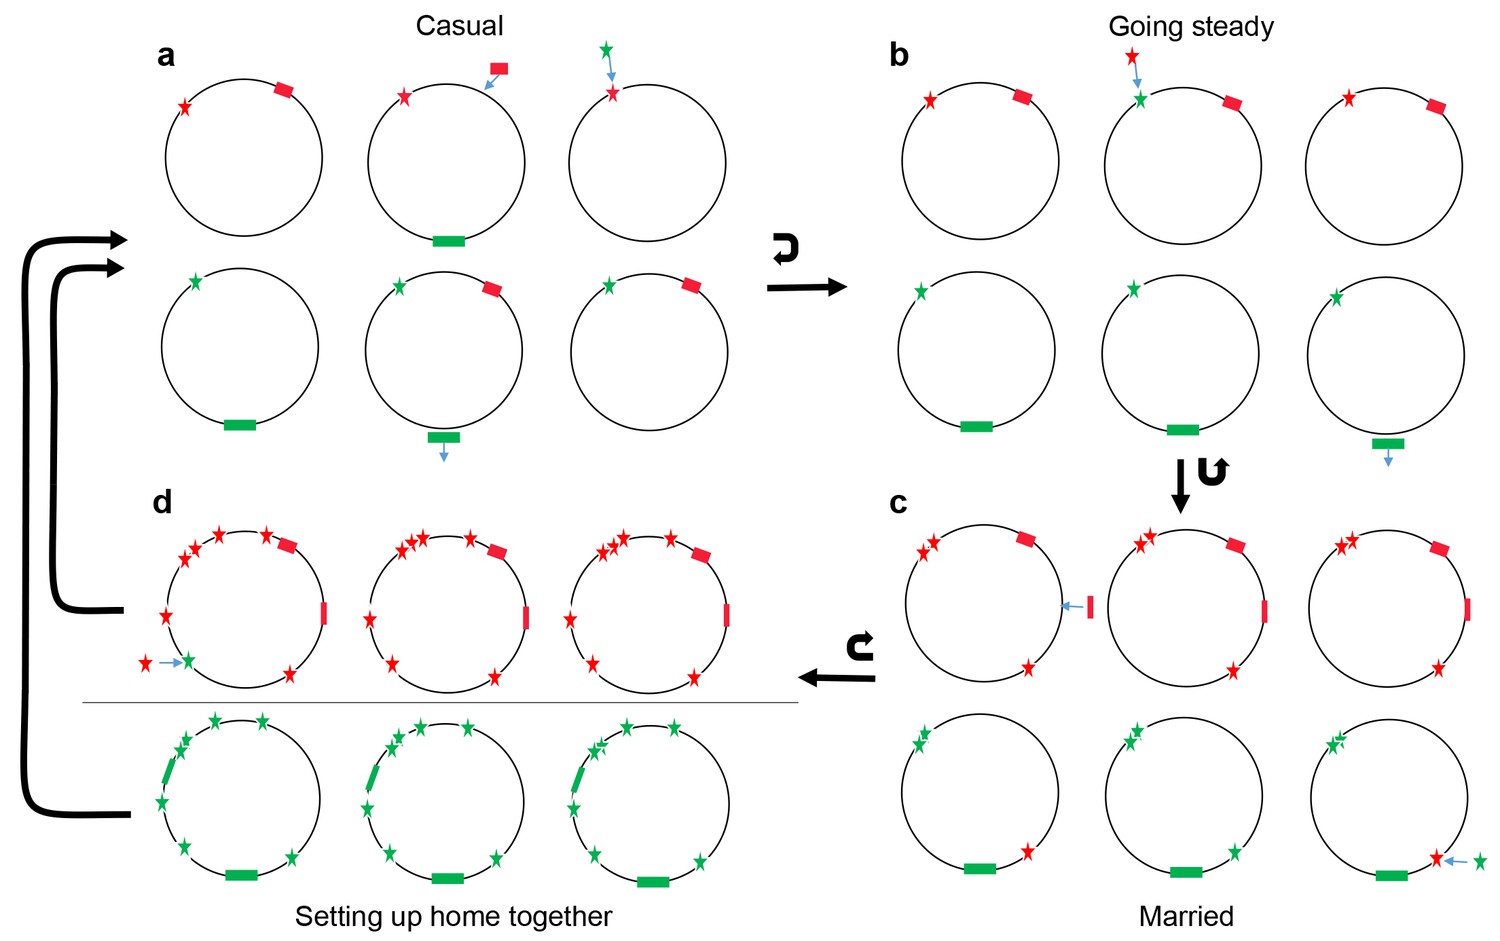
Conceptual model of four stages of coadaptation, analogous to human relationships.
Circles indicate bacterial strains within a population. Red and green stars indicate the two alleles of a SNP. Red and green rectangles indicate different accessory genes or genome islands. Blue arrows indicate transitions between different SNP alleles, or gain/loss of genes and genome islands. Black arrows indicate the transitions between different stages, or cycles within a stage. (a) Casual: frequent gene flow generated multiple combinations of different variants within a population. Some combinations might have high fitness but alternate combinations arise frequently due to gene flux and adaptation at individual loci. (b) Going steady: coadapted interactions, such as the SNPs (red star) and accessory gene (red rectangles), become more difficult to dislodge despite ongoing genetic exchange due to their high fitness when present in combination. (c) Married: coadapted interactions become fixed in the population and led to further co-adaptation in multiple genome regions. (d) Setting up home together: as the progressive enlargement of coadapted regions in the genome, the entire genome becomes differentiated, which prompt the barriers (horizontal line) to genetic exchange between different ecogroups.
Author response image 1
Maximum likelihood tree of 469 non-redundant strains based on 53 concatenated ribosomal gene nucleotide sequences.
Red branches indicate strains in the discovery dataset. The colored circles indicate populations (inner) and ecogroups (outer) according to the legend.
Tables
Table 1
Summary of interactions detected in coadaptation screen.
| Total number | IG1 | IG2-90 | |||
|---|---|---|---|---|---|
| Number | Fraction | Number | Fraction | ||
| SNP-SNP pair | 2.3 × 10¹⁰ | 289186 | 0.00% | 22751 | 0.00% |
| SNP-Accessory gene pair | 2.2 × 10⁹ | 113973 | 0.01% | 1188 | 0.00% |
| Accessory gene-gene pair | 2.1 × 10⁸ | 13487 | 0.01% | 12264 | 0.01% |
| SNP | 151957 | 1540 | 1.01% | 333 | 0.22% |
| Synonymous (Syn) | 117541 | 1084 | 0.92% | 226 | 0.19% |
| Nonsynonymous (NonSyn) | 23673 | 379 | 1.60% | 107 | 0.45% |
| NonSyn/Syn | 0.2 | 0.35 | 0.47 | ||
| Core gene | 3936 | 82 | 2.25% | 18 | 0.56% |
| Accessory gene | 14486 | 338 | 2.33% | 1122 | 7.75% |
Table 2
Summary of interaction group 1 variants.
| Tier | Core SNPs | Accessory genes |
|---|---|---|
| a-T1 | 520 SNPs (359 Syn, 137 NonSyn) in 21 genes of 8 blocks, 14 genes encoding lateral flagellar | 66 genes in 10 blocks, 11 COG M genes, 5 T2SS genes |
| a-T2 | 121 SNPs (68 Syn, 43 NonSyn) in 18 genes of 10 blocks, 10 genes encoding lateral flagellar | 22 genes in 10 blocks, 2 COG M genes, 3 T2SS genes |
| a-T3 | 190 SNPs (137 Syn, 38 NonSyn) in 44 genes of 18 blocks, 17 genes encoding lateral flagellar | 46 genes in 13 blocks, 5 COG M genes, 3 COG NU genes, 4 T2SS genes |
| b-T1 | 12 SNPs (5 Syn, 2 NonSyn) lin 3 genes of 2 blocks, 2 genes encoding lateral flagellar | 33 genes in 2 blocks, 12 COG M genes |
| b-T2 | 25 SNPs (15 Syn, 10 NonSyn) in 3 genes of 1 block encoding lateral flagellar | 8 genes in 2 blocks, 1 COG M gene |
| d-T1 | 5 SNPs (3 syn, 2 nonsyn) in 1 gene encoding transmembrane | 31 genes in 5 blocks, 23 genes (1 block) encoding T6SS |
| d-T2 | 0 SNP | 14 genes in 4 blocks, 8 genes (1 block) encoding cellulose synthase |
| O-1 | 36 SNPs (28 Syn, 10 NonSyn) in 3 genes of 2 blocks, 2 genes encoding lateral flagellar, 1 TonB gene | 6 genes in 4 blocks, 1 COG H gene |
| O-2 | 27 SNPs (18 Syn, 1 NonSyn) in 3 genes in 1 block, 2 genes encoding LuxR family transcriptional regulator | 2 genes in 1 block, COG M and T |
| O-3 | 368 SNPs (269 Syn, 97 NonSyn) in 4 genes of 2 blocks, encoding multidrug resistance protein, lipase and long-chain fatty acid transport protein | 0 gene |
| O-4 | 0 SNP | 7 genes in 5 blocks, 4 genes encoding transferase |
| Others | 236 SNPs (182 Syn, 41 NonSyn) in 48 genes, 8 genes encoding lateral flagellar | 102 genes, 15 COG M genes |
Key resources table
Additional files
-
Supplementary file 1
Detailed information of coadaptation variants in IG1.
- https://cdn.elifesciences.org/articles/54136/elife-54136-supp1-v2.xlsx
-
Supplementary file 2
Detailed information of coadaptation variants in IG2-90.
- https://cdn.elifesciences.org/articles/54136/elife-54136-supp2-v2.xlsx
-
Transparent reporting form
- https://cdn.elifesciences.org/articles/54136/elife-54136-transrepform-v2.docx
Download links
A two-part list of links to download the article, or parts of the article, in various formats.
Downloads (link to download the article as PDF)
Open citations (links to open the citations from this article in various online reference manager services)
Cite this article (links to download the citations from this article in formats compatible with various reference manager tools)
The landscape of coadaptation in Vibrio parahaemolyticus
eLife 9:e54136.
https://doi.org/10.7554/eLife.54136


